Article

Usability Assessment of Augmented Reality Applications for Fluid Machinery Education

Department of Engineering, University of Palermo, Viale delle Scienze, 90128 Palermo, Italy
*
Author to whom correspondence should be addressed.
Educ. Sci. 2026, 16(9), 1414; https://doi.org/10.3390/educsci16091414
Submission received: 17 June 2026 / Revised: 17 August 2026 / Accepted: 27 August 2026 / Published: 1 September 2026

Abstract

This paper aims to evaluate the usability and user experience of ad hoc augmented reality systems in the learning experience of mechanical engineering students, focusing on fluid machinery education. Three mobile augmented reality applications were developed to support teachers in explaining the main parts of an impeller blade and its fluid interaction, integrating computer-aided design (CAD) models with velocity and pressure maps derived from computational fluid dynamics (CFD) simulations. By providing multiple means of representation, these tools were developed to support the explanation of complex 2D concepts without requiring specialized hardware. The obtained results revealed that the usability of the developed applications, assessed through the System Usability Scale (SUS), was remarkably effective. Furthermore, the User Experience Questionnaire (UEQ) showed that the average scores for each evaluation criterion were highly positive, especially in the “Stimulation” and “Novelty” areas. Accurate statistical analyses revealed that students’ feedback was not influenced by users’ familiarity with virtual and augmented reality tools. In conclusion, since no objective learning gains were evaluated, this investigation’s outcomes indicate that the developed applications provide an engaging tool with high usability and positive user experience, framing inclusive education as a fundamental design rationale rather than an empirically demonstrated outcome and laying the groundwork for future studies to objectively measure cognitive impact.

1. Introduction

In the last decade, the educational sector has experienced an increasing integration of digital tools, with a focus on immersive technologies such as augmented reality (AR) and virtual reality (VR). Consequently, teaching approaches in areas that require strong visual and interactive experiences are progressively turning towards the introduction of methodologies able to exploit the advantages offered by new immersive tools.
Although the first augmented reality devices date back to 1968, with Sutherland’s head-mounted three-dimensional display (Sutherland, 1968; Feiner, 1996), and 1974, with Krueger’s artificial reality laboratory called “Videoplace” (Krueger, 1985), the field remained virtually dormant until the mid-1990s (Aggarwal & Singhal, 2019). Since its first appearance, interaction with the world of education has shown great potential, especially in medical applications. One of the first AR systems designed exclusively for educational use was a tool for teaching dynamic three-dimensional anatomy, developed at the University of North Carolina and presented in the first International Conference on Computer Vision, Virtual Reality, and Robotics in Medicine, held in Nice in 1995 (Kancherla et al., 1995).
Fields that could benefit from the implementation of AR/VR technologies are diverse and span various levels of education; in high schools, for example, the variety of subjects provides a wide range of topics, such as geography or history.
For example, Koutromanos et al. (2020) created a digital game called “Clavis Aurea”, which aims to teach the history of Naxos, a Greek island, by using mobile devices for the augmented reality of historical monuments.
Masneri et al. (2024) developed the so-called “ARoundTheWorld” application, aimed at simplifying the study of geography in high schools. This work produced encouraging results by fulfilling the objectives identified by teachers as key elements for educational applications in augmented reality, laying the foundations for integrating similar applications into other courses.
In engineering teaching, most systems based on immersive technologies have been developed for interdisciplinary macro areas. For example, regarding electronics, several studies in recent years have shown that the benefits of these new technologies could be considerable; these include the study carried out by Álvarez-Marín et al. (2023) assisting the efforts of the Physics and Industrial Engineering departments of the University of La Serena (Chile) and the Computer Science and Statistics department of Madrid (Spain), which provided excellent results concerning the use of the so-called “INGAR DC Analysis” application for explaining the functioning of electrical circuits.
Belonging to the same area, the study carried out by Singh and Ahmad (2024) from the Universities of Chitkara (India) and Cardiff (Wales) investigated, through the development of the so-called “ARLE” app on Unity 3D, the possibility of reproducing laboratory instruments, such as an oscilloscope, in an augmented reality environment, involving explanations activated through on-screen buttons. Again, the results in teaching seemed to be highly satisfactory.
As further proof of the wide range of application fields that can be investigated, Pinter and Siddiqui (2024) demonstrated the usefulness of augmented reality applications that facilitate the explanation of certain topics related to the area of scientific computing, such as the advanced visualization of solids of revolution.
In the field of mechanics, studies relating to the introduction of augmented/virtual reality systems converge more in the disciplines of the industrial design macro area. With respect to this topic, studies conducted in different parts of the world, from Europe to Asia, converge on the usefulness of new technologies for teaching. Gattullo et al. (2022) evaluated in detail the benefits and usability of an augmented reality application capable of supporting students in understanding complex machine drawings without physically being in the laboratory. The study presents a step-by-step design methodology and the framework used for a case study in an engineering course. Similarly, both Qu et al. (2022) and Messina et al. (2026) agree on the validity of introducing augmented reality applications into educational activities aimed at explaining industrial design subjects.
It is noticeable that such teachings generally belong to the first years’ subjects, while the spread of this kind of application in more sectoral areas, such as certain mechanical engineering subjects, is far from widespread.
In the context of inclusive science education, immersive technologies offer a good opportunity to reduce specific learning barriers, as traditional 2D representations of complex 3D phenomena often disadvantage students with varying spatial reasoning skills (Sun et al., 2019; Grannum et al., 2024). By providing multiple means of representation, in accordance with Universal Design for Learning (UDL) principles, AR can support diverse learners and improve overall accessibility to challenging engineering concepts (CAST, 2024; Toto et al., 2024).
This work aims to investigate whether an ad hoc AR-based system can improve students’ learning experience in the context of advanced mechanical engineering concepts.
Nowadays, the analysis of systems involving fluid flow is typically performed through computational fluid dynamics (CFD) techniques, but, despite the development of easier software packages implementing CFD technologies, their adoption in academic studies can still be hard to comprehend for inexperienced users (Desmond et al., 2014; Cirello et al., 2018; Solmaz & Van Gerven, 2022).
The use of virtual and augmented reality in conjunction with CFD simulations has significantly increased over the last decade (Teutscher et al., 2022; Mourtzis et al., 2022). For instance, Lin et al. (2019) proposed an integrated approach to AR-based CFD visualization of the indoor thermal environment on mobile devices. Kim et al. (2021) developed a VR simulator to visualize the aerodynamic environment in a greenhouse, to help educate farmers and consultants. In the context of engineering education, Solmaz et al. (2024a) assessed the perception and user assessment of a VR environment integrated with CFD simulations. Similarly, Amouzgar and Mousavi (2025) developed an extended reality (XR) tool named “HoloMech” to support learning and teaching of stress and deformation in beam structures.
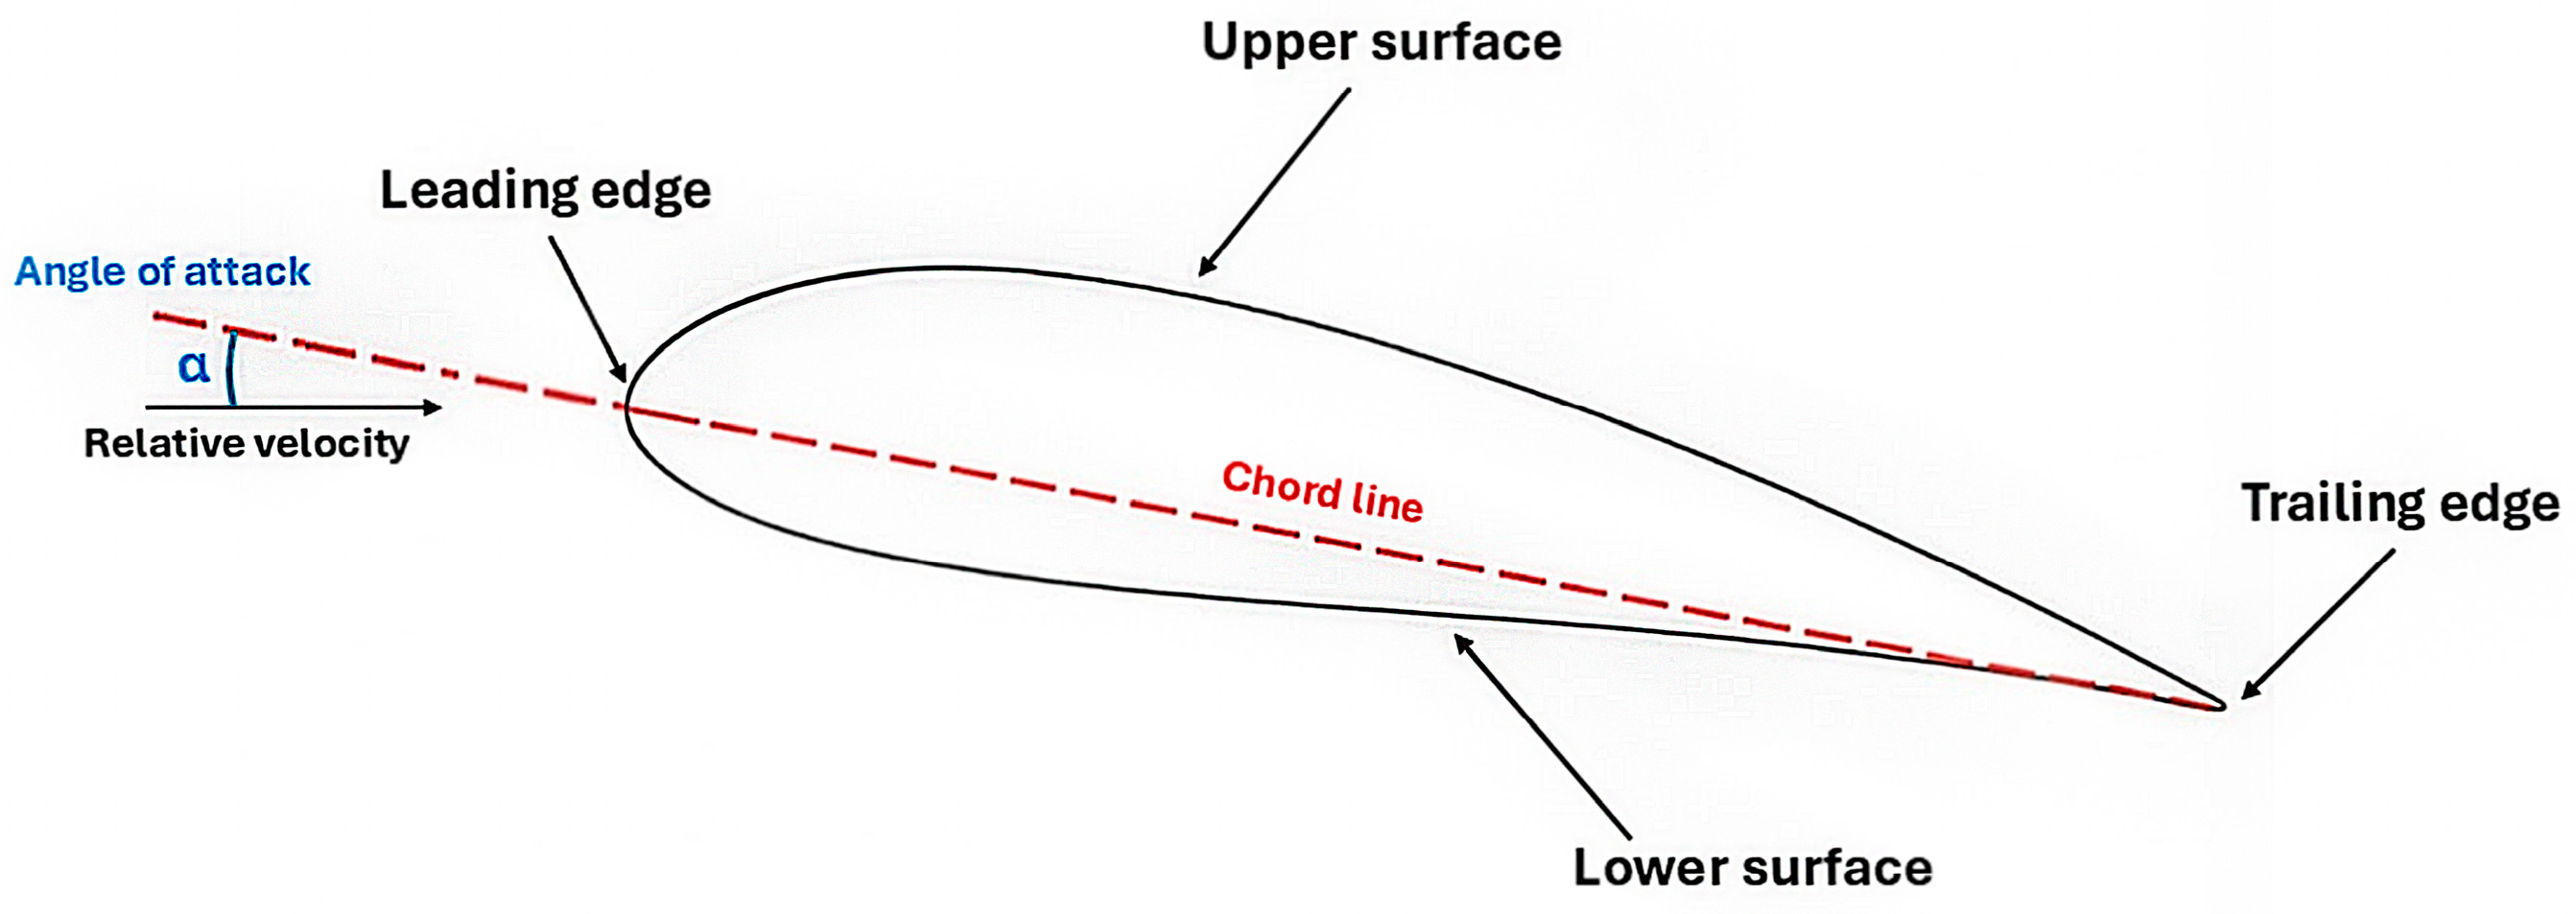
Based on insights from the preliminary survey conducted for this study with the interviewed professor and students, it emerged that for students, the geometry and the working conditions of an impeller blade are difficult to understand using the standard 2D representation. A typical visualization is shown in Figure 1.
For this reason, the main goal of this work is to develop and test AR-based applications to verify whether a didactic approach supported by immersive technologies can enhance user engagement and provide a more inclusive learning environment for this complex subject.
From this perspective, the applications were conceived, according to the UDL principles, to reduce some of the barriers commonly associated with complex technical content: they provide multiple representations of the same concept, can be used on smartphones or tablets without specialized hardware, and allow self-paced exploration with visual and textual cues.
In particular, the focus is on improving students’ involvement during the explanation and facilitating an accessible exploration of the impeller blade’s geometrical parameters and its interaction with the fluid, especially for students who may struggle with standard 2D representations.
It is important to state explicitly that this study evaluates the usability and user experience of the developed applications rather than objective learning gains. Therefore, inclusive education is framed as the foundational design rationale and a potential theoretical contribution, rather than an empirically demonstrated outcome.

2. Materials and Methods

2.1. Aim of the Study and Research Hypotheses

The primary aim of this study is to evaluate the usability and user experience of ad hoc mobile AR systems developed to support mechanical engineering students in understanding fluid machinery concepts.
To identify suitable topics, a group of lecturers from the faculty of Mechanical Engineering was consulted. Based on the advice of teachers willing to incorporate AR applications into their classroom lessons, a set of topics was identified and included in a survey. It was proposed to a large panel of students who had already completed examinations in the relevant subjects, and they identified impeller blades as the most challenging topic.
The main research hypothesis is that mobile AR applications can provide a highly usable and engaging interface for exploring related 3D fluid dynamic phenomena. A secondary hypothesis is that the usability of such tools is not significantly affected by the users’ prior familiarity with immersive technologies.

2.2. Participants

This study involved 45 bachelor’s degree students (5 females, 40 males; mean age = 22, SD = 0.5) enrolled in the Mechanical Engineering program. All participants were actively attending the ‘Machines’ course.

2.3. Development of the AR Applications

To achieve the stated goals, three augmented reality applications were developed: the first allows users to visualize an entire impeller, the second describes the different parts of a blade, and the third shows how the blade and the fluid interact. Each application was designed with specific educational goals in mind: from contextualizing components within a complete impeller, to highlighting the blade’s structure and behavior, and finally to exploring fluid flow characteristics around the blade. The three levels of representation were also intended to support different starting points and learning needs, so that users could approach the topic from a global, component, or operational view.
The development of the AR applications started with the creation of 3D models of a blade and an impeller through standard reverse engineering processes. The reverse-engineering pipeline (Rekoff, 1985; Wakjira et al., 2024) was chosen not only for its metrological accuracy but also because it allows students to relate a physically manipulable object to its digital counterpart, a feature that supports embodied and active learning approaches (Zhong et al., 2024; Liu & Zhang, 2026).
Afterward, CFD simulations were performed to extract the results, in terms of pressure and velocity maps, that are useful for understanding the energy exchange between the fluid and vanes, which were then displayed in the app. Finally, the CAD models and the CFD results were used to set up the interactive AR applications using Unity 3D and Vuforia Engine. All developed apps were designed to be used on smartphones or tablets.
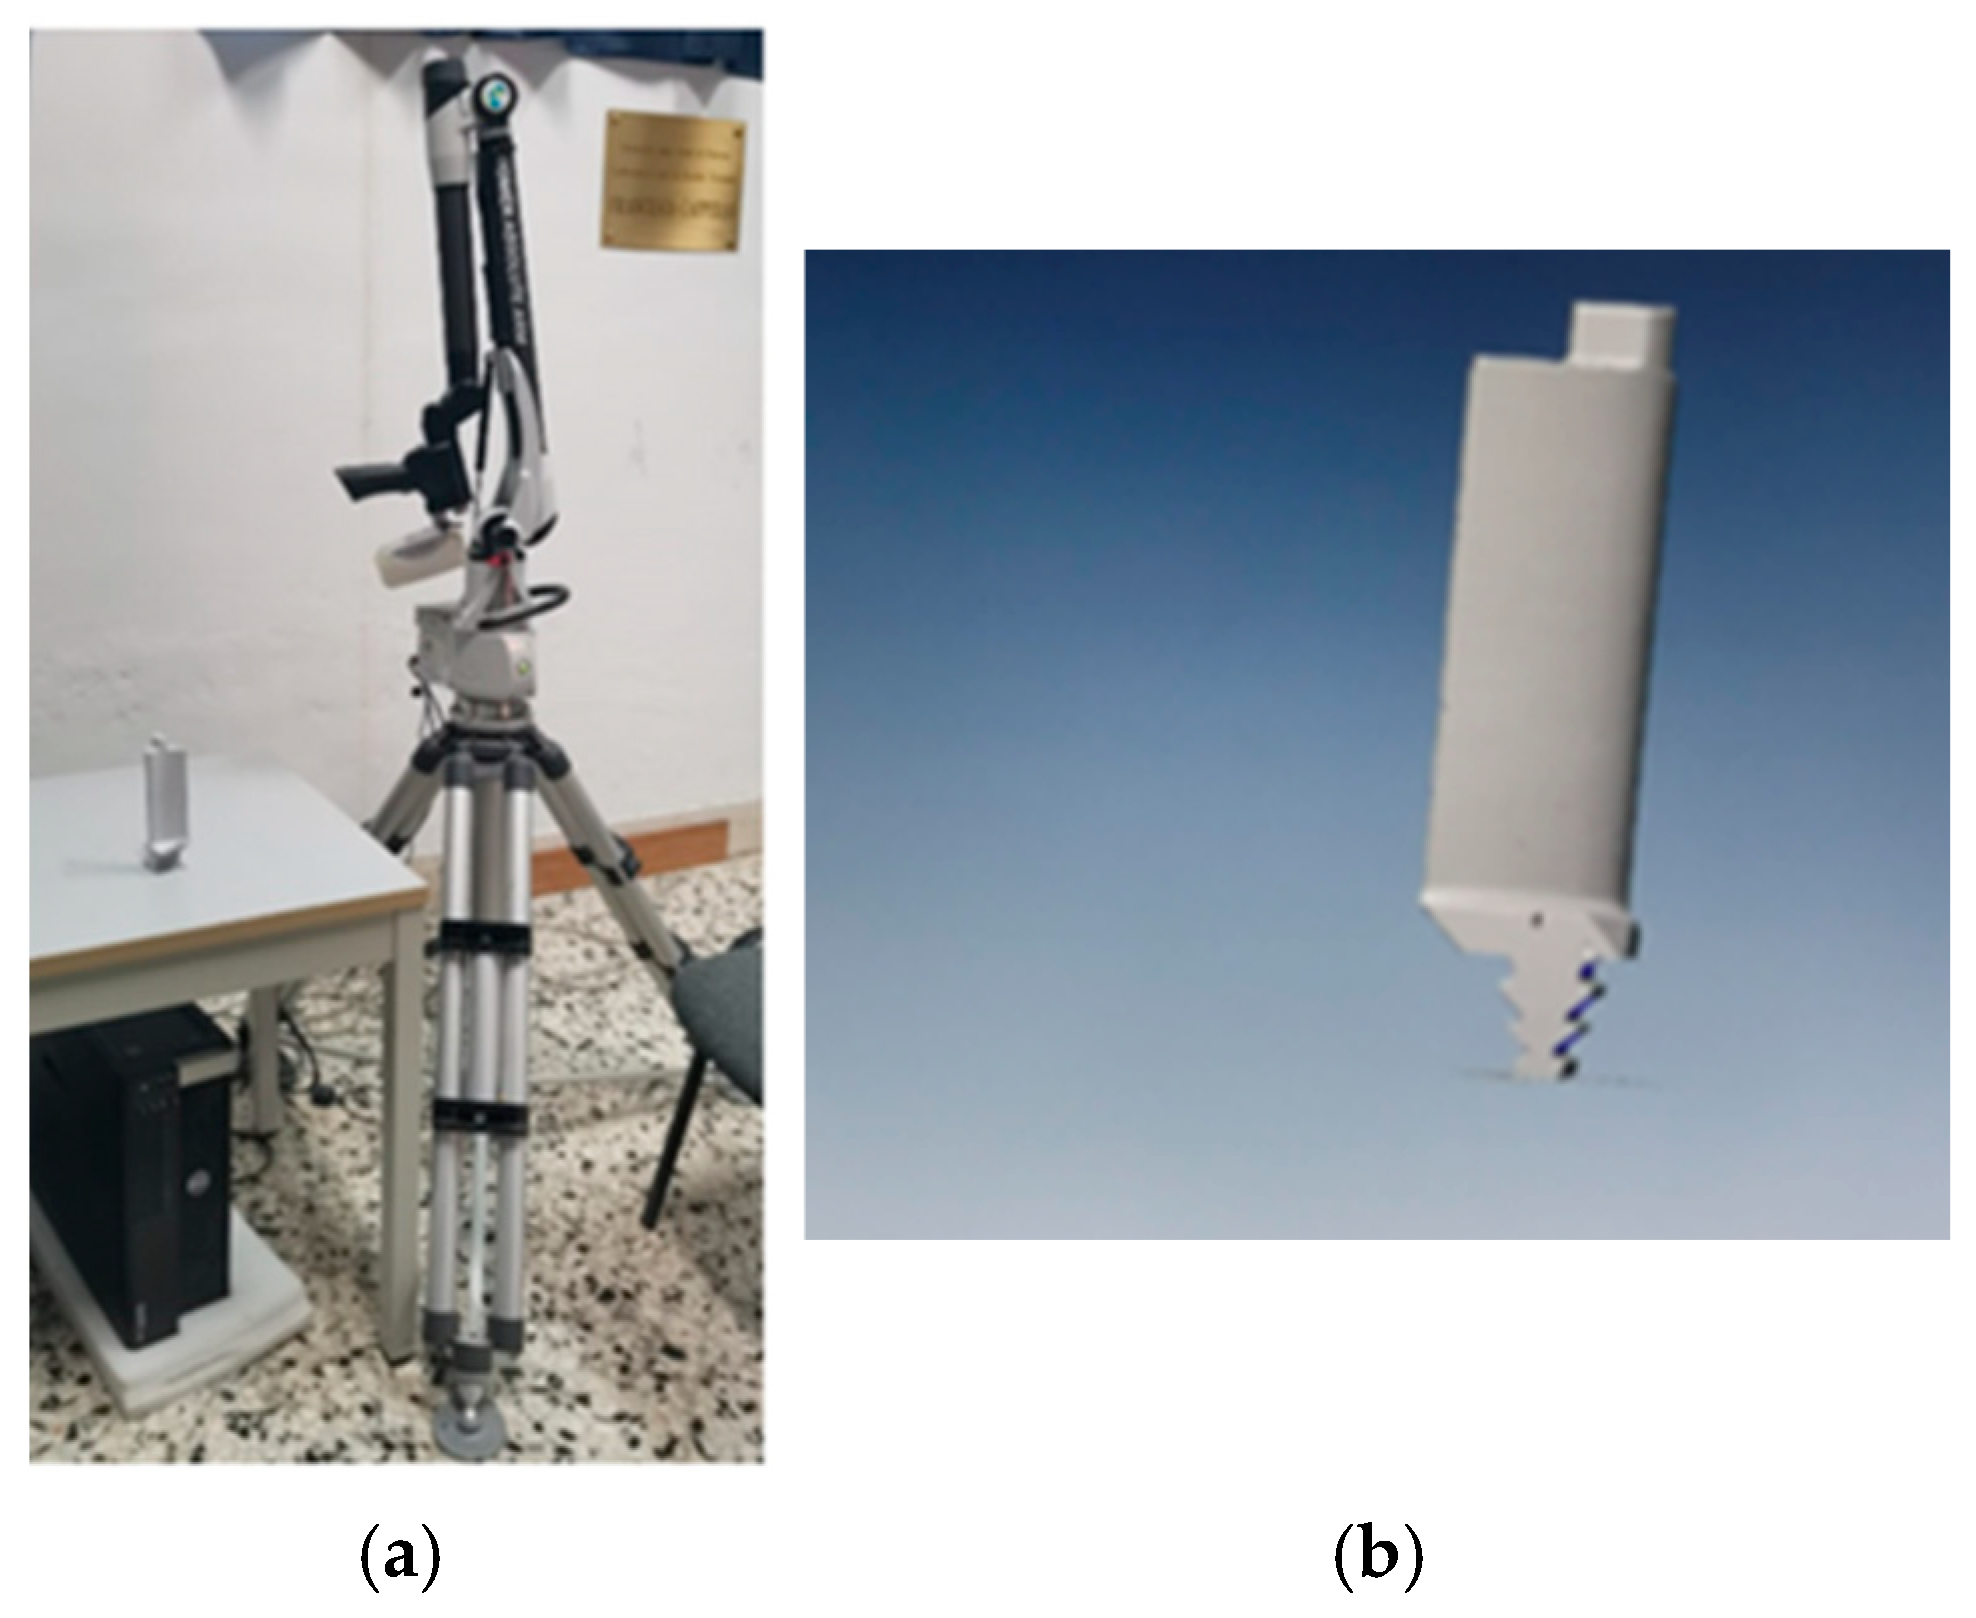
The shape of a real blade used during the lessons was acquired by a 3D laser scanner, the HEXAGON METROLOGY’s HP-L-20.8, shown in Figure 2a. The acquired point cloud of the blade was post-processed, and a very accurate 3D CAD model of the impeller blade was obtained (Figure 2b).
The simplified impeller’s CAD model was obtained by preliminarily creating a circular pattern of the reconstructed 3D model of the blade; after that, the inner and outer rings were modeled through the extrusion function. Once the CAD models of the blade and the impeller were created, the first two applications were developed.
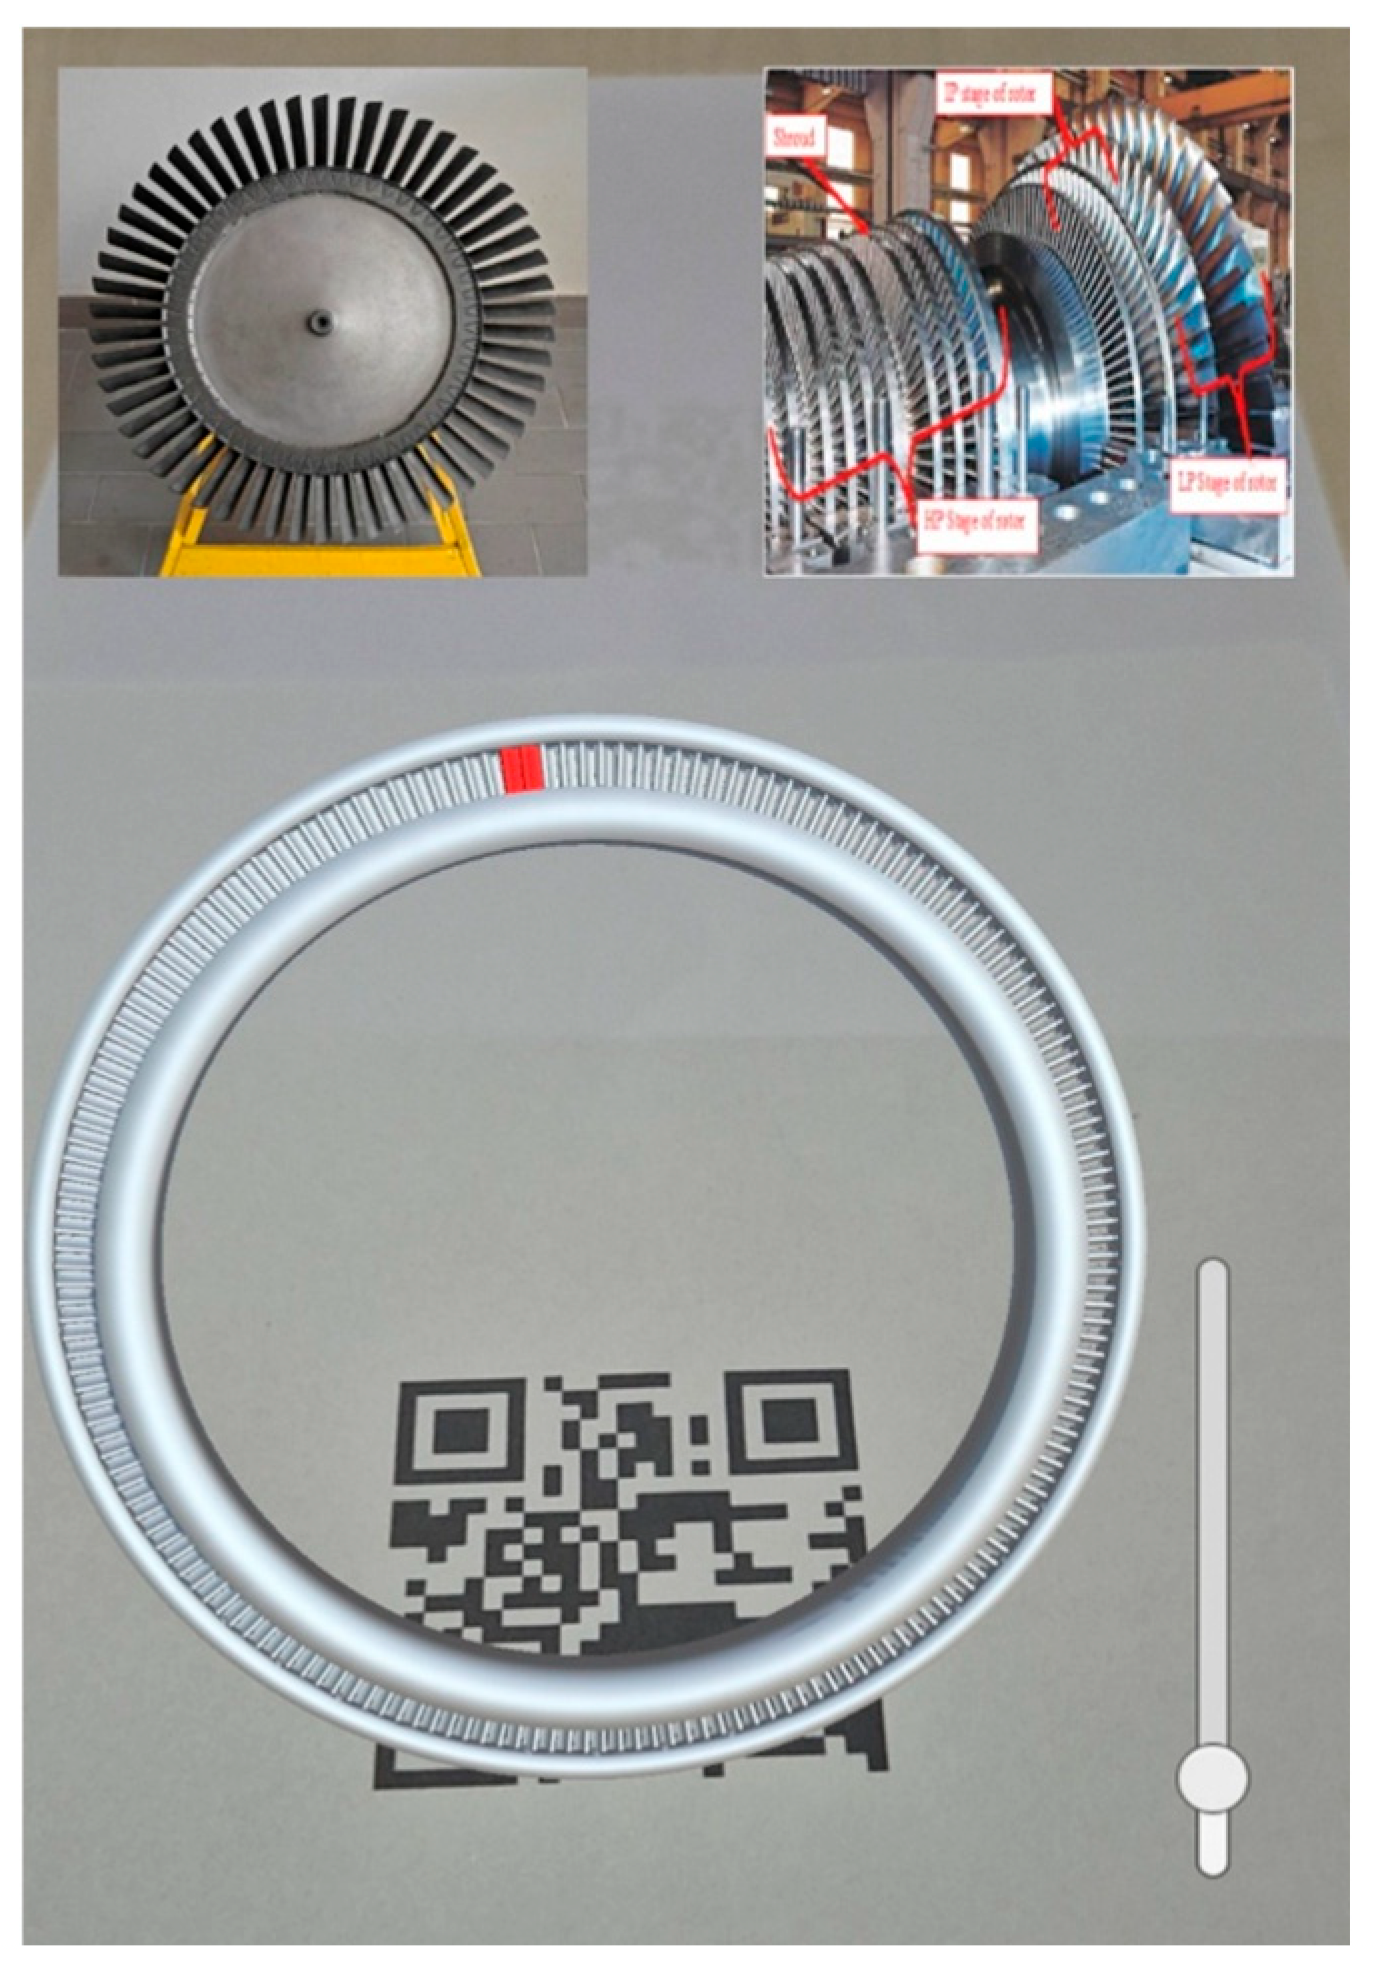
The first AR application was developed to clarify the position of the blades in an impeller. For this purpose, it was decided to display the complete model of an impeller in the AR environment and to highlight two adjacent blades. Unity 3D was selected as the graphics engine due to its widespread adoption in AR-based engineering education applications (Chaudhary et al., 2023; Suhail et al., 2024), which demonstrated its reliability for the real-time rendering of CAD-derived 3D models on mobile devices.
Before importing the CAD model of the impeller on the Unity 3D environment, the mesh of the model was optimized by reducing the number of polygons through the software Blender. To optimally observe the impeller model, one slider was added in the 3D virtual environment allowing users to rotate the model; furthermore, based on the teacher’s suggestions, two images representing the turbine impeller of an Allison J33 engine1 and a steam turbine2 were integrated in the AR environment, to ensure a better understanding of the analyzed machine parts (Figure 3). Once the 3D environment was developed, it was converted into an AR application through the Vuforia Engine. A QR code was used to display the virtual environment.
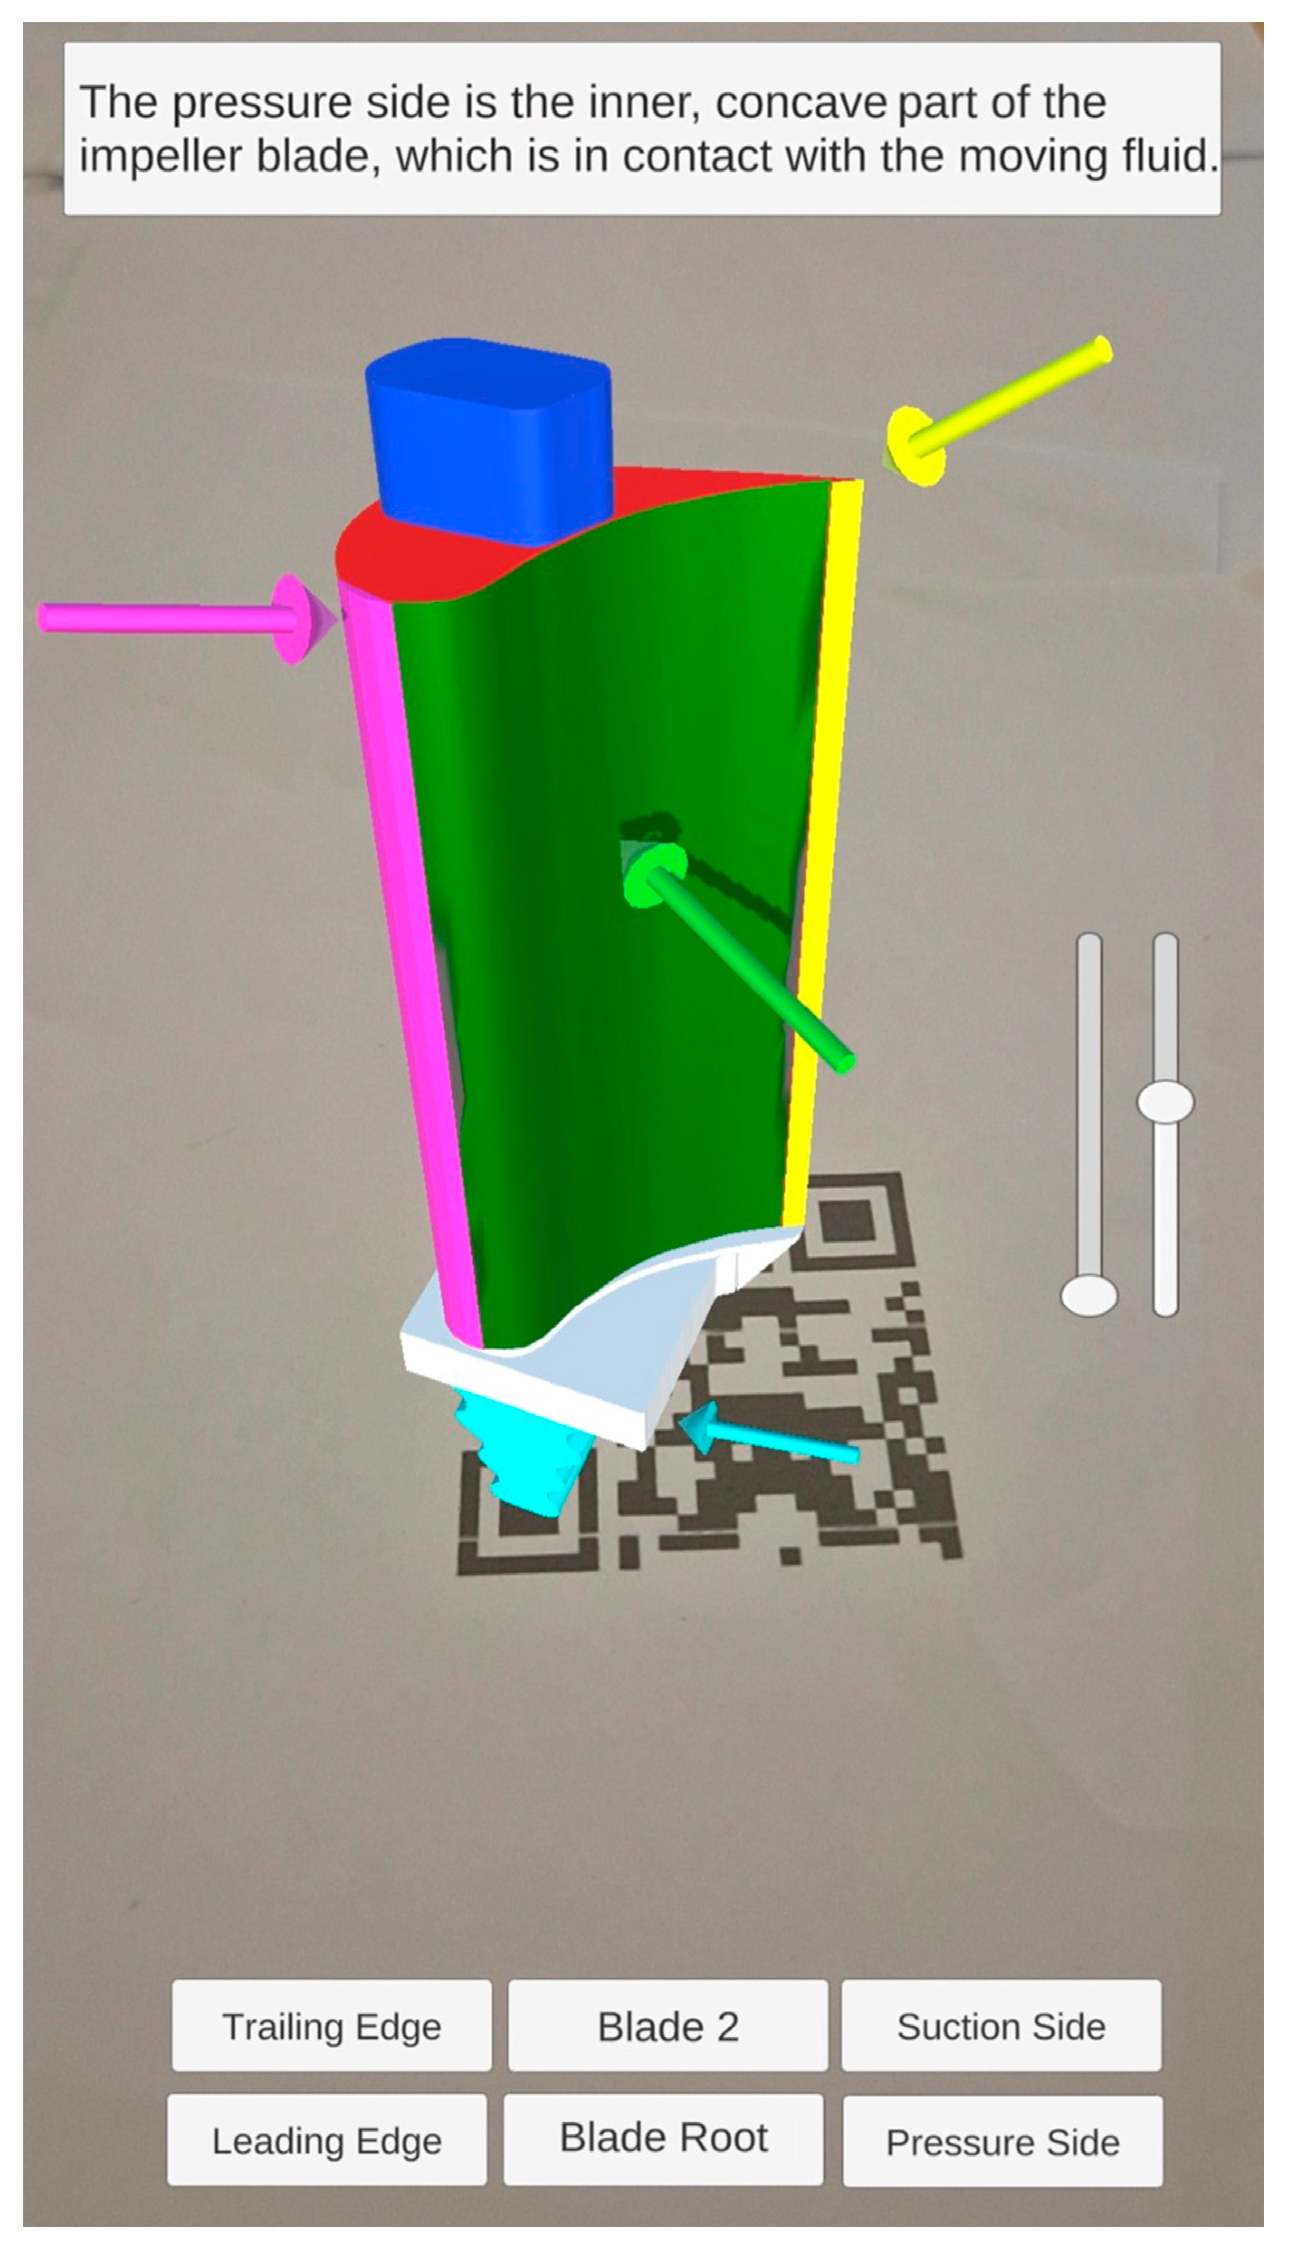
The second application was developed to identify and understand the role of the main parts of a single blade. To this aim, the reconstructed blade’s CAD model was imported in Unity 3D, and its main parts were highlighted by different colored layers. Moreover, six buttons were integrated into the application, each associated with a specific function developed by scripts in C#. In particular, the buttons allow the textual definitions, arrows, and salient parts of the virtual blade to be displayed, allowing users to choose the component to focus on. In addition to the buttons, two sliders were included to zoom and rotate the model. As in the first application, the AR system was created through Vuforia Engine (Version 10.19.3) and associated with a QR code. The result obtained is shown in Figure 4.
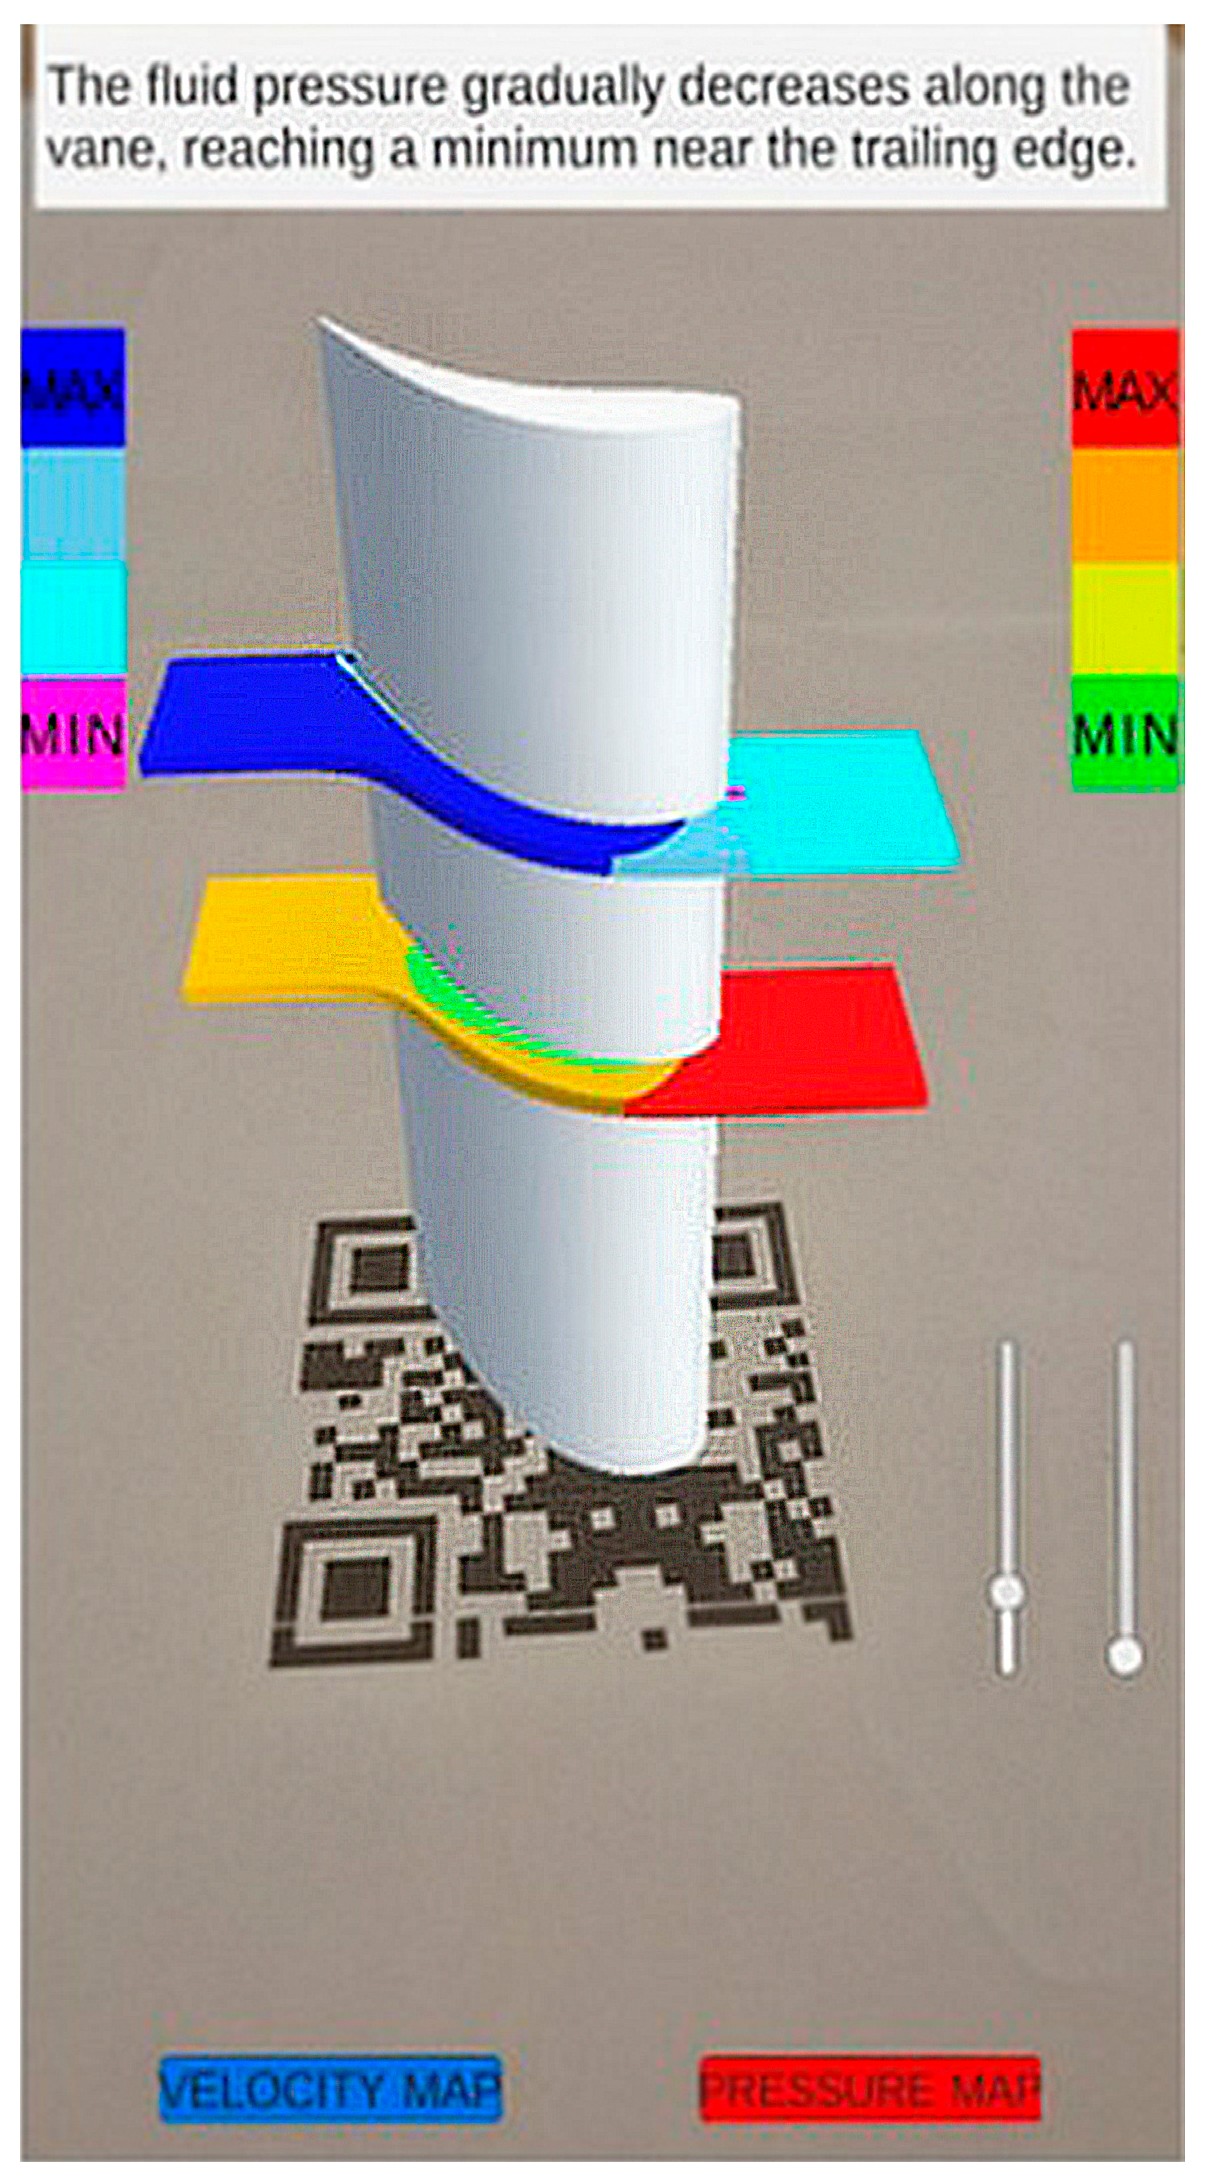
The third application was developed to describe how the fluid flow and blade interact. In particular, it was decided to display how the velocity and pressure of the flow vary around the blade, by means of colored maps.
For this purpose, preliminarily, a fluid-dynamic numerical analysis was performed on Ansys CFX (Version 2024 R1) to obtain the fluid velocity and pressure maps. Subsequently, the isobaric and constant velocity surfaces were exported and modified in Blender (Version 4.1); these surfaces were derived from pressure and velocity maps obtained along circumferential sections intersecting the vane. Although the maps theoretically exhibit a continuous variation of values, they were discretized into a limited number of contour bands, sufficient to effectively capture the fluid characteristics without overloading the application. Then, through the Unity 3D development platform, an interface consisting of two buttons and two sliders was set up. In detail, the two buttons are used to display or hide the speed and pressure maps; the sliders enable the zoom and the rotation of the model up to 360° (Figure 5).
From a disciplinary perspective, this specific application facilitates learning outcomes in fluid machinery because students learn to correlate geometric features, such as leading and trailing edges and pressure/suction sides, with dynamic fluid behaviors such as pressure gradients and velocity changes. Teaching this via AR, rather than only traditional 2D tools, enables the representation of an experimental educational scenario, such as a fluid dynamics lab, directly on the student’s desk and whenever they want to use it. Students can conduct safe and self-paced exploratory learning, offering a more intuitive 3D perspective for studying a complex topic, with the only disadvantage linked to the hardware limitation of mobile devices in rendering complex, transient flow animations in real time, which requires the discretization of CFD maps.
To address the hardware constraints typical of mobile devices and ensure high rendering performance, the CAD models and CFD datasets were heavily optimized before being imported into the Unity framework. Specifically, the models’ polygon counts were reduced by 50% in Blender to lighten the exported file weight, effectively preventing rendering bottlenecks and reducing loading times while maintaining the essential geometric features of the impeller. Furthermore, the continuous CFD results were extracted from Ansys as simplified isobaric and constant velocity surfaces, which were statically discretized into distinct color-coded gradations to map intensity variations. This technical strategy significantly reduced the computational load and VRAM usage on mobile devices while preserving the scientific clarity necessary for educational purposes.
To validate the real-time rendering performance and evaluate potential thermal throttling, a 15-min continuous stress test was conducted using an Android smartphone (Samsung Galaxy S24, Samsung Electronics, Suwon, Republic of Korea). During the entire session, the application maintained a perfectly stable frame rate of 60 FPS while actively tracking the QR code and rendering the 3D CFD maps and CAD models. The device temperature increased moderately from an initial 34 °C to a final 39 °C, and no visible thermal throttling or frame drops occurred, demonstrating that the 50% polygon reduction and the CFD map discretization effectively satisfied mobile hardware constraints, ensuring a smooth and uninterrupted educational experience.

2.4. Evaluation Procedures and Instruments

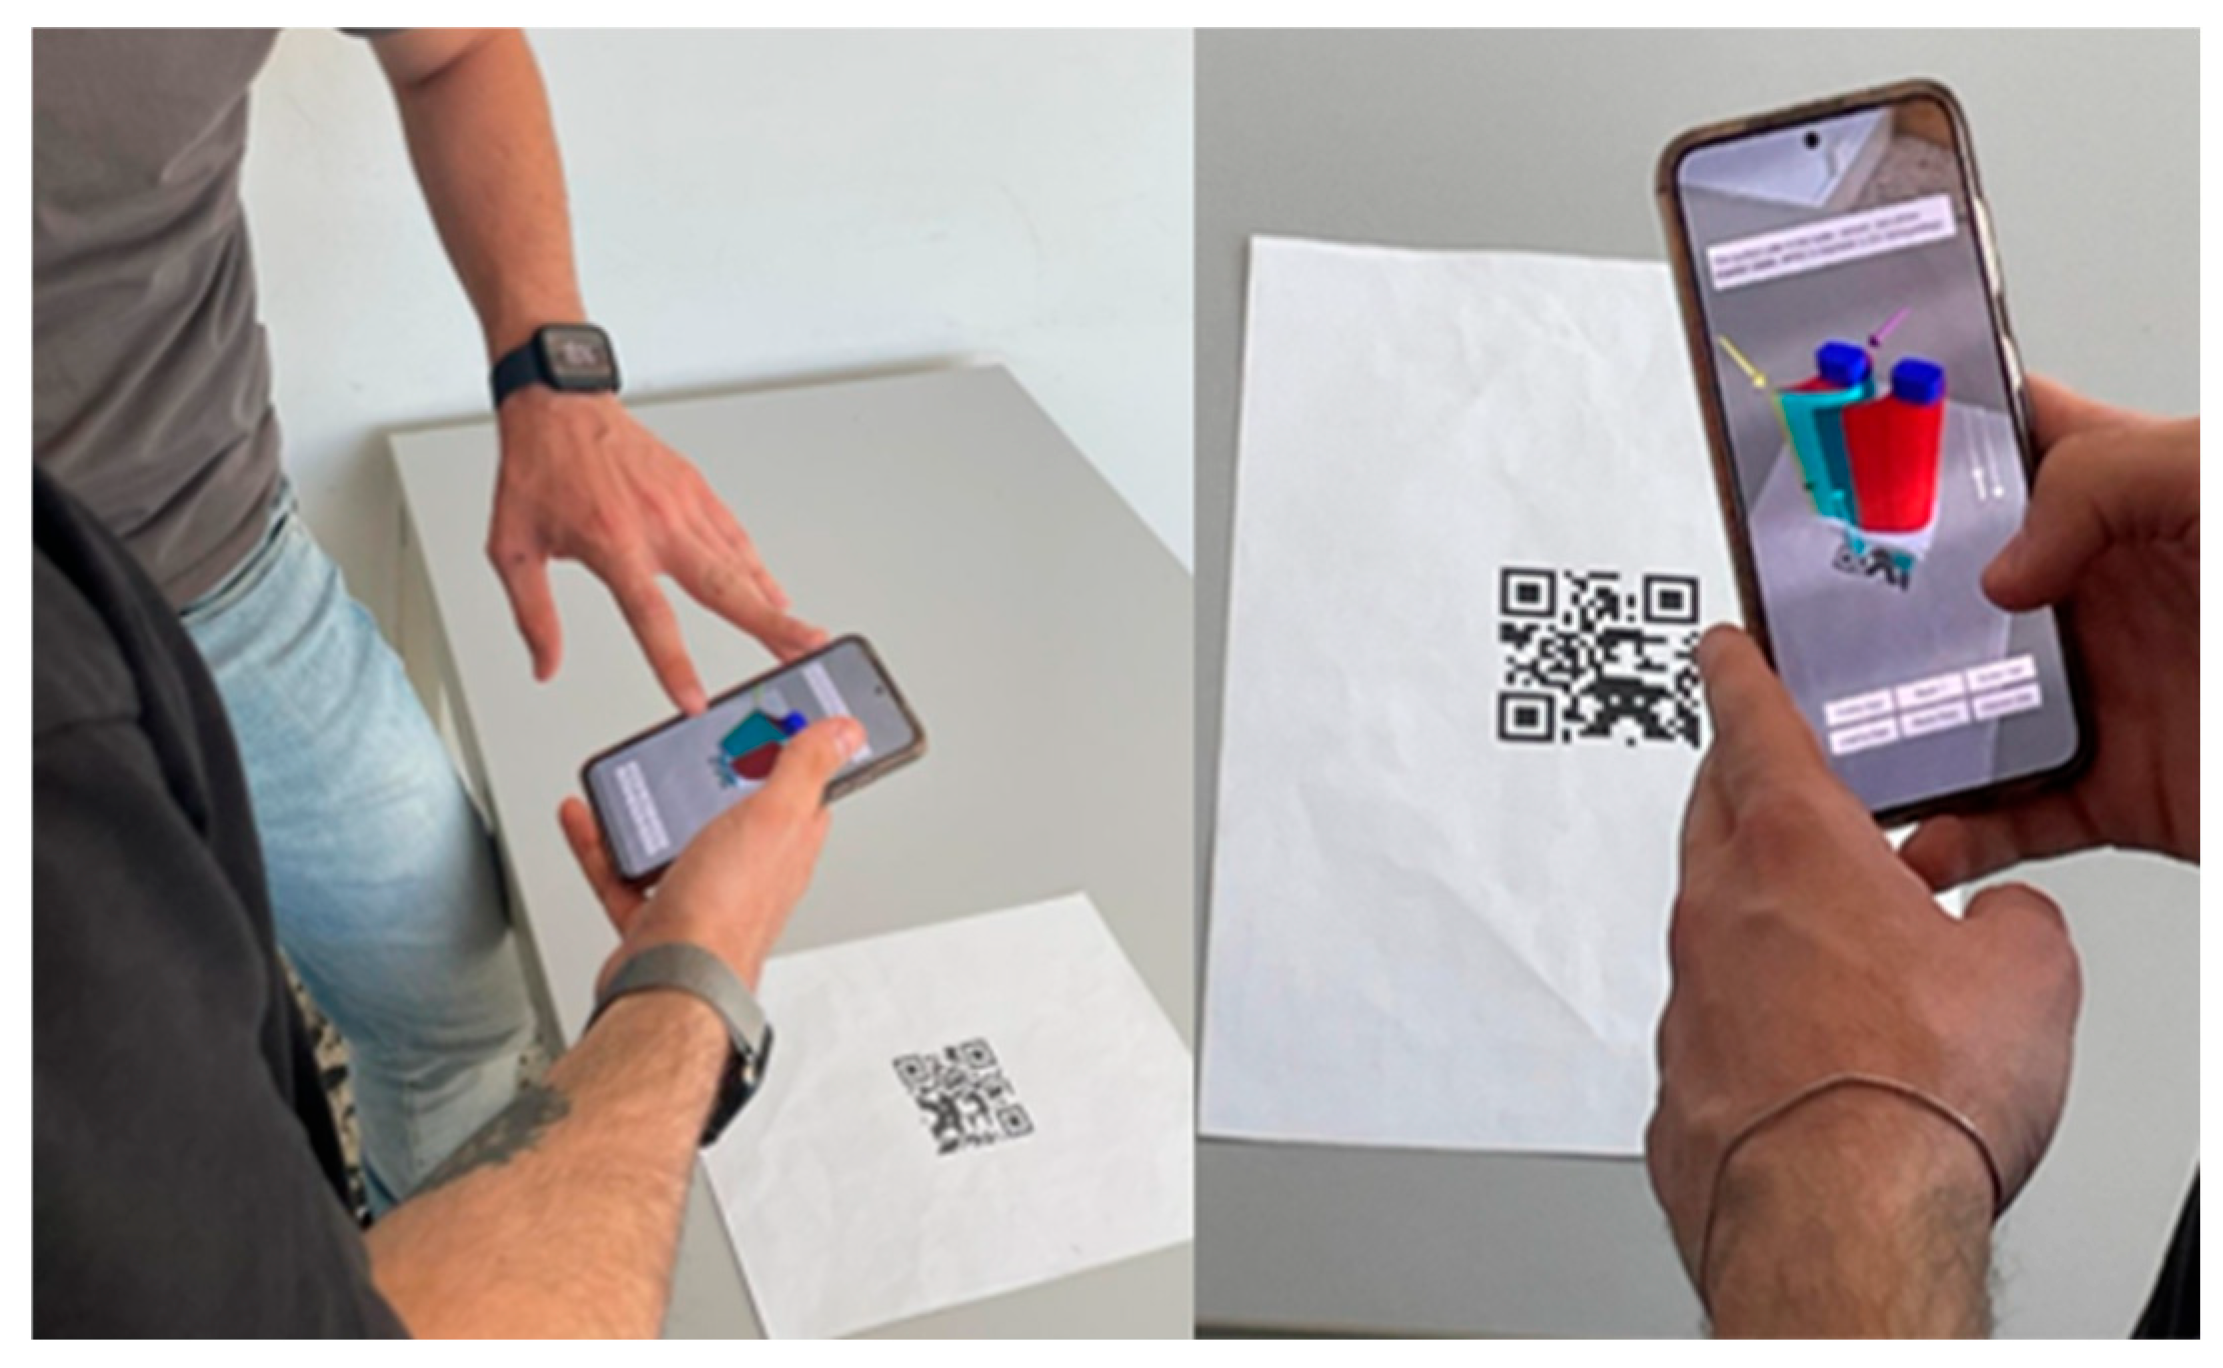
Before testing the developed applications, all students received a theoretical lecture on the related topics and a brief description, supported by a video tutorial, of the main functionalities of the applications. The students were then invited to use the applications, as shown in Figure 6, and, once the experience was completed, to proceed to completing the questionnaire.
To evaluate the applications’ usability and perceived learning support, a structured questionnaire was developed. The first part of the test was structured with questions aimed at assessing the user’s level of familiarity with AR and VR technologies, to identify possible significant differences in terms of prior skills. In this educational context, “familiarity” is defined as the user’s prior exposure to and initial cognitive ease with immersive tools, which may influence the initial cognitive effort required to interact with the interface, and is distinct from the system’s actual usability (Jun, 2023; Khurana & Chilana, 2024). This analysis was carried out using the Likert scale, a multi-item scale, where a Likert item means a single item linked to a precise request to express a judgment or opinion (Koo & Yang, 2025). The question asked was: “Define your level of familiarity with augmented reality applications”, specifically “virtual reality”. Five answers were allowed, each indicating a different level of familiarity with these applications: “Extremely familiar”, “Moderately familiar”, “Somewhat familiar”, “Slightly familiar”, or “Not at all familiar”.
The second set of questions aimed to assess the usability of the application, carried out by means of the System Usability Scale (SUS; Brooke, 1996), which consists of ten questions and is considered a reliable tool for similar surveys (Brooke, 1996; Grier et al., 2013). The typical structure is shown in Table 1.
The third section of the questionnaire focused on the investigation of the user experience through Martin Schrepp’s User Experience Questionnaire (UEQ), shown in Table 2, which can provide a comprehensive and quick assessment by answering the question “How do you rate the experience?” (Laugwitz et al., 2008; Hinderks et al., 2019).
Finally, the fourth part of the questionnaire consisted of an open section aimed at gathering suggestions from students, with the objective of identifying and correcting any critical issues.

2.5. Inclusive Design Rationale

Although this study was not directly conceived as a formal intervention based on UDL, the applications developed share the same underlying objective as these principles. The idea of developing applications capable of providing different approaches to spatial and visual framing, thereby overcoming potential barriers to learning when it comes to understanding complex fluid machinery concepts, is fully in line with these principles.
In particular, the applications were designed to support multiple forms of content representation by combining 3D models, chromatic highlighting, textual explanations, interactive controls and visual maps of pressure and velocity. This approach supports students with different spatial visualization abilities and familiarity with immersive technologies.
Moreover, the choice of mobile devices as the delivery platform was motivated by the need to avoid expensive or cumbersome hardware, improving the practical accessibility and scalability of the proposed tools in regular classroom settings.
From this perspective, the applications are designed to complement traditional instruction by offering alternative spatial representations to explore difficult disciplinary content. The aim is to support the diverse spatial reasoning abilities commonly found among engineering students, and, consistent with the scope of this research, the present study evaluates usability and perceived user experience of the AR interface.

3. Results

Regarding the selection of the case study, the findings of the preliminary survey identifying the topic perceived as the most challenging revealed that it was related to the standard representation used to describe impeller blades and their interaction with fluid flow.

3.1. Evaluation of the Influence of Familiarity Levels and Statistical Procedures

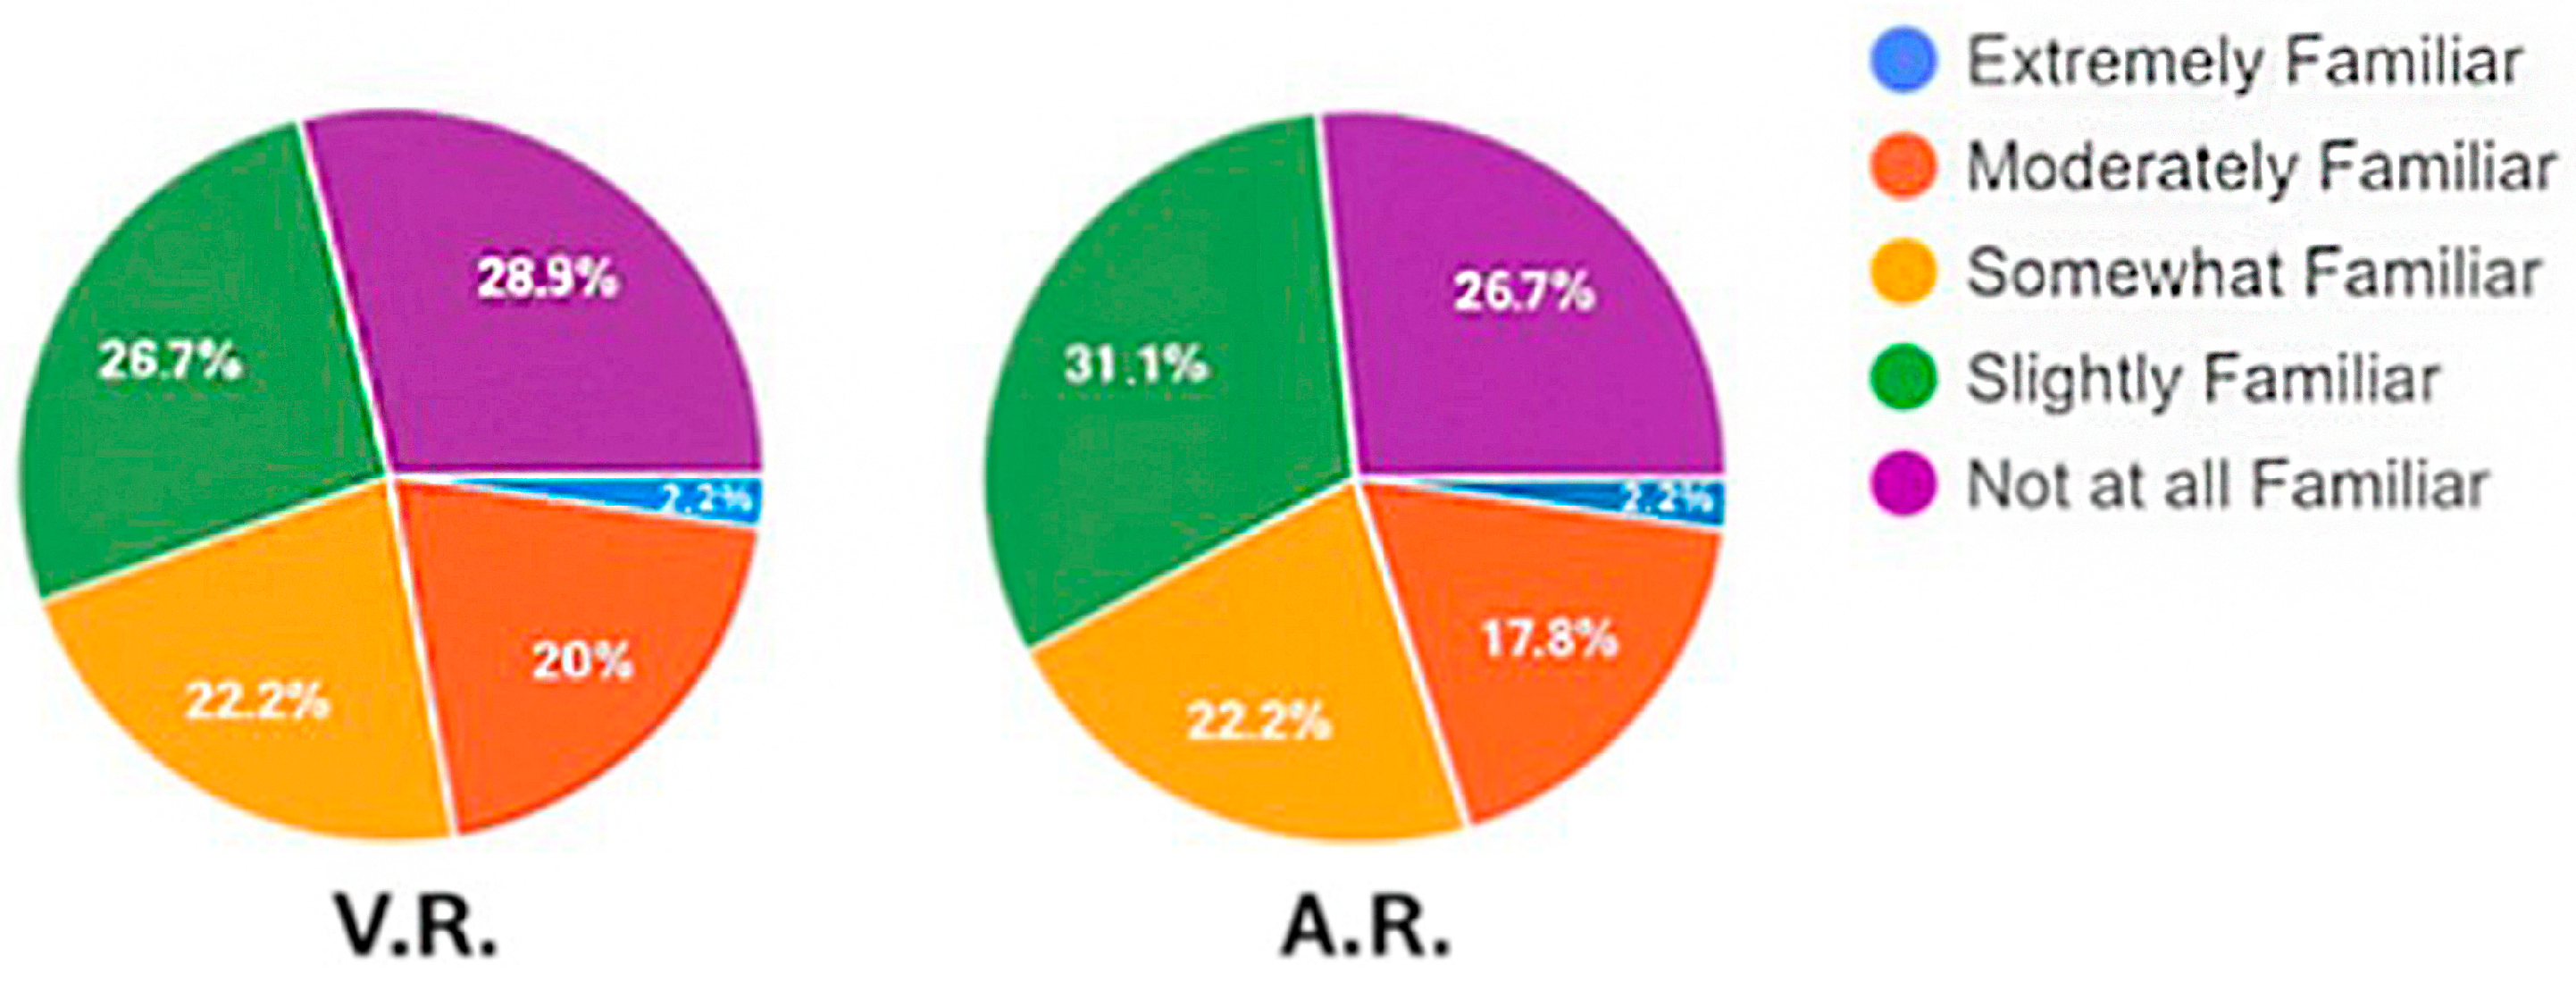
The results were preliminarily divided into two groups according to the level of familiarity indicated in the first section of the questionnaire. The aim was to evaluate whether the level of user-friendliness with AR/VR tools influences the results of the questionnaire. In the first group (low familiarity) all students who had answered “slightly familiar/not at all familiar” to at least one of the two questions were included, resulting in a sample of 27. The remaining 18 were placed in the high-familiarity group. In Figure 7, the distribution of familiarity levels is shown.
To understand if the level of familiarity affects the results, it was necessary to assess the distribution of the results obtained from the two groups. To determine whether the data were normally distributed, a necessary condition for the application of parametric statistical tests, the Shapiro–Wilk test was used (Shapiro & Wilk, 1965).
This statistical test verifies the null hypothesis, a type of statistical hypothesis stating that no statistical significance exists in a set of given observations (Travers et al., 2017). In the Shapiro–Wilk test, the null hypothesis entails that the data come from a normal distribution, and the results will be considered significant based on the p value, or probability value, obtained. The p value is a number describing the likelihood of obtaining the observed data under the null hypothesis of a statistical test (Thiese et al., 2016). A typical formulation is:
p   =   P   ( S n     s n |   H 0 ) ,
where the p value indicates how likely it is that an Sn test statistic is at least equal to the sn value obtained, assuming the null hypothesis (H0) to be true (Hung et al., 1997; Chén et al., 2023). If the p value is greater than a predetermined threshold of 0.05, the null hypothesis can be accepted, and the distributions are considered normal.
If the data of both groups are found to be normally distributed, the hypothesis of equality of variances between the two groups can be tested using Levene’s test (Brown & Forsythe, 1974). If verified, the t-test for independent samples can be adopted, by which the averages of the two independent groups can be compared, testing whether there is a statistically significant difference between them (Field, 2013). Otherwise, if the hypothesis is not verified, a variant of the t-test can be applied that does not require equality of variances, known as Welch’s t-test (Welch, 1947).
Instead, if even one of the two groups has data that are not normally distributed, a non-parametric test that does not require the assumption of normality should be used. In this case, the Mann–Whitney U-test can be used, which compares the medians of the two groups (McKnight & Najab, 2010).
Regardless of the used test (t-test or Mann–Whitney U-test), the results will be considered significant based on the p value obtained. If the p value is below a predetermined threshold of 0.05, the null hypothesis will be neglected, so familiarity with digital interfaces significantly influences the ease of use of the application.

3.2. System Usability Scale Test Results

Analyzing the SUS results (second section of the questionnaire) using the Shapiro–Wilk test, it emerged that the data obtained followed normal distributions in both the low-familiarity sample (W = 0.951, p = 0.229) and the high-familiarity one (W = 0.948, p = 0.400). Therefore, Levene’s test was performed; the obtained results (F = 0.221, p = 0.640) showed no significant differences in variances. Finally, the two datasets were compared using the t-test for independent samples; the results (t = 0.113, p = 0.911) showed no significant differences between the two groups. All performed tests, summarized in Table 3, demonstrated that the application’s usability was not influenced by the user’s previous experience with AR/VR applications.
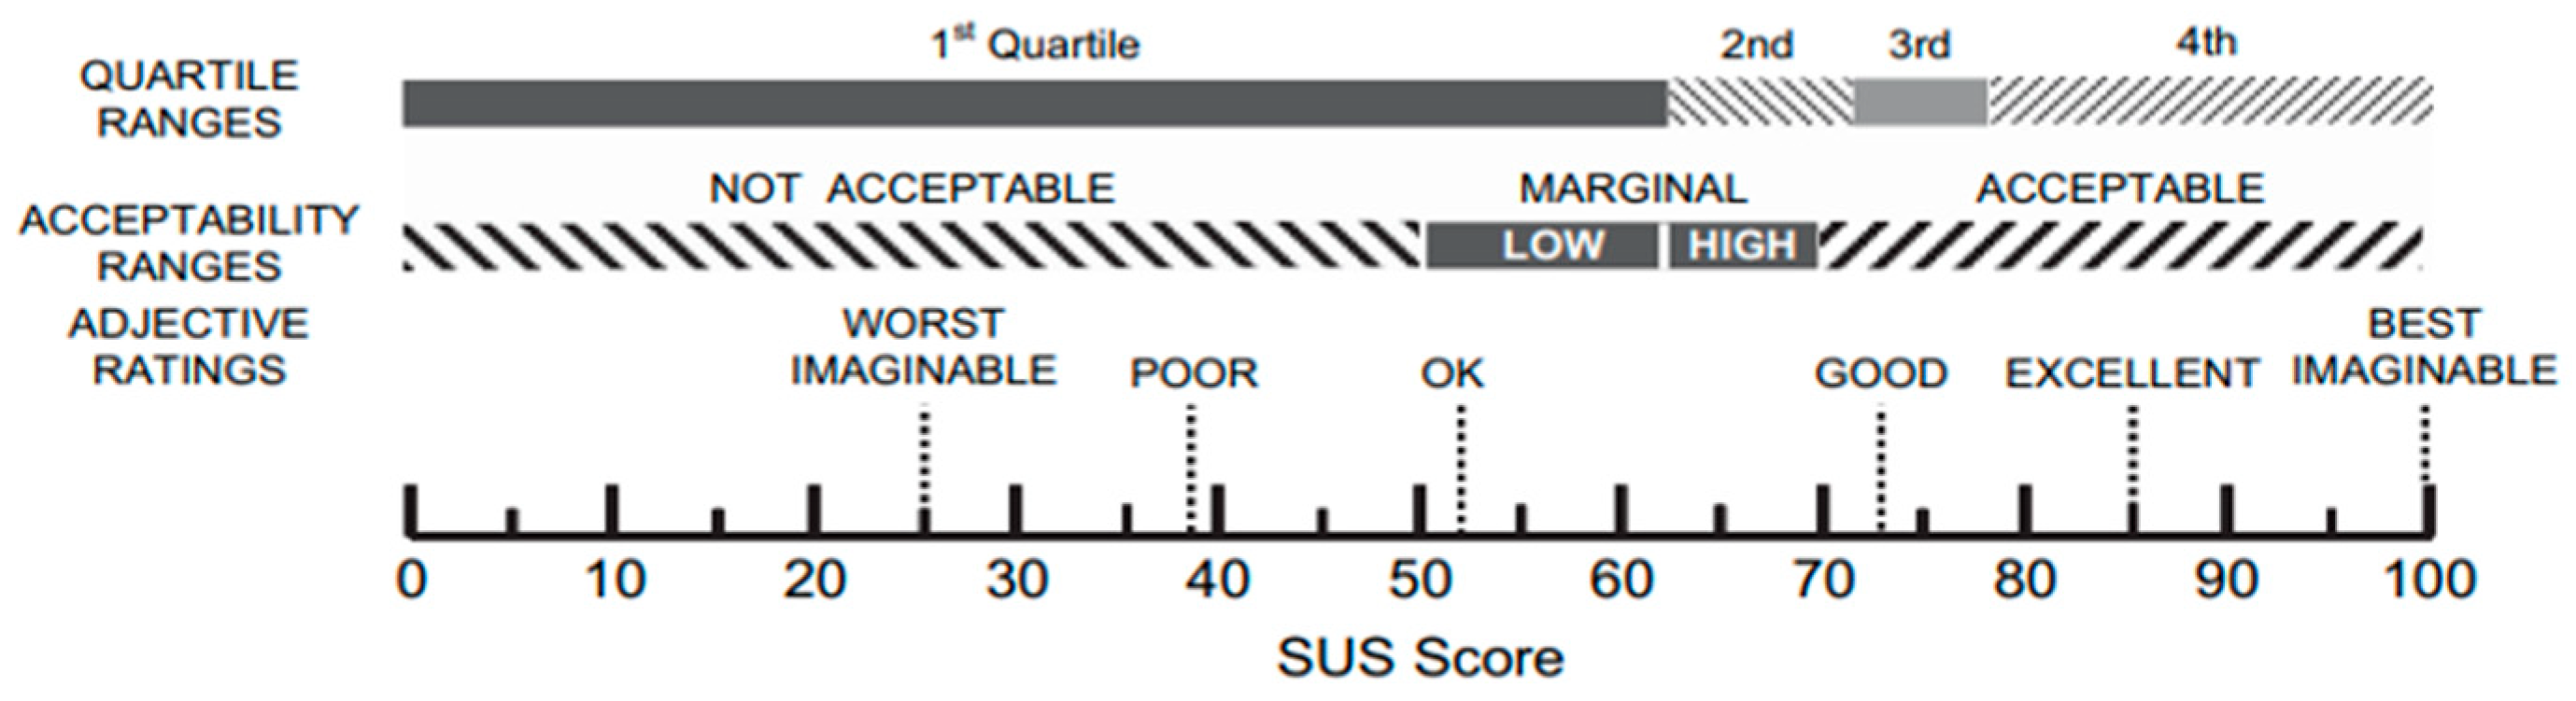
The average SUS score was then evaluated in order to assess the usability of the applications, using the popular 0–100 score proposed by Bangor et al. (2008) divided into the ranges shown in Figure 8.
The obtained SUS score, related to the entire sample, was 73.72 out of a maximum of 100 and was classified as “Good” on the SUS score classification shown in Figure 8.

3.3. User Experience Questionnaire Results

Before analyzing the results of the two groups (high and low familiarity), the consistency of the provided answers was checked using the UEQ analysis tool by Schrepp et al. (2017a). The first feature of the test highlights inconsistencies between answers of the same semantic area (26 questions in six areas). In the case of three or more inconsistent answers, the result is identified as unreliable and discarded. None of the 18 answers from the high-familiarity sample were excluded, while 2 answers from the low-familiarity sample were purged. The second feature highlights the number of responses with the same value (1 to 7) and identifies criticality for a value of 15 or more. At this stage, two answers in the high-familiarity sample and one in the low-familiarity sample were invalidated. The number of responses, keeping only the consistent ones, decreased from 45 to 40 (from 18 to 16 in the high-familiarity group, and from 27 to 24 in the low-familiarity group).
Applying the Shapiro–Wilk test to the UEQ, it was found that the distributions were not normal; therefore, to assess the existence of significant differences, a non-parametric test was used, namely, the Mann–Whitney U-test. The obtained results showed that for the six main areas (Attractiveness, Perspicuity, Efficiency, Dependability, Stimulation and Novelty), there were no significant differences between the two groups; consequently, familiarity with AR/VR technologies did not influence the results.
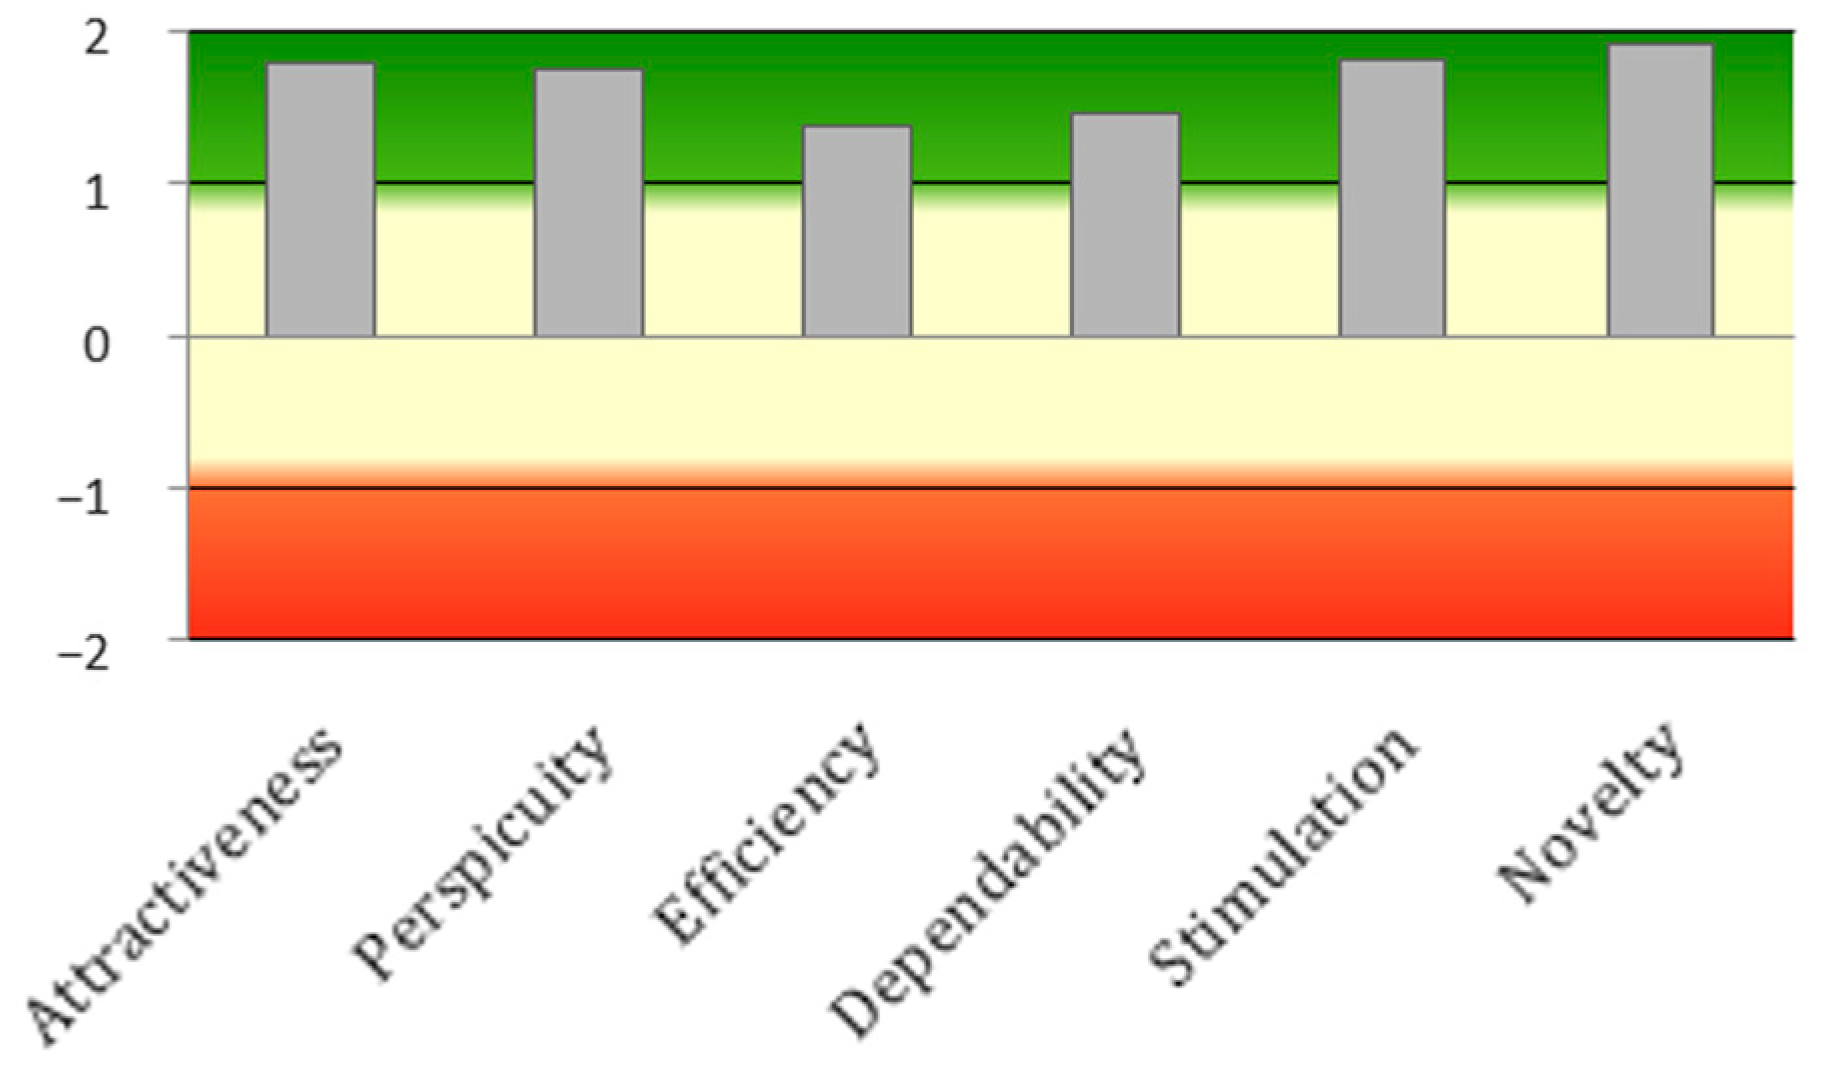
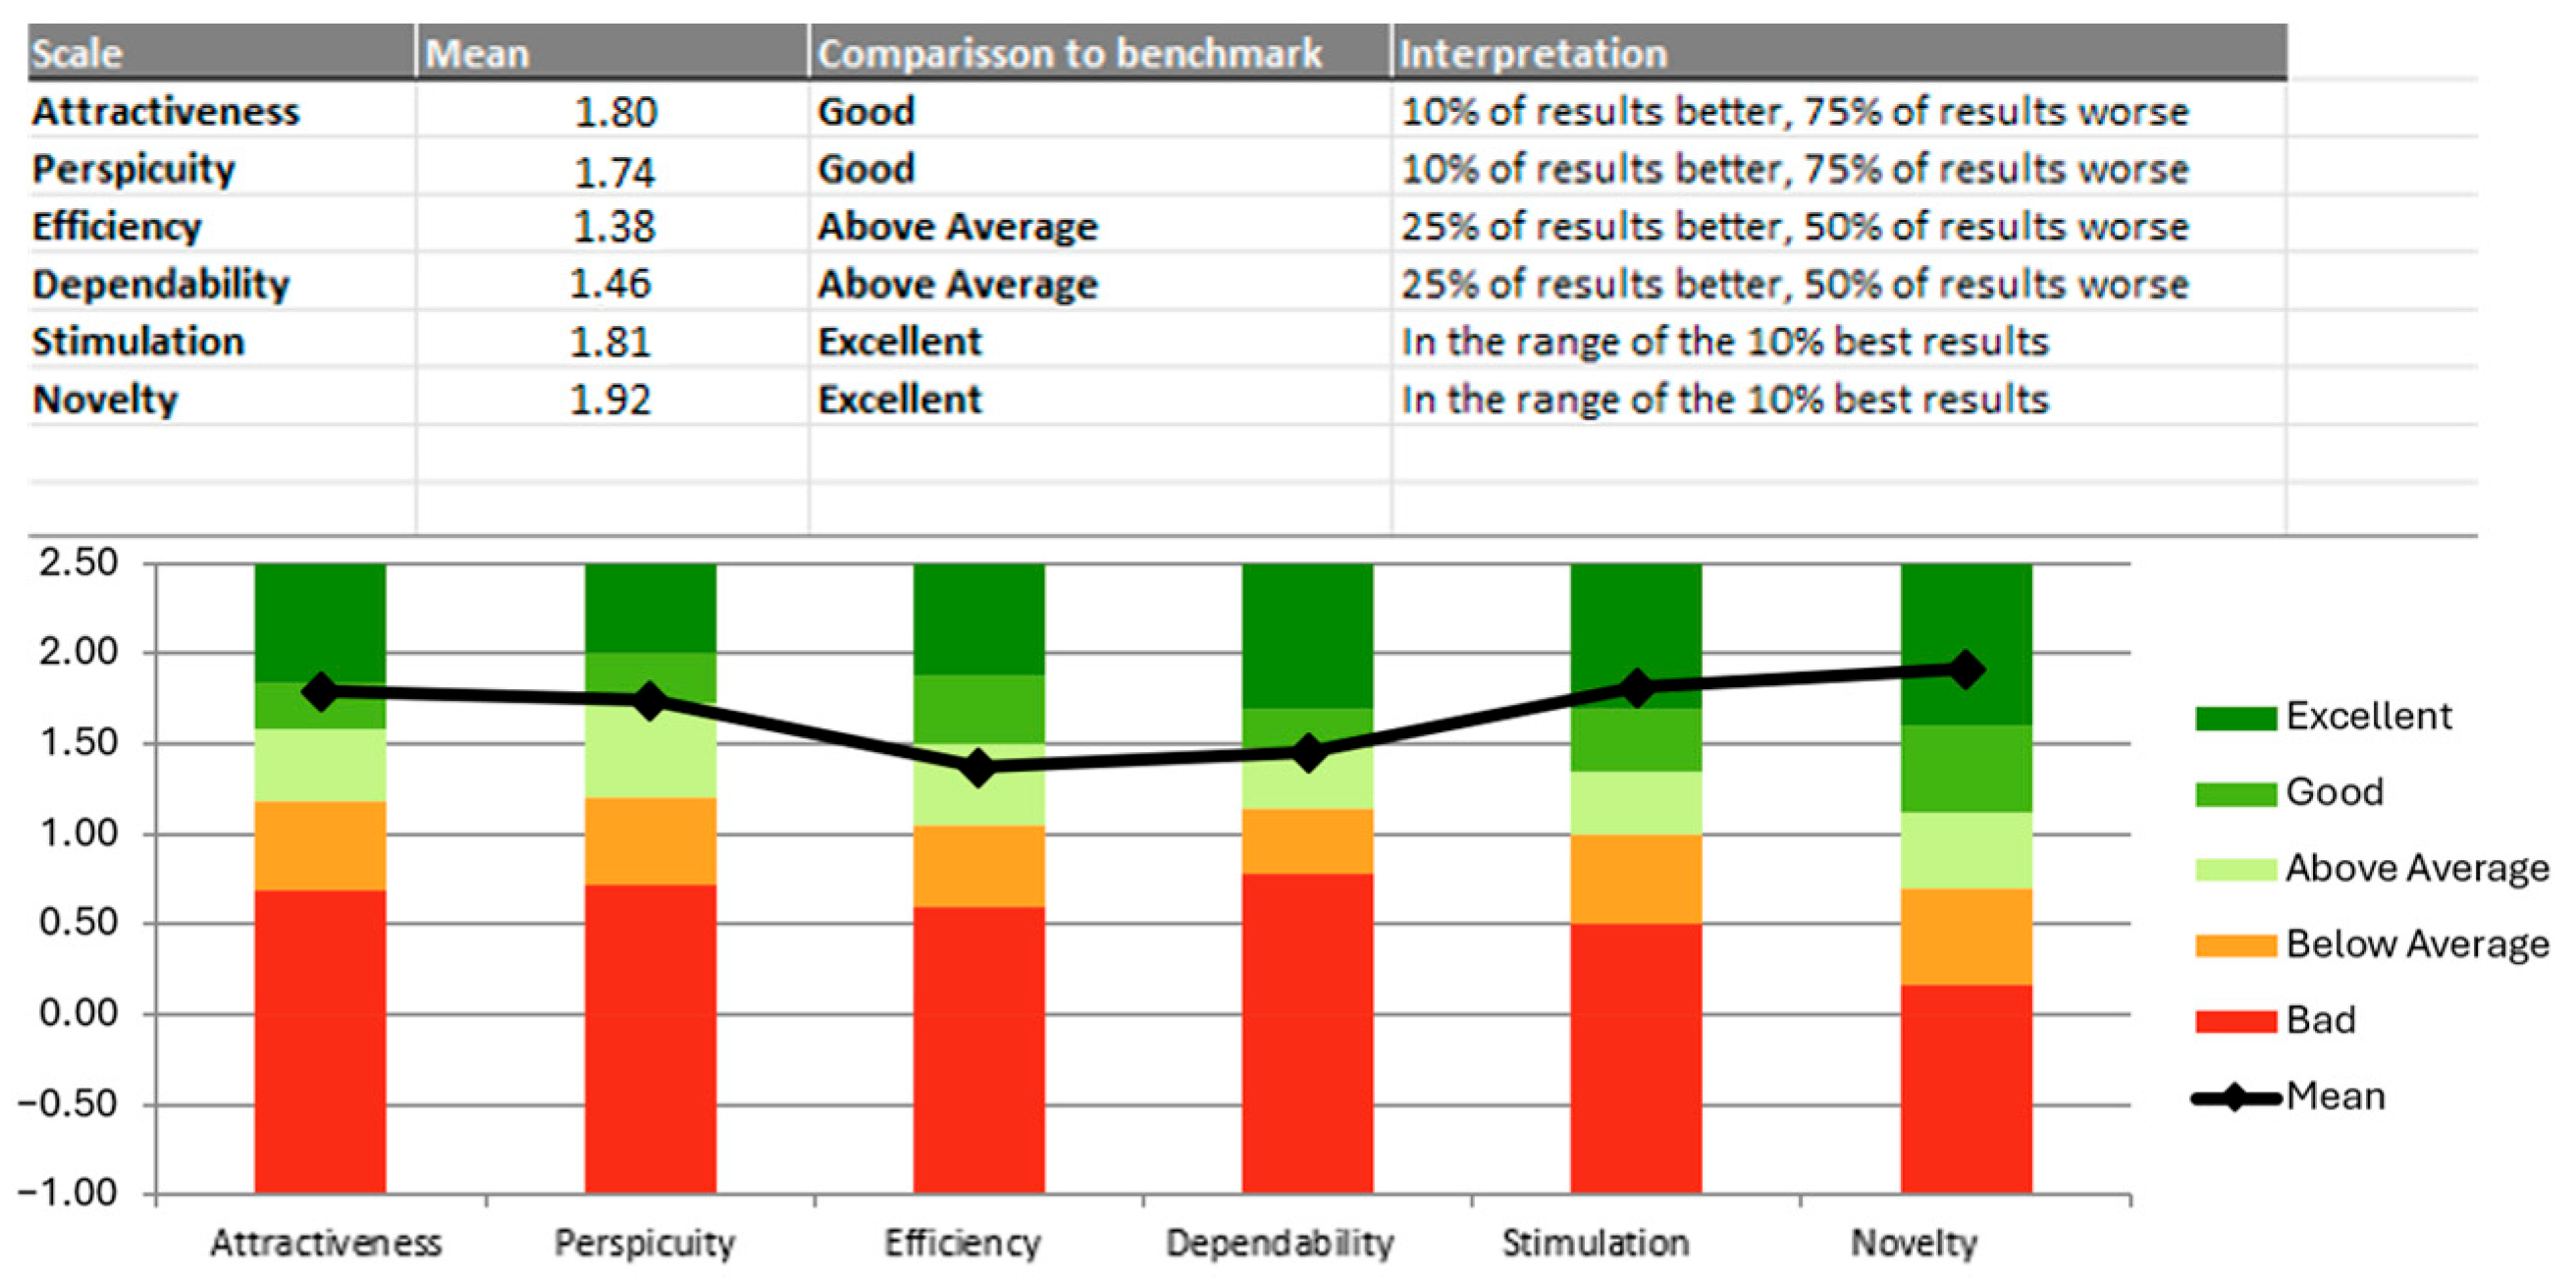
Analyzing the results (Table 4), the average score for 4 out of 6 areas was above 1.7, apart from Efficiency (mean = 1.375) and Dependability (mean = 1.456), which, nonetheless, returned satisfactory scores.
The UEQ analysis tool provides a graphical representation of the results obtained in the six areas, normally in the range from −3 to 3 and, in this case, in a reduced range from −2 to 2. This range was used to provide a very clear overview of the satisfactory results obtained (Figure 9).
A further method of analyzing the results, developed by Schrepp et al. (2017c), was used. This method requires that pragmatic qualities (Dependability, Perspicuity, Efficiency) and hedonic qualities (Stimulation, Novelty) are collected in two groups, leaving Attractiveness as a separate category. Even in this way, the three scores obtained were above 1.5 in the range of −3 to 3, certifying the good result achieved (Attractiveness 1.80, Pragmatic Quality 1.52 and Hedonic Quality 1.97).
Comparing the obtained scores with benchmarks derived from studies of 21,175 users from 468 different studies, as shown in Figure 10, the value obtained in each of the six areas is at least above average (Schrepp et al., 2017b). In the areas pertaining to Stimulation and Novelty, the value obtained was categorized as excellent. Even when looking at the confidence intervals, the results obtained in each area were still above the average.

4. Discussion

The findings of this study confirm that mobile AR applications provide a highly usable and stimulating interface for mechanical engineering students interacting with fluid machinery concepts. The SUS score categorized as “Good” and the UEQ scores rating “Excellent” in Stimulation and Novelty indicate a strong positive reception by the users.
Analyzing in detail the main aspects of the questions in the SUS test, it emerged that:
  • Q1: “I think that I would like to use this system frequently.”
  • Q7: “I would imagine that most people would learn to use this system very quickly.”
scored on average above 4, on a scale of 1 to 5 (for odd-numbered questions, the higher the score, the better the result is), highlighting how the students found the system easy and pleasant to use.
Similarly, the answers to questions:
  • Q8: “I found the system very cumbersome to use.”
  • Q10: “I needed to learn a lot of things before I could get going with this system.”
scored on average 2.2, on a scale of 1 to 5 (for even-numbered questions, the higher the score, the worse the result is), highlighting two aspects that required attention. Although the results were more than satisfactory, the answers to question Q8 showed that the system could be improved in terms of usability. As far as question Q10 is concerned, the scope for improvement is probably less extensive than for the system in general. The specificity of the subject under study ontologically implies minimum knowledge to use the system correctly and is therefore an aspect that has little to do with the development part.
Regarding the evaluation of familiarity levels, it is important to clarify that the absence of significant differences between students with higher and lower familiarity with immersive tools is limited strictly to the observed statistical results of this specific sample. Of course, while this suggests that the interface did not pose initial barriers due to prior exposure within this cohort, it does not imply a universally demonstrated accessibility or engagement across diverse learner groups.
Furthermore, comparing both instruments with their respective normative benchmark datasets (Bangor et al., 2008; Schrepp et al., 2017b) confirmed that the application performs consistently above average across different interpretative frameworks.

4.1. Comparison with Existing Literature

These results are largely consistent with recent literature investigating immersive technologies in engineering education. Similar to the findings of Wong et al. (2021) and Kate et al. (2025), our study confirms that AR tools significantly boost user engagement and interest compared to traditional 2D representations. The current literature highlights that AR applications act as a complementary tool rather than a full replacement for physical laboratories, effectively addressing the lack of hands-on visualization in modern education (Mendoza-Ramírez et al., 2023).
The results for the System Usability Scale are consistent with recent studies in industrial engineering, such as Messina et al.’s (2026) in computer-aided design and Rega et al.’s (2025) for sustainable operations. Focusing on CFD applications, the SUS scores from Solmaz and Van Gerven (2022) and Paryanto et al. (2026) are perfectly in line with the ones obtained in our study.
With regard to user experience, the high scores achieved across several dimensions of the UEQ highlight the scientific validity of this intervention, particularly as studies incorporating CFD topics and immersive technologies are prone to unfavorable results in terms of user experience (Christmann et al., 2022). Nevertheless, our outcomes are supported by recent literature demonstrating the effectiveness of combining immersive tools with CFD data. For instance, Solmaz and Van Gerven (2022) evaluated a VR learning environment for fluid dynamics and similarly observed a significant increase in the hedonic quality of the user experience. Their findings confirm that enabling direct interaction with CFD data, rather than relying on abstract 2D representations, makes the learning process highly exciting and interesting for engineering students. Recent studies in mechanical engineering education support this trend; for instance, Anggrawan et al. (2023) demonstrated that mobile AR applications for car engine systems not only yield high usability and engagement but also enable independent learning outcomes that surpass traditional face-to-face instruction. Although our study did not directly assess learning outcomes, the high usability and engagement scores obtained are consistent with this line of evidence and suggest that mobile AR interfaces support the kind of independent, self-paced exploration associated with improved learning in related studies. The convergence between those studies and our application suggests that well-designed immersive technology exploration strongly stimulates user engagement, novelty, and stimulation.
Additionally, our study provides a contribution to the ongoing debate regarding usability in AR. Previous systematic reviews, such as the one conducted by Ibáñez and Delgado-Kloos (2018) and the one by Ogunjobi et al. (2025), highlighted that AR applications in STEM can sometimes distract students if the interfaces do not properly assist the learning activity. By utilizing mobile devices and discretized CFD maps, our application aligns with the design guidelines proposed by Gattullo et al. (2022), which recommend using essential layouts and targeted virtual assets to convey information without overwhelming the user.
Finally, the absence of significant differences in scores between students with high and low familiarity with immersive tools is a particularly relevant finding. Recent empirical evaluations of mobile AR systems, such as those conducted by Marian-Vladut et al. (2025), demonstrate that intuitively designed smartphone interfaces yield high usability scores even among users with zero prior AR experience. This suggests that mobile-based AR, avoiding the complexity and hardware-related discomforts often experienced by novice users with head-mounted displays (Solmaz et al., 2024b), democratizes access to the learning tool (Sırakaya & Sırakaya, 2022; Kamińska et al., 2023).

4.2. Limitations

This study presents several limitations. First, the lack of a cognitive impact assessment prevents any definitive conclusions regarding objective improvements in learning retention or spatial reasoning compared to traditional 2D instruction. Second, the sample size is relatively small (45 students) and suffers from a severe gender imbalance (5 females vs. 40 males). Furthermore, while the gender imbalance reflects the current demographic reality of mechanical engineering cohorts, this skewed distribution heavily limits the generalization of the findings. Because spatial cognition and technological acceptance in AR environments can exhibit variations based on gender, the current results predominantly reflect a male-centric usability perspective. Consequently, these findings must be interpreted with caution, and future studies must aim for purposefully diverse and gender-balanced cohorts to validate these outcomes across a broader demographic. Finally, it is important to note that this study did not include students with diagnosed disabilities or specific learning difficulties.

5. Conclusions

The developed applications allow augmented reality visualization and interaction with a turbine blade model, enabling the display of specific components as well as fluid velocity and pressure maps around the blade.
By combining multiple representations and mobile access, the approach provides a highly usable interface and a positive user experience when exploring complex content, such as turbomachines. The high usability scores suggest that the tools were well-received by the target users; however, we emphasize that this study evaluated usability and user experience rather than objective learning gains. Inclusive education served as a design rationale rather than an empirically demonstrated outcome, particularly as the cohort did not include students with specific learning difficulties. Additionally, the observed statistical results showed that students’ familiarity with AR and VR tools did not significantly influence their feedback within this sample. While promising, this does not imply universally demonstrated accessibility across all learner groups.
Furthermore, considering that the applications can be used by smartphones or tablets, it is not necessary to purchase special equipment or use devices that may be cumbersome to wear for a long period of time, thus reducing two of the most common issues that limit the spread of augmented reality systems (Van Krevelen & Poelman, 2010; Howard et al., 2023).
In light of the findings of this preliminary study, there are grounds for future work to quantify the cognitive impact and objective learning retention with instruments such as the NASA Task Load Index, a widely used test (Hart & Staveland, 1988; Gervasi et al., 2023; Verna et al., 2024), and standardized performance tests. Additional sections of the questionnaire could be introduced to obtain deeper insights into students’ perceptions and effectiveness in learning processes, and future studies should include direct measures of conceptual learning and accessibility with more diverse learner groups.
Future developments will focus on making the application compatible with other operating systems, ensuring functionality on all mobile devices to further improve accessibility. Moreover, there is the potential to expand this use of immersive technologies to various areas of engineering education and other scientific fields that could benefit from similar interfaces, especially where multiple representations can support inclusive teaching.

Author Contributions

Conceptualization, M.M., T.I., A.I.M., E.P., V.R. and A.C.; methodology, M.M. and A.C.; software, M.M. and A.C.; validation, M.M. and A.C.; formal analysis, M.M.; investigation, M.M.; resources, T.I., E.P., V.R. and A.C.; data curation, M.M. and A.C.; writing—original draft preparation, M.M. and A.C.; writing—review and editing, M.M., T.I., A.I.M., E.P., V.R. and A.C.; visualization, M.M., A.I.M. and V.R.; supervision, T.I., E.P. and A.C.; project administration, M.M., T.I., A.I.M., E.P., V.R. and A.C.; funding acquisition, M.M. All authors have read and agreed to the published version of the manuscript.

Funding

This research was carried out within the MICS (Made in Italy—Circular and Sustainable) Extended Partnership and received funding from the European Union Next-Generation EU (PIANO NAZIONALE DI RIPRESA E RESILIENZA (PNRR)—MISSIONE 4 COMPONENTE 2, INVESTIMENTO 1.3—D.D. 1551.11–10-2022, PE00000004). This manuscript reflects only the authors’ views and opinions, neither the European Union nor the European Commission can be considered responsible for them.

Institutional Review Board Statement

Ethical review and approval were waived for this study due to the anonymous and non-invasive nature of the educational survey.

Informed Consent Statement

Informed consent for participation was obtained from all subjects involved in the study.

Data Availability Statement

The raw data supporting the conclusions of this article will be made available by the authors on request.

Conflicts of Interest

The authors declare no conflicts of interest. The funders had no role in the design of the study; in the collection, analyses, or interpretation of data; in the writing of the manuscript; or in the decision to publish the results.

Abbreviations

The following abbreviations are used in this manuscript:
ARAugmented Reality
VRVirtual Reality
CADComputer-Aided Design
CFDComputational Fluid Dynamics
XRExtended Reality
SUSSystem Usability Scale
UEQUser Experience Questionnaire
UDLUniversal Design for Learning
VRAMVideo Random Access Memory

Notes

1
2
https://www.sandc.com/, last accessed on 2 March 2026.

References

  1. Aggarwal, R., & Singhal, A. (2019, January 10–11). Augmented reality and its effect on our life. 9th International Conference on Cloud Computing, Data Science & Engineering (Confluence), Noida, India. [Google Scholar]
  2. Amouzgar, K., & Mousavi, M. (2025). Holomech: An extended reality tool for supporting student motivation and perceived spatial reasoning in structural mechanics. Virtual Reality, 29(3), 121. [Google Scholar] [CrossRef] [Scilit]
  3. Anggrawan, A., Syafitri, D. S. C., & Satria, C. (2023). Developing augmented reality learning and measuring its effect on independent learning compared to traditional learning. TEM Journal, 12, 975–987. Available online: https://www.ceeol.com/search/article-detail?id=1123818 (accessed on 17 August 2026). [CrossRef] [Scilit]
  4. Álvarez-Marín, A., Paredes-Velasco, M., Velázquez-Iturbide, J. Á., & Poblete-Castro, J. C. (2023). Augmented reality and education in electronics: Relationship between usability, academic performance, and emotions experienced in learning. Computer Applications in Engineering Education, 31(6), 1750–1760. [Google Scholar] [CrossRef] [Scilit]
  5. Bangor, A., Kortum, P. T., & Miller, J. T. (2008). An empirical evaluation of the system usability scale. International Journal of Human–Computer Interaction, 24(6), 574–594. [Google Scholar] [CrossRef] [Scilit]
  6. Brooke, J. (1996). SUS: A “quick and dirty” usability scale. In P. W. Jordan, B. Thomas, A. Weerdmeester, & I. L. McClelland (Eds.), Usability evaluation in industry (pp. 189–194). Taylor & Francis. Available online: https://www.taylorfrancis.com/chapters/edit/10.1201/9781498710411-35/sus-quick-dirty-usability-scale-john-brooke (accessed on 2 March 2026).
  7. Brown, M. B., & Forsythe, A. B. (1974). Robust tests for the equality of variances. Journal of the American Statistical Association, 69(346), 364. [Google Scholar] [CrossRef] [Scilit]
  8. CAST. (2024). CAST universal design for learning guidelines version 3.0. Available online: https://udlguidelines.cast.org (accessed on 17 August 2026).
  9. Chaudhary, M., Singh, G., Gaur, L., Mathur, N., & Kapoor, S. (2023, November 1–3). Leveraging unity 3D and Vuforia engine for augmented reality application development. 3rd International Conference on Technological Advancements in Computational Sciences (ICTACS), Tashkent, Uzbekistan. [Google Scholar]
  10. Chén, O. Y., Bodelet, J. S., Saraiva, R. G., Phan, H., Di, J., Nagels, G., Schwantje, T., Cao, H., Gou, J., Reinen, J. M., Xiong, B., Zhi, B., Wang, X., & de Vos, M. (2023). The roles, challenges, and merits of the p value. Patterns, 4(12), 100878. [Google Scholar] [CrossRef] [Scilit] [PubMed]
  11. Christmann, O., Fleury, S., Migaud, J., Raimbault, V., Poussard, B., Guitter, T., Gorisse, G., & Richir, S. (2022). Visualizing the invisible: User-centered design of a system for the visualization of flows and concentrations of particles in the air. Information Visualization, 21(3), 311–320. [Google Scholar] [CrossRef] [Scilit]
  12. Cirello, A., Ingrassia, T., & Nigrelli, V. (2018). Study of the performances of a fluid dynamic actuator. International Journal of Mechanical Engineering and Technology, 9, 859–866. Available online: http://iaeme.com/Home/issue/IJMET?Volume=9&Issue=5 (accessed on 2 March 2026).
  13. Desmond, A., Zhumabay, B., & Martin, J. (2014). Building on a traditional chemical engineering curriculum using computational fluid dynamics. Education for Chemical Engineers, 9, 85–93. [Google Scholar] [CrossRef] [Scilit]
  14. Feiner, S. (1996, June 3–4). Adding insight through animation in augmented reality. Computer Animation ’96 (pp. 14–15), Geneva, Switzerland. [Google Scholar]
  15. Field, A. (2013). Discovering statistics using IBM SPSS statistics (4th ed.). Sage Publications. [Google Scholar]
  16. Gattullo, M., Laviola, E., Boccaccio, A., Evangelista, A., Fiorentino, M., Manghisi, V. M., & Uva, A. E. (2022). Design of a mixed reality application for STEM distance education laboratories. Computers, 11(4), 50. [Google Scholar] [CrossRef] [Scilit]
  17. Gervasi, R., Capponi, M., Mastrogiacomo, L., & Franceschini, F. (2023). Manual assembly and human–robot collaboration in repetitive assembly processes: A structured comparison based on human-centered performances. The International Journal of Advanced Manufacturing Technology, 126(3–4), 1213–1231. [Google Scholar] [CrossRef] [Scilit]
  18. Grannum, J., Siiman, L., & Tamm, A. (2024, December 17–19). Enhancing spatial thinking in anatomy education with digital 3D Tools: A systematic literature review of comparative studies. International Conference on Computer and Applications (ICCA), Cairo, Egypt. [Google Scholar]
  19. Grier, R. A., Bangor, A., Kortum, P., & Peres, S. C. (2013). The system usability scale: Beyond standard usability testing. Proceedings of the Human Factors and Ergonomics Society Annual Meeting, 57(1), 187–191. [Google Scholar] [CrossRef] [Scilit]
  20. Hart, S. G., & Staveland, L. E. (1988). Development of NASA-TLX (Task Load Index): Results of empirical and theoretical research. Advances in Psychology, 52, 139–183. [Google Scholar] [CrossRef] [Scilit]
  21. Hinderks, A., Schrepp, M., Mayo, F. J. D., Escalona, M. J., & Thomaschewski, J. (2019). Developing a UX KPI based on the user experience questionnaire. Computer Standards & Interfaces, 65, 38–44. [Google Scholar] [CrossRef] [Scilit]
  22. Howard, S., Jang, R., O’Keeffe, V., Manning, K., Trott, R., Hordacre, A. L., & Spoehr, J. (2023). Visual inspection with augmented reality head-mounted display: An Australian usability case study. Human Factors and Ergonomics in Manufacturing & Service Industries, 33(3), 272–296. [Google Scholar] [CrossRef] [Scilit]
  23. Hung, H. M. J., O’NEill, R. T., Bauer, P., & Köhne, K. (1997). The behavior of the p-value when the alternative hypothesis is true. Biometrics, 53(1), 11–22. [Google Scholar] [CrossRef] [Scilit]
  24. Ibáñez, M., & Delgado-Kloos, C. (2018). Augmented reality for STEM learning: A systematic review. Computers & Education, 123, 109–123. [Google Scholar] [CrossRef] [Scilit]
  25. Jun, Y. (2023). The differential effects of virtual reality (VR) on the novice and experienced VR users. Asia Marketing Journal, 25(2), 61–70. [Google Scholar] [CrossRef] [Scilit]
  26. Kamińska, D., Zwoliński, G., Laska-Leśniewicz, A., Raposo, R., Vairinhos, M., Pereira, E., Urem, F., Hinić, M. L., Haamer, R. E., & Anbarjafari, G. (2023). Augmented reality: Current and new trends in education. Electronics, 12(16), 3531. [Google Scholar] [CrossRef] [Scilit]
  27. Kancherla, A. R., Rolland, J. P., Wright, D. L., & Burdea, G. (1995). A novel virtual reality tool for teaching dynamic 3D anatomy. In N. Ayache (Ed.), Computer vision, virtual reality and robotics in medicine. CVRMed 1995 (Vol. 905). Lecture Notes in Computer Science. Springer. [Google Scholar] [CrossRef]
  28. Kate, P., Madireedy, L., & Sontakke, A. (2025, September 10–12). A comparative study of conventional learning vs. AI–AR enhanced models. 6th International Conference on Electronics and Sustainable Communication Systems (ICESC), Coimbatore, India. [Google Scholar]
  29. Khurana, A., & Chilana, P. K. (2024, October 5–9). Understanding novice users’ mental models of gesture discoverability and designing effective onboarding. UbiComp Companion 2024—The 2024 ACM International Joint Conference on Pervasive and Ubiquitous Computing, Melbourne, VIC, Australia. [Google Scholar]
  30. Kim, R., Kim, J., Lee, I., Yeo, U., Lee, S., & Decano-Valentin, C. (2021). Development of three-dimensional visualisation technology of the aerodynamic environment in a greenhouse using CFD and VR technology, Part 2: Development of an educational VR simulator. Biosystems Engineering, 207, 12–32. [Google Scholar] [CrossRef] [Scilit]
  31. Koo, M., & Yang, S. (2025). Likert-type scale. Encyclopedia, 5(1), 18. [Google Scholar] [CrossRef] [Scilit]
  32. Koutromanos, G., Pittara, T., & Tripoulas, C. (2020). “Clavis Aurea”: An augmented reality game for the teaching of local history. European Journal of Engineering Research and Science, Special Issue CIE, 1–8. Available online: https://mail.ej-eng.org/index.php/ejeng/article/view/2310 (accessed on 17 August 2026).
  33. Krueger, M. W. (1985). Videoplace: A report from the artificial reality laboratory. Leonardo, 18(3), 145. [Google Scholar] [CrossRef] [Scilit]
  34. Laugwitz, B., Held, T., & Schrepp, M. (2008). Construction and evaluation of a user experience questionnaire. In Proceedings of the symposium of the Austrian HCI and usability engineering group, Graz, Austria, 20–21 November 2008 (pp. 63–76). Springer. [Google Scholar] [CrossRef] [Scilit]
  35. Lin, J., Cao, J., Zhang, J., van Treeck, C., & Frisch, J. (2019). Visualization of indoor thermal environment on mobile devices based on augmented reality and computational fluid dynamics. Automation in Construction, 103, 26–40. [Google Scholar] [CrossRef] [Scilit]
  36. Liu, G., & Zhang, X. (2026). Enhancing student creativity in AIGC design education: The mediating role of learning motivation in reverse engineering pedagogy. Frontiers in Psychology, 17, 1829753. [Google Scholar] [CrossRef] [Scilit] [PubMed]
  37. Marian-Vladut, T., Octavian, T. C., & Paul, P. (2025). Evaluating User Acceptance and Usability of AR-Based Indoor Navigation in a University Setting: An Empirical Study. International Journal of Advanced Computer Science and Applications, 16(4). [Google Scholar] [CrossRef] [Scilit]
  38. Masneri, S., Domínguez, A., Pacho, G., Zorrilla, M., Larrañaga, M., & Arruarte, A. (2024). A collaborative AR application for education: From architecture design to user evaluation. Virtual Reality, 28(1), 42. [Google Scholar] [CrossRef] [Scilit]
  39. McKnight, P. E., & Najab, J. (2010). The Corsini encyclopedia of psychology (I. B. Weiner, & W. E. Craighead, Eds.). John Wiley & Sons, Inc. [Google Scholar] [CrossRef] [Scilit]
  40. Mendoza-Ramírez, C. E., Tudon-Martinez, J. C., Félix-Herrán, L. C., Lozoya-Santos, J. d. J., & Vargas-Martínez, A. (2023). Augmented reality: Survey. Applied Sciences, 13(18), 10491. [Google Scholar] [CrossRef] [Scilit]
  41. Messina, M., Ingrassia, T., Mirulla, A. I., Ricotta, V., & Cirello, A. (2026). Effectiveness of augmented reality visualisations in engineering cad education. In G. Berselli, A. O. Andrisano, P. Di Stefano, C. Rizzi, & F. Gherardini (Eds.), Design tools and methods in industrial engineering V. ADM 2025 (Lecture Notes in Mechanical Engineering). Springer. [Google Scholar] [CrossRef] [Scilit]
  42. Mourtzis, D., Angelopoulos, J., & Panopoulos, N. (2022). Challenges and opportunities for integrating augmented reality and computational fluid dynamics modeling under the framework of Industry 4.0. Procedia CIRP, 106, 215–220. [Google Scholar] [CrossRef] [Scilit]
  43. Ogunjobi, D. T., Abu, S., Ajayi, A. B., Emenike, M. I., Obong, E. E., & Mensah, T. K. (2025). A systematic review of augmented and virtual reality for STEM learning: Engagement, cognitive load, and transfer outcomes. Australian Journal of Biomedical Research, 1(2), aubm010. [Google Scholar] [CrossRef] [Scilit] [PubMed]
  44. Paryanto, P., Ilyasa, V., Cahyo, N., Baskoro, S. I., & Tauviqirrahman, M. (2026). Design and evaluation of the implementation of augmented reality (AR) integrated with computational fluid dynamics (CFD) as a maintenance support system. Cogent Engineering, 13(1), 2620870. [Google Scholar] [CrossRef] [Scilit]
  45. Pinter, L., & Siddiqui, M. F. H. (2024). Enhancing calculus learning through interactive VR and AR technologies: A study on immersive educational tools. Multimodal Technologies and Interaction, 8(3), 19. [Google Scholar] [CrossRef] [Scilit]
  46. Qu, J., Ma, B., Zheng, L., & Kang, Y. (2022). Design and implementation of teaching assistant system for mechanical course based on mobile AR technology. International Journal of Advanced Computer Science and Applications, 13(4). [Google Scholar] [CrossRef] [Scilit]
  47. Rega, A., Ciampi, F. G., Zanella, A., Ismail, A., & Patalano, S. (2025). Implementation and evaluation of an Augmented Reality framework for sustainable practices in Industry 5.0. Advances in Industrial and Manufacturing Engineering, 11, 100166. [Google Scholar] [CrossRef] [Scilit]
  48. Rekoff, M. G. (1985). On reverse engineering. IEEE Transactions on Systems, Man, and Cybernetics, SMC-15(2), 244–252. [Google Scholar] [CrossRef] [Scilit]
  49. Schrepp, M., Cota, M. P., Gonçalves, R., Hinderks, A., & Thomaschewski, J. (2017a). Adaption of user experience questionnaires for different user groups. Universal Access in the Information Society, 16(3), 629–640. [Google Scholar] [CrossRef] [Scilit]
  50. Schrepp, M., Hinderks, A., & Thomaschewski, J. (2017b). Construction of a benchmark for the user experience questionnaire (UEQ). International Journal of Interactive Multimedia and Artificial Intelligence, 4(4), 40–44. [Google Scholar] [CrossRef] [Scilit]
  51. Schrepp, M., Hinderks, A., & Thomaschewski, J. (2017c). Design and evaluation of a short version of the user experience questionnaire (UEQ-S). International Journal of Interactive Multimedia and Artificial Intelligence, 4(6), 103–108. [Google Scholar] [CrossRef] [Scilit]
  52. Shapiro, S. S., & Wilk, M. B. (1965). An analysis of variance test for normality (complete samples). Biometrika, 52, 591–611. [Google Scholar] [CrossRef] [Scilit]
  53. Singh, G., & Ahmad, F. (2024). An interactive augmented reality framework to enhance the user experience and operational skills in electronics laboratories. Smart Learning Environments, 11(1), 5. [Google Scholar] [CrossRef] [Scilit]
  54. Sırakaya, M., & Sırakaya, D. A. (2022). Augmented reality in STEM education: A systematic review. Interactive Learning Environments, 30(8), 1556–1569. [Google Scholar] [CrossRef] [Scilit]
  55. Solmaz, S., Gerling, K., Kester, L., & Van Gerven, T. (2024a). Behavioral intention, perception and user assessment in an immersive virtual reality environment with CFD simulations. Virtual Reality, 28(2), 88. [Google Scholar] [CrossRef] [Scilit]
  56. Solmaz, S., Kester, L., & Van Gerven, T. (2024b). An immersive virtual reality learning environment with CFD simulations: Unveiling the Virtual Garage concept. Education and Information Technologies, 29(2), 1455–1488. [Google Scholar] [CrossRef] [Scilit] [PubMed]
  57. Solmaz, S., & Van Gerven, T. (2022). Automated integration of extract-based CFD results with AR/VR in engineering education for practitioners. Multimedia Tools and Applications, 81(11), 14869–14891. [Google Scholar] [CrossRef] [Scilit]
  58. Suhail, N., Bahroun, Z., & Ahmed, V. (2024). Augmented reality in engineering education: Enhancing learning and application. Frontiers in Virtual Reality, 5, 1461145. [Google Scholar] [CrossRef] [Scilit]
  59. Sun, R., Wu, Y. J., & Cai, Q. (2019). The effect of a virtual reality learning environment on learners’ spatial ability. Virtual Reality, 23(4), 385–398. [Google Scholar] [CrossRef] [Scilit]
  60. Sutherland, I. E. (1968, December 9–11). A head-mounted three dimensional display. Fall Joint Computer Conference, Part I, San Francisco, CA, USA. [Google Scholar]
  61. Teutscher, D., Weckerle, T., Öz, Ö. F., & Krause, M. J. (2022). Interactive scientific visualization of fluid flow simulation data using AR technology—Open-source library OpenVisFlow. Multimodal Technologies and Interaction, 6(9), 81. [Google Scholar] [CrossRef] [Scilit]
  62. Thiese, M. S., Ronna, B., & Ott, U. (2016). P value interpretations and considerations. Journal of Thoracic Disease, 8(9), E928–E931. [Google Scholar] [CrossRef] [Scilit] [PubMed]
  63. Toto, G. A., Marinelli, C. V., Cavioni, V., di Furia, M., Traetta, L., Iuso, S., & Petito, A. (2024). What is the role of technologies for inclusive education? A systematic review. In G. Casalino, R. Di Fuccio, G. Fulantelli, P. Raviolo, P. C. Rivoltella, D. Taibi, & G. A. Toto (Eds.), Higher education learning methodologies and technologies online. HELMeTO 2023 (Vol. 2076). Communications in Computer and Information Science. Springer. [Google Scholar] [CrossRef] [Scilit]
  64. Travers, J. C., Cook, B. G., & Cook, L. (2017). Null hypothesis significance testing and p values. Learning Disabilities Research & Practice, 32(4), 208–215. [Google Scholar] [CrossRef] [Scilit]
  65. Van Krevelen, D., & Poelman, R. (2010). A survey of augmented reality technologies, applications and limitations. International Journal of Virtual Reality, 9(2), 1–20. [Google Scholar] [CrossRef] [Scilit]
  66. Verna, E., Puttero, S., Genta, G., & Galetto, M. (2024). Real-time monitoring of human and process performance parameters in collaborative assembly systems using multivariate control charts. Journal of Intelligent & Robotic Systems, 110(3), 126. [Google Scholar] [CrossRef] [Scilit]
  67. Wakjira, Y., Kurukkal, N. S., & Lemu, H. G. (2024). Reverse engineering in medical application: Literature review, proof of concept and future perspectives. Scientific Reports, 14(1), 1–19. [Google Scholar] [CrossRef] [Scilit] [PubMed]
  68. Welch, B. L. (1947). The generalization of “Student’s” problem when several different population variances are involved. Biometrika, 34, 28. [Google Scholar] [CrossRef] [Scilit]
  69. Wong, C. H. S., Tsang, K. C. K., & Chiu, W. (2021). Using augmented reality as a powerful and innovative technology to increase enthusiasm and enhance student learning in higher education chemistry courses. Journal of Chemical Education, 98(11), 3476–3485. [Google Scholar] [CrossRef] [Scilit]
  70. Zhong, B., Liu, X., & Li, X. (2024). Effects of reverse engineering pedagogy on students’ learning performance in STEM education: The bridge-design project as an example. Heliyon, 10(2), e24278. [Google Scholar] [CrossRef] [Scilit] [PubMed]
Figure 1. Standard 2D representation of the profile of an impeller blade (authors’ original elaboration).
Education 16 01414 g001
Figure 2. (a) HP-L-20.8 scanner by HEXAGON METROLOGY; (b) the reconstructed CAD model of the blade.
Education 16 01414 g002
Figure 3. Main view of the first application.
Education 16 01414 g003
Figure 4. Main view of the second application.
Education 16 01414 g004
Figure 5. Main view of the third application.
Education 16 01414 g005
Figure 6. A student using the application.
Education 16 01414 g006
Figure 7. Distribution of familiarity levels.
Education 16 01414 g007
Figure 8. System Usability Scale (SUS) score classification (Bangor et al., 2008).
Education 16 01414 g008
Figure 9. User Experience Questionnaire (UEQ) scores in range of −2 to 2 (the green area indicates a positive evaluation, the yellow area a neutral evaluation, and the red area a negative evaluation).
Education 16 01414 g009
Figure 10. Comparison to User Experience Questionnaire (UEQ) benchmark.
Education 16 01414 g010
Table 1. System Usability Scale (SUS) questionnaire.
Question1
(Strongly Disagree)
2345
(Strongly Agree)
1. I think that I would like to use this system frequently.
2. I found the system unnecessarily complex.
3. I thought the system was easy to use.
4. I think that I would need the support of a technical person to be able to use this system.
5. I found the various functions in this system were well integrated.
6. I thought there was too much inconsistency in this system.
7. I would imagine that most people would learn to use this system very quickly.
8. I found the system very cumbersome to use.
9. I felt very confident using the system.
10. I needed to learn a lot of things before I could get going with this system.
Table 2. User Experience Questionnaire (UEQ).
1 2 3 4 5 6 7
annoyingo o o o o o oenjoyable
not understandableo o o o o o ounderstandable
creativeo o o o o o odull
easy to learno o o o o o odifficult to learn
valuableo o o o o o oinferior
boringo o o o o o oexciting
not interestingo o o o o o ointeresting
unpredictableo o o o o o opredictable
fasto o o o o o oslow
inventiveo o o o o o oconventional
obstructiveo o o o o o osupportive
goodo o o o o o obad
complicatedo o o o o o oeasy
unlikeableo o o o o o opleasing
usualo o o o o o oleading edge
unpleasanto o o o o o opleasant
secureo o o o o o onot secure
motivatingo o o o o o odemotivating
meets expectationso o o o o o odoes not meet expectations
inefficiento o o o o o oefficient
clearo o o o o o oconfusing
impracticalo o o o o o opractical
organizedo o o o o o ocluttered
attractiveo o o o o o ounattractive
friendlyo o o o o o ounfriendly
conservativeo o o o o o oinnovative
Table 3. Statistical test results.
GroupnSUSStandard DeviationStatisticp-Value
Shapiro–Wilk testHigh familiarity1874.0315.5W = 0.9480.400
Low familiarity2773.5213.9W = 0.9510.229
Levene’s testComparison of High- and Low-familiarity groups---F = 0.2210.640
Independent samples t-testHigh familiarity1874.0315.5--
Low familiarity2773.5213.9--
Comparison of High- and Low-familiarity groups---t = 0.1130.911
Table 4. UEQ scores.
UEQ ScaleMeanVariance
Attractiveness1.7960.91
Perspicuity1.7380.96
Efficiency1.3750.93
Dependability1.4560.66
Stimulation1.8130.85
Novelty1.9190.49
Disclaimer/Publisher’s Note: The statements, opinions and data contained in all publications are solely those of the individual author(s) and contributor(s) and not of MDPI and/or the editor(s). MDPI and/or the editor(s) disclaim responsibility for any injury to people or property resulting from any ideas, methods, instructions or products referred to in the content.