Article

Early Childhood Educators’ AI Literacy: Validation of the Meta-AI Literacy Scale in a Greek Context


by
Stamatios Papadakis
1,*,
Anastasia Vatou
2 and
Zacharias Andreadakis
3
1
Department of Preschool Education, University of Crete, 74100 Rethymno, Greece
2
Department of Early Childhood Education and Care, International Hellenic University, 57400 Thessaloniki, Greece
3
KINDKnow Research Center, Department of Pedagogy, Religion and Social Studies, Western Norway University of Applied Sciences, 5063 Bergen, Norway
*
Author to whom correspondence should be addressed.
Educ. Sci. 2026, 16(7), 1117; https://doi.org/10.3390/educsci16071117
Submission received: 7 May 2026 / Revised: 4 July 2026 / Accepted: 9 July 2026 / Published: 13 July 2026

Abstract

This study adapted the Meta-AI Literacy Scale (MAILS) for Greek early childhood educators and examined whether its nine-factor structure could be replicated in a new linguistic, professional, and educational context. A total of 475 participants took part in two samples: an exploratory factor analysis with one sample (n = 133) and a confirmatory factor analysis with an independent sample (n = 342). The analyses supported the original nine-factor structure. Internal consistency was satisfactory across subscales (McDonald’s ω = 0.84–0.96), and evidence for convergent and discriminant validity was acceptable. Positive attitudes toward AI were associated with most MAILS dimensions, whereas negative attitudes showed only weak and mostly non-significant associations. These findings suggest that apprehension toward AI may not be reducible to perceived competence alone. The study provides initial evidence that the nine-factor structure of the MAILS can be replicated with Greek early childhood educators. Because measurement invariance was not tested, these findings do not establish metric or scalar equivalence with the original version, and scores from the two versions cannot yet be compared directly. Further work is needed on invariance testing, predictive validity, and behavioral indicators of AI literacy.

1. Introduction

The Algorithmic Turn

Until late 2022, artificial intelligence was, for most of the world, a fringe phenomenon. Scientists working within the field understood AI’s transformative potential, and fragments of its progress occasionally surfaced in public discourse. Yet, for many people, AI belonged to the same imaginative register as interstellar travel or synthetic life: impressive in the abstract, irrelevant in practice. Its landmark accomplishments included defeating world champions at Go, generating protein structures, and producing uncanny images from text. These read less like engineering milestones and more like something happening in a distant, abstract field. Even its foundational philosophy carried the flavor of science fiction: machines that learn on a superhuman level, generalizable systems that could see and process beyond disciplinary bounds, architectures that could address our daily menial or lofty needs. Language alone kept it at a safe conceptual distance, something to marvel at or worry about in the future tense. Then, in a matter of weeks, that sci-fi distance collapsed. The release of large generative models to the public did not introduce AI into daily life so much as reveal that it had already arrived and was waiting to be noticed. The shift was, mildly put, tectonic. Within months, AI migrated from a topic that educators, policymakers, or the public could defer thinking about to one they could not ignore without professional cost. Algorithmic tools penetrated institutional routines with remarkable speed, filtering information, generating student-facing content, and restructuring assessment pipelines. This pace outran regulatory frameworks and left practitioners scrambling to distinguish genuine pedagogical opportunity from spectacle (Black & Van Esch, 2021; Haleem et al., 2022; Zhai et al., 2021). In education, the disruption has been particularly acute. Now, at the time of writing this study, intelligent tutoring systems and generative models are no longer fringe supplements. Rather, they sit deeply and irreversibly inside the daily architecture of teaching and grading, whether individual early childhood educators chose to put them there or not (Chen et al., 2020; Ng et al., 2023; Southworth et al., 2023).
Yet, available AI is different from understandable AI. This distinction, elementary as it sounds, carries weight in education that policy discussions have consistently underestimated. The generative AI tools now embedded in teaching practice do not withhold themselves from users. They do the very opposite. They produce lesson plans, assessment rubrics, feedback drafts, and reading summaries with notable speed and surface fluency. Yet nothing in that experience teaches the educator where the output originated, what was silently excluded, what was invented, or whether the model’s confidence reflects actual reliability or merely syntactic fluency. Biases encoded in training data, the fabrication of nonexistent references, the quiet drift from factual accuracy: none of this is legible at the interface (Gray et al., 2018; Markham, 2020). The result is not a knowledge gap in the traditional sense. It is an epistemic overload: practitioners are surrounded by material they can use but cannot evaluate. European policy has not been blind to this condition. DigCompEdu (Redecker, 2017) sets out educator competences for digital environments, but it treats digital competence broadly and does not address AI directly. Two more recent documents are AI-specific. Miao and Cukurova (2024), in UNESCO’s AI Competency Framework for Teachers, define the knowledge, skills, and values teachers are expected to develop for AI, set out across five aspects and three progression levels. Bekiaridis and Attwell (2024), in the AI Pioneers project, supplement DigCompEdu with AI-related competences for educators, mapped onto its six competence areas. At the regulatory level, the Council of Europe Framework Convention on Artificial Intelligence (Council of Europe, 2024) and the EU AI Act (European Parliament & Council of the European Union, 2024) add legal weight to what had until recently been advisory guidance, treating AI literacy as something institutions are expected to support. Yet for all this activity, the frameworks share a conspicuous structural gap: they specify competences without establishing whether any available instrument can detect them. The demand for measurement has outrun the supply, and the question of whether practitioners possess the capacities these documents describe, or merely report that they do, is one that has so far been left largely to empirical research, where it remains only partly addressed.
This condition is general across education, but it acquires a specific gravity in the sensitive field of early childhood education and care (ECEC). Traditionally, ECEC practitioners were professionally formed in traditions that foreground relational attunement, embodied care, and developmental sensitivity. In that tradition, computational reasoning has occupied a marginal position in ECEC curricula, when it has appeared at all. The neglect is not accidental. It reflects a disciplinary formation in which relational and computational competences were treated as belonging to different professional worlds, the former to early childhood, the latter to older age groups and more technically oriented fields. That division held for a long time. It no longer does. Papadakis (2025) has argued that computer science education in ECEC must be reframed for the age of generative AI, moving past the equation of computational thinking with coding toward a broader set of reasoning capacities the profession has left unexamined. Preliminary efforts to introduce programming environments such as ScratchJr into early childhood classrooms have demonstrated feasibility. They have also made visible, however, how fragile the supporting infrastructure becomes once a pilot moves into an actual classroom (Louka & Papadakis, 2024). Yet, ECEC educators are now expected to exercise a new kind of judgment, that is, deciding which algorithmically generated content to adopt, which to modify, and which to discard, in a domain where every curricular choice carries formative weight (Andreadakis et al., 2025). Unsurprisingly, incidental exposure to AI tools does not produce this judgment, any more than administering standardized tests produces psychometric competence. If the professional integrity of the field is to be supported under conditions of pervasive automation, the AI literacy of its practitioners must be deliberately cultivated and assessed. That assessment, however, raises difficult prior questions. What does AI readiness consist of in a practitioner whose professional identity rests on responsiveness and contextual judgment rather than technical proficiency? Can constructs developed in one linguistic and cultural setting be assumed to measure the same thing elsewhere? And does the field possess instruments precise enough to ground its claims, or is it building on frail psychometric foundations that have never been tested beyond their conditons of origin (Lund et al., 2023; Ng et al., 2024; Wienrich & Carolus, 2021; Yang et al., 2025)? Finally, a further question drives this study. European professional development policy treats negative attitudes toward AI as a symptom of insufficient knowledge, with training being prescribed as a remedy. However, can we empirically test whether competence and apprehension occupy the same dimension or operate independently? In response to these open questions, our study took its moorings from the MAILS architecture, which directly embodies a meta-competency logic: rather than treating AI literacy as a fixed knowledge inventory, it captures the self-regulatory and affective capacities that allow practitioners to keep updating their knowledge as the technology evolves. This is precisely the layer of readiness that ECEC professionals require, and that conventional scales have consistently failed to assess.

2. Background: The Consolidation of a Field

These questions on how to understand AI are not random scientific afterthoughts. Rather, they belong to a research program that has been gaining mass since 2018, which is organized around a powerful construct: AI literacy. That term now saturates the literature (see Yang et al., 2025). It appears in curricular guidelines, in national policy documents, in the mission statements of funding bodies that five years ago had no AI line item at all (Lintner, 2024; Long & Magerko, 2020; Markham, 2020; Ng et al., 2021a, 2021b, 2022a, 2022b, 2024; Southworth et al., 2023; Su & Yang, 2022; Su et al., 2022, 2023; Tenório et al., 2023; Tiernan et al., 2023; B. Wang et al., 2023; S. Wang et al., 2022; Yang et al., 2025). Popularity, of course, is not validity. A construct can be widely adopted and still poorly defined. But AI literacy, whatever its growing pains, did not appear from thin air. It descended primarily from two older constructs, digital literacy and data literacy, and it inherited assumptions from both (see Yang et al., 2025; cf. Long & Magerko, 2020; Ng et al., 2021b). Yet, it also broke with both. Digital literacy presumed a stable technological substrate. Data literacy presumed the core challenge was interpretation of fixed datasets. AI literacy presumes neither stability nor fixity. It refers to a set of competencies, namely, evaluating AI outputs, understanding system behavior at a functional level, and collaborating with automated tools deliberately rather than by default, that must hold up even as the technology underneath them changes between semesters (Long & Magerko, 2020; Ng et al., 2021b). That set of competencies is, in other words, a moving target. The earlier frameworks were aiming at something that stood still.
So far, Yang et al. (2025) offer the most thorough accounting of how the field arrived at its current shape. Their extensive bibliometric review spans a full decade, 2014 to 2024, and covers 335 published studies. Two things stand out. First, there is the sheer pace of growth. Between 2014 and 2017, the literature was thin, scattered, exploratory, confined to computer science education journals. After 2018, publication volume climbed steeply and has not leveled off. Second, and more instructive, is what happened to the field internally as it grew. It did not cohere into a single program. It splintered. Yang and colleagues identify four distinct research streams that now run in parallel, overlapping at points but pursuing different questions with different methods. One stream ties machine learning and computational thinking to assessment practices, work that became urgent the moment generative models entered classrooms. A second links information literacy to technology acceptance, centering on the problem of user trust. A third deals with data ethics and privacy. The fourth addresses digital competency in a broader, less technically specified sense (Yang et al., 2025). These are not rival camps. But neither are they speaking the same language, and the field has not yet reckoned fully with the integrative work that remains.
The fragmentation runs deeper than research streams. Yang et al. (2025) also identify nine foundational pillars on which the AI literacy literature rests, and tracing the evolution of those pillars tells a story worth pausing over. The earliest work was grounded in what one might expect: data literacy, machine learning fundamentals, computational thinking—hard skills with clear boundaries. Had the field stopped there, measurement would have been comparatively simple. It did not stop there. As AI systems moved out of laboratories and into the routines of ordinary professional life, researchers began noticing that technical knowledge alone was a poor predictor of how people engaged with these tools. The discourse absorbed psychological dimensions; namely, the technology acceptance model, with its emphasis on perceived usefulness and trust, became a fixture. So did accountability frameworks concerned with algorithmic bias and the ethics of automated decision-making. Then a third layer appeared, less about the individual user and more about the information environment they inhabit: media literacy, digital verification, academic integrity under conditions of automated content production, questions about creative authorship when a machine can generate plausible text on demand. Each layer added explanatory power. Each also added complexity. The cumulative picture is that AI literacy, as it is currently understood, is not one skill. On the contrary, it is a tangle of cognitive, affective, and sociocultural threads, and any attempt to assess it that mistakes this entanglement for a quick checklist or a single-factor inventory will miss most of what matters (Carolus et al., 2023; Kong et al., 2023).

3. State of the Art: The Measurement Gap of AI Literacy

The construct of AI literacy has matured substantially since 2018. However, the tools built to measure it have often been criticized as not catching up (Lintner, 2024). That asymmetry is the central methodological problem facing AI literacy research today, and Lintner (2024) documents it in detail. Working within the COSMIN framework, Lintner reviewed 22 studies reporting on 16 separate instruments. Some of the findings are reassuring. A number of scales show acceptable structural validity. Internal consistency figures are within defensible ranges. But reassurance fades quickly once you look at what sits beneath those numbers.
Thirteen of the sixteen instruments are self-report measures. Three use performance-based formats. That ratio alone should give the field pause. Self-report captures perceived competence, that is, what a respondent believes they can do. It does not capture empirically demonstrated competence, that is, what they do when placed in front of an AI system and asked to evaluate its output, detect a hallucination, or decide whether a recommendation should be trusted. The real gap between believing and doing is well documented in adjacent literatures. There is no reason to assume it shrinks when the domain is AI, a technology specifically designed to present its outputs with confidence that bears no reliable relationship to their accuracy. Lintner also notes something subtler but no less damaging: very few of the reviewed studies investigated whether their items represented the construct as experienced by the target population. Instruments were built, factor structures were confirmed, reliability was reported, yet the prior question, whether the scale’s content captured what AI literacy looks like in the lives of real users rather than in the minds of scale developers, was largely left unasked.
The omissions are worse than the weaknesses. Not one instrument in Lintner’s (2024) review assessed measurement error. That means we do not know, for any published AI literacy scale, how much of the variance in scores reflects signal and how much reflects noise. A field making claims about readiness and competence based on scores whose error properties are unknown rests on weak foundations. But the most consequential absence is cross-cultural. Every instrument in Lintner’s review had been validated only in the language and cultural setting where it was developed, and none had been carried into a second context and re-examined. The assumption embedded in this practice is that a scale built for German university students, or American undergraduates, or Chinese primary school teachers, will behave identically when administered to Greek early childhood educators. A small number of studies have adapted AI literacy scales across languages. Uluğ et al. (2025) adapted an AI literacy scale into Turkish and re-examined its structure in samples of healthcare workers, students, and children. The MAILS, however, has not been examined in this way. We found no published study that translated the MAILS into a second language and reported whether its nine-factor structure held, and none that did so with early childhood educators. For this population, the question is open. But the broader cross-cultural psychometrics literature gives little reason to treat portability as automatically safe. Boer et al. (2018) document systematically how factor structures and item intercepts often do not replicate across linguistic boundaries. Vandenberg and Lance (2000), and the measurement invariance tradition that followed from their work, have shown that even well-validated instruments in applied psychology routinely demonstrate only partial invariance when moved across populations. Closer to our domain, cross-cultural adaptations of eHealth literacy scales have revealed that structurally sound instruments can lose metric or scalar invariance in ways original developers did not expect. Taken together, this literature indicates that cross-linguistic portability of factor structure should be treated as an empirical question rather than assumed. Lintner’s conclusion is difficult to dismiss, for the field is drawing inferential weight from instruments whose portability is unknown and whose precision has never been established against the benchmarks that serious measurement science requires.
The measurement gaps Lintner (2024) documented left all of us, researchers of educational AI, with a practical problem. We needed a scale that did not repeat the patterns just catalogued, i.e., built once, in one language, validated against one sample, and then treated as though its psychometric credentials were established. That ruled out most of what was available. To counter this challenge, we chose the Meta-AI Literacy Scale (Carolus et al., 2023) for a specific reason: it is one of the few instruments in this space that treats the psychological dimension of AI engagement as something worth measuring in its own right, not as background noise. The argument Carolus and colleagues make is grounded in a simple empirical observation. Technical knowledge about AI decays fast. Interfaces get constantly redesigned and model capabilities shift between software updates. What is more, a prompting strategy that worked last semester may be useless by the next one in the model’s next version. What proves more durable is the person’s confidence that they can figure it out again, namely, their tolerance for confusion, their willingness to re-engage after a failed interaction rather than retreating to what they already know. Carolus et al. (2023) formalize this intuition by drawing on the Theory of Planned Behavior (Ajzen, 1985) and Self-Efficacy Theory (Bandura, 1997), both of which predict that sustained engagement with challenging tasks depends less on what a person currently knows than on whether they believe their effort will eventually produce results. Most AI literacy scales ask what a respondent knows. MAILS asks, in addition, whether they are psychologically equipped to keep learning once that knowledge stops working.
The instrument’s structure reflects this commitment at every level. When Carolus and colleagues (Carolus et al., 2023) submitted their initial model to confirmatory factor analysis, the hypothesized single second-order domain they called AI Self-Management did not hold. What emerged instead were two empirically separable psychological domains positioned at the same hierarchical level as the cognitive AI Literacy factor, not nested inside it. AI Self-Efficacy brings together problem-solving confidence and the disposition to keep updating one’s knowledge as AI applications shift, the capacities that matter most when a familiar tool behaves differently after an update or a new interface appears in the workplace. AI Self-Competency pairs persuasion literacy with emotion regulation: noticing when an AI system is steering your decisions and managing the frustration that builds when interactions go wrong. That the measurement model grants these domains the same structural standing as the cognitive facets, Use/Apply AI, Know/Understand AI, Detect AI, and AI Ethics, amounts to a claim that self-regulatory capacity carries equivalent explanatory weight to factual knowledge. A further construct, Create AI, did not load on AI Literacy at all, confirming what most conceptualizations in the field already assume about the distinctiveness of development skills. This structure is what convinced us that the instrument was worth replicating rather than simply citing. Most available scales would give us a snapshot of what Greek early childhood educators currently know about AI. The MAILS offered something harder to find: a way to measure whether they also possess the psychological infrastructure to keep engaging once what they know becomes insufficient. Gollwitzer’s (1990) action-phase model, which the authors invoke to argue that intention alone cannot sustain engagement without ongoing regulation of action and emotion, gives this design its theoretical spine. If you believe that people abandon challenging tools not primarily because they lack information but because the affective cost of persisting exceeds what they can tolerate, then your instrument needs subscales that capture tolerance, not just knowledge. That is what the MAILS attempts, and that is what we set out to test in a language and professional context the original validation never reached. Our adaptation targets Greek early childhood educators, a population that differs from the original sample in language, professional culture, training background, and institutional relationship to technology.

4. The Present Study

This study examines whether the nine-factor structure of the Meta-AI Literacy Scale (MAILS) can be replicated with Greek early childhood educators. This is a useful test case for two reasons. First, early childhood education and care has received limited attention in the AI literacy measurement literature, despite growing policy and professional interest in AI across educational sectors. Second, the original MAILS was developed in a different linguistic and cultural context, so its transferability cannot be assumed. We adapted the scale into Greek and examined its psychometric properties in two independent samples. In addition to evaluating the proposed factor structure, we examined internal consistency, convergent and discriminant validity, and relationships with attitudes toward AI. More broadly, the study asks whether a measure that combines cognitive and self-regulatory dimensions of AI literacy is still meaningful in a new professional context.
The study pursued four aims: (1) to adapt the MAILS into Greek for early childhood educators, following recognized procedures for cross-cultural test adaptation; (2) to test whether the original nine-factor structure held in this new linguistic and professional context, using one sample for exploratory factor analysis and an independent sample for confirmatory factor analysis; (3) to estimate the internal consistency, convergent validity, and discriminant validity of the Greek version; and (4) to examine how the MAILS dimensions related to general attitudes toward AI, both as an initial check on external validity and validity and as a test of whether perceived competence and apprehension toward AI form one dimension or vary independently. We tested three predictions. We expected the Greek MAILS to reproduce the original nine-factor structure across both samples (H1) and its subscales to show acceptable internal consistency (H2). We also expected positive attitudes toward AI to relate positively to the MAILS dimensions, and negative attitudes to show weaker and less consistent associations (H3); a weak link for negative attitudes would indicate that apprehension toward AI does not reduce to low perceived competence.

5. Methods

This cross-sectional study adapted the MAILS to the Greek educational context and examined its psychometric properties in two independent samples. Following the cross-validation logic of Worthington and Whittaker (2006), the first sample (Sample 1) was used for exploratory factor analysis (EFA) and the second, independent sample (Sample 2) for confirmatory factor analysis (CFA).

5.1. Participants

A total of 475 early childhood educators participated in the current study (Sample 1: n = 133 and Sample y 2: n = 342) (see Table 1, which summarizes their demographic characteristics). The first sample, used for EFA, consisted of 133 participants (Mage = 47.2, SDage = 10.4, 81.2% were women). Regarding their education level, 10.6% had a high school degree, 26.3% had a university degree, 58.6% had a postgraduate degree, and 4.5% had a Ph.D. degree. Participants were recruited online via Google Forms, using university mailing lists and professional teacher association networks across Greece.
The second sample, used for CFA, consisted of 342 participants. Of the respondents, 17 were male (5%), and 325 (95%) were female. Participants’ ages ranged from 18 to 65 (Mage = 40.7, SDage = 12.9). Regarding their education level, 12% had a high school degree, 41.2% had a university degree, 45.6% had a postgraduate degree, and 1.2% had a Ph.D. degree. This sample was recruited using the same procedure described above for the first sample across Greece. It should be noted that the gender composition of the two samples differs notably. Sample 1 comprised 81.2% women, while Sample 2 comprised 95% women. This imbalance should be interpreted within the context of the teaching profession, which is highly feminized across Europe, particularly in pre-primary and primary education, as well as in Greece (Eurostat, 2026; OECD, 2021). Moreover, this demographic asymmetry may affect the comparability of factor structures across samples. Therefore, formal measurement invariance testing across the two samples was not conducted, which represents a limitation of the cross-validation design.

5.2. Measures

The Meta-AI Literacy Scale (MAILS; Carolus et al., 2023) is a 34-item self-report measure designed to assess knowledge, awareness, and application competencies related to AI technology. In the original development work (Carolus et al., 2023), the MAILS resolved into nine first-order factors. Eight of these are organized conceptually under three broader content areas, AI Literacy, AI Self-Efficacy, and AI Self-Competency, and a ninth, Create AI, forms a separate construct that does not load on AI Literacy. Consistent with the original validation, AI Self-Efficacy and AI Self-Competency are not nested within AI Literacy but stand at the same level as it; the present study therefore models the nine factors as correlated first-order factors rather than imposing a second-order structure (see the confirmatory factor analysis and Figure 1). AI Literacy comprises eighteen items (e.g., “I can operate AI applications in everyday life”) that comprises four subscales: Use/Apply AI (6 items), Know/Understand AI (6 items), Detect AI (3 items), and AI Ethics (3 items). Create AI is a distinct construct and consists of four items (e.g., “I can design new AI applications”). AI Self-Efficacy consists of six items (e.g., “I can rely on my skills”) that comprise two subscales: AI Problem Solving (3 items) and Learning (3 items). Also, AI Self-competency consists of six items (e.g., “I don’t let AI influence me in my everyday decisions”) that comprise two subscales, namely, AI Persuasion Literacy (3 items) and AI Emotion Regulation (3 items). Responses are reported on a 5-point Likert scale (1 = strongly disagree to 5 = strongly agree). In this study, reliability, measured using McDonald’s omega coefficient, ranged from 0.84 to 0.96 for all subscales.
The General Attitudes towards Artificial Intelligence Scale (GAAIS; Schepman & Rodway, 2020) was used to capture participants’ attitudes toward AI for the purpose of examining discriminant validity with the MAILS. The GAAIS consists of 20 items that encompass two dimensions: Positive Attitudes toward AI (12 items, e.g., “Artificial Intelligence is exciting.”) and Negative Attitudes toward AI (8 items, e.g., “I think Artificial Intelligence is dangerous.”). Responses are reported on a 5-point Likert scale (1 = strongly disagree to 5 = strongly agree). The negative-attitude items were reverse-scored in line with the developers’ scoring instructions, so that higher scores on both GAAIS subscales indicate more positive evaluations of AI. In particular, a higher score on the negative-attitude subscale reflects a more forgiving attitude toward the drawbacks and risks of AI, rather than stronger negativity. The ω coefficient for Positive Attitudes toward AI was 0.903 and for Negative Attitudes toward AI was 0.901.

5.3. Procedures

Prior to adaptation, permission to translate and validate the MAILS in Greek was formally requested from and granted by the original authors (Carolus et al., 2023). The translation and cross-cultural adaptation process followed the guidelines proposed by Hambleton and Patsula (1999) and the standard techniques determined by the International Test Commission (ITC, 2017). In the forward translation phase, three independent bilingual translators with expertise in educational technology and psychology each produced a separate Greek version of the original English instrument. The three translations were subsequently compared, discrepancies were discussed among the research team, and a consolidated Greek version was produced. This version was then independently back-translated into English by three further bilingual translators who had no prior exposure to the original scale. The back-translated versions were compared with the original to identify any semantic shifts, and the Greek wording was revised where conceptual equivalence was judged to be insufficient. Following translation reconciliation, an expert panel of three specialists in educational technology and psychometrics reviewed all items for clarity, cultural appropriateness, and content validity. Minor wording adjustments were incorporated based on the panel’s feedback. A pilot study was subsequently conducted with 30 participants representative of the target population to assess the comprehensibility and practical applicability of the Greek version. Participants were asked to evaluate the clarity of each item, and minor refinements were made before the final Greek version was confirmed.
Data were collected online via Google Forms using a self-administered questionnaire. Participants were recruited through convenience and snowball sampling, using university mailing lists and professional networks across Greece. Participation was voluntary and anonymous, and all respondents provided electronic informed consent prior to completing the questionnaire. The study was conducted in accordance with the Declaration of Helsinki and received ethical approval from the Ethics Committee of the University of Crete (Protocol No. 664/18-02-2026).

5.4. Data Analyses

Following the cross-validation guidelines proposed by Worthington and Whittaker (2006), the first sample was used to examine the underlying factors of the MAILS and to develop the measurement model through exploratory factor analysis (EFA). Exploratory factor analysis (EFA) identifies the underlying data structure, determines the number of factors, and clarifies the relationships among observed variables. This method does not impose a specific framework, enabling researchers to identify patterns in the data (Fabrigar et al., 1999). This process also facilitates the removal or revision of poorly performing items and ensures that each item contributes meaningfully to the scale (Field et al., 2012). Recommendations for sample size in exploratory factor analysis are not fixed; the adequacy of a given sample depends on conditions such as the size of the communalities and how well each factor is determined by its items (MacCallum et al., 1999). Conducting an EFA initially provides insights into the data structure, thereby supporting refinement of the scale before further validation with confirmatory factor analysis (CFA).
Next, we used the second sample to assess whether the measurement model could be generalized to new data through CFA (Hair et al., 2019). CFA tests hypothesized relationships between observed variables and latent factors, enabling researchers to confirm or reject the proposed model. This process evaluates psychometric properties, including reliability, validity, factor loadings, measurement errors, and fit indices, to determine whether the model accurately represents the data. Subsequently, the internal consistency of the MAILS subscales and the item reliability were examined as indicators of measurement quality at the scale and item levels, respectively.
The evaluation of the confirmatory factor analysis (CFA) models employed several fit indices and criteria (Hu & Bentler, 1999; MacCallum et al., 1996). These included the chi-square statistic, Comparative Fit Index (CFI) values greater than 0.90 or 0.95 to indicate acceptable or excellent fit, Standardized Root Mean Square Residual (SRMR) values less than 0.05 or 0.08 to indicate good or acceptable fit, and Root Mean Square Error of Approximation (RMSEA) values near 0.06 to indicate good fit. Given the sensitivity of the chi-square statistic to sample size, greater emphasis was placed on the CFI, SRMR, and RMSEA values (Kline, 2016). All analyses were conducted using the R statistical environment (version 4.2.0; R Core Team, 2022).
Discriminant validity was assessed using two approaches. First, Pearson correlation coefficients were estimated between the MAILS dimensions and the Attitudes toward AI subscales (positive and negative) to evaluate their relationships with external constructs. Second, internal discriminant validity among the MAILS latent dimensions was evaluated using the heterotrait–monotrait ratio (HTMT), where values below 0.90 indicated acceptable discriminant validity (Henseler et al., 2015). Convergent validity was also assessed using the Average Variance Extracted (AVE), with values above 0.50 demonstrating that the latent constructs accounted for more variance than measurement error (Fornell & Larcker, 1981).

6. Results

6.1. Preliminary Analyses

Descriptive statistics for all items in both samples were analyzed prior to factor analysis. Means, standard deviations, skewness, and kurtosis were reviewed to evaluate distributional properties and test normality assumptions. For Sample 1 (N = 133), skewness ranged from −0.86 to 0.97 and kurtosis from −1.03 to 0.66. In Sample 2 (N = 342), skewness values ranged from −0.90 to 0.64 and kurtosis values from −0.99 to 1.11. In both samples, all skewness values were within ±1 and all kurtosis values within ±2, indicating no substantial deviations from univariate normality (Finney & DiStefano, 2013).

6.2. Exploratory Factor Analysis with Sample 1

An exploratory factor analysis (EFA) was performed on Sample 1 (n = 133) using maximum likelihood extraction and oblimin rotation, based on the theoretical expectation of correlated dimensions. The factorability of the correlation matrix was supported by a Kaiser–Meyer–Olkin (KMO) value of 0.941 and a significant Bartlett’s test of sphericity, χ2(561) = 5184, p < 0.001. These indices speak to the suitability of the item intercorrelations for factor analysis rather than to the sufficiency of the sample. Because the exploratory sample (n = 133) fell below the conventional 5–10 participants per item guideline (Tabachnick et al., 2013), the EFA results should be interpreted with caution. Bartlett’s test of sphericity was significant, χ2(561) = 5184, p < 0.001, confirming the data’s suitability for factor analysis. Nine factors were extracted, consistent with the theoretical structure of the original MAILS (Carolus et al., 2023), and visual inspection of the correlation matrix supported this solution. This solution explained 80.6% of the total variance, with all item communalities exceeding 0.413 (see Table A1 in Appendix A). According to Tabachnick et al. (2013), factor loadings of 0.45 are considered average, while values of 0.71 are ideal. No items in this study had a factor loading below 0.32. Model fit indices indicated good fit (RMSEA = 0.050, 90% CI [0.037, 0.063], TLI = 0.956), and each item loaded on its theoretically assigned factor (see Table A1 in Appendix A), lending initial support to H1.

6.3. Confirmatory Factor Analysis with Sample 2

As the next step in the cross-validation process, a CFA was conducted on Sample 2 to assess the structure identified by the EFA and supported by the MAILS theoretical framework. A nine-factor correlated model was specified, with each factor including its theoretically relevant items. The analysis showed a satisfactory fit to the data (χ2(513) = 1128.57, p < 0.001, CFI = 0.923, SRMR = 0.066, RMSEA = 0.059, CI 90% = [0.055, 0.063]). To improve fit, we added one correlated residual, between the error terms of items 5 and 6 (Nye, 2023). We reviewed the content of the two items before specifying this term: both belong to the Use/Apply subscale of the AI Literacy dimension and express closely related content, which supports allowing their residuals to correlate. We did not add any other residual covariances. The results of the new CFA supported the adequacy of the nine-factor correlated model, which demonstrated an acceptable fit to the data (χ2(512) = 1043.81, p < 0.001, CFI = 0.933, TLI = 0.927, SRMR = 0.068, RMSEA = 0.055, CI 90% = [0.051, 0.059]). Figure 1 provides a visual representation of the model and the factor loadings for each item. Last, all correlations among the latent factors were positive and statistically significant, ranging from 0.149 to 0.857. The highest inter-factor correlation was observed between AI Literacy and AI Self-Efficacy (r = 0.857). Although this value approaches commonly recommended thresholds for discriminant validity, the HTMT and AVE evidence reported below indicates that the two constructs remained empirically distinguishable. We return to the conceptual proximity of knowledge and confidence in the Discussion. Discriminant validity was assessed using HTMT to further evaluate construct distinctiveness. For the nine first-order MAILS subscales, HTMT values ranged from 0.107 to 0.812, remaining below the conservative threshold of 0.90. At the broader construct level, the HTMT value between AI Literacy and AI Self-Efficacy was 0.780, further supporting discriminant validity. Convergent validity was also confirmed by the AVE, with all latent variables exceeding the recommended threshold of 0.50 (AVE range = 0.631–0.819) (Table 2). These results demonstrate that, although some dimensions were strongly associated, they remained empirically distinguishable.

6.4. Assessment of Reliability and Measurement Quality

Building on the previous results and prior to examining the relationships between the MAILS scale and a relevant external measure, the internal consistency of the MAILS subscales was evaluated using Cronbach’s alpha and McDonald’s omega across three samples: exploratory Sample 1, validation Sample 2, and the overall sample. As indicated in Table 2, all factors exhibited acceptable reliability. No consistent issues with item reliability were observed. In addition to internal consistency, convergent validity was demonstrated by AVE estimates, all of which surpassed the recommended threshold of 0.50. Discriminant validity was further confirmed through HTMT analyses, with all first-order factor comparisons remaining below 0.90.
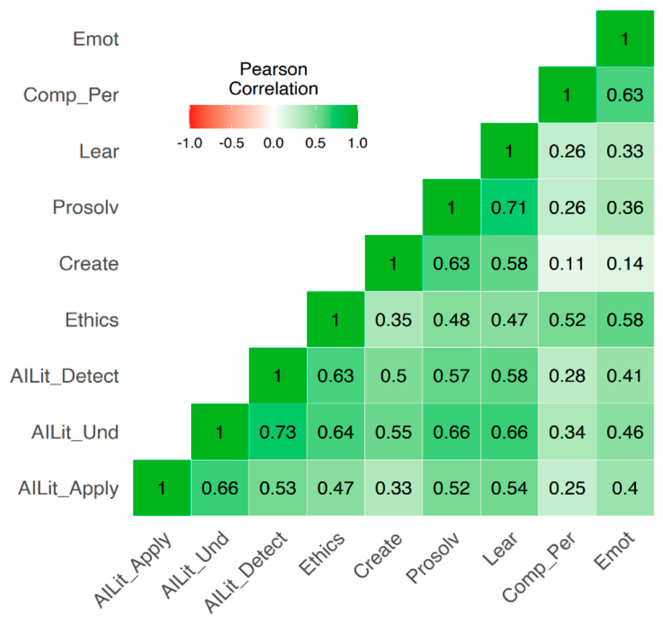
Figure 2 presents the Pearson correlation analysis results regarding the intercorrelations among MAILS subscales. The correlation matrix indicated that all subscales were positively intercorrelated, with coefficients ranging from small to strong magnitudes (r = 0.11 to 0.73).

6.5. Relationship Between AI Literacy and AI Attitudes

Pearson correlation analyses were conducted to examine the relationships between MAILS dimensions and attitudes toward AI. Positive Attitude toward AI showed significant positive associations with all MAILS dimensions except Persuasion Literacy, with correlation coefficients ranging from 0.14 to 0.48 (Table 3). No significant association was found between Positive Attitude and Persuasion Literacy (r = 0.01, p > 0.05). Regarding the reverse-scored negative-attitude subscale, only a small positive correlation was found with Use/Apply AI (r = 0.12, p < 0.05). These results support H3. Positive attitudes toward AI were related to most MAILS dimensions, whereas the associations of the reverse-scored negative-attitude subscale were weak and, with the single exception of Use/Apply AI, non-significant. In other words, educators’ perceived competence with AI bore little relation to how tolerant they were of its drawbacks. Because both measures are self-reports collected on a single occasion, this pattern is best read as a bivariate association, not as evidence that competence and apprehension are independent constructs.

7. Discussion

This study examined whether the structure of the Meta-AI Literacy Scale could be reproduced in a new context: Greek early childhood education and care. Across two independent samples, the findings supported the original nine-factor structure and showed satisfactory internal consistency across subscales. In practical terms, the factor structure was replicated in a new linguistic and professional setting, so the Greek version of the MAILS offers a usable starting point for studying perceived AI literacy in this group. The study also adds to a still limited body of work on the cross-contextual use of AI literacy measures. Most existing instruments have been developed and validated in the same setting in which they were created. In that respect, the present findings matter not only because they provide another validation, but because they test whether the nine-factor structure remains intact when moved across language, sector, and professional culture, a portability the cross-cultural measurement literature warns cannot be assumed (Boer et al., 2018; Vandenberg & Lance, 2000). What the results show is that the factor structure held in a new setting, not that measurement is equivalent across the Greek and original versions. Establishing equivalence would require formal tests of metric invariance (equal factor loadings) and scalar invariance (equal item intercepts), and neither was conducted here. Score differences between the two versions therefore cannot be interpreted. The study also did not estimate test–retest reliability or predictive validity, and the exploratory sample was small for a 34-item instrument.
One notable finding was the weak relationship between negative attitudes toward AI and the MAILS dimensions. This pattern does not support a simple view in which reluctance toward AI reflects low perceived competence. In this sample, apprehension toward AI appeared largely unrelated to perceived AI literacy. That interpretation should be treated cautiously, however, because both constructs were measured by self-report at a single time point. The findings therefore suggest that professional development may need to address self-regulatory and attitudinal dimensions alongside technical and conceptual knowledge, rather than assume that greater knowledge alone will reduce concern.
The strong association between AI Literacy and AI Self-Efficacy (r = 0.857) deserves attention. The correlation concerns two latent first-order factors rather than observed composite scores, and high as it is, the added validity analyses did not indicate redundancy. HTMT values across the nine first-order factors ranged from 0.107 to 0.812, all below the conservative 0.90 threshold, and the AVE of every factor exceeded the 0.50 criterion (range = 0.631–0.819). The content-area HTMT of 0.780, reported above, stayed below the threshold as well. We therefore do not read the two dimensions as measuring the same thing, although their proximity invites interpretation. Part of the answer may lie in the sample itself. ECEC educators have limited opportunities for direct AI use, and where exposure is sparse, judgments of what one knows and confidence that one can cope are formed by the same few encounters. The two may simply not yet have differentiated in practice, and fuller exposure could loosen the coupling. Another part is theoretical, and the instrument itself anticipates it. Bandura (1997) derives self-efficacy partly from mastery experience, so perceived competence and efficacy beliefs are expected to overlap, and the MAILS was constructed on this premise (Carolus et al., 2023). Whether the association weakens in samples with more extensive AI experience is a question for future work. The relevance of these findings for ECEC lies in a distinctive feature of the MAILS. Unlike most AI literacy instruments, the MAILS treats AI Self-Efficacy and AI Self-Competency as separate but related dimensions alongside cognitive AI Literacy, rather than as part of it (Carolus et al., 2023). This reflects the idea that effective use of AI depends not only on knowledge but also on confidence, persistence, and the ability to manage challenges when using AI tools (Bandura, 1997). These capacities may be particularly important for ECEC educators, who often have limited opportunities for AI training. In the present study, the original nine-factor structure was replicated in a Greek ECEC sample, with only one theoretically justified correlated residual (Items 5 and 6) added to improve model fit. However, because measurement invariance was not examined, the stability of this structure across different professional groups cannot be assumed. In addition, the MAILS is a self-report instrument that measures perceived rather than actual AI literacy, and self-reported competence may not always reflect observed performance (Lintner, 2024).
These results have a practical use for those who design professional development in ECEC. Because the MAILS yields separate scores for the cognitive dimensions (Use/Apply, Know/Understand, Detect, Ethics) and the self-regulatory ones (AI Self-Efficacy, AI Self-Competency), a subscale profile locates the specific dimensions on which a group of educators scores low, instead of giving only a single overall figure. Two groups with the same total score can differ in ways that matter for training: one may be low on Know/Understand and adequate on AI Emotion Regulation, and another the reverse. A teacher educator or pedagogical coordinator could read these profiles at the group level and match the form of support to the gap. Low scores on the cognitive subscales point to content-based input, such as sessions on how generative models produce text or how to check AI output for fabricated material. Low scores on AI Self-Efficacy or AI Emotion Regulation point to a different need: structured practice, mentoring, and chances to work through failed interactions with support.
This matters in ECEC because the main barrier to AI use in the sector is often discomfort with tools that behave unpredictably, more than an absence of factual knowledge. The profession’s training has centered on relational and developmental work, with limited grounding in technical fields, so educators may understand what an AI system does and still avoid it when a failed attempt produces frustration they have no support to manage. Monitoring AI Self-Efficacy and AI Emotion Regulation alongside the cognitive subscales would let providers see this pattern and respond to it with coaching and supported practice. We present this as a possible use of the instrument, not as a tested outcome. The present study did not examine whether MAILS profiles predict later uptake of AI tools or the quality of their classroom use, and using the scale for planning would need to be checked against behavioral data in future work.
Several limitations should be noted. First, the study relied on convenience sampling and self-report data, which limits both representativeness and the interpretation of scores as indicators of actual competence. Second, the exploratory sample (n = 133) was small for a 34-item instrument by conventional participants-per-item standards, and its factor solution should therefore be regarded as provisional. The later cross-validation in an independent confirmatory sample strengthens confidence in the structure but does not compensate for the small initial sample. Third, measurement invariance was not tested across demographic groups or between the two validation samples. This limitation is notable because the gender composition differed substantially between Sample 1 and Sample 2. While the predominance of women generally reflects the demographic structure of the teaching profession in Europe and Greece (Eurostat, 2026; OECD, 2021), these combined demographic differences may have influenced the comparability and stability of the estimated parameters. Furthermore, the relatively small number of male participants in both samples restricted the feasibility of conducting stable multi-group invariance analyses by gender. Future research should examine configural, metric, and scalar invariance in larger and more demographically balanced samples before making stronger claims regarding the cross-group or cross-sample generalisability of the Greek MAILS. Fourth, the design was cross-sectional, so no conclusions can be drawn about score stability over time or about causal relationships between AI literacy and attitudes. Finally, the study did not examine whether MAILS scores predict external outcomes, such as better evaluation of AI-generated content or more effective educational use of AI tools. These questions should be addressed in future work.
The present study provides initial evidence that the nine first-order factors of the MAILS re-emerge intact among Greek early childhood educators, with a single correlated residual, justified on content grounds, as the only modification. This supports the use of the instrument as a measure of perceived AI literacy in this context. What the evidence establishes is that the same structure emerged in both samples, that the subscales were highly reliable, and that the pattern of relations with attitudes toward AI was informative: apprehension was not appreciably associated with perceived competence. Together these findings suggest that AI literacy in ECEC involves not only knowledge-related but also self-regulatory dimensions. Whether those self-regulatory dimensions shape how educators actually engage with AI was not tested here. That question calls for more research with behavioural and predictive outcomes. At the same time, the study should be read as an early validation step rather than a definitive measurement solution. The data do not show whether MAILS scores capture enacted competence in real educational settings. Nor, in the absence of invariance testing, do they establish that the scale is metrically or scalarly equivalent across demographic subgroups or across language versions. Scores from the Greek and original versions should therefore not be compared as though they were on the same metric. For that reason, the main value of the study lies in establishing a plausible empirical basis for further work on AI literacy measurement in ECEC, especially work that combines self-report with behavioral and longitudinal evidence.

Author Contributions

Conceptualization, S.P., A.V. and Z.A.; methodology, S.P. and A.V.; formal analysis, A.V.; investigation, S.P., A.V. and Z.A.; data curation, A.V.; writing—original draft preparation, S.P., A.V. and Z.A.; writing—review and editing, Z.A.; visualization, A.V.; supervision, S.P.; project administration, S.P. All authors have read and agreed to the published version of the manuscript.

Funding

This research received no external funding.

Institutional Review Board Statement

The study was conducted in accordance with the Declaration of Helsinki, and approved by the Ethics Committee of the University of Crete (protocol code 664/18-02-2026, date of approval 18 February 2026).

Informed Consent Statement

Informed consent was obtained from all subjects involved in the study.

Data Availability Statement

The data presented in this study are available on request from the corresponding author due to privacy and ethical restrictions.

Conflicts of Interest

The authors declare no conflict of interest.

Appendix A

Table A1. Pattern Matrix of the Exploratory Factor Analysis for the Greek Version of the MAILS.
Factor
123456789
MAILS_05_Use& Apply AI0.863
MAILS_03_Use& Apply AI0.800
MAILS_04_Use& Apply AI0.750
MAILS_06_Use& Apply AI0.746
MAILS_02_Use& Apply AI0.704
MAILS_01_Use& Apply AI0.529
MAILS_21_CreateAI 0.905
MAILS_19_CreateAI 0.903
MAILS_20_CreateAI 0.902
MAILS_22_CreateAI 0.580
MAILS_33_AI Emotion Regulation 0.985
MAILS_34_AI Emotion Regulation 0.852
MAILS_32_AI Emotion Regulation 0.738
MAILS_27_Learning 0.944
MAILS_28_Learning 0.796
MAILS_26_Learning 0.623
MAILS_09_Know/UnderstandAI 0.653
MAILS_08_Know/UnderstandAI 0.587
MAILS_11_Know/UnderstandAI 0.519
MAILS_07_Know/UnderstandAI 0.479
MAILS_10_Know/UnderstandAI 0.420
MAILS_12_Know/UnderstandAI 0.413
MAILS_23_AI Problem Solving 0.704
MAILS_24_AI Problem Solving 0.645
MAILS_25_AI Problem Solving 0.577
MAILS_17_Ethics 0.800
MAILS_18_Ethics 0.473
MAILS_16_Ethics 0.469
MAILS_15_Detect 0.636
MAILS_14_Detect 0.556
MAILS_13_Detect 0.539
MAILS_31_Persuasion Literacy 0.521
MAILS_30_Persuasion Literacy 0.444
MAILS_29_Persuasion Literacy 0.415
SS loadings4.5223.5814.0343.7083.0072.5512.6032.4770.980
Cumulative percentage of variance (%)13.3010.5311.8610.918.847.507.667.292.70
Note. Factors are ordered by magnitude of SS loadings as produced by the EFA solution and do not reflect the theoretical sequence described in the original MAILS framework.

References

  1. Ajzen, I. (1985). From intentions to actions: A theory of planned behavior. In Action control: From cognition to behavior (pp. 11–39). Springer. [Google Scholar] [CrossRef]
  2. Andreadakis, Z. E., Papadakis, S., Hatzigianni, M., & Dardanou, M. (2025). The AI-ready educator. In Teaching with artificial intelligence (1st ed., pp. 64–78). Routledge. [Google Scholar] [CrossRef]
  3. Bandura, A. (1997). Self-efficacy: The exercise of control. W. H. Freeman. [Google Scholar]
  4. Bekiaridis, G., & Attwell, G. (2024). Supplement to the DigCompEdu framework: Outlining the skills and competences of educators related to AI in education. AI Pioneers project. Available online: https://aipioneers.org/wp-content/uploads/2024/01/WP3_Supplement_to_the_DigCompEDU_English.pdf (accessed on 3 July 2026).
  5. Black, J. S., & Van Esch, P. (2021). AI-enabled recruiting in the war for talent. Business Horizons, 64(4), 513–524. [Google Scholar] [CrossRef]
  6. Boer, D., Hanke, K., & He, J. (2018). On detecting systematic measurement error in cross-cultural research: A review and critical reflection on equivalence and invariance tests. Journal of Cross-Cultural Psychology, 49(5), 713–734. [Google Scholar] [CrossRef]
  7. Carolus, A., Koch, M. J., Straka, S., Latoschik, M. E., & Wienrich, C. (2023). MAILS—Meta AI literacy scale: Development and testing of an AI literacy questionnaire based on well-founded competency models and psychological change- and meta-competencies. Computers in Human Behavior: Artificial Humans, 1(2), 100014. [Google Scholar] [CrossRef]
  8. Chen, L., Chen, P., & Lin, Z. (2020). Artificial intelligence in education: A review. IEEE Access, 8, 75264–75278. [Google Scholar] [CrossRef]
  9. Council of Europe. (2024). Council of Europe Framework Convention on Artificial Intelligence and human rights, democracy and the rule of law (CETS No. 225). Council of Europe. Available online: https://www.coe.int/en/web/artificial-intelligence/the-framework-convention-on-artificial-intelligence (accessed on 6 May 2026).
  10. European Parliament & Council of the European Union. (2024). Regulation (EU) 2024/1689 of the European parliament and of the council of 13 June 2024 laying down harmonised rules on artificial intelligence (Artificial Intelligence Act) (L Series, 2024/1689). Official Journal of the European Union. Available online: https://eur-lex.europa.eu/eli/reg/2024/1689/oj (accessed on 6 May 2026).
  11. Eurostat. (2026). Primary education statistics. Statistics explained. European Commission. Available online: https://ec.europa.eu/eurostat/statistics-explained/index.php?title=Primary_education_statistics (accessed on 6 May 2026).
  12. Fabrigar, L. R., Wegener, D. T., MacCallum, R. C., & Strahan, E. J. (1999). Evaluating the use of exploratory factor analysis in psychological research. Psychological Methods, 4(3), 272–299. [Google Scholar] [CrossRef]
  13. Field, A., Miles, J., & Field, Z. (2012). Discovering statistics using R. Sage. [Google Scholar]
  14. Finney, S. J., & DiStefano, C. (2013). Nonnormal and categorical data in structural equation modeling. In G. R. Hancock, & R. O. Mueller (Eds.), Structural equation modeling: A second course (2nd ed., pp. 439–492). IAP Information Age Publishing. Available online: https://psycnet.apa.org/record/2014-01991-011 (accessed on 6 May 2026).
  15. Fornell, C., & Larcker, D. F. (1981). Evaluating structural equation models with unobservable variables and measurement error. Journal of Marketing Research, 18(1), 39–50. [Google Scholar] [CrossRef]
  16. Gollwitzer, P. M. (1990). Action phases and mind-sets. In E. T. Higgins, & R. M. Sorrentino (Eds.), Handbook of motivation and cognition: Foundations of social behavior (Vol. 2, pp. 53–92). Guilford Press. [Google Scholar]
  17. Gray, J., Gerlitz, C., & Bounegru, L. (2018). Data infrastructure literacy. Big Data & Society, 5(2), 2053951718786316. [Google Scholar] [CrossRef]
  18. Hair, J. F., Black, W. C., Babin, B. J., & Anderson, R. E. (2019). Multivariate data analysis (8th ed.). Cengage Learning EMEA. [Google Scholar]
  19. Haleem, A., Javaid, M., Qadri, M. A., & Suman, R. (2022). Understanding the role of digital technologies in education: A review. Sustainable Operations and Computers, 3, 275–285. [Google Scholar] [CrossRef]
  20. Hambleton, R. K., & Patsula, L. (1999). Increasing the validity of adapted tests: Myths to be avoided and guidelines for improving test adaptation practices. Journal of Applied Testing Technology, 1(1), 1–16. [Google Scholar]
  21. Henseler, J., Ringle, C. M., & Sarstedt, M. (2015). A new criterion for assessing discriminant validity in variance-based structural equation modeling. Journal of the Academy of Marketing Science, 43(1), 115–135. [Google Scholar] [CrossRef]
  22. Hu, L., & Bentler, P. M. (1999). Cutoff criteria for fit indexes in covariance structure analysis: Conventional criteria versus new alternatives. Structural Equation Modeling: A Multidisciplinary Journal, 6(1), 1–55. [Google Scholar] [CrossRef]
  23. International Test Commission (ITC). (2017). ITC guidelines for translating and adapting tests (Second Edition). International Journal of Testing, 18(2), 101–134. [Google Scholar] [CrossRef]
  24. Kline, R. B. (2016). Principles and practice of structural equation modeling (4th ed.). Guilford Press. [Google Scholar]
  25. Kong, S.-C., Cheung, M. Y. W., & Zhang, G. (2023). Evaluating an artificial intelligence literacy programme for developing university students’ conceptual understanding, literacy, empowerment and ethical awareness. Educational Technology & Society, 26(1), 16–30. [Google Scholar] [CrossRef]
  26. Lintner, T. (2024). A systematic review of AI literacy scales. npj Science of Learning, 9(1), 50. [Google Scholar] [CrossRef] [PubMed]
  27. Long, D., & Magerko, B. (2020). What is AI literacy? Competencies and design considerations. In Proceedings of the 2020 CHI conference on human factors in computing systems (pp. 1–16). ACM. [Google Scholar] [CrossRef]
  28. Louka, K., & Papadakis, S. (2024). Enhancing computational thinking in early childhood education through ScratchJr integration. Heliyon, 10(10), e30482. [Google Scholar] [CrossRef] [PubMed]
  29. Lund, B. D., Wang, T., Mannuru, N. R., Nie, B., Shimray, S., & Wang, Z. (2023). ChatGPT and a new academic reality: Artificial intelligence-written research papers and the ethics of the large language models in scholarly publishing. Journal of the Association for Information Science and Technology, 74(5), 570–581. [Google Scholar] [CrossRef]
  30. MacCallum, R. C., Browne, M. W., & Sugawara, H. M. (1996). Power analysis and determination of sample size for covariance structure modeling. Psychological Methods, 1(2), 130–149. [Google Scholar] [CrossRef]
  31. MacCallum, R. C., Widaman, K. F., Zhang, S., & Hong, S. (1999). Sample size in factor analysis. Psychological Methods, 4(1), 84–99. [Google Scholar] [CrossRef]
  32. Markham, A. N. (2020). Taking data literacy to the streets: Critical pedagogy in the public sphere. Qualitative Inquiry, 26(2), 227–237. [Google Scholar] [CrossRef]
  33. Miao, F., & Cukurova, M. (2024). AI competency framework for teachers. UNESCO. Available online: https://unesdoc.unesco.org/ark:/48223/pf0000391104 (accessed on 6 May 2026).
  34. Ng, D. T. K., Lee, M., Tan, R. J. Y., Hu, X., Downie, J. S., & Chu, S. K. W. (2022a). A review of AI teaching and learning from 2000 to 2020. Education and Information Technologies, 28(7), 8445–8501. [Google Scholar] [CrossRef]
  35. Ng, D. T. K., Leung, J. K. L., Chu, K. W. S., & Qiao, M. S. (2021a). AI literacy: Definition, teaching, evaluation and ethical issues. Proceedings of the Association for Information Science and Technology, 58(1), 504–509. [Google Scholar] [CrossRef]
  36. Ng, D. T. K., Leung, J. K. L., Chu, S. K. W., & Qiao, M. S. (2021b). Conceptualizing AI literacy: An exploratory review. Computers and Education: Artificial Intelligence, 2, 100041. [Google Scholar] [CrossRef]
  37. Ng, D. T. K., Leung, J. K. L., Su, J., Ng, R. C. W., & Chu, S. K. W. (2023). Early childhood educators’ AI digital competencies and twenty-first century skills in the post-pandemic world. Educational Technology Research and Development, 71(1), 137–161. [Google Scholar] [CrossRef] [PubMed]
  38. Ng, D. T. K., Luo, W., Chan, H. M. Y., & Chu, S. K. W. (2022b). Using digital story writing as a pedagogy to develop AI literacy among primary students. Computers and Education: Artificial Intelligence, 3, 100054. [Google Scholar] [CrossRef]
  39. Ng, D. T. K., Su, J., & Chu, S. K. W. (2024). Fostering secondary school students’ AI literacy through making AI-driven recycling bins. Education and Information Technologies, 29(8), 9715–9746. [Google Scholar] [CrossRef]
  40. Nye, C. D. (2023). Reviewer resources: Confirmatory factor analysis. Organizational Research Methods, 26(4), 608–628. [Google Scholar] [CrossRef]
  41. Organisation for Economic Co-operation and Development (OECD). (2021). Education at a glance 2021: OECD indicators. OECD Publishing. Available online: https://www.oecd.org/en/publications/education-at-a-glance-2021_b35a14e5-en.html (accessed on 6 May 2026).
  42. Papadakis, S. (2025). Computational thinking beyond coding in early childhood education: Reframing CS education for the age of AI. Journal of Baltic Science Education, 24(4), 592–593. [Google Scholar] [CrossRef]
  43. R Core Team. (2022). R: A language and environment for statistical computing. R Foundation for Statistical Computing. Available online: https://www.R-project.org/ (accessed on 6 May 2026).
  44. Redecker, C. (2017). European framework for the digital competence of educators: DigCompEdu (Y. Punie, Ed.). Publications Office of the European Union. [Google Scholar] [CrossRef]
  45. Schepman, A., & Rodway, P. (2020). Initial validation of the General Attitudes towards Artificial Intelligence Scale. Computers in Human Behavior Reports, 1, 100014. [Google Scholar] [CrossRef] [PubMed]
  46. Southworth, J., Migliaccio, K., Glover, J., Glover, J., Reed, D., McCarty, C., Brendemuhl, J., & Thomas, A. (2023). Developing a model for AI across the curriculum: Transforming the higher education landscape via innovation in AI literacy. Computers and Education: Artificial Intelligence, 4, 100127. [Google Scholar] [CrossRef]
  47. Su, J., Ng, D. T. K., & Chu, S. K. W. (2023). Artificial intelligence (AI) literacy in early childhood education: The challenges and opportunities. Computers and Education: Artificial Intelligence, 4, 100124. [Google Scholar] [CrossRef]
  48. Su, J., & Yang, W. (2022). Artificial intelligence in early childhood education: A scoping review. Computers and Education: Artificial Intelligence, 3, 100049. [Google Scholar] [CrossRef]
  49. Su, J., Zhong, Y., & Ng, D. T. K. (2022). A meta-review of literature on educational approaches for teaching AI at the K-12 levels in the Asia-Pacific region. Computers and Education: Artificial Intelligence, 3, 100065. [Google Scholar] [CrossRef]
  50. Tabachnick, B. G., Fidell, L. S., & Ullman, J. B. (2013). Using multivariate statistics (6th ed.). Pearson. [Google Scholar]
  51. Tenório, K., Olari, V., Chikobava, M., & Romeike, R. (2023). Artificial intelligence literacy research field: A bibliometric analysis from 1989 to 2021. In Proceedings of the 54th ACM technical symposium on computer science education V. 1 (pp. 901–907). ACM. [Google Scholar] [CrossRef]
  52. Tiernan, P., Costello, E., Donlon, E., Parysz, M., & Scriney, M. (2023). Information and media literacy in the age of AI: Options for the future. Education Sciences, 13(9), 906. [Google Scholar] [CrossRef]
  53. Uluğ, E., Öner, K., Arslantaş, S., & Harmancı, S. T. (2025). Adaptation of the artificial intelligence literacy scale into Turkish: A cross-sectional application among healthcare workers, students, and children. Education and Information Technologies, 30(15), 21041–21077. [Google Scholar] [CrossRef]
  54. Vandenberg, R. J., & Lance, C. E. (2000). A review and synthesis of the measurement invariance literature: Suggestions, practices, and recommendations for organizational research. Organizational Research Methods, 3(1), 4–70. [Google Scholar] [CrossRef]
  55. Wang, B., Rau, P.-L. P., & Yuan, T. (2023). Measuring user competence in using artificial intelligence: Validity and reliability of artificial intelligence literacy scale. Behaviour & Information Technology, 42(9), 1324–1337. [Google Scholar] [CrossRef]
  56. Wang, S., Sun, Z., & Chen, Y. (2022). Effects of higher education institutes’ artificial intelligence capability on students’ self-efficacy, creativity and learning performance. Education and Information Technologies, 28, 4919–4939. [Google Scholar] [CrossRef]
  57. Wienrich, C., & Carolus, A. (2021). Development of an instrument to measure conceptualizations and competencies about conversational agents on the example of smart speakers. Frontiers in Computer Science, 3, 685277. [Google Scholar] [CrossRef]
  58. Worthington, R. L., & Whittaker, T. A. (2006). Scale development research: A content analysis and recommendations for best practices. The Counseling Psychologist, 34(6), 806–838. [Google Scholar] [CrossRef]
  59. Yang, Y., Zhang, Y., Sun, D., He, W., & Wei, Y. (2025). Navigating the landscape of AI literacy education: Insights from a decade of research (2014–2024). Humanities and Social Sciences Communications, 12(1), 374. [Google Scholar] [CrossRef]
  60. Zhai, X., Chu, X., Chai, C. S., Jong, M. S. Y., Istenic, A., Spector, M., Liu, J.-B., Yuan, J., & Li, Y. (2021). A review of artificial intelligence (AI) in education from 2010 to 2020. Complexity, 2021, 8812542. [Google Scholar] [CrossRef]
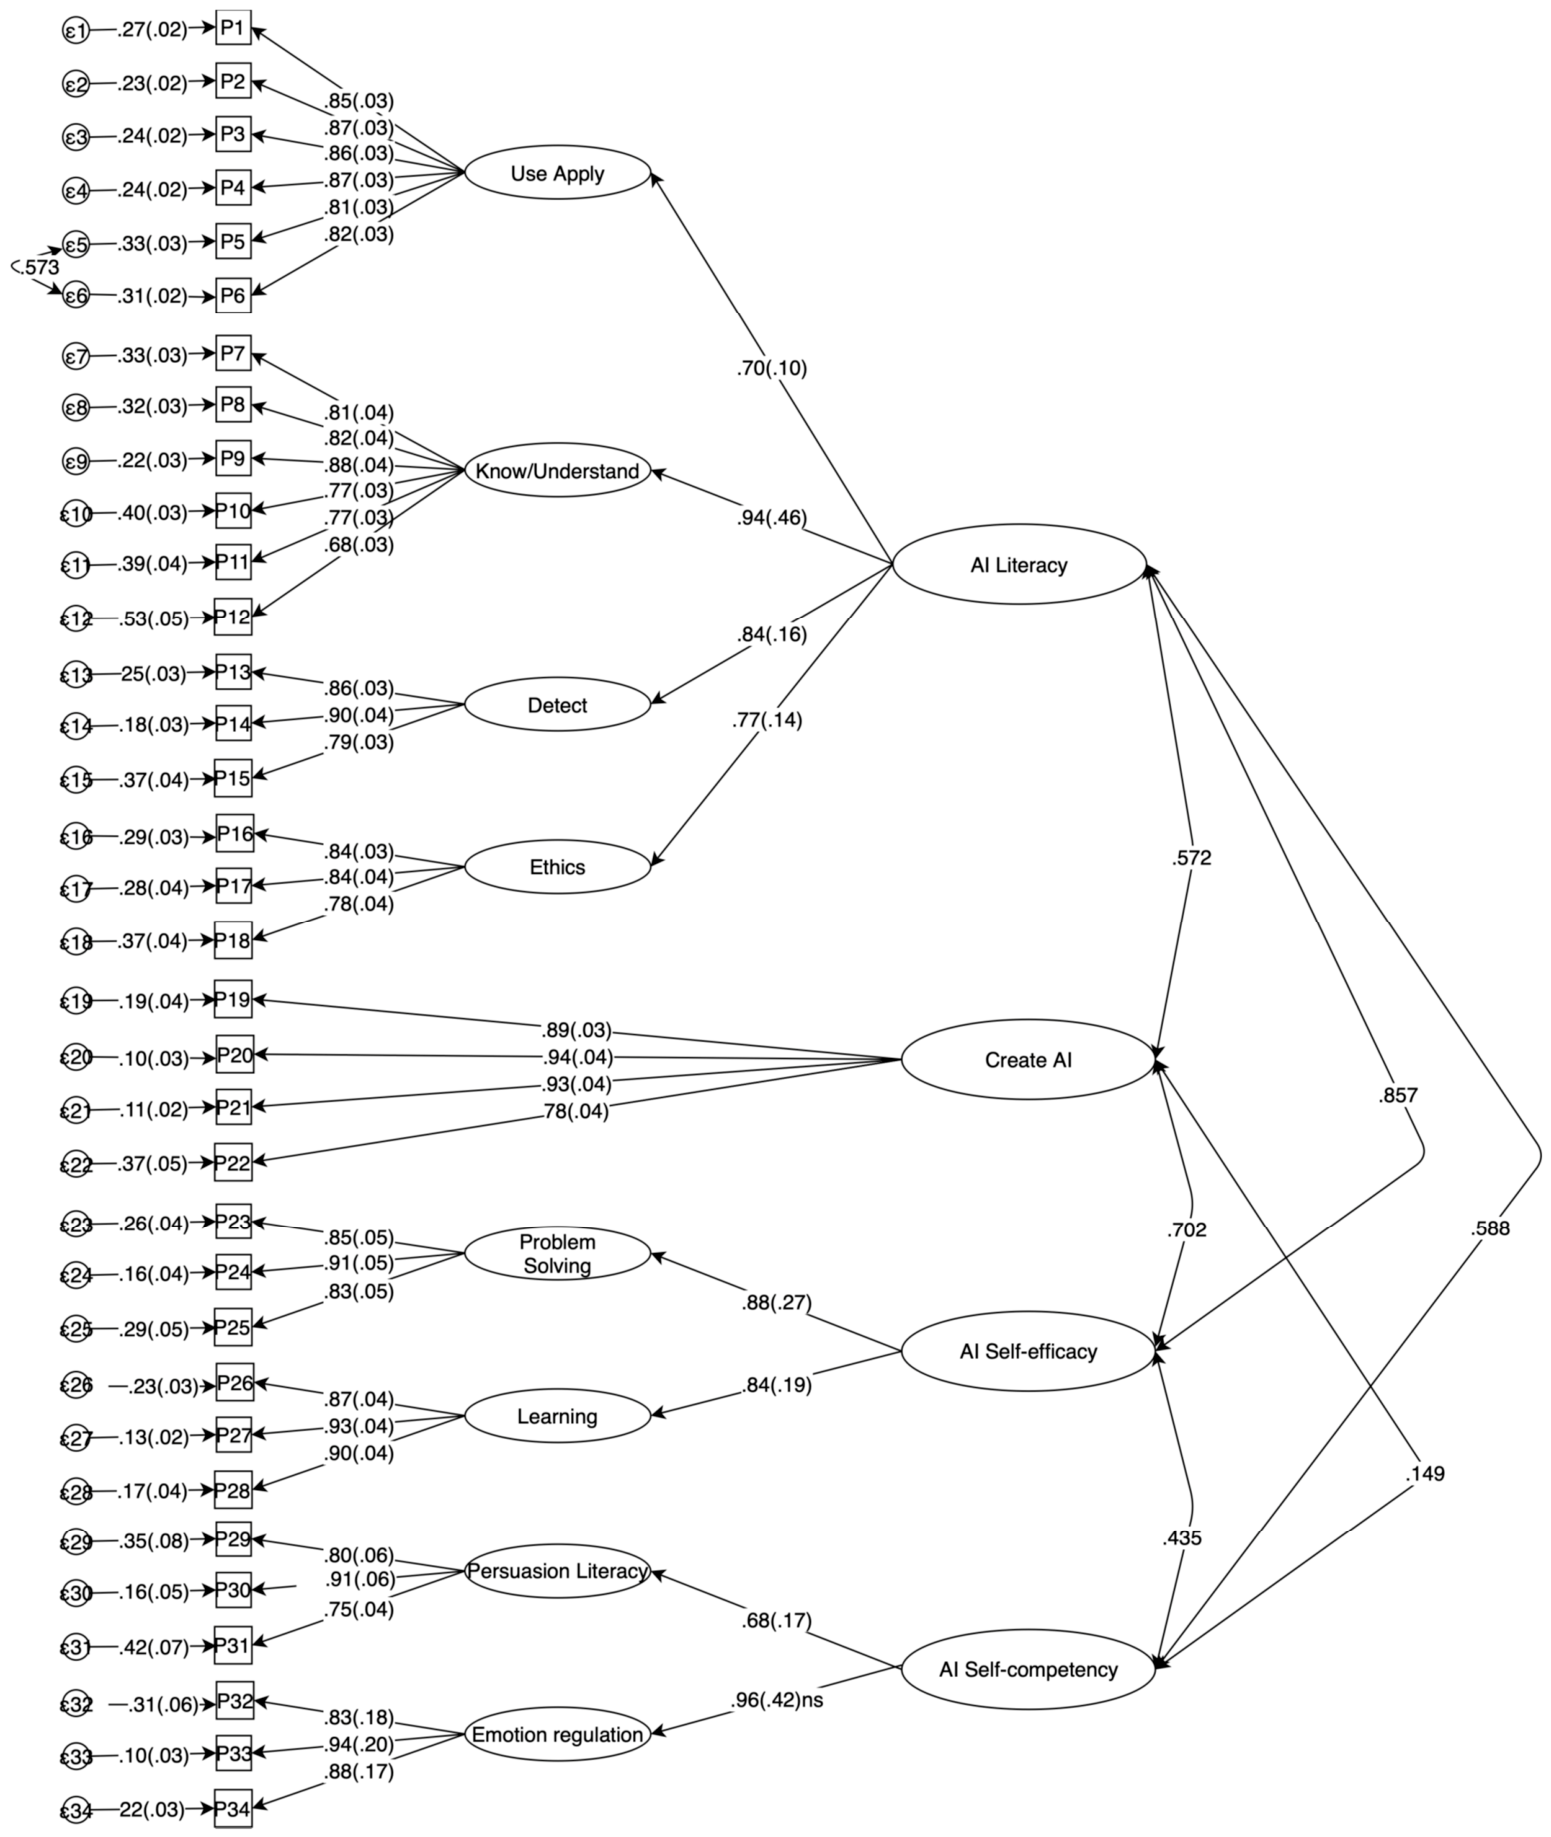
Figure 1. Graphical representation and factor loadings of the model.
Education 16 01117 g001
Figure 2. Pairwise correlation values of MAILS subscales.
Education 16 01117 g002
Table 1. Demographic characteristics.
Sample 1Sample 2Total
n%n%n%
Gender
 Male2518.8175.0428.8
 Female10881.232595.043391.2
Education level
 High School1410.64112.05511.5
 Bachelor3526.314141.217637.1
 Master7858.615645.623449.3
 Ph.D.64.541.2102.1
MSDMSDMSD
Age47.1910.4240.6812.9442.5012.60
Teacher experience17.4610.5713.7410.9414.7810.95
Note. Sample 1: n = 133, Sample 2: n = 342, Total Sample: n = 475.
Table 2. Internal consistency and convergent validity of the MAILS subscales.
FactorsSample 1Sample 2OverallItem-Rest CorrelationAVE (Sample 2)
αωαωαω
1. Use/Apply AI0.940.940.940.920.940.95 0.727
MAILS_01 0.81
MAILS_02 0.82
MAILS_03 0.82
MAILS_04 0.84
MAILS_05 0.82
MAILS_06 0.83
2. Know/Understand AI0.930.930.900.910.910.92 0.631
MAILS_07 0.76
MAILS_08 0.77
MAILS_09 0.82
MAILS_10 0.71
MAILS_11 0.75
MAILS_12 0.66
3. Detect0.920.930.880.890.890.90 0.729
MAILS_13 0.77
MAILS_14 0.82
MAILS_15 0.72
4. Ethics0.920.930.860.860.880.89 0.682
MAILS_16 0.73
MAILS_17 0.78
MAILS_18 0.70
5. Create AI0.940.950.930.940.940.94 0.801
MAILS_19 0.85
MAILS_20 0.90
MAILS_21 0.89
MAILS_22 0.75
6. AI Problem Solving0.910.920.900.900.900.91 0.758
MAILS_23 0.79
MAILS_24 0.84
MAILS_25 0.77
7. Learning0.950.950.920.930.930.94 0.819
MAILS_26 0.83
MAILS_27 0.88
MAILS_28 0.85
8. Persuasion literacy0.830.840.850.860.850.86 0.684
MAILS_29 0.71
MAILS_30 0.81
MAILS_31 0.66
9. Emotion regulation0.950.960.910.920.920.93 0.786
MAILS_32 0.78
MAILS_33 0.88
MAILS_34 0.80
Note. α = Cronbach’s alpha; ω = McDonald’s omega; AVE = Average Variance Extracted. AVE values are reported for the confirmatory sample (Sample 2) and all exceeded the recommended threshold of 0.50, supporting convergent validity. HTMT values across the nine first-order factors ranged from 0.107 to 0.812, remaining below the conservative threshold of 0.90, thus supporting discriminant validity.
Table 3. Descriptive statistics and correlations between MAILS subscales and Attitudes toward AI subscales.
MSD12345678910
1. Use/Apply AI3.590.801
2. Know/Understand AI3.270.8420.661 **
3. Detect3.170.9190.531 **0.726 **
4. Ethics 3.640.7700.468 **0.638 **0.633 **
5. Create AI 2.190.9930.334 **0.549 **0.497 **0.355 **
6. AI Problem Solving 2.801.0020.521 **0.656 **0.574 **0.476 **0.627 **
7. Learning2.900.9570.543 **0.659 **0.576 **0.473 **0.576 **0.706 **
8. Persuasion Literacy 3.730.8550.246 **0.337 **0.284 **0.518 **0.109 *0.262 **0.256 **
9. Emotion Regulation3.700.8960.402 **0.455 **0.408 **0.577 **0.143 **0.356 **0.327 **0.626 **
10. Positive Attitude3.330.6310.483 **0.316 **0.212 **0.153 **0.287 **0.273 **0.394 **0.0120.140 **
11. Negative Attitude (reverse-scored)2.930.7520.117 *0.0150.0250.0810.0350.0380.090−0.0110.0050.159 **
* p < 0.05, ** p < 0.01.
Disclaimer/Publisher’s Note: The statements, opinions and data contained in all publications are solely those of the individual author(s) and contributor(s) and not of MDPI and/or the editor(s). MDPI and/or the editor(s) disclaim responsibility for any injury to people or property resulting from any ideas, methods, instructions or products referred to in the content.