Article

Technological Acceptance, Motivation and Attitudes Towards Digital Assessment in Secondary Education Using Augmented Reality: Development and Preliminary Validation of a Scale for AR-STEM Contexts


by
Santiago Delgado-Rodríguez
1,*,
Silvia Carrascal-Domínguez
2 and
Rebeca García-Fandiño
3
1
Department of Education, Nebrija University, 28248 Madrid, Spain
2
Department of Education and President, San Jorge University, 50830 Zaragoza, Spain
3
Unique Research Center in Biological Chemistry and Molecular Materials, Santiago de Compostela University, 15705 Santiago de Compostela, Spain
*
Author to whom correspondence should be addressed.
Educ. Sci. 2026, 16(6), 870; https://doi.org/10.3390/educsci16060870
Submission received: 24 April 2026 / Revised: 21 May 2026 / Accepted: 22 May 2026 / Published: 31 May 2026
(This article belongs to the Section Technology Enhanced Education)

Abstract

This study is set against a backdrop of interest in understanding how secondary school pupils perceive learning experiences based on Augmented Reality (AR) and digital assessment, with the aim of designing a useful tool for comparative and replicable research in AR-STEM contexts. To this end, an attitudinal questionnaire was developed and preliminarily validated through a quantitative study conducted with a sample of 199 students from various schools who worked on science curriculum content using an AR application created and validated for the explanation of key concepts. The instrument, designed ad hoc based on the TAM and IMMS models and peer-reviewed, comprised 35 items. Its reliability and construct validity were analysed using Cronbach’s alpha and exploratory and confirmatory factor analysis. The results showed favourable scores for motivation, technological acceptance and the evaluation of digital assessment, alongside high internal consistency and a stable three-factor structure. In conclusion, the instrument presented in full in this study provides preliminary evidence that it is a valid, reliable and useful tool, although the digital assessment dimension remains emerging and will require further validation with independent samples.

1. Introduction

The global crisis triggered by the pandemic has underscored the advantages of technological resources in a broad sense. In the educational sector, they enabled students to continue their learning remotely, obviating the need to physically attend educational facilities. However, this situation has also exposed significant limitations in this regard. The utility of technology as a tool that supports, but does not replace, in-person education and teaching staff has become evident. Nevertheless, it has been observed that there are still substantial barriers to implementing an educational system wholly reliant on technology (Tawil, 2020).
Some years ago, the OECD (2015) published a report titled “Students, Computers and Learning: Making the Connection” that presented the results of a comparative analysis of the skills students acquired in digital environments and the learning methods developed for their implementation. The findings indicated that indiscriminate use by students of technological resources for educational purposes not only had a negligible effect on their academic performance but could also be counterproductive. This raises questions about what might have been done wrong to cause a disconnect between the use of technology and learning outcomes. It also prompts inquiries into the most effective use of various types of technological resources in education. Subsequent studies in this area have also suggested that technological elements can have a positive impact, but only if the technology is used appropriately (Johnson et al., 2019). Therefore, in most cases the inappropriate use of technology in learning favours effects that are not as expected (Brown et al., 2020). In this context, educational experts like Nieto (2016) hypothesise that there exists a gap between conducting educational activities with technological resources and the assessment systems, which are not adapted and in most cases are still the traditional ones. This gap is posited as an explanation for the lack of connection between the use of educational technology and improvements in students’ academic outcomes.
Currently, there is a growing need for professionals specialising in areas related to Science, Technology, Engineering and Mathematics (STEM). In response to this need, universities are seeking to develop effective strategies to attract more students to STEM subjects and to strengthen their learning from secondary school onwards.
Today’s students demand more meaningful teaching and learning methodologies based on educational resources that are familiar, interesting, motivating and immersive. In this sense, immersive technologies promote experiential learning through interactive environments (Crogman et al., 2025).
Innovative methodologies such as gamification, enhanced by immersive educational technologies such as Augmented Reality (AR), have the potential to positively impact the promotion and improvement of students’ socio-emotional and cognitive development (Lampropoulos et al., 2023; Peikos & Sofianidis, 2024). However, this technology can also be used in combination with educational methodologies based on traditional analogue gamification processes, enhancing the educational experience whilst reducing pupils’ screen time. AR is an immersive technology that enables, via mobile devices, the creation of a mixed reality that integrates real-world elements with virtual ones (Abeywardena, 2023).
To situate this study within the AR-STEM literature, it is necessary to consider recent studies such as that conducted by Doğru et al. (2025a), who, using bibliometric networks and content analysis, summarise the main trends, the most common target groups and the methodologies, concluding that AR shows consistent potential to enhance motivation and the learning experience in STEM. Studies published in recent years on the use of AR have focused on general education, early years education and higher education (Magaña et al., 2025). Educational experts such as Garzón et al. (2019) highlight that international studies conducted in secondary education provide evidence of the relative advantages of incorporating AR into different educational settings.
The current literature shows a steady increase in educational initiatives based on the use of Extended Reality (XR) technologies, which include immersive technologies such as Augmented Reality (AR), Virtual Reality (VR) and Mixed Reality (MR), but it also reveals a marked heterogeneity in the approaches used to obtain empirical evidence regarding their effects and the methods for defining and measuring outcomes (perception, interaction, performance and analytics), which continues to hinder comparisons between studies and the generalisation of results (Li et al., 2025; Sakr & Abdullah, 2024). Recent studies on the use of XR in STEM education show the ability of VR and AR to induce improvements in student motivation, participation and skill acquisition, but also point out implementation challenges related to technical failures and physical discomfort and underline the desirability of moving towards standardized contexts that facilitate the evaluation and comparability of results (Zhang et al., 2024).
Similarly, the literature highlights an emerging trend towards the integration of XR/AR with data analysis to improve teaching and support educational decisions (learning analytics) and with data mining techniques to identify patterns and generate predictive models in education (educational data mining), with the aim of supporting pedagogical and assessment decisions. In this regard, methodological gaps and needs have been identified to consolidate concrete and more systematic measurement practices in immersive environments (Lampropoulos & Evangelidis, 2025). In the same vein, research is beginning to explore adaptive response approaches using AR aimed at optimising cognitive processes, such as that proposed in the study by Sun and Liao (2025), which highlights the need to develop more systematic assessment and feedback mechanisms tailored to the use of AR. With regard to instruments, there are some examples of specific scales designed to measure particular constructs within educational experiences incorporating AR technology, such as those proposed by Gandolfi and Ferdig (2025) and Huang and Shih (2025), with recent psychometric validations, which demonstrate progress but also fragmentation across constructs and contexts of application. In the specific context of AR-based educational assessment, the available evidence also points to gaps relating to its implementation and adoption, highlighting that the literature on the advantages and limitations of immersive technologies such as AR in assessment processes remains limited, and that further empirical research is required for their effective integration into both innovative and traditional educational contexts (Köroğlu, 2025). Similarly, digital assessment constitutes a domain with its own distinct facets, for which specific instruments have been developed in recent years, such as those proposed by authors including Siu et al. (2024) and Tat and Kiliç (2024), aimed at studying factors such as anxiety and affective states during online learning. Furthermore, the literature reviewed on AR based on motivational models such as ARCS reinforces the importance of measuring constructs such as student motivation using validated instruments that enable the improvement of the design and measurement of this type of educational experience (Prasetya et al., 2024). Similarly, recent psychometric validation of technology acceptance scales in specific secondary education contexts supports the view of acceptance as a measurable and comparable construct (Dou & Feng, 2025). Regarding the role of digital interaction and integrated formative assessment, recent evidence shows that interactive digital materials with integrated formative assessment can enhance self-regulation, engagement and positive indirect effects on performance, although they do not always lead to immediate improvements. These findings, drawn from higher education, offer a useful framework for incorporating formative assessments into immersive AR experiences, supporting student learning and engagement (Doğru et al., 2025b). Overall, the current literature review reveals that there are instruments designed to measure specific dimensions such as presence, usability, acceptance and motivation, but it also highlights the need for comprehensive, transparent, traceable and validated instruments that enable the joint study, within secondary education contexts and STEM subjects where immersive technologies such as AR are used, of students’ perceptions regarding technological acceptance and motivation, as well as the intervening factors that may be associated with digital assessment processes. These studies provide a solid theoretical foundation to justify the novelty and relevance of the present study within the AR-STEM research continuum.
Conceptually, technology acceptance and motivation serve as complementary frameworks for analysing the integration of AR in educational settings. Some studies that have analysed the use of the TAM model in the field of science, such as the one conducted by Sungur and Ateş (2023), conclude that technology-based STEM training has the potential to improve perceived usefulness and ease of use, as well as students’ attitudes and intention to use it, thereby reinforcing the model’s relevance for application in the study of educational technology adoption processes. The TAM model enables the identification of instrumental beliefs linked to perceived usefulness and ease of use, whilst the ARCS model, applied through the IMMS, allows for the description of motivational processes related to attention, relevance, confidence and satisfaction, which influence student engagement during the learning process. Additionally, perceived comprehension was integrated as a preliminary dimension designed to capture students’ subjective assessment of the extent to which the experience facilitates the assimilation of content, serving as an indicator of perceived pedagogical utility. The results of the factor analyses show that this dimension shares variance with motivational factors and factors relating to the evaluation of the experience; it is therefore interpreted as an attitudinal construct associated with the perception of learning, rather than as an objective measure of academic performance.
The overall aim of this study is therefore to design and conduct a preliminary validation of an attitudinal questionnaire that measures, among STEM students in secondary education, the degree of technological acceptance, the level of motivation, and perceptions associated with digital understanding and assessment, within the context of a learning methodology that utilises Augmented Reality (AR) technology. The instrument presented in this study is not designed to infer causal effects, but rather to capture students’ perceptions and attitudes regarding the educational use of AR and associated assessment components. Therefore, the overall objective is to contribute to educational improvement, contextualised within the scope of the Sustainable Development Goals (SDG 4) of the United Nations 2030 Agenda. The instrument designed and the data obtained in this research will be useful for the development of complementary studies leading to the systematic and replicable assessment of secondary school pupils’ perceptions and attitudes towards learning experiences based on Augmented Reality (AR), including aspects of technological acceptance, motivation, perceived understanding and attitudes towards digital assessment in STEM subjects.
In summary, this study is conducted with the following research questions (RQs) in mind:
RQ1. What underlying factor structure does the questionnaire present in secondary school students within the context of an AR learning experience?
RQ2. What evidence of internal reliability does both the global scale and the subscales show?
RQ3. To what extent is the proposed structure confirmed by CFA, and how robust is it in sensitivity analyses?
RQ4. Does any specific component emerge relating to attitudes towards digital assessment, and how should it be interpreted?
RQ5. What descriptive patterns do students’ responses exhibit at the item and subscale levels in the context of a learning experience with AR?

2. Materials and Methods

2.1. Study Typology and Sample

The typology of this study falls within the framework of the quantitative methodology, in which an ex post facto, prospective design was applied.
The sample used in the study (n = 199) consists of students at 16 Secondary Education centres (ten public schools and six semi-private schools) enrolled in a fourth-year Science course. Data were also collected on age, sex, prior knowledge of AR and the use of digital assessment resources. The student sample was selected from a group of students who had previously participated in a performance study related to another earlier phase of the research. These students had interacted in class with an AR application that represented a key concept of a Biology and Geology course.

2.2. Procedure

This study is part of empirical research which been addressed in several phases due to its inherent nature and complexity. The student sample participating in this phase had previously been involved in a performance study using an immersive educational resource. This resource was an AR application created ad hoc and validated in another prior pilot study, representing a key concept of the subject being taught. Although the AR application incorporated three-dimensional representations and a sequential narrative explaining the key concepts, it did not incorporate gamification elements into its design, as it lacked game mechanics and built-in assessment. For this reason, gamification was implemented as a complementary teaching resource through an external teaching strategy of a traditional analogue nature. After interacting with the app, the pupils answered a series of questions on paper, posed by the teachers, regarding the content covered. The gamified activity consisted of a competitive challenge, defined by correctly answering the greatest number of questions in the shortest possible time. Subsequently, the students were examined on the curricular concepts using an assessment system adapted to the methodology and immersive resource used (Delgado, 2021; Delgado-Rodríguez et al., 2023a).
For this phase of the study, which aimed to gather students’ opinions on specific aspects related to the methodology and technology used in class, an instrument based on a custom-designed questionnaire was created. The administration of the questionnaire also geared at understanding students’ attitudes towards the use of an innovative methodology based on an AR resource to improve understanding key subject concepts and of an adapted assessment system. Given that, attitude can be regarded as a latent construct inferred from the responses given to the questions posed in the items.
The instrument was created ad hoc to be integrated into the research process in order to determine both the level of motivation and the degree of acceptance generated in students by the use of technological resources in educational environments. It was based on a literature review, taking into account the guidelines for the development and validation of scales proposed by experts such as Cabrera-Nguyen (2010), and on an adaptation of the following theoretical models:
  • The Technology Acceptance Model (TAM), established by Davis (1989) and widely used in research on technology acceptance (Venkatesh et al., 2003) for the Degree of Technology Acceptance dimension. This, in turn, comprises the Perceived Usefulness indicator (four items) and the Perceived Ease of Use indicator (three items).
  • The Instructional Materials Motivation Survey (IMMS), proposed by Keller (2010), for the Level of Motivation dimension, which is composed of the following indicators: Attention (four items), Relevance (three items), Confidence (three items), and Satisfaction (three items).
  • A third dimension was also added, initially called Degree of Understanding, consisting of the Ease of Understanding indicator (six items).
In total, the initial instrument consisted of 26 items (Table 1).
To ensure the validity of the content, the initial version was sent to a group of 10 experts. Applying the Expert Competence Coefficient (K) and following the criteria established by Cabero and Barroso (2013), the opinions of only nine experts were taken into account. To analyse the responses provided by the panel of experts, the Coefficient (V) was used (Aiken, 1980). The Coefficient (V) was calculated based on the ratings given by the experts for each item in the questionnaire and was recorded using a five-category ordinal scale (1–5). Two dimensions were assessed: (1) the relevance and appropriateness of the items in relation to the study’s objectives and (2) their adequacy and clarity (adequacy of language, comprehensibility and ease of interpretation). The values obtained for each item and dimension are presented in Table 2.
With regard to the handling of missing data, one of the nine participating experts did not provide ratings for any item in the relevance dimension. Therefore, the calculation of (V) for that dimension was carried out using the ratings of eight judges. For the clarity dimension, the analysis was carried out using the ratings provided by all nine judges. Given the instrumental and exploratory nature of this phase (initial refinement of the questionnaire), an operational criterion was adopted whereby items with values (V ≥ 0.70) were considered provisionally acceptable, whilst items with (V < 0.70) were considered for revision. Furthermore, to strengthen the interpretation of the index, decision-making was supplemented by the qualitative evidence provided by the judges.
The results showed that, overall, the relevance dimension yielded adequate values, as most items met the established criterion (V ≥ 0.70). However, item 15 scored below the operational threshold (V = 0.60), suggesting that it required revision. Furthermore, this item was phrased in reverse, a characteristic that could contribute to interpretation problems. In the adequacy/clarity dimension, a set of nine items (4, 6, 12, 15, 18, 20, 21, 22 and 23) were identified as failing to meet the minimum criterion (V < 0.70). Consequently, these items were subjected to review, taking into account both the quantitative values and the qualitative observations provided by the judges, with the aim of identifying the nature of the problem (excessive length, semantic ambiguity, double meaning, syntactic complexity) and deciding whether to reformulate or, where appropriate, remove them.
In order to complement the quantitative analysis through a triangulation process, qualitative responses to two open-ended questions were also analysed, with the aim of identifying the need to modify items and assessing the advisability of adding or removing content. In summary, the experts noted: (a) that most items are relevant; (b) that some items are worded in a manner that is too long and complex for a Likert-type format, recommending a shorter and more direct wording; (c) that certain items (4 and 5) should not be worded in reverse; (d) that item 15 is perceived as confusing; and (e) that the wording should be adapted to incorporate inclusive language. It was also noted that, although the overall length of the items was considered adequate, it would be appropriate to include more items to avoid double questions and statements that incorporated more than one idea.
In short, the final version contains a greater number of items due primarily to two reasons: (i) the qualitative observations made by the expert panel, which recommended simplifying long statements, avoiding reverse formulations, and splitting items with more than one idea; and (ii) the need to broaden the coverage of some indicators to improve the representativeness of their content. Therefore, starting from the initial version (n = 26), items with a V < 0.70 were revised, and supplementary items were written and added to avoid duplicate statements and strengthen the measurement, resulting in a final version of 35 items, which was subsequently subjected to psychometric validation (EFA/CFA) on the student sample.
With the results obtained, the initial version of the questionnaire was modified according to the experts’ recommendations, resulting in a revised and corrected final questionnaire structured with a total of 35 items (See Appendix A). This complies with general recommendations on instrument design and with the ratio related to the minimum number of observations and participants needed for this type of study (Hair et al., 2018).
The final questionnaire included information on the study’s objectives, the voluntary nature of participation and the anonymous processing of responses. In accordance with school protocols and applicable regulations, written consent was not required. However, informed consent was implicitly obtained through the voluntary completion and submission of the questionnaire, after confirming that participants had understood the initial information and could raise any queries with the teaching staff. The questionnaire was administered to students online via Google Forms®, without requesting personal identifiers or recording any information that would allow the students to be identified. In order to preserve the anonymity of the participants and ensure confidentiality, the data was stored with restricted access to the research team and analysed exclusively in aggregate form, with any sharing limited to anonymised results. It was decided not to seek individual written consent, as this would have been incompatible with the anonymous design of the study and would have introduced unnecessary identification of the participants. The maximum time agreed with the participating teachers for completing the questionnaire was 20 min.
Using the students’ responses, the reliability of the questionnaire was assessed using Cronbach’s alpha (Peterson, 1994; Sáez, 2017).
To determine construct validity, an exploratory factor analysis (EFA) was performed. The application of this type of analysis is fully justified, since one of the study’s objectives is to explore both the internal structure of the questionnaire through its main components and determine the existence of other possible factors in its underlying structure (Fabrigar et al., 1999; Hair et al., 2018). Additionally, a confirmatory factor analysis (CFA) was also conducted. Considering the recommendations of prominent experts like Schmitt et al. (2018), conducting both EFA and CFA on the entire sample is justified due to the model’s complexity, the intention to demonstrate the accuracy of its fit, and the pertinence of allowing comparability of the adjustment made with future research. Not dividing the sample into two parts also avoids reducing the sample size and, therefore, a loss of precision and accuracy in the analysed data caused by the random division of the main sample into two sub-samples that are smaller than the original (Fernández-Hernández et al., 2022; Schmitt et al., 2018).

2.3. The Instrument

Table 1 presents the initial theoretical structure of the questionnaire (n = 26) prior to expert review. After conducting the content validity process (Aiken’s K and V coefficients) and the qualitative review, the instrument was reformulated and expanded to a final version consisting of three dimensions, seven indicators, and 35 items, whose descriptive statistics and psychometric analyses are reported in Table 3. Additionally, the following categorical variables related to students and educational centres were included: Gender and Age of the Student, Condition of Student with Special Educational Needs, Type and Geographic Location of the Educational Centre, Experience in the Use of AR Resources, Regular Use of Non-Immersive Technology, Regular Use of AR-Based Technology in the Classroom, Use of VR Tools in Class and Regular Use of Assessment Systems Adapted to New Technologies (Delgado, 2021; Delgado-Rodríguez et al., 2023a).
For the assessment of responses, a Likert-type scale was chosen, graded in response intervals from 1 to 5 with 1 indicating complete disagreement and 5 indicating complete agreement.

3. Results

For the analysis of the study’s different data, including the statistical analysis of the data obtained from the responses provided by the students in the attitudinal questionnaire, the IBM® SPSS® Statistics V.22 software platform was used for the Exploratory Factor Analysis (EFA). The IBM® SPSS® Amos V.28 platform was also used for Confirmatory Factor Analysis (CFA).
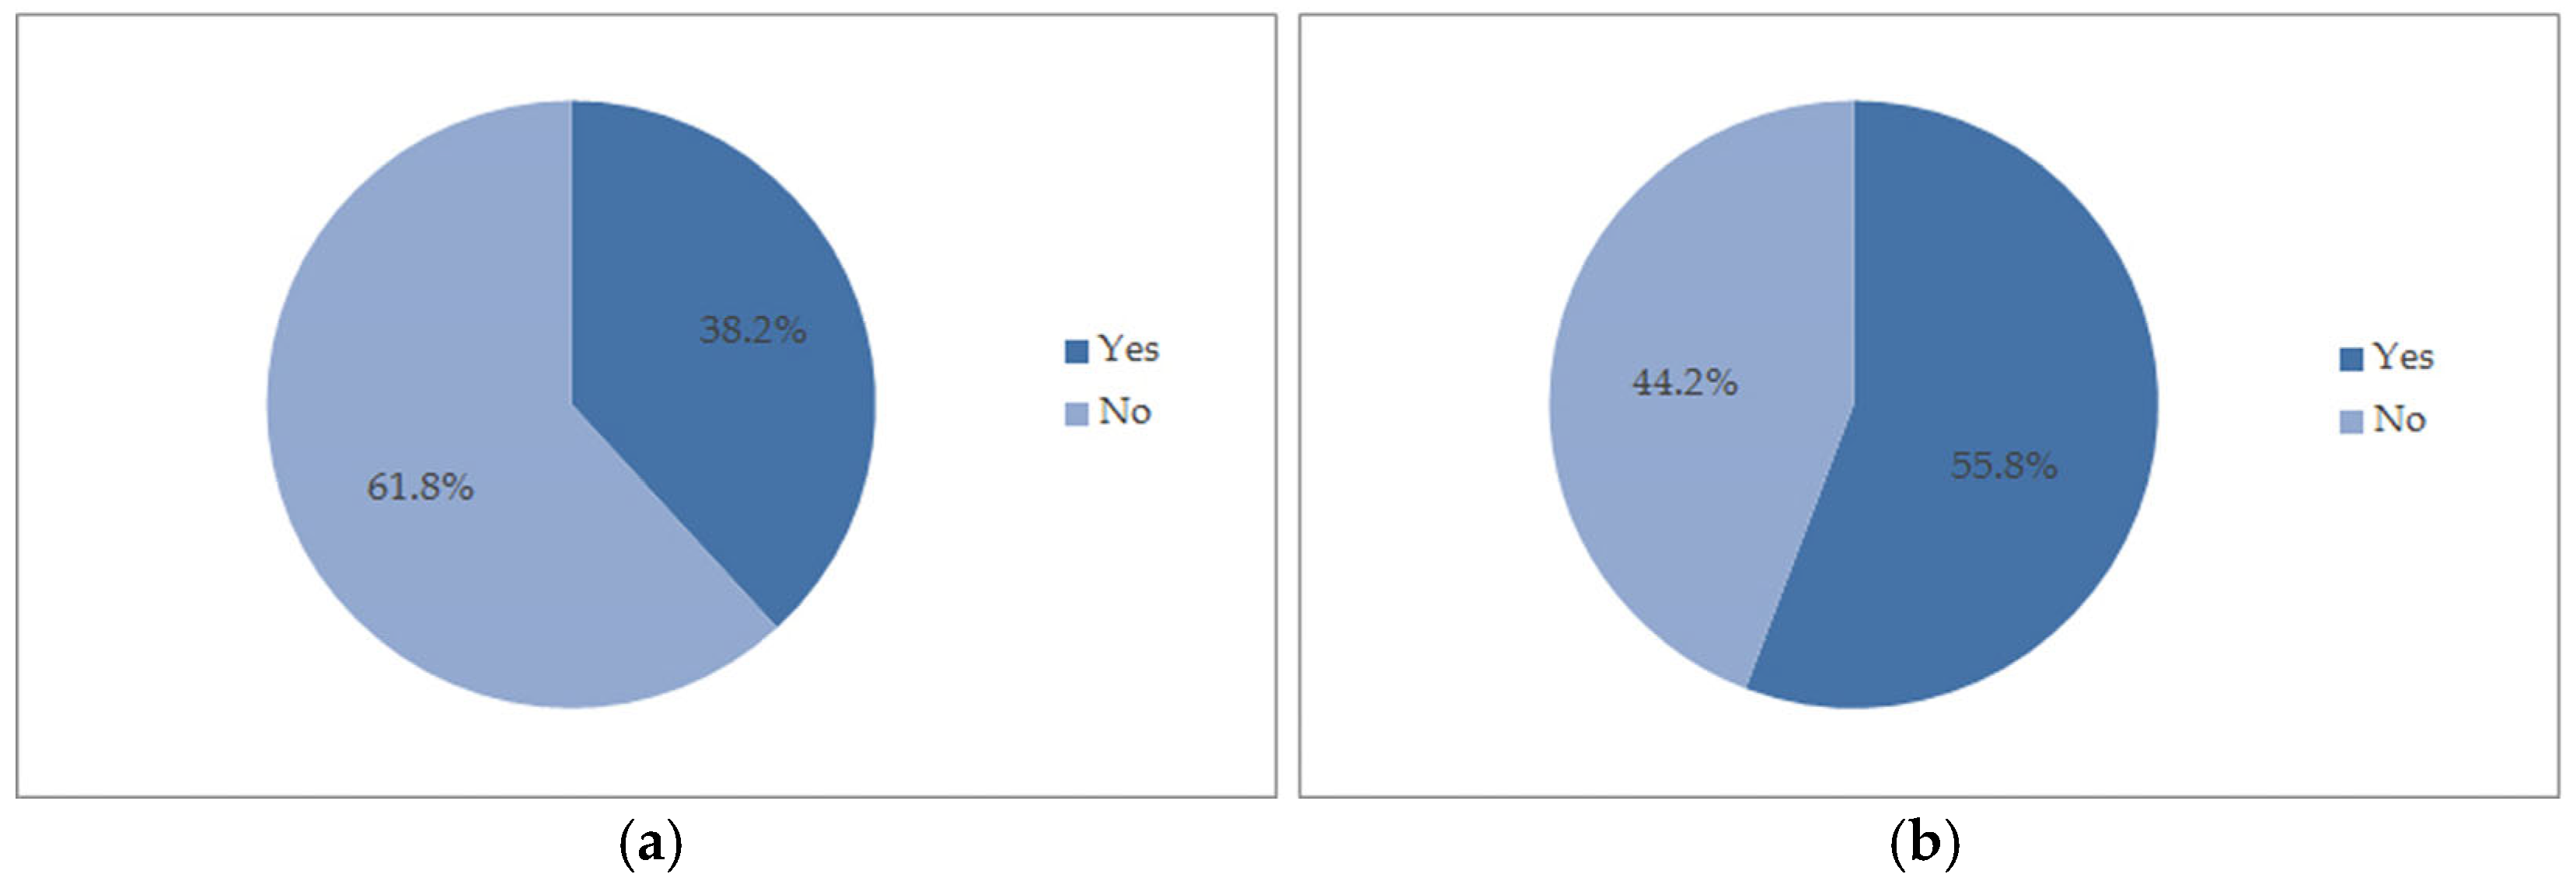
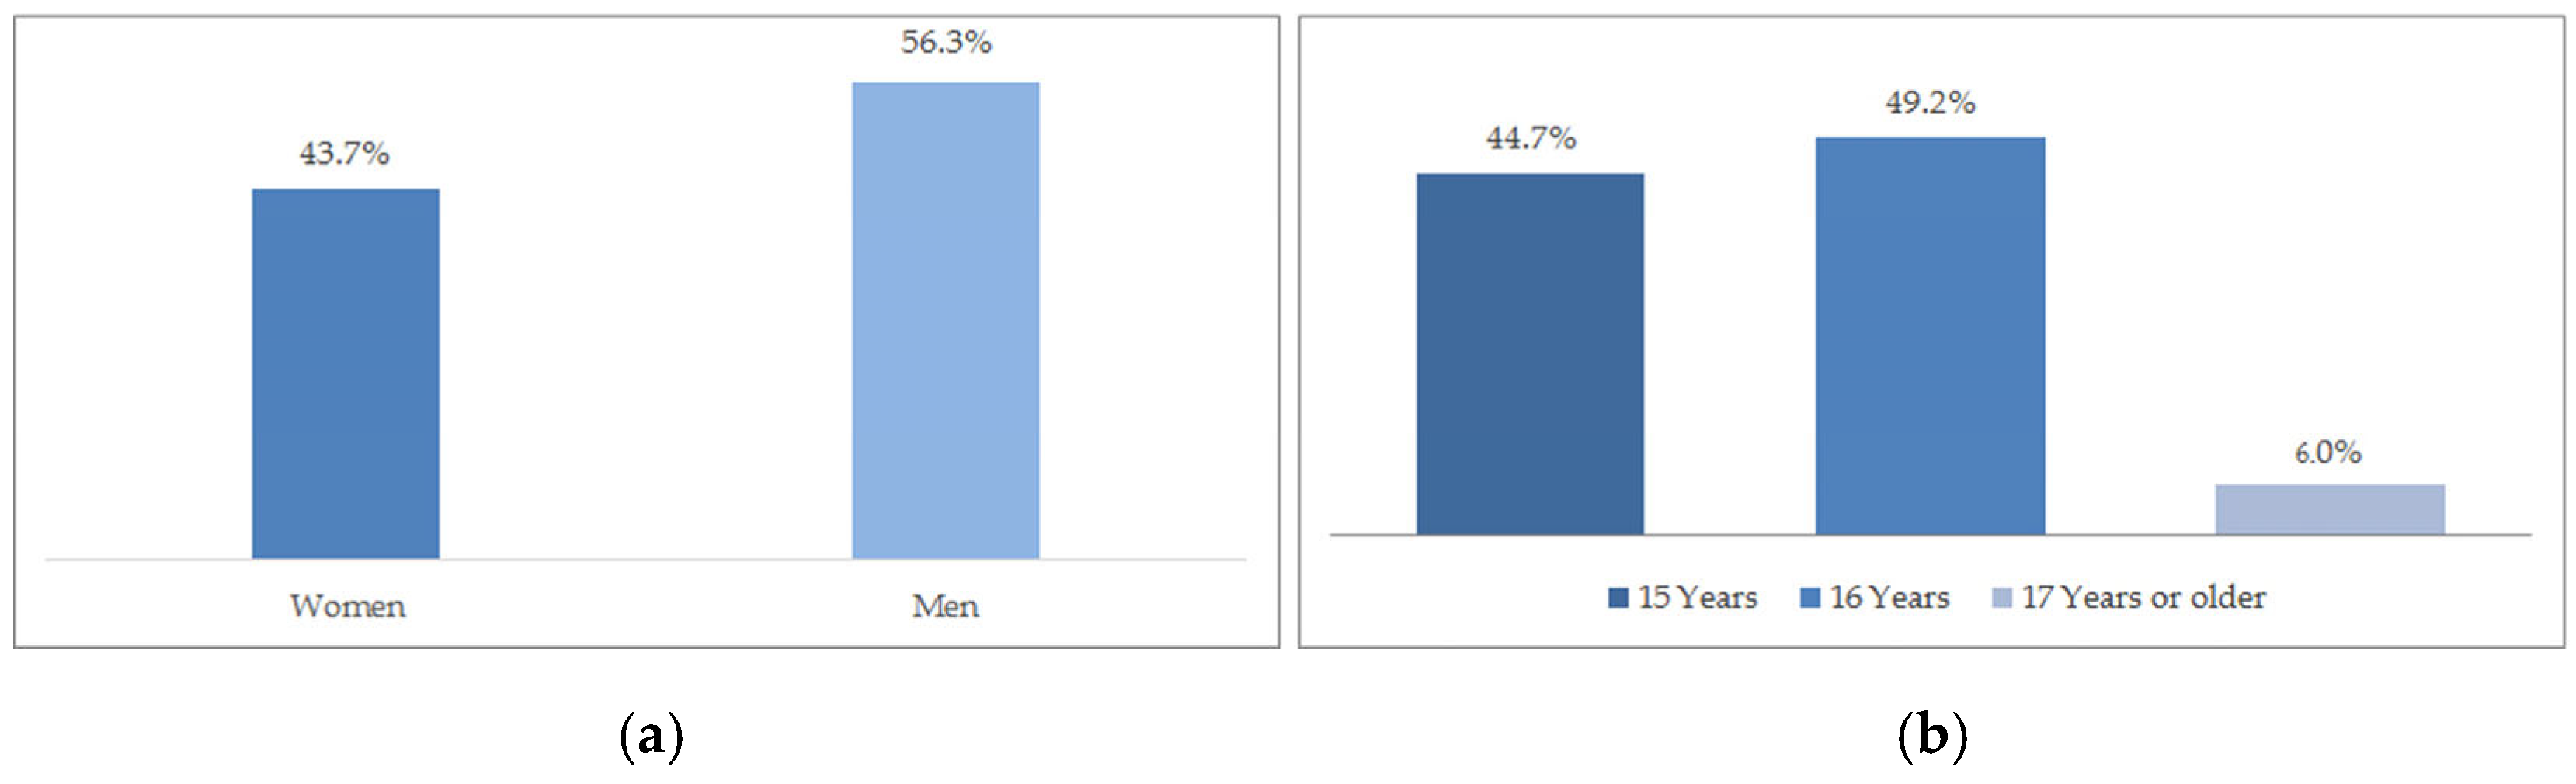
Regarding the demographic characteristics of the participants, the sample consisted of (n = 199) secondary school students, of whom 112 (56.3%) were male and 87 (43.7%) were female. In terms of age, the majority of students were 15 (44.7%) or 16 (49.2%) years old, while 6.0% were 17 years or older (Figure 1). Regarding the type of school, 123 (61.8%) students attended public schools and 76 (38.2%) attended private schools.
Finally, 76 (38.2%) participants indicated having some prior experience with AR resources in the classroom, while 123 (61.8%) students had not used them previously. Similarly, 111 (55.8%) students indicated a regular use of technology-based assessment systems, compared to 88 (44.2%) who did not use technology as an assessment tool (Figure 2).
With regard to RQ1–RQ5, the descriptive statistics for the students’ responses are shown below, along with the results of the EFA and CFA analyses and the reliability indices for the scale and its subscales.
The reliability of the instrument was established with the students’ responses to the questionnaire, using Cronbach’s Alpha coefficient (Peterson, 1994; Sáez, 2017) to determine internal consistency. The values obtained are shown in Table 4 (Delgado, 2021).
A detailed analysis of the data obtained from the students’ responses revealed average scores above the scale’s theoretical mean (M = 3.0) in the three dimensions that make up the attitudinal questionnaire, i.e., level of motivation, acceptance of AR technology and understanding of key concepts, across all items considered (1 to 35). The highest score was 3.94 and the lowest was 3.10, corresponding to items 27 and 21, respectively (Table 1).
Regarding the students’ opinions, note should be made of their perception of the usefulness of this technology to capture and improve their attention on the subject matter, as they consider the former entertaining and at the same time useful for their learning process. They reported that it enables them to better understand and expand their knowledge of the subject’s key concepts and improve their academic results. They also consider that the use of a digital assessment system as a method that complements the use of an AR resource is important to improve their academic marks.
It should be noted that the analysis of the data obtained from the students’ responses shows low values in the standard deviations relative to the assessments made by the students, both in the partial assessments for each of the items (values between 1.05 and 1.27), and in their overall average (1.17). This indicates a mean homogeneity in the responses obtained, which in turn shows their evident uniformity and constitutes a clear indicator of their reliability.
Subsequently, with the objective of establishing possible relationships between the variables and dimensions or factors, and in accordance with relevant experts such as Hair et al. (2018), an Exploratory Factor Analysis (EFA) was conducted. This statistical analysis was selected because one of the study’s main objectives was to exploratively verify the internal structure of the questionnaire through its main components, and to determine the possible existence of other factors in its underlying structure (López-Aguado & Gutiérrez-Provecho, 2019).
The correlation matrix coefficients were calculated beforehand to verify the pertinence of performing an EFA, determining the relationships between pairs of variables. For this purpose, Bartlett’s Test of Sphericity and the Kaiser–Meyer–Olkin (KMO) index for sampling adequacy were used, obtaining a value of p < 0.05 (0.000) in the first case and p > 0.5 (0.956) in the second case, respectively, which verified compliance with the conditions for conducting the EFA.
Having confirmed compliance with the necessary conditions for the analysis, the EFA was carried out using the Principal Components method, where the first factor explains most of the variance of the variables. The Varimax rotation was used to facilitate the interpretation of the factors, which sometimes is not simple as the latter correlate with multiple variables. The objective was to ensure, as much as possible, that each of the selected factors was strongly represented by a specific set of variables, thus making the interpretation of their meaning more intelligible in theoretical terms. With this method four main factors were initially obtained.
However, a detailed analysis of the data allowed verifying that only three main factors should be extracted. This number of factors was deemed sufficient, as it significantly reduced the initial amount and also because it allowed explaining nearly 70% of the total variance. Specifically, the selected set of factors explains 69.2% of the variance: 61.0%, 5.1% and 3.1% for each of the three factors, respectively (Delgado-Rodríguez et al., 2023b). Moreover, the choice of three main factors is also justified as the selection of a fourth factor would not significantly increase the model fit and would introduce greater complexity for its correct interpretation. In order to interpret the factors obtained, recommendations by experts such as Lorenzo-Seva and Ferrando (2013), who recommend that each factor be represented by at least two theoretically related items, were also taken into account. On the other hand, the following criteria were applied to define the factors: (1) that in general, the items should present factor loadings greater than 0.40 (Hair et al., 2018); (2) if an item presented factor loadings greater than 0.40 on two factors, it was considered to contribute to the factor in which it had the higher loading, provided that the difference in the saturations of an item was greater than 0.10; (3) otherwise, the elimination of the item was proposed (Hair et al., 2018). Note should be made that item 23, with loadings of 0.569 (factor 1) and 0.551 (factor 2) and a difference of 0.018, is well below the 0.10 threshold, indicating the possible existence of a high cross-loading.
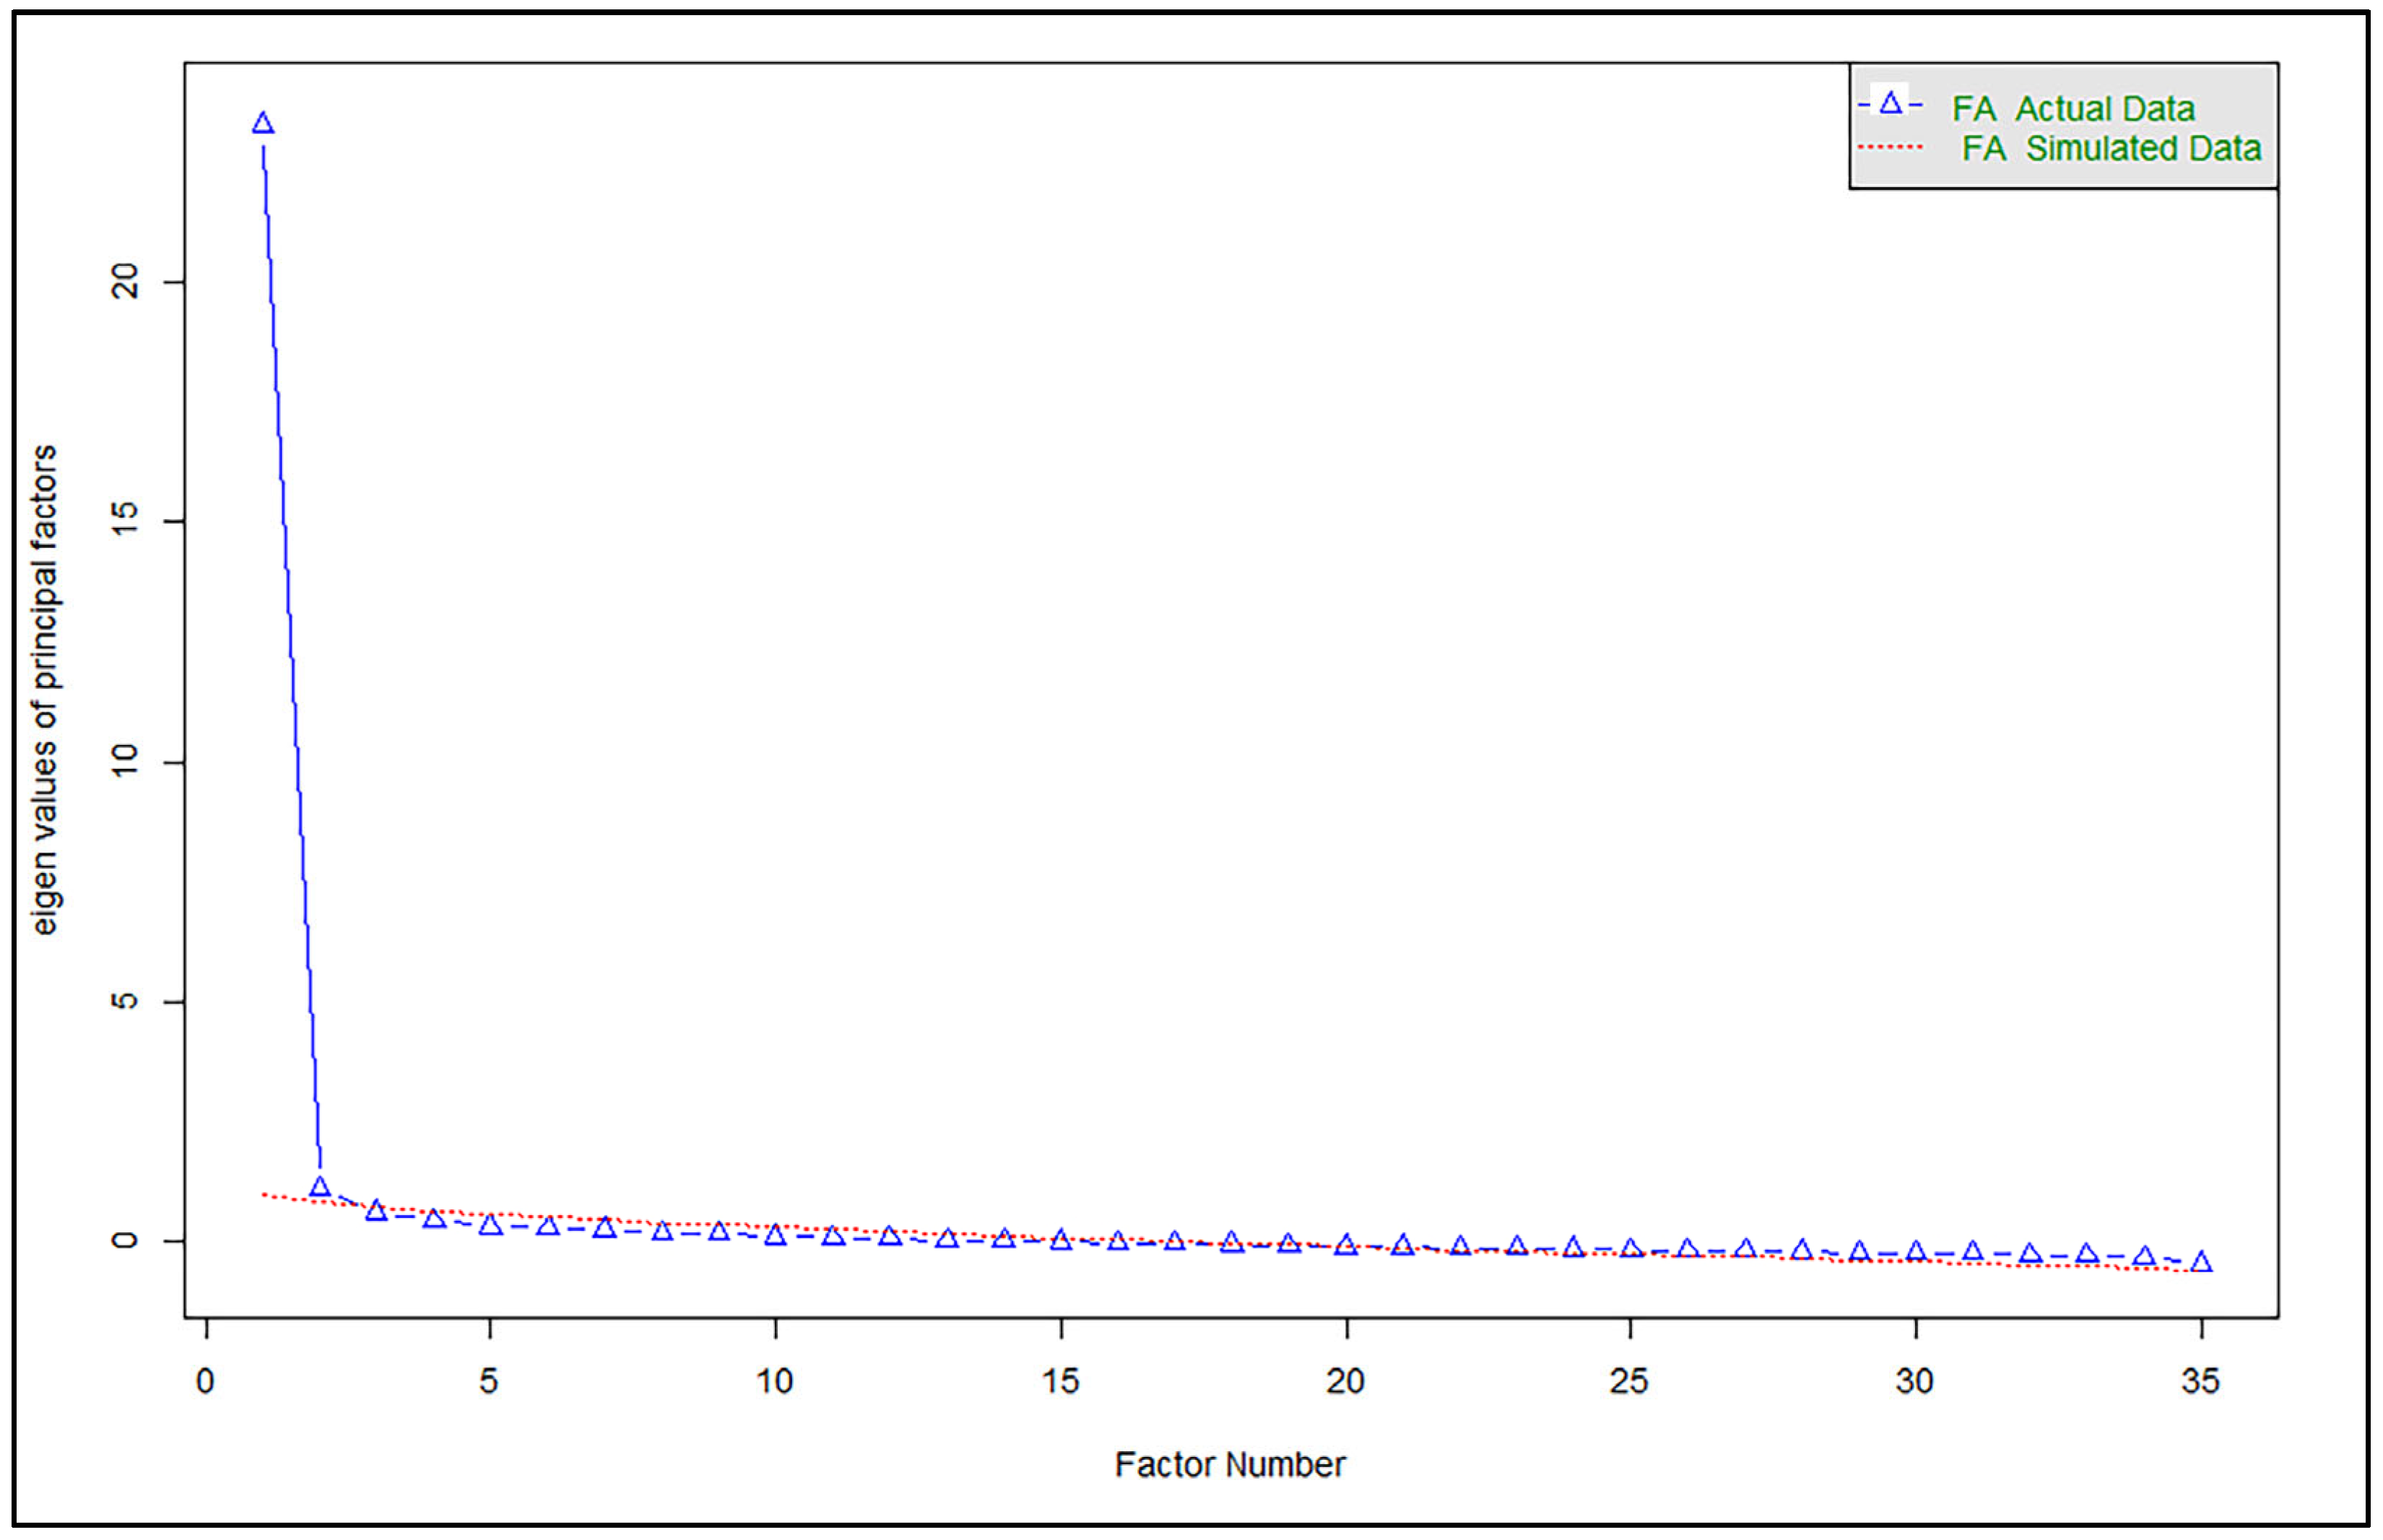
In order to obtain additional psychometric evidence, the EFA was re-estimated using a common-factor method, specifically the principal axis method, with Promax and Oblimin oblique rotations. Furthermore, the corresponding scree plot was analysed, along with a parallel analysis, to determine the optimal number of factors to retain. Consequently, the three-factor solution showed stability across the rotation methods. Promax and Oblimin explained virtually the same cumulative variance (72.12%) compared to 69.20%, with high principal loadings, comparable factor patterns and a minimal difference. The parallel analysis indicated that only the first three empirical eigenvalues exceeded the simulated ones, and the scree plot showed a clear inflection point after the third factor, confirming the retention of K = 3 (Figure 3).
It should be noted that item 23 showed significant loadings on more than one factor, thus meeting the criterion for cross-loading defined above. As its wording could be interpreted ambiguously, three alternatives were considered (rewriting, repositioning, or considering its possible removal). It was decided to test the removal of item 23 as the most conservative approach and to re-estimate the factor structure as a sensitivity analysis. Re-estimating the model after removing item 23 kept the explained variance and reliability coefficients stable (Δα ≤ 0.001), and, although the overall fit improved, the three-factor structure remained virtually unchanged. A comparison between the original structure and that estimated after removing item 23 shows virtually complete stability of the three-factor solution. In terms of cumulative variance, the difference is minimal: 72.12% with the item versus 72.07% without it, indicating no substantial loss of explanatory power. Therefore, it was decided to retain it.
Subsequently, the variables that best correlated with each of the factors were studied in order to name them. The results obtained allowed regrouping the items and naming the factors (components) as: (1) Level of Motivation; (2) Acceptance of AR Technology; and (3) Acceptance of the adapted digital assessment system (Delgado, 2021). In Table 5, the said factors and the items associated with each one are represented, with factor loadings above 0.50 in all cases and a large number of factor loadings reaching high values above 0.70.
In addition to the anticipated dimensions, the EFA identified a third factor associated with the acceptance of digital assessment (EVA). This component was not a construct that had been fully defined a priori within the initial design of the instrument, but rather emerged empirically as a distinct factor based on the pattern of covariation among the items. However, given that in its current formulation it is based on a small number of items (two), its interpretation should be considered provisional. Consequently, as this is an emerging provisional factor, it is presented as a relevant but preliminary finding, the consolidation of which requires the expansion of the set of associated items and psychometric validation in independent samples in subsequent studies.
Given the very high internal consistency observed in the full version of the instrument, potential redundancy was assessed using the average inter-item correlation (AIC), and complementary reliability was estimated using McDonald’s ω. In order to improve the practical utility of the instrument and minimise duplication of content, a shortened version was derived from the original 35 items through proportional reduction by dimension, retaining 12 items: 6 MOT (MOT03, MOT02, MOT18, MOT21, MOT07, MOT01), 4 ACC (ACC11, ACC08, ACC07, ACC03) and 2 EVA (EVA02, EVA01), (see Appendix C). The selection was based on high principal loadings on the theoretical factor, substantial differences from the secondary loadings, adequate communalities and low complexity. The primary loadings ranged from 0.595 to 1.031, the differences from 0.358 to 0.896 and the communalities from 0.253 to 0.868. Reliability was high for the global scale (α = 0.926), MOT (α = 0.921) and ACC (α = 0.875), and acceptable for EVA (ρSB = 0.638).
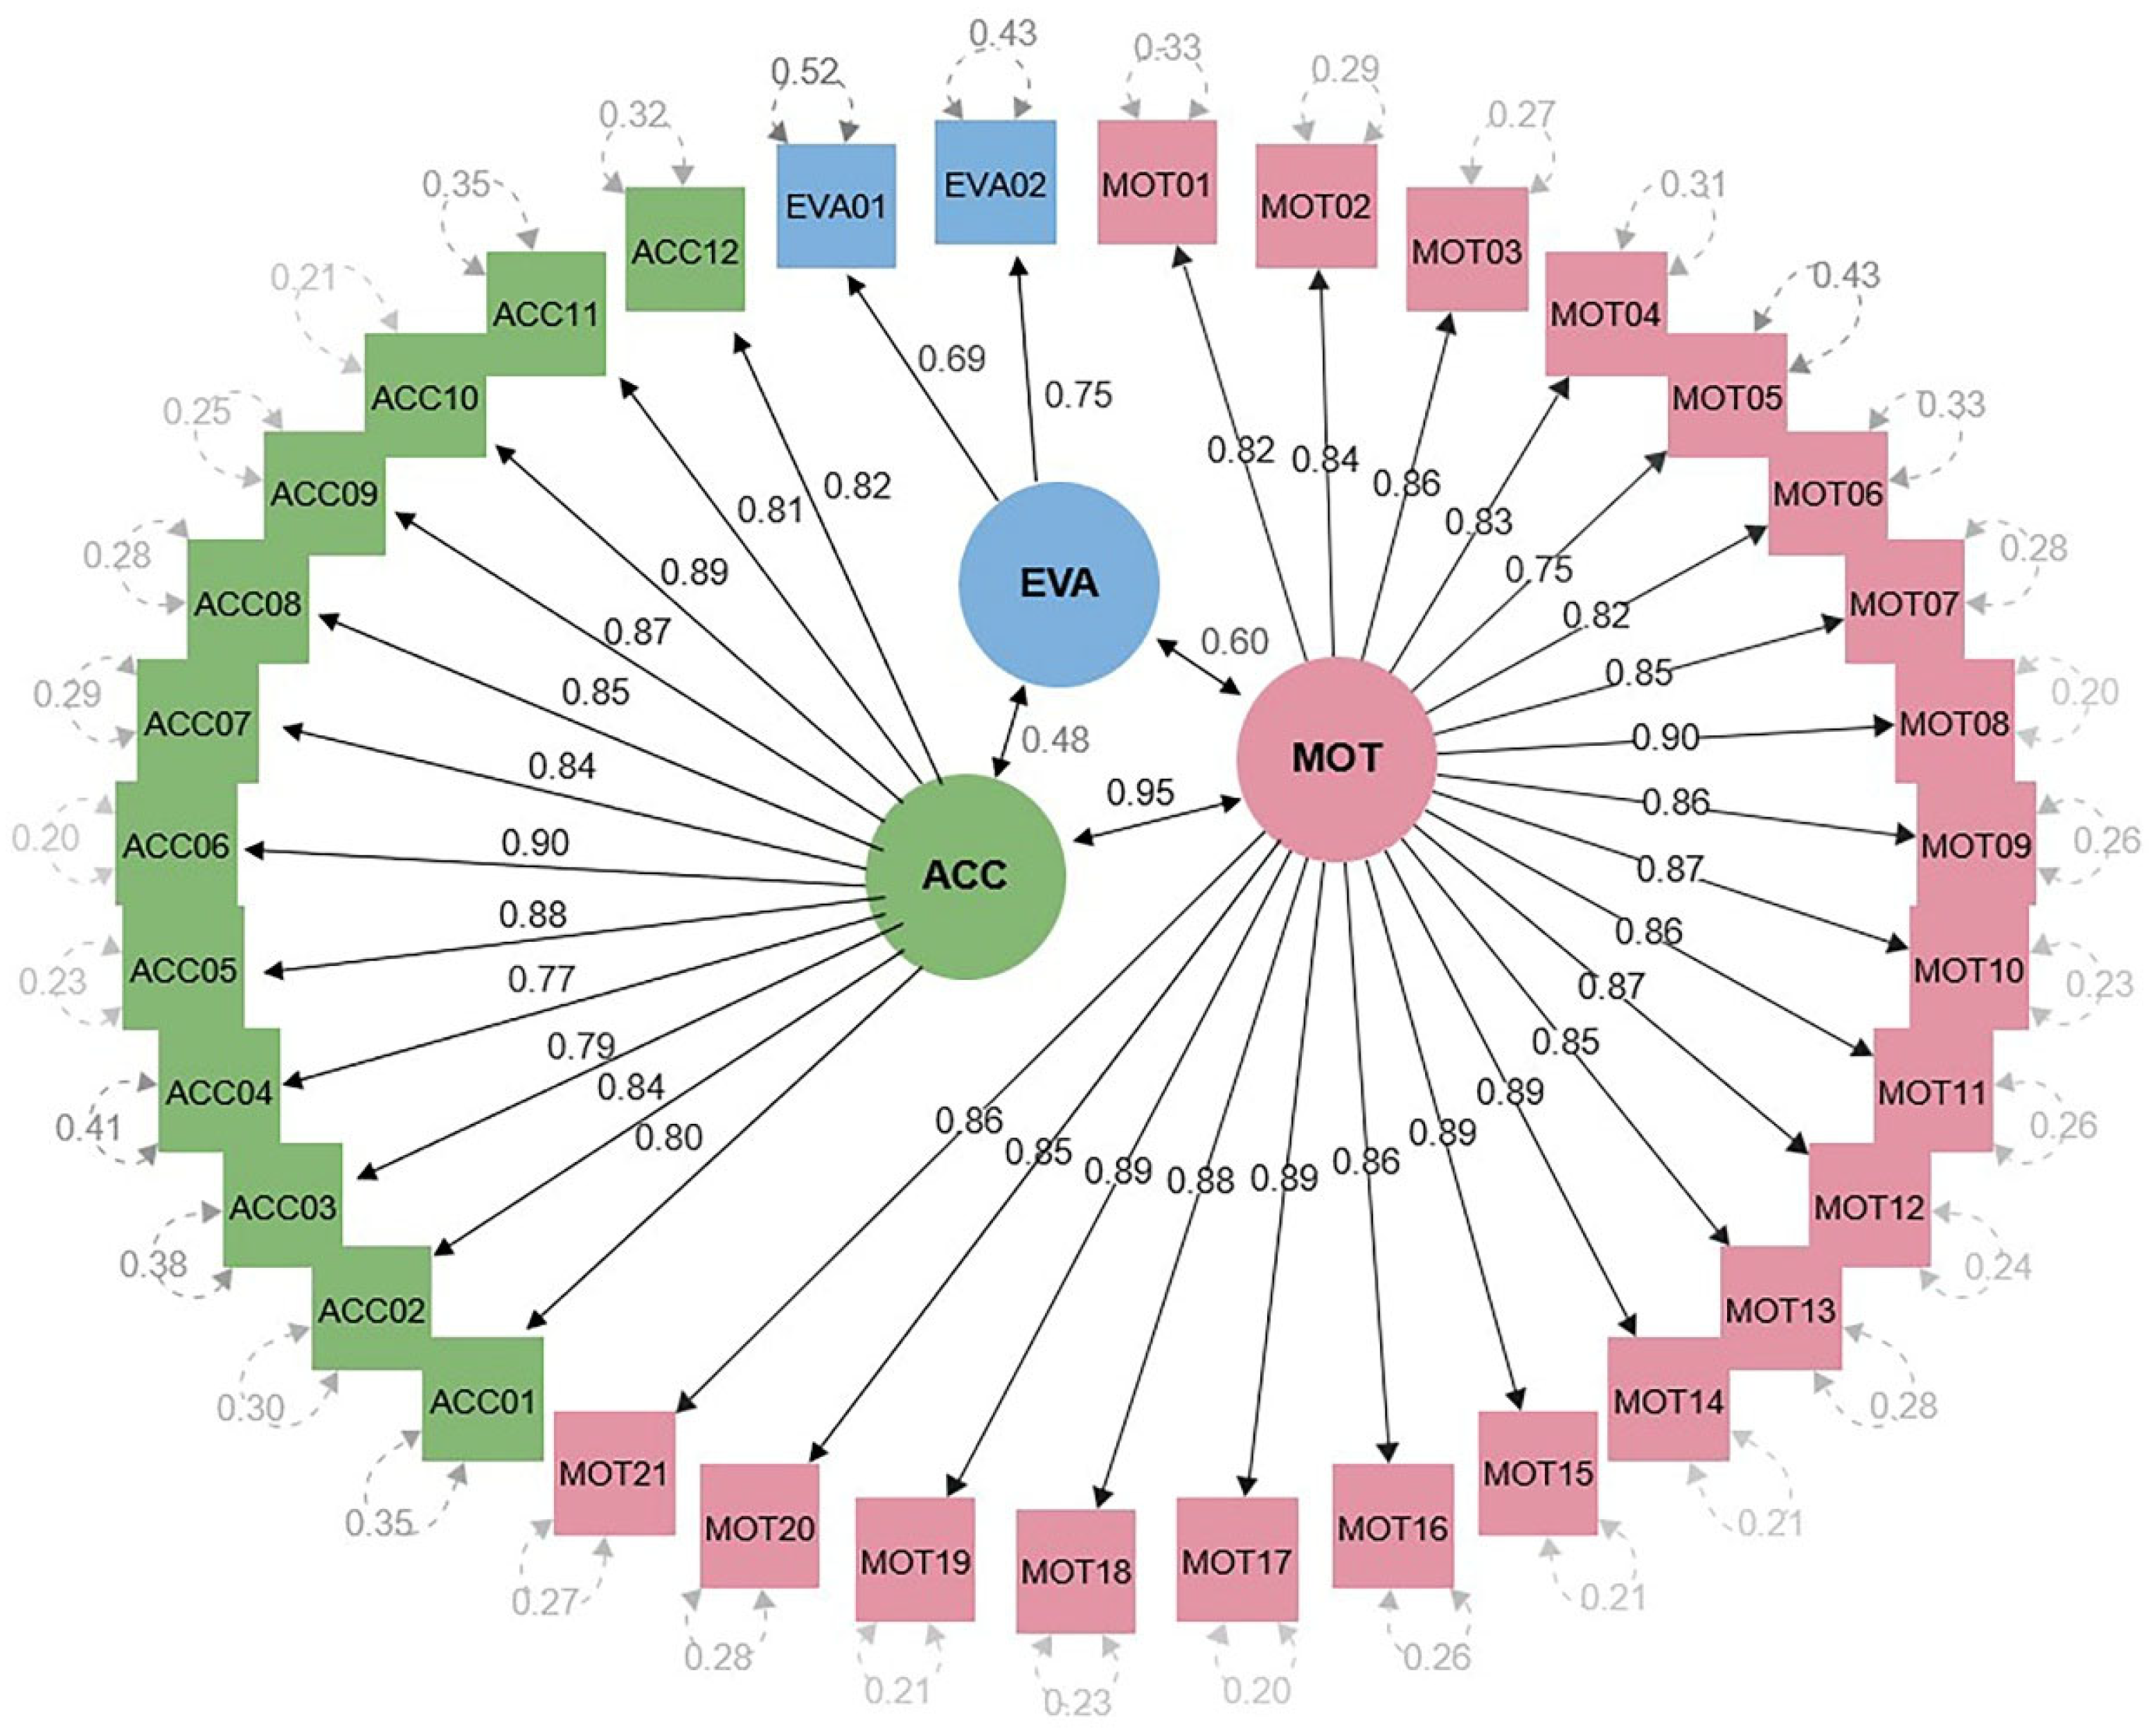
As previously mentioned, a Confirmatory Factor Analysis (CFA) was also conducted, considering the relevance of allowing the comparability of the model with future related research enabling cross-validation with the data obtained in this study. The method used for parameter estimation in the CFA carried out was maximum likelihood, and the fit indices used were Chi-square (χ2), degrees of freedom (χ2df), Comparative Fit Index (CFI), Tucker–Lewis Index (TLI), Standardized Root Mean Square Residual (SRMR) and Root Mean Square Error of Approximation (RMSEA) using standard criteria for assessing fit (Goretzko et al., 2024; Hu & Bentler, 1999). The following values were obtained: χ2(524) = 1478 (p < 0.0001), CFI = 0.86, TLI = 0.852, SRMR = 0.0449 and RMSEA = 0.0956; 90% Confidence Interval (0.0899–0.1010). In general, the data show an acceptable model fit. The factor loadings are appropriate, showing minimum values of 0.594 for item 21 and maximum values of 0.868 for item 33 (see flow diagram with Standardized Estimators in Figure 4).
Considering the factor loadings obtained, the items related to the level of motivation present estimators that vary mainly between 0.8 and 1.0, indicating generally high values. The confidence intervals for most items do not include the value 0, and p-values are consistently less than 0.001, suggesting that these estimates are statistically significant. The Standard Estimator varies but is generally around 0.8, suggesting good item reliability. This dimension suggests that the individuals assessed show a high level of motivation. The items related to the acceptance of AR technology also show high estimators, most of which are close to or exceed the value of 0.8. The p-values are <0.001, indicating statistical significance. The Standard Estimator for these items varies but generally remains around 0.75. This implies that the acceptance of this immersive technology is generally high among the students evaluated. The items of the dimension of acceptance of a digital assessment system have varying estimators, but all of them are significant with p-values < 0.001.
Given the high internal consistency and correlations between factors, two-factor models (G + MOT, ACC and EVA) were estimated as a sensitivity analysis to assess the possible predominance of a general factor. The full specification was not acceptable due to identification issues and negative latent variances, particularly in EVA, which consists of two items. After removing the specific EVA factor and retaining its items solely within G, the model converged adequately. The general factor exhibited high standardised loadings on MOT and ACC, whilst the specific factors retained moderate loadings on some of the items, suggesting relevant common variance, although insufficient to replace the correlated three-factor structure.

4. Discussion

As indicated in the Introduction and current state of the art, this study justifies the need for a validated questionnaire that can determine secondary education students’ perceptions of the use of general educational technological resources.
In particular, there is a need for tools developed on the basis of psychometric evidence of validity and reliability that enable us to characterise the perceptions and attitudes of students of STEM subjects towards the educational use of Augmented Reality (AR) in areas relating to technological acceptance and motivation, as well as in aspects linked to digital assessment, whilst avoiding the attribution of causal effects that have not been directly evaluated. All of this forms part of efforts to improve the quality of education in line with SDG 4 of the UN 2030 Agenda.
The analysis of the data obtained from the evaluations provided by the students through the attitudinal questionnaire designed ad hoc in this study allows us to determine that said questionnaire, as a research instrument, presents adequate technical characteristics for use in the evaluation of an innovative educational methodology.
The analysis of the responses to the items has also enabled verifying the functionality of the questionnaire to detect and determine the students’ opinion regarding the use of an innovative educational methodology. This methodology is based on the combination of an immersive AR technological resource and an adapted digital assessment system. In this sense, the analysed data reveal medium–high levels of the averages of students’ evaluations, with mean homogeneity associated with the responses in respect to the three dimensions that comprise the questionnaire: acceptance of the immersive educational technological resource, level of motivation and understanding of key concepts. This represents an indicator of the uniformity and reliability of the said evaluations. It also provides a validity argument to determine the acceptance of RA technology by students, in line with the results obtained by other related research in this field (Scherer et al., 2020). The reliability of the responses offered by the students allows us to verify the functionality of the questionnaire as a valid instrument to know their opinion.
The data analysed in this study on the factor structure of the questionnaire using Exploratory Factor Analysis (EFA) reveal the existence of a third factor associated with the acceptance of digital assessment (EVA), positively valued by the students in general. The data confirm that the set of the three factors, namely level of motivation, technological acceptance and acceptance of an adapted digital assessment system, better represents the internal structure of the questionnaire as a construct. However, the EVA dimension should be interpreted as a provisional emerging factor, as it initially comprises only two items. As a priority, it is advisable to expand the set of items in order to capture acceptance of digital assessment more comprehensively. To this end, it is proposed that sub-dimensions relating to equity, usability, accessibility, test anxiety, ethics/trust and the usefulness of the feedback be incorporated (Appendix C).
These data suggest that adapted assessment systems be incorporated as part of the educational methodological strategies based on the use of immersive AR technology. This finding is consistent with the hypothesis proposed some years ago by experts in digital technology such as Nieto (2016), in terms of enabling a positive effect produced by the use of an innovative methodology in combination with a digital evaluation system, in such a way as to generate profound methodological changes. These changes are based on specific skills and strategies related to the educational technological resource, which otherwise cannot be produced or quantified effectively with traditional assessment systems.
Similarly, these results are consistent with the views expressed by educational technology experts such as Spiteri and Chang Rundgren (2020). These experts uphold conclusions identical to the ones reflected in some relevant international reports, such as the one published years ago by the OECD (2015). This report raises the possibility that the widespread “disconnection” between the use of educational technology and gains in learning, and therefore, improvements in student performance, may be a direct consequence of the inadequate application of technological resources. These approaches also agree with other significant reports published recently, which also conclude that technology in general and immersive technology in particular, despite having a notable future projection in the field of education, is not capable of generating a greater impact on student learning on its own (Brown et al., 2020). Another conclusion derived from the EFA conducted in this study is the existence of a possible cross-loading in item 23. Following the recommendations of relevant experts such as Schmitt et al. (2018), who indicate the acceptability of fitting different models to the same data, and given the pertinence of allowing the comparability of the model developed in this study with future related research, the results of a Confirmatory Factor Analysis (CFA) have also been included. This allows cross-validation between the data obtained in this study and those obtained in future studies in which this instrument is administered to other different student samples. It is worth noting that not dividing the sample has avoided a reduction in the sample size and, therefore, a loss of precision and accuracy in the analysed data due to the random division of the main sample into two sub-samples smaller than the original sample (Fernández-Hernández et al., 2022; Schmitt et al., 2018). The results obtained in the CFA allow us to conclude that the individuals evaluated tend to show a high degree of motivation and acceptance. They also show a generally positive acceptance of the digital assessment system. The CFI and TLI means, and even the SRMR, indicate a good fit, but the RMSEA suggests that some adjustment of the model might be advisable, perhaps by modifying or removing a specific item, as previously mentioned. Table A4 (Appendix D) shows that items ACC02, MOT10, MOT14, MOT19 and MOT20 have relatively high cross-loadings, suggesting a possible conceptual overlap between dimensions. However, it has been decided to retain these items given their content relevance. With regard to item 23, it is necessary to distinguish between two levels of analysis: the overall fit of the model and the stability of the factor structure. The removal of the item resulted in a substantial improvement in the model’s fit indices (CFI = 0.999; RMSEA = 0.056). However, the factor structure remained virtually unchanged, both in terms of explained variance and the pattern of loadings, indicating that the three-factor solution is stable. For this reason, and in accordance with theoretical and content-related criteria, it was decided to retain the item in the final scale.
Furthermore, the data analysis supports the psychometric adequacy of the short version of the questionnaire, maintaining the original structural proportionality of the instrument. As a practical implication, a 12-item abbreviated version is proposed for educational contexts with time constraints.
In summary, regarding the underlying factor structure (RQ1), the results reveal a three-factor solution (motivation, technology acceptance, and digital evaluation) that is consistent with the theoretical framework and stable across different analytical procedures, thereby supporting the preliminary structural validity of the instrument. Regarding internal reliability (RQ2), both the overall scale and the subscales show high levels of internal consistency (α/ω), although the EVA dimension exhibits lower values, which is to be expected given its small number of items. Overall, the observed reliability supports the instrument’s suitability for preliminary use in comparative research. The proposed structure (RQ3) was confirmed via AFC with moderate overall fit indices, and sensitivity analyses (exclusion of item 23) suggest that the proposed solution is robust, given that excluding the item improves the fit but does not substantially alter either the structure or the reliability, suggesting the model’s stability. In addition, a specific component (RQ4) was identified, linked to attitudes toward digital assessment (EVA), which should be interpreted as an emerging and provisional factor since it consists of two items. This component suggests that, in educational experiences incorporating AR, digital assessment may constitute a distinct attitudinal factor that warrants further exploration and validation in future studies using different samples. Regarding the descriptive patterns present in the students’ responses (RQ5), they show favorable mean scores in the dimensions of motivation and technological acceptance, as well as a positive assessment of digital assessment, with moderate dispersion. These results suggest a generally positive acceptance of the AR-based experience, which should be interpreted as a reported perception and not as a causal effect on learning.
From a practical perspective, the instrument presented in this study provides a brief and traceable tool for teachers and researchers to observe the degree of acceptance, the level of motivation, and attitudes toward digital assessment in AR-STEM approaches in secondary education, facilitating agile and comparable diagnoses across groups, schools, or related educational experiences. The proposed 12-item abbreviated version improves feasibility in time-constrained contexts, and the preliminary identification of the EVA component offers guidance for designing and evaluating digital assessment systems that are more consistent with AR-based methodologies in terms of equity, usability, and accessibility.
Overall, the findings of this study are consistent with those reported by authors such as Doğru et al. (2025a) in identifying the potential of AR to enhance motivation for STEM learning. They also address the gaps identified in the literature review, offering an integrated and traceable instrument that combines: (i) the measurement of the degree of technological acceptance, aligned with TAM approaches in secondary education (Dou & Feng, 2025; Sungur & Ateş, 2023); (ii) the measurement of motivation levels, aligned with ARCS/IMMS (Prasetya et al., 2024); and (iii) a provisional and expandable emerging digital assessment (EVA) factor, which is consistent with recent studies on digital assessment (Siu et al., 2024; Tat & Kiliç, 2024). Therefore, this study addresses the existing methodological gap in XR/AR contexts, highlighted by authors such as Lampropoulos and Evangelidis (2025); Li et al. (2025), Sakr and Abdullah (2024) and Zhang et al. (2024), regarding the need for instruments that enable the collection of evidence and systematic measurement, overcoming the fragmentation by constructs when analysing specific previous scales such as those proposed in their work by Gandolfi and Ferdig (2025) and Huang and Shih (2025), within a combined framework of acceptance/motivation/evaluation. Furthermore, the methodological design incorporates gamification-based activities, thereby reducing screen time, and the findings are reported with a focus on transparency and replicability in terms of content validity and preliminary factor structure. All of this will facilitate comparability and the development of future studies on experiences based on innovative methodologies in the field of AR-STEM in Secondary Education.

5. Future Directions

While the findings presented are promising, they should be interpreted as an initial step in the process of validating this instrument for its application within the framework of active and innovative AR-STEM methodologies.
As explained, the short version of the questionnaire maintains a high level of reliability whilst reducing redundancy; however, it will require a further process of cross-validation using independent samples.
The evaluation of the two-factor model was constrained by the presence of a factor comprising just two items (EVA), which limits the ability to identify more complex specifications. It is recommended that this dimension be expanded and that the analysis be replicated on an independent sample. In this regard, bearing in mind that the EVA dimension should be interpreted as a provisional emergent factor as it initially comprises two items, it is proposed, as a priority for future research, to expand the set of items to capture acceptance of digital assessment more comprehensively, incorporating sub-dimensions related to equity, usability, accessibility, test anxiety, ethics/trust and the usefulness of the response. This expansion must first undergo content validation through expert judgement, cognitive interviews and subsequent psychometric validation in an independent sample using EFA/CFA and reliability indices (α/ω).
Given that the EFA and CFA were conducted on the same sample, it is advisable to repeat the validation on a different sample to ensure the stability and generalisability of the factor structure. In this regard, the fit of the confirmatory model should be interpreted as moderate and in need of improvement; therefore, it is recommended that, in future research, the set of items be refined (particularly: ACC02, MOT10, MOT14, MOT19 and MOT20) and the validation be replicated in an independent sample to optimise the factor structure and its fit indices.
Future research with larger and more diverse samples will strengthen the evidence base. Exploring the instrument’s applications in other educational contexts will also help establish its generalisability.

6. Conclusions

This study presents a fully designed and validated instrument to measure motivation, technological acceptance, and attitudes toward digital assessment in STEM subjects that integrate gamification processes based on immersive AR educational resources. The analyses supported a three-factor solution with high internal consistency, providing evidence of reliability. However, the high coefficients suggest that some items could be optimised to improve efficiency. Students reported generally positive perceptions regarding technological acceptance, motivation and perceived understanding through an educational methodology based on Augmented Reality (AR), as well as a favourable assessment of the associated digital assessment. The identification of a factor linked to digital assessment in the context of an AR educational experience constitutes an emerging and preliminary finding, suggesting the desirability of expanding research on technology acceptance to incorporate specific dimensions of digital assessment. These results should be interpreted as evidence of attitudes and perceptions rather than as direct estimates of causal effects on learning, which would require objective measures and experimental designs.
Overall, the instrument presented is a valid, reliable, and practical tool with a robust theoretical basis for studying student responses to AR-enhanced learning. With its application in future studies and with other student samples, it can contribute to a deeper understanding of how immersive technologies are received in educational settings and how they can support the design of more effective and efficient educational interventions.

Author Contributions

Conceptualization, S.D.-R., S.C.-D. and R.G.-F.; methodology, S.D.-R.; software, S.D.-R.; validation, S.D.-R., S.C.-D. and R.G.-F.; formal analysis, S.D.-R.; investigation, S.D.-R.; resources, S.D.-R.; data curation, S.D.-R.; writing—original draft, S.D.-R.; writing—review and editing, S.D.-R., S.C.-D. and R.G.-F.; visualization, S.D.-R., S.C.-D. and R.G.-F.; supervision, S.C.-D. and R.G.-F.; project administration, S.D.-R., S.C.-D. and R.G.-F.; funding acquisition, R.G.-F. All authors have read and agreed to the published version of the manuscript.

Funding

Authors acknowledge funding from RePo-SUDOE, with project reference S1/1.1/P0033, a project co-financed by the Interreg Sudoe Programme through the European Regional Development Fund (ERDF). RGF also thanks to Spanish Agencia Estatal de Investigación (AEI) and the ERDF (PID2022-141534OB-I00 and CNS2023-144353), by Xunta de Galicia (ED431C 2025/15, ED431C 2021/21 and Centro de investigación do Sistema universitario de Galicia accreditation 2023–2027, ED431G 2023/03) and the European Union (European Regional Development Fund—ERDF).

Institutional Review Board Statement

The study was conducted in accordance with the Declaration of Helsinki, and approved by the Institutional Review Board of the Universidad Camilo José Cela (UCJC).

Informed Consent Statement

Informed consent was obtained from all students involved in this study.

Data Availability Statement

The data supporting the reported results in this study are not publicly available due to privacy and ethical restrictions. However, the datasets are available from the corresponding author upon request, subject to institutional and ethical approval.

Acknowledgments

The authors thank the students and teachers for their availability and interest in participating in this study.

Conflicts of Interest

The authors declare no conflicts of interest. The funders had no role in the design of the study; in the collection, analyses, or interpretation of data; in the writing of the manuscript, and in the decision to publish the results.

Appendix A

Table A1. Final questionnaire administered to students, including items, abbreviations and statements.
ItemAbbreviationStatement
Item 01MOT01The Augmented Reality (AR) app I used in class helped me focus on the concept it explained.
Item 02MOT02The AR app I used in class can help me get a better grade on the exam.
Item 03ACC01This methodology using an AR app really caught my attention.
Item 04MOT03This AR methodology helps me understand the concepts it explains.
Item 05ACC02Overall, I find this methodology interesting.
Item 06ACC03I think using this methodology is useful for my academic training.
Item 07MOT04The content of the AR app I used seems quite accurate.
Item 08MOT05When I downloaded the AR app, I had the impression that it would help me better understand the concept it explained.
Item 09ACC04I’m confident that I could easily pass an exam on the key concept the AR app explains.
Item 10ACC05While using the app, I felt it could be useful.
Item 11ACC06When I used the app, I was confident that I would learn what I needed to know about the concept it explained.
Item 12ACC07I find the AR app I used in class useful and engaging.
Item 13ACC08Overall, I enjoyed using this AR app.
Item 14ACC09I’m happy to be able to learn with this AR app.
Item 15ACC10The app helped me understand the concept it explains quite well.
Item 16MOT06I consider the academic results I obtained after using this app satisfactory.
Item 17MOT07I think it’s important to have an AR app like the one I used in class to better understand some key concepts.
Item 18MOT08I find the content of the app I used important.
Item 19MOT09I think understanding the content of the AR app will help me improve my exam grade.
Item 20ACC11I believe that for an AR app to be relevant to my learning, it also needs to be easy to use.
Item 21EVA01I think it’s important to take the exam online.
Item 22MOT10Using this AR app allows me to better understand some important key concepts.
Item 23MOT11I believe that, overall, the AR app I used can be useful.
Item 24MOT12Using AR apps would motivate me in the learning process.
Item 25MOT13I think I could achieve better results if teachers used AR apps.
Item 26EVA02I think I can get a better grade if I take the exam online.
Item 27ACC12It was easy to learn how to use the application.
Item 28MOT14Its ease of use made it easier for me to understand the concept.
Item 29MOT15When the application is easy to use, my results improve.
Item 30MOT16I find the ease of use satisfactory.
Item 31MOT17Using AR can make it easier for me to understand.
Item 32MOT18It can help me improve my academic results.
Item 33MOT19This technology helps me understand the teacher clearly.
Item 34MOT20I understood the concept better with AR than with a book.
Item 35MOT21I understood it better with AR than with a video.

Appendix B

Table A2. Abridged questionnaire.
ItemTheoretical
Factor
Primary
Factor
Primary
Loading
Secondary
Loading
Absolute DifferenceCommunality
(h2)
Complexity
ACC11ACCPA11.0310.2170.8140.7451.089
ACC08ACCPA10.9740.0790.8960.7581.020
ACC07ACCPA10.9330.2350.6980.7741.173
ACC03ACCPA30.8460.0540.7920.7101.013
EVA02EVAPA20.8630.3060.5570.4031.253
EVA01EVAPA20.5950.1480.4470.2531.125
MOT03MOTPA30.9200.1540.7660.8681.096
MOT02MOTPA30.7310.2070.5250.7831.159
MOT18MOTPA20.6490.1980.4510.8121.253
MOT21MOTPA20.6480.2270.4210.7671.256
MOT07MOTPA20.6280.2700.3580.7511.359
MOT01MOTPA30.6270.2560.3700.7191.325
Note. Primary loading = highest absolute factor loading; Secondary loading = second highest absolute loading; Loading difference = primary minus secondary loading; h2 = communality; Complexity = item loading dispersion across factors. Reliability coefficients: Global α = 0.926; Motivation α = 0.921; Acceptance α = 0.875; Evaluation ρSB = 0.638 (two-item subscale).

Appendix C

Table A3. Proposed sub-dimensions and items for expanding the EVA factor.
FactorSubdimensionItemStatement
EVAEquityEVA/FAI1I believe that the digital assessment applied was fair to all students.
EVA/FAI2The digital assessment evaluated my learning without favoring those with more technological experience.
UsabilityEVA/USE1The assessment tool was easy to use during the test.
EVA/USE2I was able to complete the digital assessment without any technical issues that affected my academic performance.
AccessibilityEVA/ACC1The digital assessment was accessible to me (device, connection, display options).
EVA/ACC2The digital assessment offered options (font size, clarity, navigation) that facilitated my response.
AnxietyEVA/ANX1I felt at ease while taking the digital assessment.
EVA/ANX2I felt safe and in control during the digital assessment.
Ethics/trustEVA/TRU1I trust that the results of the digital assessment reflect my actual performance.
EVA/TRU2I believe that digital assessment reduces dishonest or unethical practices.
Usefulness of feedbackEVA/FBK1The digital assessment provided me with useful information for improvement.
EVA/FBK2Thanks to the information received, I better understood my mistakes and the aspects to improve.
Note. EVA = Digital Assessment Acceptance. Subdimension codes: FAI = Fairness (Equity); USE = Usability; ACC = Accessibility; ANX = Anxiety; TRU = Trust (Ethics/Integrity); FBK = Feedback usefulness. Item codes indicate the factor/subdimension and the item number within that subdimension.

Appendix D

Table A4. Final instrument.
ID ItemAbrevItemPlanned
Construction
PA1PA2PA3EFA
Factor
EFA LoadSecond
EFA Load
Delta EFACFA FactorCFA Load
Item 01MOT01The Augmented Reality (AR) app I used in class helped me focus on the concept it explained.Motivation0.241275739−0.0029239510.596114606PA30.5961146060.2412757390.354838867Motivation0.747426595
Item 02MOT02The AR app I used in class can help me get a better grade on the exam.Motivation−0.0531060390.2414712860.705328533PA30.7053285330.2414712860.463857247Motivation0.791569298
Item 03ACC01This methodology using an AR app really caught my attention.Acceptance0.403227644−0.1643841320.56027751PA30.560277510.4032276440.157049865Acceptance0.753825811
Item 04MOT03This AR methodology helps me understand the concepts it explains.Motivation−0.11986540.1223720180.903034466PA30.9030344660.1223720180.780662448Motivation0.786734776
Item 05ACC02Overall, I find this methodology interesting.Acceptance0.4892383−0.2257979580.552369676PA30.5523696760.48923830.063131376Acceptance0.782656272
Item 06ACC03I think using this methodology is useful for my academic training.Acceptance0.050863752−0.0464862840.7946354PA30.79463540.0508637520.743771647Acceptance0.719257841
Item 07MOT04The content of the AR app I used seems quite accurate.Motivation0.247464410.0967959010.519893405PA30.5198934050.247464410.272428996Motivation0.775658431
Item 08MOT05When I downloaded the AR app, I had the impression that it would help me better understand the concept it explained.Motivation−0.0592050750.320583210.53080957PA30.530809570.320583210.210226361Motivation0.707257807
Item 09ACC04I’m confident that I could easily pass an exam on the key concept the AR app explains.Acceptance0.374821830.2094944850.169442612PA10.374821830.2094944850.165327345Acceptance0.708187455
Item 10ACC05While using the app, I felt it could be useful.Acceptance0.4413603420.182805210.273216612PA10.4413603420.2732166120.16814373Acceptance0.839939854
Item 11ACC06When I used the app, I was confident that I would learn what I needed to know about the concept it explained.Acceptance0.4458037040.2386590280.225143936PA10.4458037040.2386590280.207144676Acceptance0.847151577
Item 12ACC07I find the AR app I used in class useful and engaging.Acceptance0.915696502−0.2009445760.101617343PA10.9156965020.2009445760.714751925Acceptance0.831254729
Item 13ACC08Overall, I enjoyed using this AR app.Acceptance1.005044141−0.063811164−0.114123548PA11.0050441410.1141235480.890920594Acceptance0.835539381
Item 14ACC09I’m happy to be able to learn with this AR app.Acceptance0.787159829−0.0033858430.065301581PA10.7871598290.0653015810.721858248Acceptance0.844910062
Item 15ACC10The app helped me understand the concept it explains quite well.Acceptance0.4376626940.2168279590.238143973PA10.4376626940.2381439730.199518721Acceptance0.835226705
Item 16MOT06I consider the academic results I obtained after using this app satisfactory.Motivation0.2855389020.4593399860.10874844PA20.4593399860.2855389020.173801084Motivation0.799239603
Item 17MOT07I think it’s important to have an AR app like the one I used in class to better understand some key concepts.Motivation0.1819141150.6832339040.004070044PA20.6832339040.1819141150.50131979Motivation0.808552813
Item 18MOT08I find the content of the app I used important.Motivation0.4704851260.1732594760.285161663PA10.4704851260.2851616630.185323462Motivation0.855991562
Item 19MOT09I think understanding the content of the AR app will help me improve my exam grade.Motivation0.2367857040.6214415680.034641259PA20.6214415680.2367857040.384655864Motivation0.830199732
Item 20ACC11I believe that for an AR app to be relevant to my learning, it also needs to be easy to use.Acceptance0.961365557−0.1841576320.015144083PA10.9613655570.1841576320.777207924Acceptance0.798769845
Item 21EVA01I think it’s important to take the exam online.Assessment−0.1621429560.5219083070.044085854PA20.5219083070.1621429560.359765351Evaluation0.605176948
Item 22MOT10Using this AR app allows me to better understand some important key concepts.Motivation0.4241091810.4710384460.009083812PA20.4710384460.4241091810.046929265Motivation0.841934776
Item 23MOT11I believe that, overall, the AR app I used can be useful.Motivation0.5204457750.316593190.051819716PA10.5204457750.316593190.203852586Motivation0.823077231
Item 24MOT12Using AR apps would motivate me in the learning process.Motivation0.5579285890.445689324−0.105831713PA10.5579285890.4456893240.112239264Motivation0.841203598
Item 25MOT13I think I could achieve better results if teachers used AR apps.Motivation0.3795147090.623729202−0.136872524PA20.6237292020.3795147090.244214493Motivation0.814587084
Item 26EVA02I think I can get a better grade if I take the exam online.Assessment−0.2307552520.740394495−0.056523979PA20.7403944950.2307552520.509639243Evaluation0.773786879
Item 27ACC12It was easy to learn how to use the application.Acceptance0.595604596−0.0245174280.234957523PA10.5956045960.2349575230.360647072Acceptance0.758950962
Item 28MOT14Its ease of use made it easier for me to understand the concept.Motivation0.4395609030.4084634440.076643384PA10.4395609030.4084634440.031097459Motivation0.866071454
Item 29MOT15When the application is easy to use, my results improve.Motivation0.284840340.4946356830.142088715PA20.4946356830.284840340.209795342Motivation0.859492718
Item 30MOT16I find the ease of use satisfactory.Motivation0.5312021040.2330925670.121212516PA10.5312021040.2330925670.298109537Motivation0.825429926
Item 31MOT17Using AR can make it easier for me to understand.Motivation0.1184954780.6383336760.173614122PA20.6383336760.1736141220.464719553Motivation0.862683024
Item 32MOT18It can help me improve my academic results.Motivation0.035341970.7104940820.173276217PA20.7104940820.1732762170.537217865Motivation0.847527647
Item 33MOT19This technology helps me understand the teacher clearly.Motivation0.4432434610.480293513−0.00250358PA20.4802935130.4432434610.037050051Motivation0.870879174
Item 34MOT20I understood the concept better with AR than with a book.Motivation0.372757750.4184017730.098238407PA20.4184017730.372757750.045644022Motivation0.826456361
Item 35MOT21I understood it better with AR than with a video.Motivation0.1449264260.7315018440.00529655PA20.7315018440.1449264260.586575418Motivation0.82353913

References

  1. Abeywardena, I. S. (2023). OXREF: Open XR for education framework. The International Review of Research in Open and Distributed Learning, 24(3), 185–206. [Google Scholar] [CrossRef] [Scilit]
  2. Aiken, L. (1980). Content validity and reliability of single items or questionnaires. Educational and Psychological Measurement, 40(4), 955–959. [Google Scholar] [CrossRef] [Scilit]
  3. Brown, M., McCormack, M., Reeves, J., Brooks, C., Grajek, G., Alexander, B., Bali, M., Bulger, S., Dark, S., Engelbert, N., Gannon, K., Gauthier, A., Gibson, D., Gibson, R., Lundin, B., Veletsianos, G., & Weber, N. (2020). 2020 EDUCAUSE horizon report, teaching and learning edition. EDUCAUSE. Available online: https://bit.ly/3NEgnB5 (accessed on 24 September 2025).
  4. Cabero, J., & Barroso, J. (2013). La utilización del Juicio de experto para la evaluación de TIC: El coeficiente de competencia experta. Bordón. Revista de Pedagogía, 65(2), 25–38. [Google Scholar] [CrossRef] [Scilit]
  5. Cabrera-Nguyen, P. (2010). Author guidelines for reporting scale development and validation results in the Journal of the Society for Social Work and Research. Journal of the Society for Social Work and Research, 1(2), 99–103. [Google Scholar] [CrossRef] [Scilit]
  6. Crogman, H. T., Cano, V. D., Pacheco, E., Sonawane, R. B., & Boroon, R. (2025). Virtual reality, augmented reality, and mixed reality in experiential learning: Transforming educational paradigms. Education Sciences, 15(3), 303. [Google Scholar] [CrossRef] [Scilit]
  7. Davis, F. D. (1989). Perceived usefulness, perceived ease of use, and user acceptance of information technology. MIS Quarterly, 13(3), 319–340. [Google Scholar] [CrossRef] [Scilit] [PubMed]
  8. Delgado, S. (2021). Diseño, desarrollo y validación de un modelo metodológico educativo basado en software inmersivo de realidad aumentada como recurso didáctico. Mejora en el aprendizaje de ciencias en educación secundaria [Doctoral dissertation, Camilo José Cela University]. Publications Service of the Camilo José Cela University. Available online: https://bit.ly/4ayNHTP (accessed on 10 October 2025).
  9. Delgado-Rodríguez, S., Carrascal Domínguez, S., & García-Fandiño, R. (2023a). Design, development and validation of an educational methodology using immersive augmented reality for STEAM education. Journal of New Approaches in Educational Research, 12(1), 19–39. [Google Scholar] [CrossRef] [Scilit]
  10. Delgado-Rodríguez, S., Carrascal Domínguez, S., & García-Fandiño, R. (2023b). Grado de aceptación de los sistemas de evaluación digitales adaptados al uso de recursos tecnológicos educativos basados en Realidad Aumentada. Revista Latinoamericana De Tecnología Educativa-RELATEC, 22(2), 135–148. [Google Scholar] [CrossRef] [Scilit]
  11. Doğru, M. S., Yüzbaşıoğlu, F., & Arpaci, I. (2025a). A bibliometric trend analysis of augmented reality in STEM education. Innovations in Education and Teaching International, 62(6), 1933–1948. [Google Scholar] [CrossRef] [Scilit]
  12. Doğru, M. S., Yüzbaşıoğlu, F., & Arpaci, I. (2025b). The effect of interactive videos enhanced with pop-up questions on teacher candidates’ learning performance in science. Research in Science & Technological Education, 43(1), 312–327. [Google Scholar] [CrossRef] [Scilit]
  13. Dou, G., & Feng, Y. (2025). Psychometric validation of the information technology acceptance scale for Chinese high school teacher. Frontiers in Education, 10, 1678302. [Google Scholar] [CrossRef] [Scilit]
  14. Fabrigar, L. R., Wegener, D. T., MacCallum, R. C., & Strahan, E. J. (1999). Evaluating the use of exploratory factor analysis in psychological research. Psychological Methods, 4(3), 272–299. [Google Scholar] [CrossRef]
  15. Fernández-Hernández, J.-L., Herranz-Hernández, P., & Segovia-Torres, L. (2022). Validación cruzada sobre una misma muestra: Una práctica sin fundamento. R.E.M.A. Revista Electrónica de Metodología Aplicada, 24(1), 38–40. [Google Scholar] [CrossRef] [Scilit]
  16. Gandolfi, E., & Ferdig, R. E. (2025). Exploring the relationship between motivation and augmented reality presence using the augmented reality presence scale (ARPS). Educational Technology Research and Development, 73, 793–814. [Google Scholar] [CrossRef] [Scilit]
  17. Garzón, J., Pavón, J., & Baldiris, S. (2019). Systematic review and meta-analysis of augmented reality. Virtual Reality, 23, 447–459. [Google Scholar] [CrossRef] [Scilit]
  18. Goretzko, D., Siemund, K., & Sterner, P. (2024). Evaluating model fit of measurement models in confirmatory factor analysis. Educational and Psychological Measurement, 84(1), 123–144. [Google Scholar] [CrossRef] [Scilit] [PubMed]
  19. Hair, J., Black, W., Babin, B., & Anderson, R. (2018). Multivariate data analysis (8th ed.). Cengage Learning, EMEA. [Google Scholar]
  20. Hu, L. T., & Bentler, P. M. (1999). Cutoff criteria for fit indexes in covariance structure analysis: Conventional criteria versus new alternatives. Structural Equation Modeling: A Multidisciplinary Journal, 6(1), 1–55. [Google Scholar] [CrossRef] [Scilit]
  21. Huang, S.-L., & Shih, C.-T. (2025). Object presence: Conceptualization and scale development. International Journal of Human-Computer Interaction, 1–21. [Google Scholar] [CrossRef] [Scilit]
  22. Johnson, H., McNally, S., Rolfe, H., Ruiz-Valenzuela, J., Savage, R., Vousden, J., & Wood, C. (2019). Teaching assistants, computers and classroom management. Labour Economics, 58, 21–36. [Google Scholar] [CrossRef] [Scilit]
  23. Keller, J. (2010). Motivational design for learning and performance. The ARCS model approach. Springer. [Google Scholar]
  24. Köroğlu, M. (2025). Pioneering virtual assessments: Augmented reality and virtual reality adoption among teachers. Education and Information Technologies, 30, 9901–9948. [Google Scholar] [CrossRef] [Scilit]
  25. Lampropoulos, G., & Evangelidis, G. (2025). Learning analytics and educational data mining in augmented reality, virtual reality, and the metaverse: A systematic literature review, content analysis, and bibliometric analysis. Applied Sciences, 15(2), 971. [Google Scholar] [CrossRef] [Scilit]
  26. Lampropoulos, G., Keramopoulos, E., Diamantaras, K., & Evangelidis, G. (2023). Integrating augmented reality, gamification, and serious games in computer science education. Education Sciences, 13(6), 618. [Google Scholar] [CrossRef] [Scilit]
  27. Li, G., Luo, H., Chen, D., Wang, P., Yin, X., & Zhang, J. (2025). Augmented reality in higher education: A systematic review and meta-analysis of the literature from 2000 to 2023. Education Sciences, 15(6), 678. [Google Scholar] [CrossRef] [Scilit]
  28. Lorenzo-Seva, U., & Ferrando, P. J. (2013). FACTOR 9.2: A comprehensive program for fitting exploratory and semiconfirmatory factor analysis and IRT models. Applied Psychological Measurement, 37(6), 497–498. [Google Scholar] [CrossRef] [Scilit]
  29. López-Aguado, M., & Gutiérrez-Provecho, L. (2019). Cómo realizar e interpretar un análisis factorial exploratorio utilizando SPSS. REIRE Revista d’Innovació I Recerca En Educació, 12(2), 1–14. [Google Scholar] [CrossRef] [Scilit]
  30. Magaña, E. C., Ariza, A. C., Ruiz-Palmero, J., & Guillén-Gámez, F. D. (2025). Virtual, augmented, and mixed reality in the University environment: An analysis of scientific production. Journal of New Approaches in Educational Research, 14, 8. [Google Scholar] [CrossRef] [Scilit]
  31. Nieto, E. (2016). El papel de las tecnologías en el desarrollo de los aprendizajes y en la mejora del rendimiento académico. In M. Rodríguez, E. Nieto, & R. Sumozas (Eds.), Las tecnologías en educación. Hacia la calidad educativa (pp. 17–33). Síntesis. [Google Scholar]
  32. Organisation for Economic Cooperation and Development (OECD). (2015). Students, computers and learning: Making the connection. PISA, OECD Publishing. [Google Scholar] [CrossRef] [Scilit]
  33. Peikos, G., & Sofianidis, A. (2024). What is the future of augmented reality in science teaching and learning? An exploratory study on primary and pre-school teacher students’ views. Education Sciences, 14(5), 480. [Google Scholar] [CrossRef] [Scilit]
  34. Peterson, R. A. (1994). A meta-analysis of Cronbach’s coefficient alpha. Journal of Consumer Research, 21(2), 381–391. [Google Scholar] [CrossRef] [Scilit]
  35. Prasetya, F., Fortuna, A., Samala, A. D., Rawas, S., Mystakidis, S., Syahril, Waskito, Primawati, Wulansari, R. E., & Kassymova, G. K. (2024). The impact of augmented reality learning experiences based on the motivational design model: A meta-analysis. Social Sciences & Humanities Open, 10, 100926. [Google Scholar] [CrossRef] [Scilit]
  36. Sakr, A., & Abdullah, T. (2024). Virtual, augmented reality and learning analytics impact on learners, and educators: A systematic review. Education and Information Technologies, 29, 19913–19962. [Google Scholar] [CrossRef] [Scilit]
  37. Sáez, J. (2017). Investigación educativa. Fundamentos teóricos, procesos y elementos prácticos (1st ed.). UNED. [Google Scholar]
  38. Scherer, R., Siddiq, F., & Tondeur, J. (2020). All the same or different? Revisiting measures of teachers’. Computers & Education, 143, 103656. [Google Scholar] [CrossRef] [Scilit]
  39. Schmitt, T., Sass, D., Chappelle, W., & Thompson, W. (2018). Selecting the “Best” factor structure and moving measurement validation forward: An illustration. Journal of Personality Assessment, 100(4), 345–362. [Google Scholar] [CrossRef] [Scilit]
  40. Siu, O., Lui, K. F. H., Huang, Y., Ng, T. K., & Yeung, W. L. V. (2024). An efficient, reliable and valid assessment for affective states during online learning. Scientific Reports, 14, 15768. [Google Scholar] [CrossRef] [Scilit] [PubMed]
  41. Spiteri, M., & Chang Rundgren, S. N. (2020). Literature review on the factors EFActing primary teachers’ use of digital technology. Technology, Knowledge and Learning, 25(1), 115–128. [Google Scholar] [CrossRef] [Scilit]
  42. Sun, J., & Liao, T. (2025). Designing adaptive feedback systems for managing cognitive load in augmented reality. Design Science, 11, e49. [Google Scholar] [CrossRef] [Scilit]
  43. Sungur, K., & Ateş, H. (2023). An examination of the effect of technology-based STEM education training in the framework of technology acceptance model. Education and Information Technologies, 28, 8761–8787. [Google Scholar] [CrossRef] [Scilit]
  44. Tat, O., & Kiliç, A. F. (2024). Electronic assessment anxiety scale: Development, validity and reliability. Turkish Online Journal of Distance Education, 25(4), 17–32. [Google Scholar] [CrossRef] [Scilit]
  45. Tawil, S. (2020). Six months into a crisis: Reflections on international efforts to harness technology to maintain the continuity of learning. UNESCO. Available online: https://bit.ly/48v6ihK (accessed on 21 October 2025).
  46. Venkatesh, V., Morris, M. G., Davis, G. B., & Davis, F. D. (2003). User acceptance of information technology: Toward a unified view. MIS Quarterly, 27(3), 425–478. [Google Scholar] [CrossRef] [Scilit]
  47. Zhang, Y., Feijoo-Garcia, M. A., Gu, Y., Popescu, V., Benes, B., & Magana, A. J. (2024). Virtual and augmented reality in science, technology, engineering, and mathematics (STEM) education: An umbrella review. Information, 15(9), 515. [Google Scholar] [CrossRef] [Scilit]
Figure 1. (a) Gender of participants; (b) age of students. (Percentages calculated on n = 199).
Education 16 00870 g001
Figure 2. (a) Previous use of AR in classroom; (b) regular use of technology-based assessment systems. (Percentages calculated on n = 199).
Education 16 00870 g002
Figure 3. Parallel Analysis Scree Plots.
Education 16 00870 g003
Figure 4. Confirmatory Factor Analysis (CFA).
Education 16 00870 g004
Table 1. Structure of the initial questionnaire.
FrameworkDimensionsIndicatorsÍtems
IMMS/ARCSLevel of MotivationAttention1–4
Confidence5–7
Satisfaction8–10
Relevance11–13
TAMLevel of Acceptance of AR TechnologyPerceived Usefulness14–17
Perceived Ease of Use18–20
Perceived comprehensionLevel of Understanding of Key ConceptsPerceived Ease of Understanding of Key Concepts21–26
Note: Pre-expert review version (n = 26).
Table 2. Aiken’s V coefficients for each item (n = 26).
ItemAppropriateness and
Relevance
Adequacy and Clarity
VV
10.80.7
20.80.7
30.80.7
40.70.5
50.70.7
60.70.6
70.80.8
80.80.7
90.80.8
100.80.9
110.90.9
120.80.6
130.80.8
140.80.8
150.60.4
160.80.7
170.80.7
180.80.5
190.80.8
200.80.6
210.80.6
220.80.6
230.80.6
240.90.9
250.80.8
260.80.8
Table 3. Mean and standard deviation of the questionnaire items.
IndicatorItemAbbrev.M ± SDInternal
Consistency
Correlations
AlphaωItem-TotalMOTACCEVA
AttentionItem 1MOT013.55 ± 1.230.9790.9800.7530.7370.7420.313
Item 2MOT023.30 ± 1.180.9790.9800.7940.7890.7580.350
Item 3ACC013.90 ± 1.100.9790.9800.7280.7060.7430.247
Item 4MOT033.58 ± 1.150.9790.9800.7990.7800.7850.349
Item 5ACC023.90 ± 1.120.9790.9800.7460.7150.7770.260
Item 6ACC033.61 ± 1.170.9790.9810.7100.6980.7000.278
Item 7MOT043.68 ± 1.050.9790.9800.7820.7670.7690.314
ConfidenceItem 8MOT053.35 ± 1.180.9790.9810.7050.7010.6640.349
Item 9ACC043.33 ± 1.210.9800.9810.6930.6740.6840.333
Item 10ACC053.53 ± 1.220.9790.9800.8220.8080.8100.315
Item 11ACC063.41 ± 1.160.9790.9800.8360.8210.8130.373
SatisfactionItem 12ACC073.67 ± 1.180.9790.9800.7660.7240.8230.256
Item 13ACC083.61 ± 1.200.9790.9800.7810.7470.8150.281
Item 14ACC093.52 ± 1.270.9790.9800.7930.7580.8280.305
Item 15ACC103.42 ± 1.170.9790.9800.8180.8060.8000.314
Item 16MOT063.43 ± 1.130.9790.9800.7780.7910.7070.380
RelevanceItem 17MOT073.45 ± 1.160.9790.9800.7870.8000.7060.439
Item 18MOT083.47 ± 1.140.9790.9800.8500.8420.8260.317
Item 19MOT093.36 ± 1.180.9790.9800.8110.8210.7380.425
Item 20ACC113.73 ± 1.170.9790.9800.7460.7130.7870.249
Item 21EVA013.08 ± 1.300.9810.9820.3610.3590.3090.468
Perceived UsefulnessItem 22MOT103.43 ± 1.190.9790.9800.8300.8290.7770.418
Item 23MOT113.52 ± 1.180.9790.9800.8180.8050.8000.335
Item 24MOT123.45 ± 1.190.9790.9800.8300.8240.7850.414
Item 25MOT133.47 ± 1.160.9790.9800.7940.7990.7240.449
Item 26EVA023.13 ± 1.220.9810.9820.4010.4220.3030.468
Perceived Ease of UseItem 27ACC123.91 ± 1.120.9790.9810.7450.7320.7370.281
Item 28MOT143.60 ± 1.190.9790.9800.8460.8540.7880.370
Item 29MOT153.46 ± 1.170.9790.9800.8370.8480.7700.388
Item 30MOT163.67 ± 1.130.9790.9800.8140.8140.7800.306
Perceived Ease for Understanding Key ConceptsItem 31MOT173.46 ± 1.190.9790.9800.8360.8570.7530.377
Item 32MOT183.33 ± 1.210.9790.9800.8230.8420.7360.424
Item 33MOT193.59 ± 1.160.9790.9800.8440.8610.7670.388
Item 34MOT203.46 ± 1.160.9790.9800.8130.8180.7600.360
Item 35MOT213.45 ± 1.230.9790.9800.7950.8160.7040.425
Note. Table 3 shows statistics of the final version (35 items) resulting after expert judgment and revision of the instrument. Descriptive statistics are reported as mean ± SD. Cronbach’s α and McDonald’s ω correspond to internal consistency estimates computed under an item-deleted condition. Item-Total denotes corrected item-total correlations. SD = Standard Deviation; MOT = Motivation; ACC = Acceptance of AR technology (Technology Acceptance); EVA = Digital Assessment Acceptance. MOT, ACC, and EVA indicate Pearson correlations between each item and the respective latent dimensions. Values in bold indicate the highest and lowest means.
Table 4. Cronbach’s Alpha Values Obtained.
DimensionαωAVECRCorrelation
MotivationAcceptanceEvaluationOverall
Motivation0.9770.9770.9660.701-0.9100.4540.989
Acceptance0.9540.9540.6890.5260.880-0.3580.957
Evaluation0.6370.6380.9830.7350.4630.329-0.482
Overall0.9810.982--0.9840.9380.473-
Note. α = Cronbach’s alpha; ω = McDonald’s omega; AVE = Average Variance Extracted; CR = Composite Reliability. Internal consistency was assessed using α and ω. Correlation coefficients above the diagonal represent Pearson’s r, and those below the diagonal represent Spearman’s ρ. Diagonal cells are not reported. Values in bold indicate the most distinctive results (maximum/minimum).
Table 5. EFA—Factors, Items and Factor Loadings.
DimensionIndicatorEstimate (95% CI)Std. Estimate
MotivationMOT010.918 (0.772 to 1.065)0.746
MOT020.953 (0.815 to 1.091)0.801
MOT030.917 (0.783 to 1.050)0.795
MOT040.816 (0.692 to 0.939)0.778
MOT050.833 (0.691 to 0.976)0.708
MOT060.896 (0.767 to 1.026)0.798
MOT070.936 (0.803 to 1.069)0.808
MOT080.972 (0.845 to 1.099)0.855
MOT090.983 (0.848 to 1.118)0.830
MOT100.998 (0.863 to 1.132)0.841
MOT110.971 (0.835 to 1.106)0.823
MOT121.005 (0.870 to 1.141)0.841
MOT130.945 (0.810 to 1.080)0.813
MOT141.032 (0.899 to 1.164)0.866
MOT151.006 (0.875 to 1.137)0.859
MOT160.936 (0.806 to 1.066)0.826
MOT171.031 (0.898 to 1.164)0.865
MOT181.028 (0.892 to 1.164)0.851
MOT191.006 (0.878 to 1.135)0.869
MOT200.957 (0.824 to 1.091)0.826
MOT211.017 (0.875 to 1.158)0.824
AcceptanceACC010.834 (0.702 to 0.965)0.757
ACC020.878 (0.746 to 1.009)0.782
ACC030.841 (0.699 to 0.983)0.717
ACC040.864 (0.716 to 1.013)0.711
ACC051.024 (0.887 to 1.161)0.842
ACC060.969 (0.84 to 1.099)0.844
ACC070.985 (0.851 to 1.119)0.834
ACC081.000 (0.864 to 1.136)0.835
ACC091.070 (0.928 to 1.213)0.845
ACC100.979 (0.847 to 1.111)0.838
ACC110.932 (0.796 to 1.067)0.798
ACC120.834 (0.702 to 0.967)0.757
EvaluationEVA010.765 (0.551 to 0.979)0.593
EVA020.961 (0.737 to 1.186)0.792
Note. Estimate = unstandardized factor loading; CI = confidence interval; Std. Estimate = standardized factor loading. MOT = Motivation; ACC = Acceptance of AR Technology; EVA = Evaluation. Estimates are derived from the confirmatory factor analysis model and are reported with 95% confidence intervals.
Disclaimer/Publisher’s Note: The statements, opinions and data contained in all publications are solely those of the individual author(s) and contributor(s) and not of MDPI and/or the editor(s). MDPI and/or the editor(s) disclaim responsibility for any injury to people or property resulting from any ideas, methods, instructions or products referred to in the content.