1. Introduction
Artificial Intelligence (AI) is becoming increasingly important in today’s world, with a global impact that is revolutionizing both the economy, particularly the labor market, and society. However, despite its widespread influence, significant gaps remain in understanding how specific demographic factors influence AI adoption among university students. Addressing this knowledge gap is crucial for educators and policymakers seeking to enhance AI literacy and usage within academic settings. The main aim of this study is to understand how prior experience with AI, expectations for results, gender, and age reinforce the use of AI in higher education institutions (HEIs)’s students. Analyzing these factors is crucial as it offers insights into curriculum design and the integration of AI-related courses, helping educators foster a supportive learning environment that caters to varied student needs. By comprehending these predictors, HEIs can tailor educational strategies to better equip students for a technology-driven future. The analysis shows that prior experience with AI, expectations, gender, and age significantly reinforce the likelihood of using AI, providing a solid basis for understanding the predictors of AI use among university students.
The integration of AI in educational contexts is a rapidly evolving area, with significant implications for enhancing learning outcomes, entrepreneurship education, and technology acceptance. The Technology Acceptance Model (TAM) highlights that perceived ease of use (PEOU) and perceived usefulness (PU) are critical in determining educators’ and students’ intentions to adopt AI tools to show that PEOU significantly influences PU, which in turn affects attitudes towards and intentions to use AI technologies in educational settings (
Or, 2025). Drawing on the Technology Acceptance Model (TAM) and Social Support Theory (SST),
Aldraiweesh and Alturki (
2025) reveal significant relationships between key constructs: perceived educational support positively influenced perceived usefulness and attitudes toward AI. Perceived usefulness and ease of use are strong predictors of positive attitudes, which, in turn, significantly shape intentions to use AI. Emotional support and cognitive support also had notable but mixed effects on perceived usefulness. However, social interaction support and perceived enjoyment did not demonstrate significant influence.
Trust plays a vital role in the acceptance of AI technologies. Research indicates that perceived risk and trust are significant factors affecting students’ attitudes and behaviors towards AI-based learning platforms. Specifically, perceived risk has a stronger impact on AI adoption than perceived usefulness (
Saflor, 2025;
Unikrishnan, 2025). AI tools can personalize learning experiences and provide real-time feedback, which enhances student engagement and skill development in entrepreneurship education. For instance, AI-driven business simulations can foster creativity and decision-making skills among students (
Dunan et al., 2025;
Margaretha et al., 2025), and integrating AI within entrepreneurship education significantly mediates the relationship between educational practices and students’ entrepreneurial intentions. This integration helps cultivate an entrepreneurial mindset by enhancing motivation and readiness to pursue entrepreneurial careers (
Zhang, 2025). Despite the potential benefits, challenges such as AI complexity, resistance to change, and ethical concerns regarding data privacy hinder effective integration. Addressing these challenges is essential for successful AI adoption in educational contexts (
Bautista, 2026).
The adoption and learning of AI–based technologies have been examined through several theoretical frameworks that aim to explain the determinants of individuals’ intentions and actual use of such systems. One of the foundational approaches is the Theory of Reasoned Action (TRA) (
Davis et al., 1989), which posits that behavioral intention—shaped by attitudes and subjective norms—constitutes the immediate antecedent of behavior.
Building on TRA, TAM extends these principles to the technological domain (
Davis, 1989;
Davis & Granić, 2019). According to TAM, attitudes toward using a system derive from two core beliefs: perceived usefulness, defined as the extent to which individuals expect the technology to enhance their performance (e.g., improving efficiency, quality, or task completion), and perceived ease of use, which refers to the effort required to learn and operate the system. When users perceive that a tool offers clear performance benefits and imposes minimal cognitive or operational demands, their attitudes toward adoption tend to be more favorable.
Later,
Venkatesh and Davis (
2000) expanded the Technology Acceptance Model (TAM) by proposing TAM2, an extension designed to clarify why users perceive technology as useful. This version incorporates additional cognitive elements—such as relevance, output quality, result demonstrability, and ease of use—as well as social influences, including subjective norm, image, and willingness to comply. By integrating these dimensions, TAM2 offers a more detailed account of the mechanisms shaping perceptions of usefulness in organizational contexts.
These developments paved the way for the Unified Theory of Acceptance and Use of Technology (UTAUT) (
Venkatesh et al., 2003), which synthesizes the structure of the Theory of Reasoned Action (TRA), the central constructs of TAM (perceived usefulness and perceived ease of use), and the cognitive and social determinants introduced in TAM2. The model reorganizes these elements into four predictors of behavioral intention and technology use, providing a more consolidated and empirically robust framework.
Although the Theory of Diffusion of Innovations (
Rogers, 2003) is not formally incorporated into UTAUT, several of its attributes—relative advantage, complexity, and observability—align conceptually with performance expectancy, effort expectancy, and social influence. This correspondence reflects a broader, macro-level perspective on how innovations spread across populations. While UTAUT focuses primarily on individual-level determinants of technology use, the diffusion framework addresses adoption patterns at the societal level. Together, these perspectives contribute to a more comprehensive understanding of technology acceptance, spanning both individual decision-making and broader patterns of social diffusion.
These constructs provide a coherent explanation of how expectations regarding performance outcomes and learning effort shape individuals’ attitudes toward AI-based technologies. Expectations are linked to performance expectancy and perceived usefulness within the TAM/UTAUT tradition. This theoretical lens contributes to a more nuanced understanding of the mechanisms underlying technology acceptance in contemporary digital environments. Our study does not attempt to replicate any of these models in full, the constructs included in the analysis are theoretically aligned with the core dimensions of these frameworks (attitudes, expectations, perceived usefulness, behavioral intention), and the comparison with established technology acceptance theories is intended to contextualize our findings within broader literature.
1.1. Research Questions
Based on the above, we formulate the following research questions:
RQ1. How do gender, prior experience with AI, expectations for AI use, and age influence the use of AI, and which has the greatest influence?
RQ2. What are the factors that most influence its use?
1.2. Hypotheses
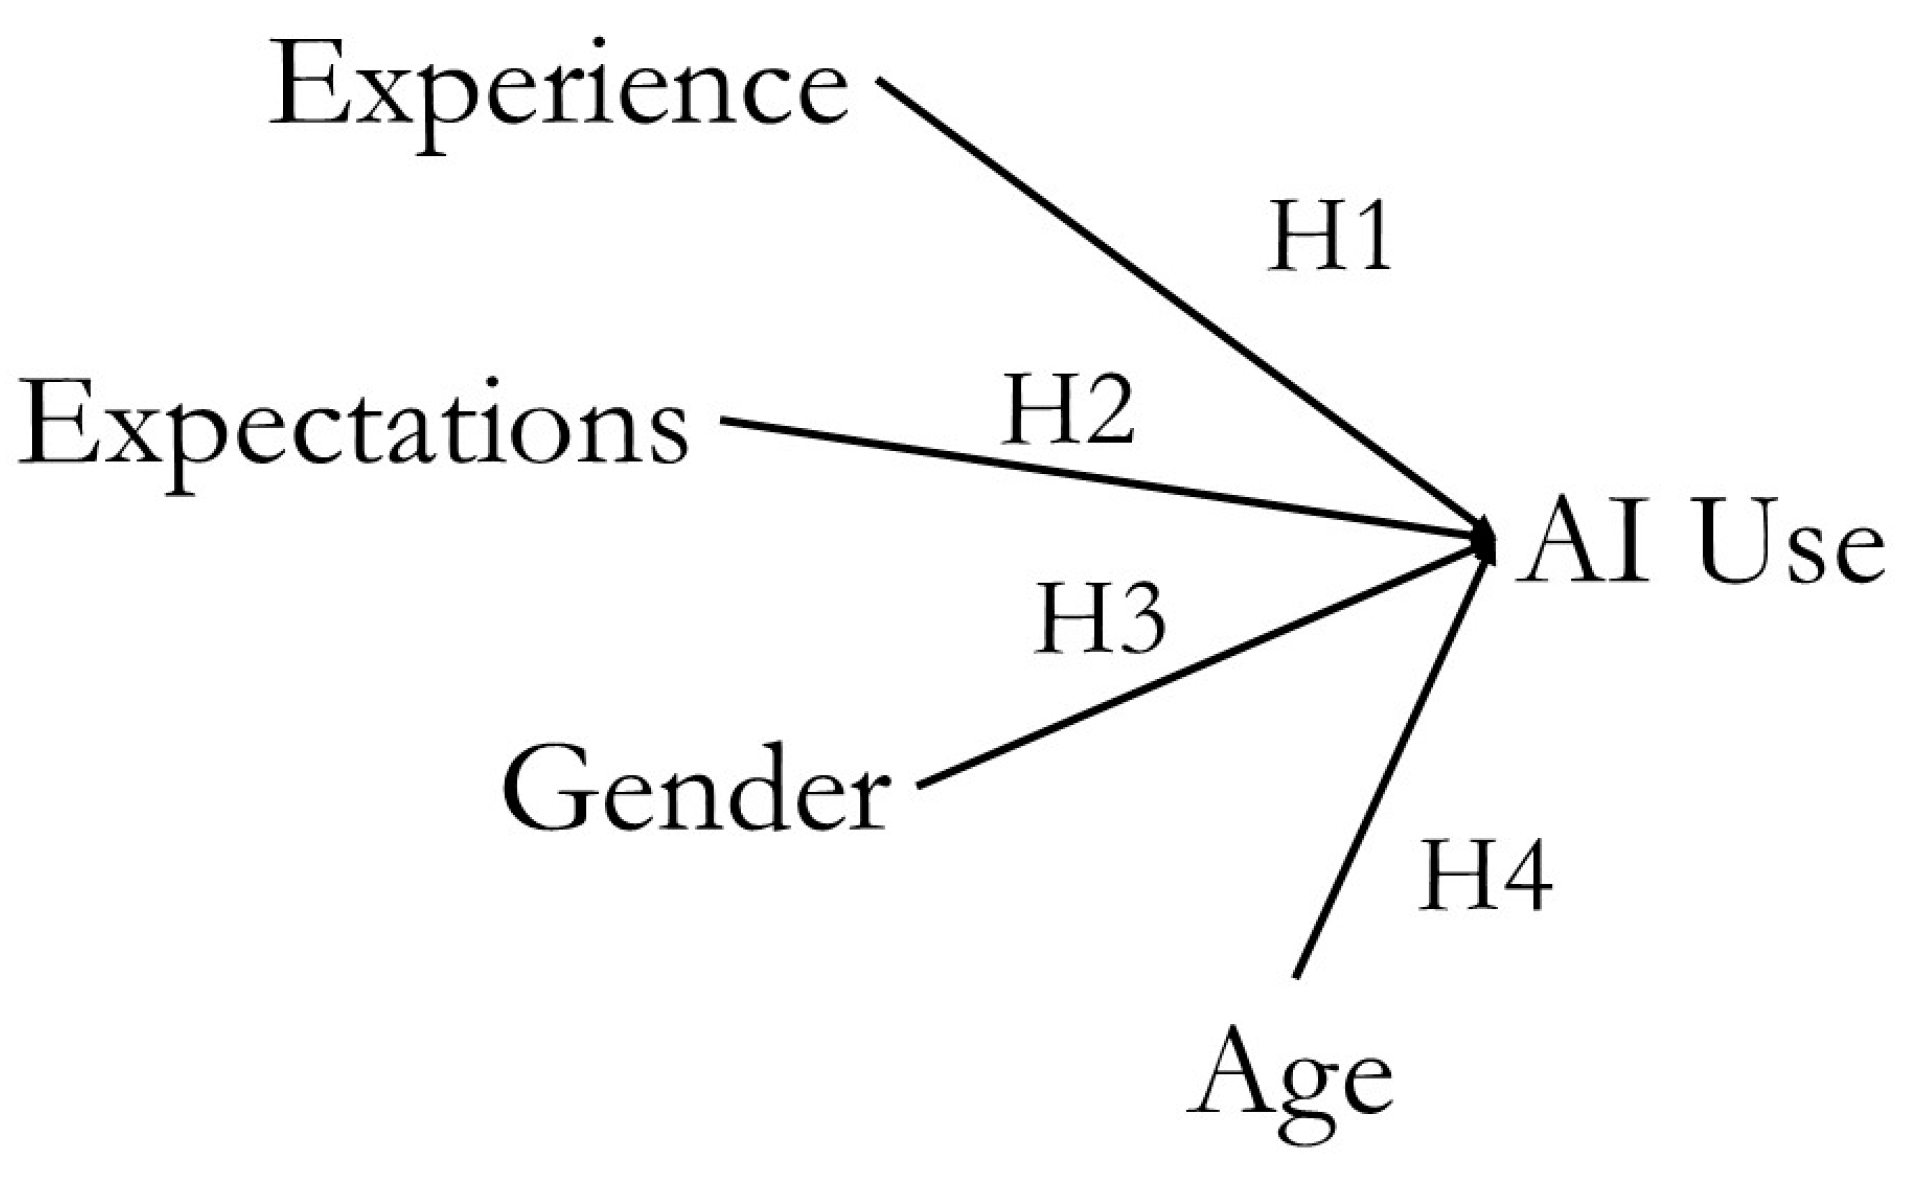
Based on these conceptual foundations on learning and technology use, in this case related to AI, the following hypotheses are formulated (
Figure 1):
- (a)
Related to cognitive and attitudinal factors
Experience is a central element in technology adoption models. In TAM, familiarity with technology increases the perception of ease of use, reducing cognitive barriers and increasing the likelihood of adoption (
Davis, 1989). UTAUT also identifies experience as a key modulator that facilitates the transition from intention to effective use (
Dunan et al., 2025). Consequently, users with more prior experience with AI are expected to be more likely to use these tools. For the purpose of this study, “Experience” is defined as a participant’s familiarity and prior engagement with AI, measured through a self-reported scale ranging from 1 to 7, where 1 indicates no prior experience and 7 indicates extensive experience with AI.
H1. Experience with AI will significantly reinforce the likelihood of future AI use.
TAM establishes that perceived usefulness is the most robust predictor of intention to use, while UTAUT suggests that performance expectancy directly influences technology adoption. Although these models provide a strong theoretical foundation, it is crucial to consider how emerging perspectives on AI usage align with these established theories. For instance, when university students anticipate specific benefits from using AI, such as efficiency, accuracy, or time savings, they are more likely to integrate these tools into their daily activities. Therefore, positive expectations toward AI are expected to increase the likelihood of use.
H2. Positive expectations about AI significantly increase the likelihood of AI use.
- (b)
Related to sociodemographic factors
Several studies have documented gender differences in technological self-efficacy, perceived usefulness, and willingness to experiment with new tools, showing gender differences in key TAM perceptions, including perceived usefulness and ease of use (
Gefen & Straub, 1997) and how gender influences the acceptance and use of technologies, especially in self-efficacy, social norms, and performance expectations (
Venkatesh & Morris, 2000). These differences influence the adoption of emerging technologies such as AI. In this regard, it is proposed that gender will serve as an explanatory factor for AI use.
H3. Gender is significantly associated with AI use.
The theory of diffusion of innovations (
Rogers, 2003) argues that technology adoption varies according to sociodemographic characteristics, including age. Although older age has traditionally been associated with lower adoption, recent research shows that in professional contexts, age may be related to a greater need for support tools or greater exposure to innovation processes. Therefore, it is proposed that age will influence the likelihood of AI use.
H4. Age is significantly associated with AI use.
In sum, the main objective of this study is to understand how prior experience with AI, expectations for results, gender, and age reinforce the likelihood of AI use in entrepreneurship students. The analysis shows that all these predictors explain the probability of AI use, providing a solid basis for understanding AI use among students.
2. Materials and Methods
2.1. Sample Description
This study is quantitative, non-experimental, cross-sectional, and descriptive, and its objective is to analyze university students’ perceptions and attitudes toward AI use. The structured questionnaire on the use of artificial intelligence in higher education was originally developed and validated by the University of Cantabria (Spain), in accordance with European and Spanish data protection regulations, including Regulation (EU) 2016/679 of the European Parliament and of the Council (GDPR) and Organic Law 3/2018 on Personal Data Protection and Guarantee of Digital Rights. For the present study, conducted in Mexico, the instrument was administered in accordance with the ethical principles of research involving human subjects and in compliance with current Mexican legislation on personal data protection, particularly the Federal Law on Protection of Personal Data Held by Private Parties and its Regulations, as well as the guidelines issued by the National Institute for Transparency, Access to Information, and Protection of Personal Data (INAI). In this way, both the instrument’s original design and its application in the Mexican context were aligned with the relevant regulatory frameworks, ensuring the confidentiality, anonymity, and proper treatment of the information provided by participants. The sample was selected based on course enrollment criteria, targeting students from various disciplines studying at the Tecnológico de Monterrey, Guadalajara campus, Mexico. Thus, it was a convenience sample drawn specifically from a population of university students with an interest and background in AI-related studies. The questionnaire includes: (1) Sociodemographic variables: age, gender, consent; (2) AI usage variables: knowledge, frequency, experience, versions used, purposes of use, and (3) Likert scales (1–7) on expectations of AI (E1–E10); perceived risks (R1–R8); facilitators of use (FC1–FC11); frequencies of interaction (FI1–FI10); general perceptions (P1–P12) and intention to use (I1–I15). All scales were measured on a scale of 1 to 7, with higher values indicating greater agreement or intensity. These psychometric scales allow us to model relationships between perceptions, attitudes, and behaviors regarding AI use among the selected university students.
Data collection was conducted using the structured questionnaire. Following
Lohr (
2010), assuming maximum population variability with
p =
q = 0.5 and
Z = 1.96 as the critical value associated with the confidence level, for a population (
N = 280) and sample (
n = 208), the following standard error formula for proportions was applied, incorporating the finite population correction. This choice of maximum variability, where
p =
q = 0.5, is designed to ensure the most conservative and robust estimation of variability in the absence of prior distribution information about the population. By assuming maximum variance, the study maximizes precision and reliability in its error estimation, providing a more secure basis for analytical results.
This results in a sampling error of 3.45%, providing a confidence level of 95%, which is considered acceptable with margins of error ranging from 2% to 6% (
Särndal et al., 2003), demonstrating a high degree of accuracy and representativeness of the sample with respect to the total population.
The sample (n = 208) consists of university students, aged between 17 and 25 (
Table 1), who were studying the subject of Ideation and Prototyping, in the Bachelor’s Degree in Business Administration and Strategy, Marketing, Global International, Entrepreneurship, Data Analysis, and Engineering of the Tecnológico de Monterrey, Guadalajara Campus (Mexico), with a slightly higher percentage of men (51.9%) than women (45.7%) (0 = men; 1 = women).
Almost all respondents (99.98%) stated they were conceptually familiar with AI and had used it (99.65%). Regarding the type of AI used, 95.75% reported using only free versions, while 3.9% also used paid versions.
2.2. Data Analysis
To analyze the data, we used the statistical analysis program JASP version 0.95.4. For the correct interpretation of the data, the dataset was cleaned and refined. To do this, the process began with an initial review of the database, verifying its structure and identifying missing values in open variables and inconsistencies in numerical columns. Next, missing values were handled: sociodemographic variables—whose cases without consent (Consent = 0) were excluded from the inferential analysis—were retained for the general descriptive analysis. In the Likert variables, missing values were retained as NA without imputation, since they reflect the participant’s actual omissions, whereas in the open variables, they were retained without semantic normalization. Coding errors were also corrected by replacing non-numeric characters in Likert columns, and it was verified that all scales maintained their 1–7 range. Finally, categorical variables were standardized while maintaining the original coding for gender (male = 0; female = 1), and the internal consistency of the data was verified.
Analysis of the data identified a severe imbalance in the dependent variable of the “AI Use” model (0 = does not use AI; 1 = uses AI), which is dichotomous and warrants a binary logistic regression analysis. Specifically, the data revealed that 99.65% of the cases fall into the “uses AI” category, while only 0.35% fall into the “does not use AI” category. Despite this severe imbalance, we chose this type of analysis because it is the most appropriate model for estimating the probability of AI use, comparing the relative influence of gender, age, experience, and expectations on AI use, and obtaining odds ratios to interpret which factors carry more weight.
During the initial inspection of the dataset, it was observed that the proportion of cases belonging to category “1” was considerably higher than that of category “0,” which could compromise the stability of the model and generate biases in the estimation of the coefficients, especially in the predictive capacity for the minority class. Although advanced rebalancing techniques exist, such as the SMOTE (Synthetic Minority Oversampling Technique) algorithm (
Han et al., 2005), their application was not possible because JASP does not incorporate SMOTE or any other automatic synthetic oversampling method in its regression or machine learning modules. As the analysis had to be performed entirely in JASP to maintain methodological consistency and reproducibility, we opted to use random oversampling of the minority class. This strategy allowed us to balance the distribution of the dependent variable without resorting to external tools or modifying the structure of the statistical analysis within JASP. This procedure consisted of duplicating the records in the “0” category until a more balanced proportion between the two classes was achieved. The objective was to prevent the model from learning patterns dominated exclusively by the majority class and to improve sensitivity to the minority class without removing relevant information from the dataset.
While this method addresses the imbalance issue, it is important to acknowledge that random oversampling can introduce potential drawbacks, such as overfitting the model due to the duplication of data points that can influence standard errors and confidence intervals by artificially inflating the sample size, potentially leading to an underestimation of variability and narrower confidence intervals. To safeguard against this, additional performance metrics, such as the confusion matrix, sensitivity, specificity, and the area under the ROC curve, were used to ensure the model’ reliability and robustness, thereby reassuring methodological rigor.
2.3. Methodology
Random oversampling and SMOTE are two techniques used to address imbalance in categorical variables, but they differ in their approaches and the effects they have on the dataset. Random oversampling multiplies the cases in the minority class without altering the original values of the predictor variables (
Fernández et al., 2018), whereas SMOTE can introduce noise when the variables are categorical or ordinal, making it unsuitable for interpolation.
Random oversampling is an appropriate strategy when the sample size is moderate, and case removal (undersampling) reduces the analysis’s statistical power. By not modifying the original values of the predictor variables, this technique maintains the integrity of the dataset and avoids introducing statistical artifacts associated with synthetic methods, such as SMOTE, ADASYN (Adaptive Synthetic Sampling Approach for Imbalanced Learning), and WMCOA (Weighted Minority Class Oversampling Algorithm), among others (
He et al., 2025). Its application improves the model’s stability and provides more representative estimates of the behavior of both classes. This approach is methodologically valid in contexts where the software does not allow the direct incorporation of weights or rebalancing algorithms, and it has been widely used in applied studies to mitigate the effects of severe imbalance in dichotomous variables.
This approach is methodologically valid in contexts where the software does not allow the direct incorporation of weights or rebalancing algorithms, and it has been widely used in applied studies to mitigate the effects of severe imbalance in dichotomous variables.
Once the balanced dataset was generated, binary logistic regression was performed in JASP using the new file, following the binary logistic regression model.
In the binary logistic regression, the Enter method was used, which simultaneously introduces all predictors into the model. This approach is most appropriate when there is prior theoretical justification for including variables, as it avoids the problems of overfitting and automatic selection associated with Stepwise, Forward, or Backward methods.
A generative AI tool (Microsoft Copilot) was used to enhance the clarity of explanations of some statistical findings. No data, analyses, or scientific conclusions were generated by AI. All AI-assisted content was thoroughly reviewed, validated, and approved by the authors, who assume full responsibility for the final manuscript.
3. Results and Discussion
The binary logistic regression model M
1 showed an adequate fit to the data. Model 1 has substantially lower AIC (Akaike Information Criterion) and BIC (Bayesian Information Criterion) values than model 0, indicating a better balance between fit and parsimony. Therefore, model 1 is statistically preferable. The likelihood ratio test was significant (ΔX
2 = 115.372,
p < 0.001), indicating that the model with predictors significantly improves on the null model M
0 (
Table 2).
In addition, the four pseudo-R
2 indices (McFadden R
2 = 0.295, Nagelkerke R
2 = 0.437, Tjur R
2 = 0.365, Cox & Snell R
2 = 0.316) shown in
Table 3 suggest good explanatory power, indicating that the model explains between 43.7% and 29.5% of the variability in AI use. This convergence between metrics based on likelihood, scaling, and discrimination indicates that the fit does not depend on a single criterion and that the explanatory power is robust. In particular, the Tjur R
2 value shows a good separation between users and non-users, while the McFadden and Cox & Snell values reflect a substantial improvement over the null model. Taken together, these results confirm that the included predictors provide substantive information and that the model has a solid fit and considerable predictive power, providing a reliable statistical basis for the subsequent interpretation of the observed effects. Overall, the model presents a solid fit and considerable predictive power.
As observed in the odds ratios (OR), the logistic regression model showed that prior experience with AI, expectations, gender, and age significantly predict AI use. Experience emerged as the strongest predictor of AI use (OR = 2.341, p < 0.001). This value indicates that, for each additional unit of experience, the odds of using AI increase by 134.1%. In other words, each additional year of experience more than doubles the odds of adopting these tools. This interpretation is based on odds ratios, as recommended by standard reporting practices in logistic regression, rather than expressing the effect as a direct percentage change in probability. This result suggests that familiarity with technology reduces barriers to entry and promotes adoption, in line with theoretical models such as TAM and UTAUT, which posit that experience modulates perceptions of ease of use.
The results, in which gender emerges as a significant predictor (OR = 2.195,
p = 0.001) and shows substantive differences in the probability of use, indicate that women have substantially higher odds of AI use compared to men, given the coding (0 = men, 1 = women) and the odds ratio (95% CI: 1.361–3.540). These findings are consistent with prior research reporting gender gaps in favor of women, who tend to show greater willingness to interact with AI services when they perceive higher usefulness, trust, and experiential value only if innovativeness is strengthened (
Ville Heilala et al., 2026), or, in the case of female university lecturers, when they perceive usefulness, teaching support, performance expectancy, and facilitating conditions (
Bolívar-Cruz & Verano-Tacoronte, 2025). However, our results contradict other works (
Sharma et al., 2024;
Fülöp & Cifuentes-Faura, 2025;
Alshammari et al., 2025;
Cai et al., 2017) that report no gender gaps in technological self-efficacy or willingness to adopt new digital tools. Likewise, longitudinal research has shown that initial gender differences disappear when prior experience and familiarity with technology are controlled for, suggesting that gender alone does not determine technological competence or intention to use (
Venkatesh et al., 2003).
Expectations (OR = 1.829, p < 0.001) also show a significant effect: those who anticipate benefits or usefulness in AI are 82.9% more likely to use it. This finding reinforces the importance of prior beliefs and perceived value in technology adoption.
Finally, age (OR = 1.821, p = 0.008) also contributes to the model, indicating an 82.1% greater likelihood of using it. This is to be expected, given that the respondents, aged 17 to 25, are all digital natives, making their adoption of AI a natural process. As a result, all predictors increase the likelihood of AI use.
Our results are consistent with those of other authors (
Durndell & Haag, 2002;
Acilar & Sæbø, 2023;
Venkatesh et al., 2000), who show that self-efficacy, prior experience, social norms, and expectations about usefulness and ease of use are key factors in technology adoption. As a result, age and experience directly influence expectations, conditioning people’s willingness to incorporate new digital tools.
Taken together, these results underscore that AI adoption depends not only on technical factors but also on psychological and sociodemographic variables. Understanding these patterns can help design more effective training and dissemination strategies tailored to different user profiles.
As shown in
Table 4, the Tolerance (0.773–0.869) and VIF (Variance Inflation Factor) (1.293–1.150) values indicate the absence of multicollinearity among the predictors, as they are well above and well below, respectively, the commonly accepted thresholds. All VIFs are close to 1, indicating that the variables do not share redundant variance. In other words, each predictor contributes independent information to the model.
The analysis was performed using logistic regression, comparing a null model (M
0) with a complete model (M
1) that incorporates individual and attitudinal variables (
Table 5). The null model, which included only the intercept, showed a moderate probability of the event under analysis, indicating that, even without predictors, the phenomenon’s occurrence is not negligible. When the predictors are introduced into model M
1, a substantial improvement in explanatory power is observed. The intercept of the complete model becomes negative and of great magnitude (β = −14.674,
p < 0.01), reflecting that, in the absence of the included factors, the probability of the event would be practically zero. This confirms that the incorporated variables play a decisive role in prediction.
The model results indicate that the attitudinal and sociodemographic variables included exert a significant and consistent influence on the probability of the event under analysis. First, experience with AI (Exp AI) showed the strongest positive effect (OR = 2.341), suggesting that prior familiarity with these technologies increases predisposition toward the phenomenon studied, driven by confidence in their use. In addition, expectations emerge as a significant predictor in the model (OR = 1.829), reinforcing the idea that anticipated perceptions of the technology’s benefits or outcomes are a central driver of decision-making. This result is consistent with theoretical frameworks such as TAM and Expectancy-Value Theory, which emphasize the importance of prior beliefs in shaping attitudes and behaviors. The magnitude of the effect suggests that interventions to improve the understanding and perceived value of technology could have a particularly significant impact.
In terms of sociodemographic variables, both gender (OR = 2.195) and age (OR = 1.821) showed significant effects. The influence of gender points to systematic differences between groups, which could reflect inequalities in access, technological socialization, or self-perceived competence. Age, on the other hand, showed a positive effect, suggesting that older individuals are more likely to experience the event, a result that can be interpreted in terms of context: from a greater perceived need to greater stability in attitudes or habits.
Additionally, the binary logistic regression analysis was performed in two stages. First, a null model (M0) was estimated that included only the intercept. Subsequently, a complete model (M1) was adjusted to incorporate the predictors Experience with AI, Expectations, Gender, and Age. The results of the Wald test (WS) and the 95% confidence intervals for the odds ratios are presented below.
In the null model (M
0), the intercept showed a significant effect (WS = 29.258,
p < 0.001), with a 95% confidence interval for the odds ratio ranging from 1.517 to 2.437 (
Table 6). This result indicates that the odds of the event differ significantly from 1 in the absence of predictors.
In the full model (M1), all estimated parameters were statistically significant. The intercept remained significant (WS = 11.251, p < 0.001), with a 95% confidence interval for the odds ratio ranging from 0.000 to 0.002. In terms of predictors, Experience with AI had a significant effect (WS = 17.522, p < 0.001), with a 95% confidence interval for the odds ratio ranging from 1.572 to 3.486. Expectations were the predictor with the greatest statistical weight (WS = 32.006, p < 0.001), with a 95% confidence interval for the odds ratio ranging from 1.484 to 2.255. Gender also showed a significant effect (WS = 10.389, p = 0.001), with a 95% confidence interval of 1.361–3.540. Finally, age was significant (WS = 7.035, p = 0.008), with a 95% confidence interval for the odds ratio ranging from 1.169 to 2.836. Overall, the results indicate that including predictors in model M1 substantially improves the explanatory power relative to the null model. All predictors have odds ratios greater than 1, indicating a positive association with the modeled event.
The model’s predictive capacity was evaluated using a confusion matrix with a cutoff of 0.50 (
Table 7), since the use of metrics based on the confusion matrix allows for accurate evaluation of the effectiveness of predictive models (
Sawiji et al., 2024). For category 0, the model correctly classified 52 of 104 cases (50%), while for category 1, it correctly classified 180 of 200 cases (90%). Overall accuracy reached 76.32%, demonstrating acceptable predictive goodness-of-fit for the model. These results indicate high performance in identifying positive cases and moderate performance in classifying negative cases, although we acknowledge that, because we used random oversampling by duplicating minority cases, the confusion matrix shows 104 cases in class 0 and 200 in class 1, which no longer reflects the original data distribution. Duplicating cases artificially inflates the sample size and may bias standard errors,
p-values, and confidence intervals.
This result is complemented by performance metrics (
Table 8) to adequately evaluate its performance and a reliability analysis (Cronbach’s alpha) for the E1–E10 scale (
Table 9). Thus, the model has a high AUC = 0.837, also showing excellent performance metrics measured by Sensitivity (0.900) that describes the proportion of true positives; F-measure (0.833) that is based on the amount of systematic variance divided by the amount of unsystematic variance, i.e., mean squares for the model/the residual mean squares; Accuracy (0.763) that shows how often the model’s prediction matches the actual outcomes; Precision (0.776), also called the positive predictive value, which describes the proportion of true positives to all positives, and Specificity (0.500) that describes the proportion of true negatives. Finally, the Brier score (0.139), based on the mean squared difference between predicted probabilities and the binary outcome, suggests that the predicted probabilities are well calibrated, as lower scores mean more accuracy.
The three coefficients (Omega, Cronbach’s alpha, and Guttman’s λ2) are around 0.957–0.958, with very narrow confidence intervals. This indicates exceptionally high internal reliability, suggesting that the items measure the same construct very consistently, that the scale has very little variability attributable to error, and that the internal structure is stable and robust.
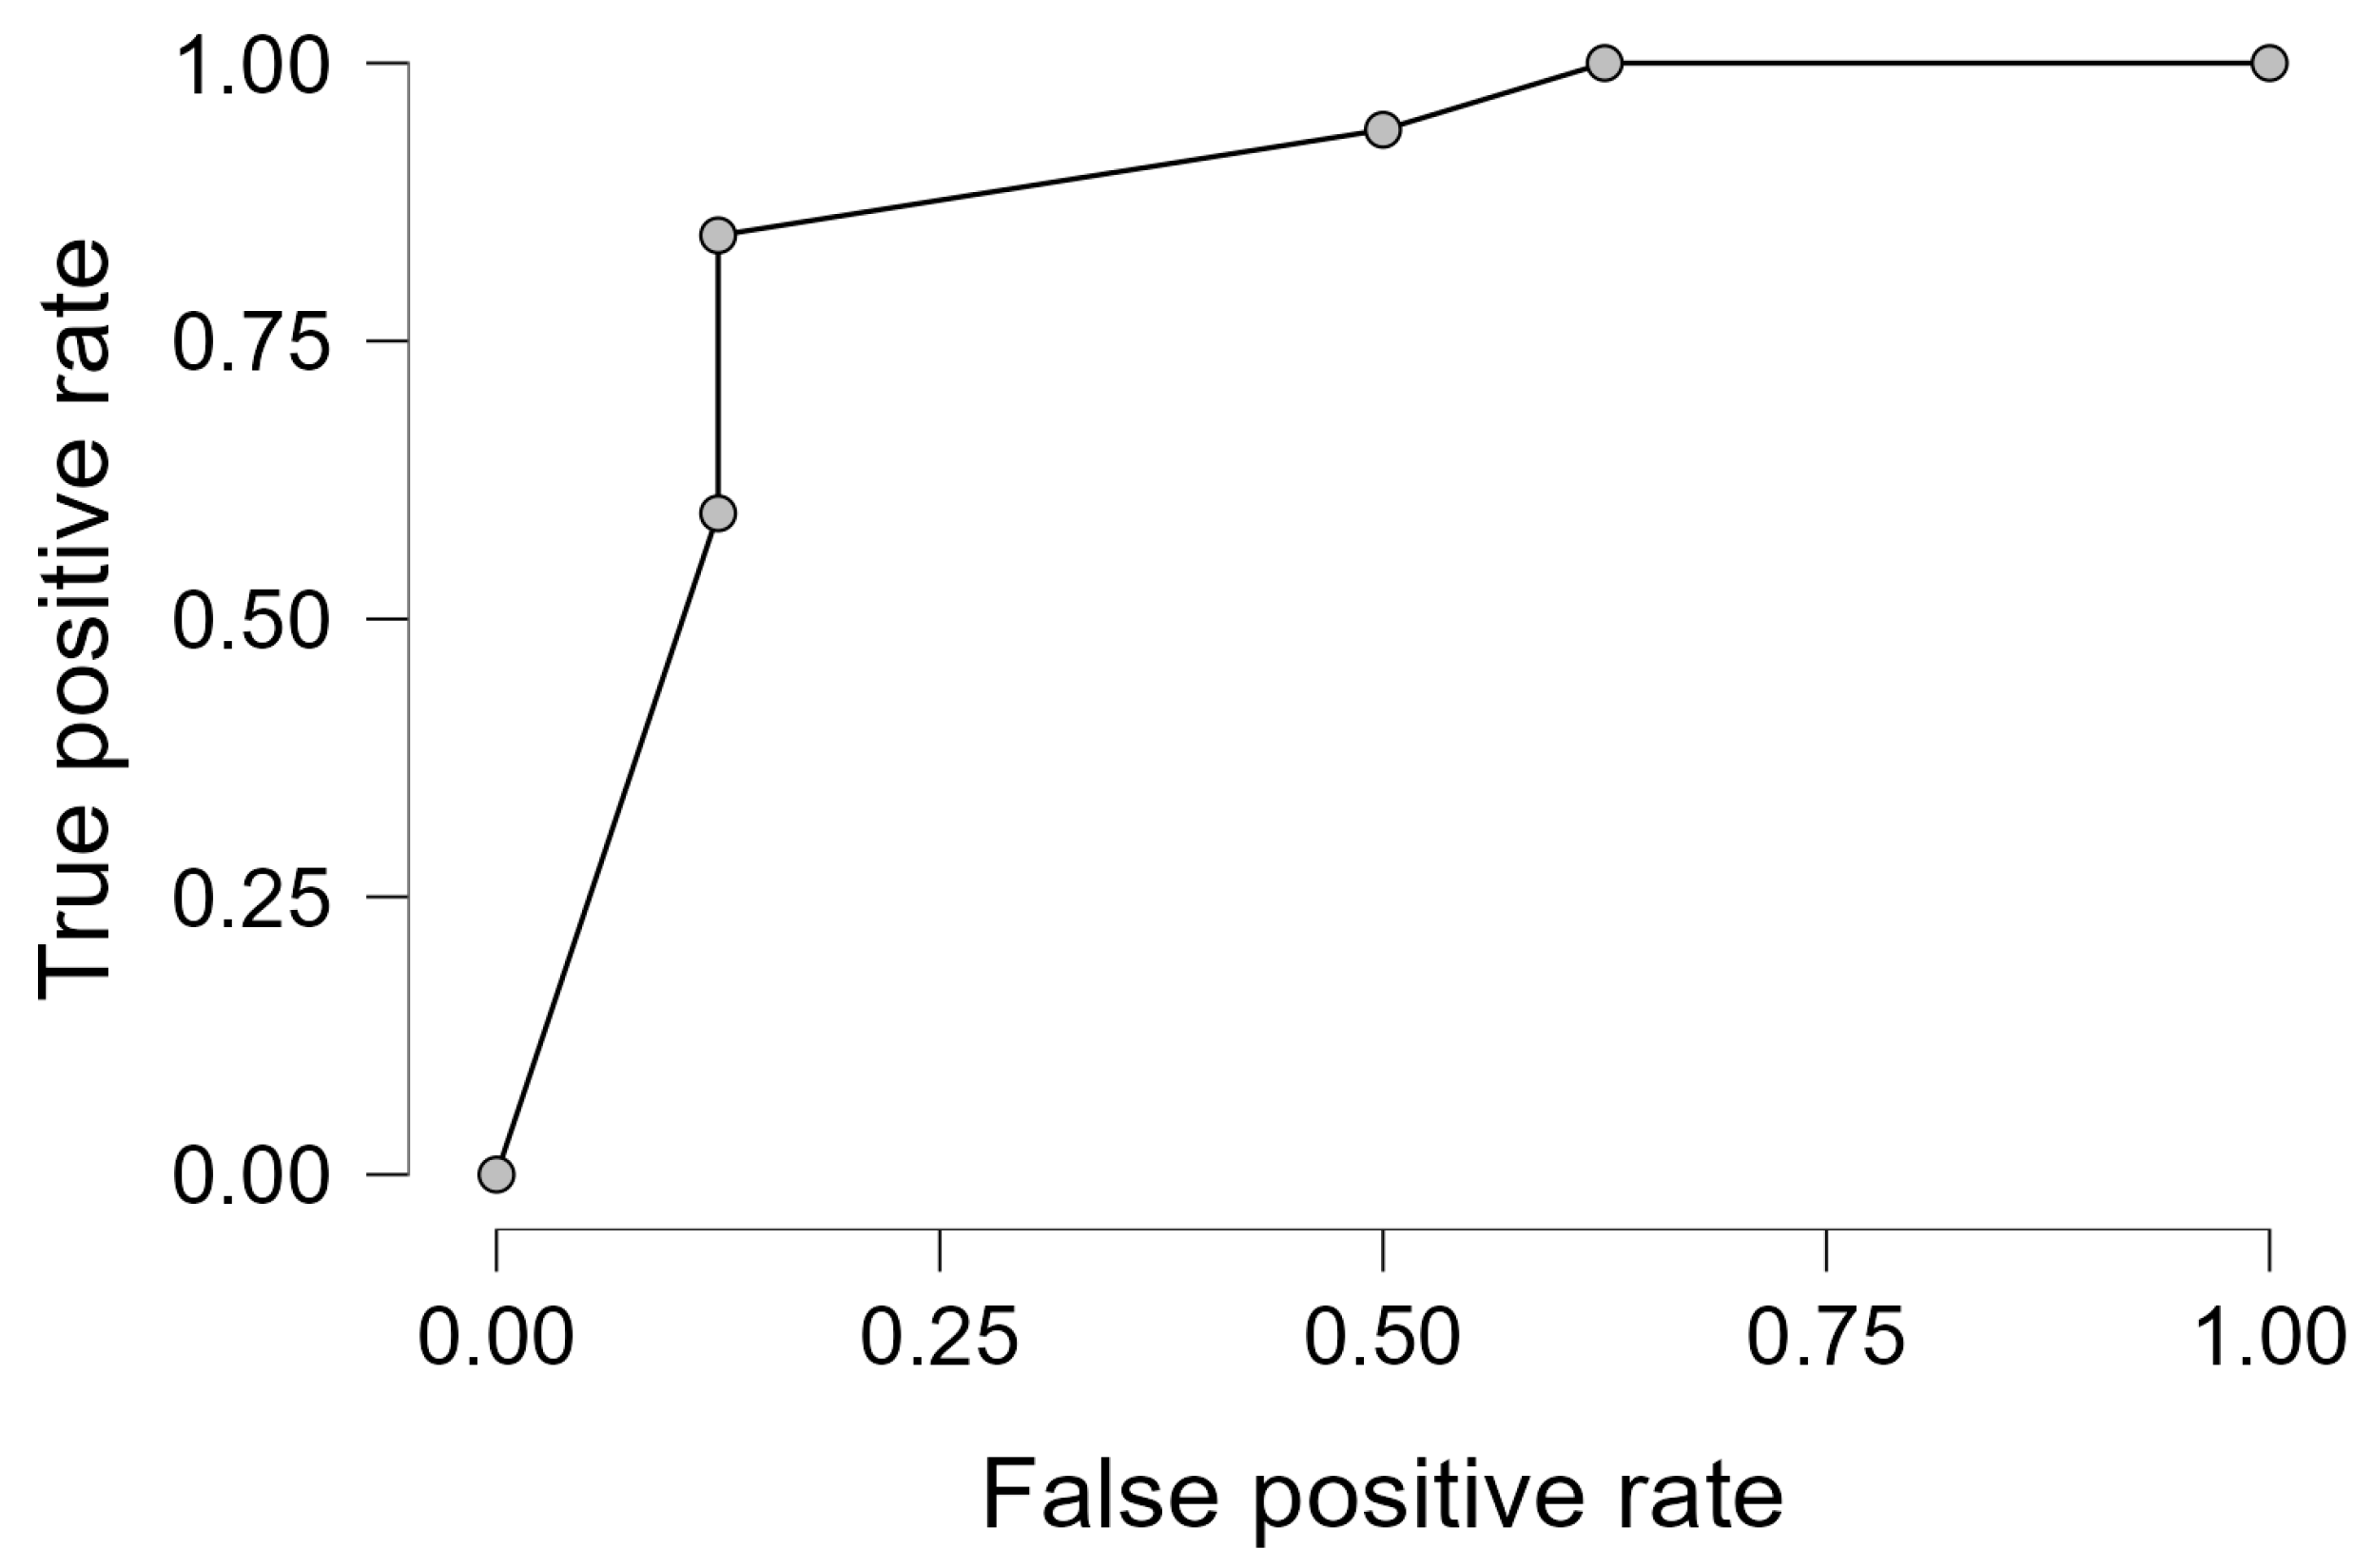
Regarding the ROC (Receiver Operating Characteristic) performance plot (
Figure 1), which shows how a model behaves as the classification threshold varies, it demonstrates excellent discriminatory power (AUC = 0.837) because it is a clearly convex curve in the upper left corner, although we explicitly acknowledge that the AUC value was obtained using the oversampled dataset, which may inflate performance metrics. This indicates that the model adequately distinguishes between AI users and non-users across the entire range of possible thresholds. The ROC plot suggests that the model is robust probabilistically, without requiring a threshold adjustment to balance sensitivity and specificity.
The optimal classification threshold was estimated using the Youden index (J = Sensitivity + Specificity − 1), which identifies the point of maximum discrimination on the ROC curve (
Figure 2). With the standard threshold of 0.50, the Youden index (J) was 0.40, indicating moderate discrimination, as the model identifies many true positives (high sensitivity) at the expense of many false positives (low specificity). Based on the ROC curve and AUC (0.837), the model is good, but the current threshold is not fully exploiting its discriminatory potential.
The exploratory factor analysis performed with items E1–E10 showed excellent sample adequacy (KMO = 0.917) (
Table 10) and a highly significant Bartlett’s test (χ
2(45) = 3817.65,
p < 0.001), confirming the relevance of the analysis. The extraction revealed a single factor with an eigenvalue of 7.37, accounting for 73.7% of the total variance, and all factor loadings were very high (0.76–0.92) (
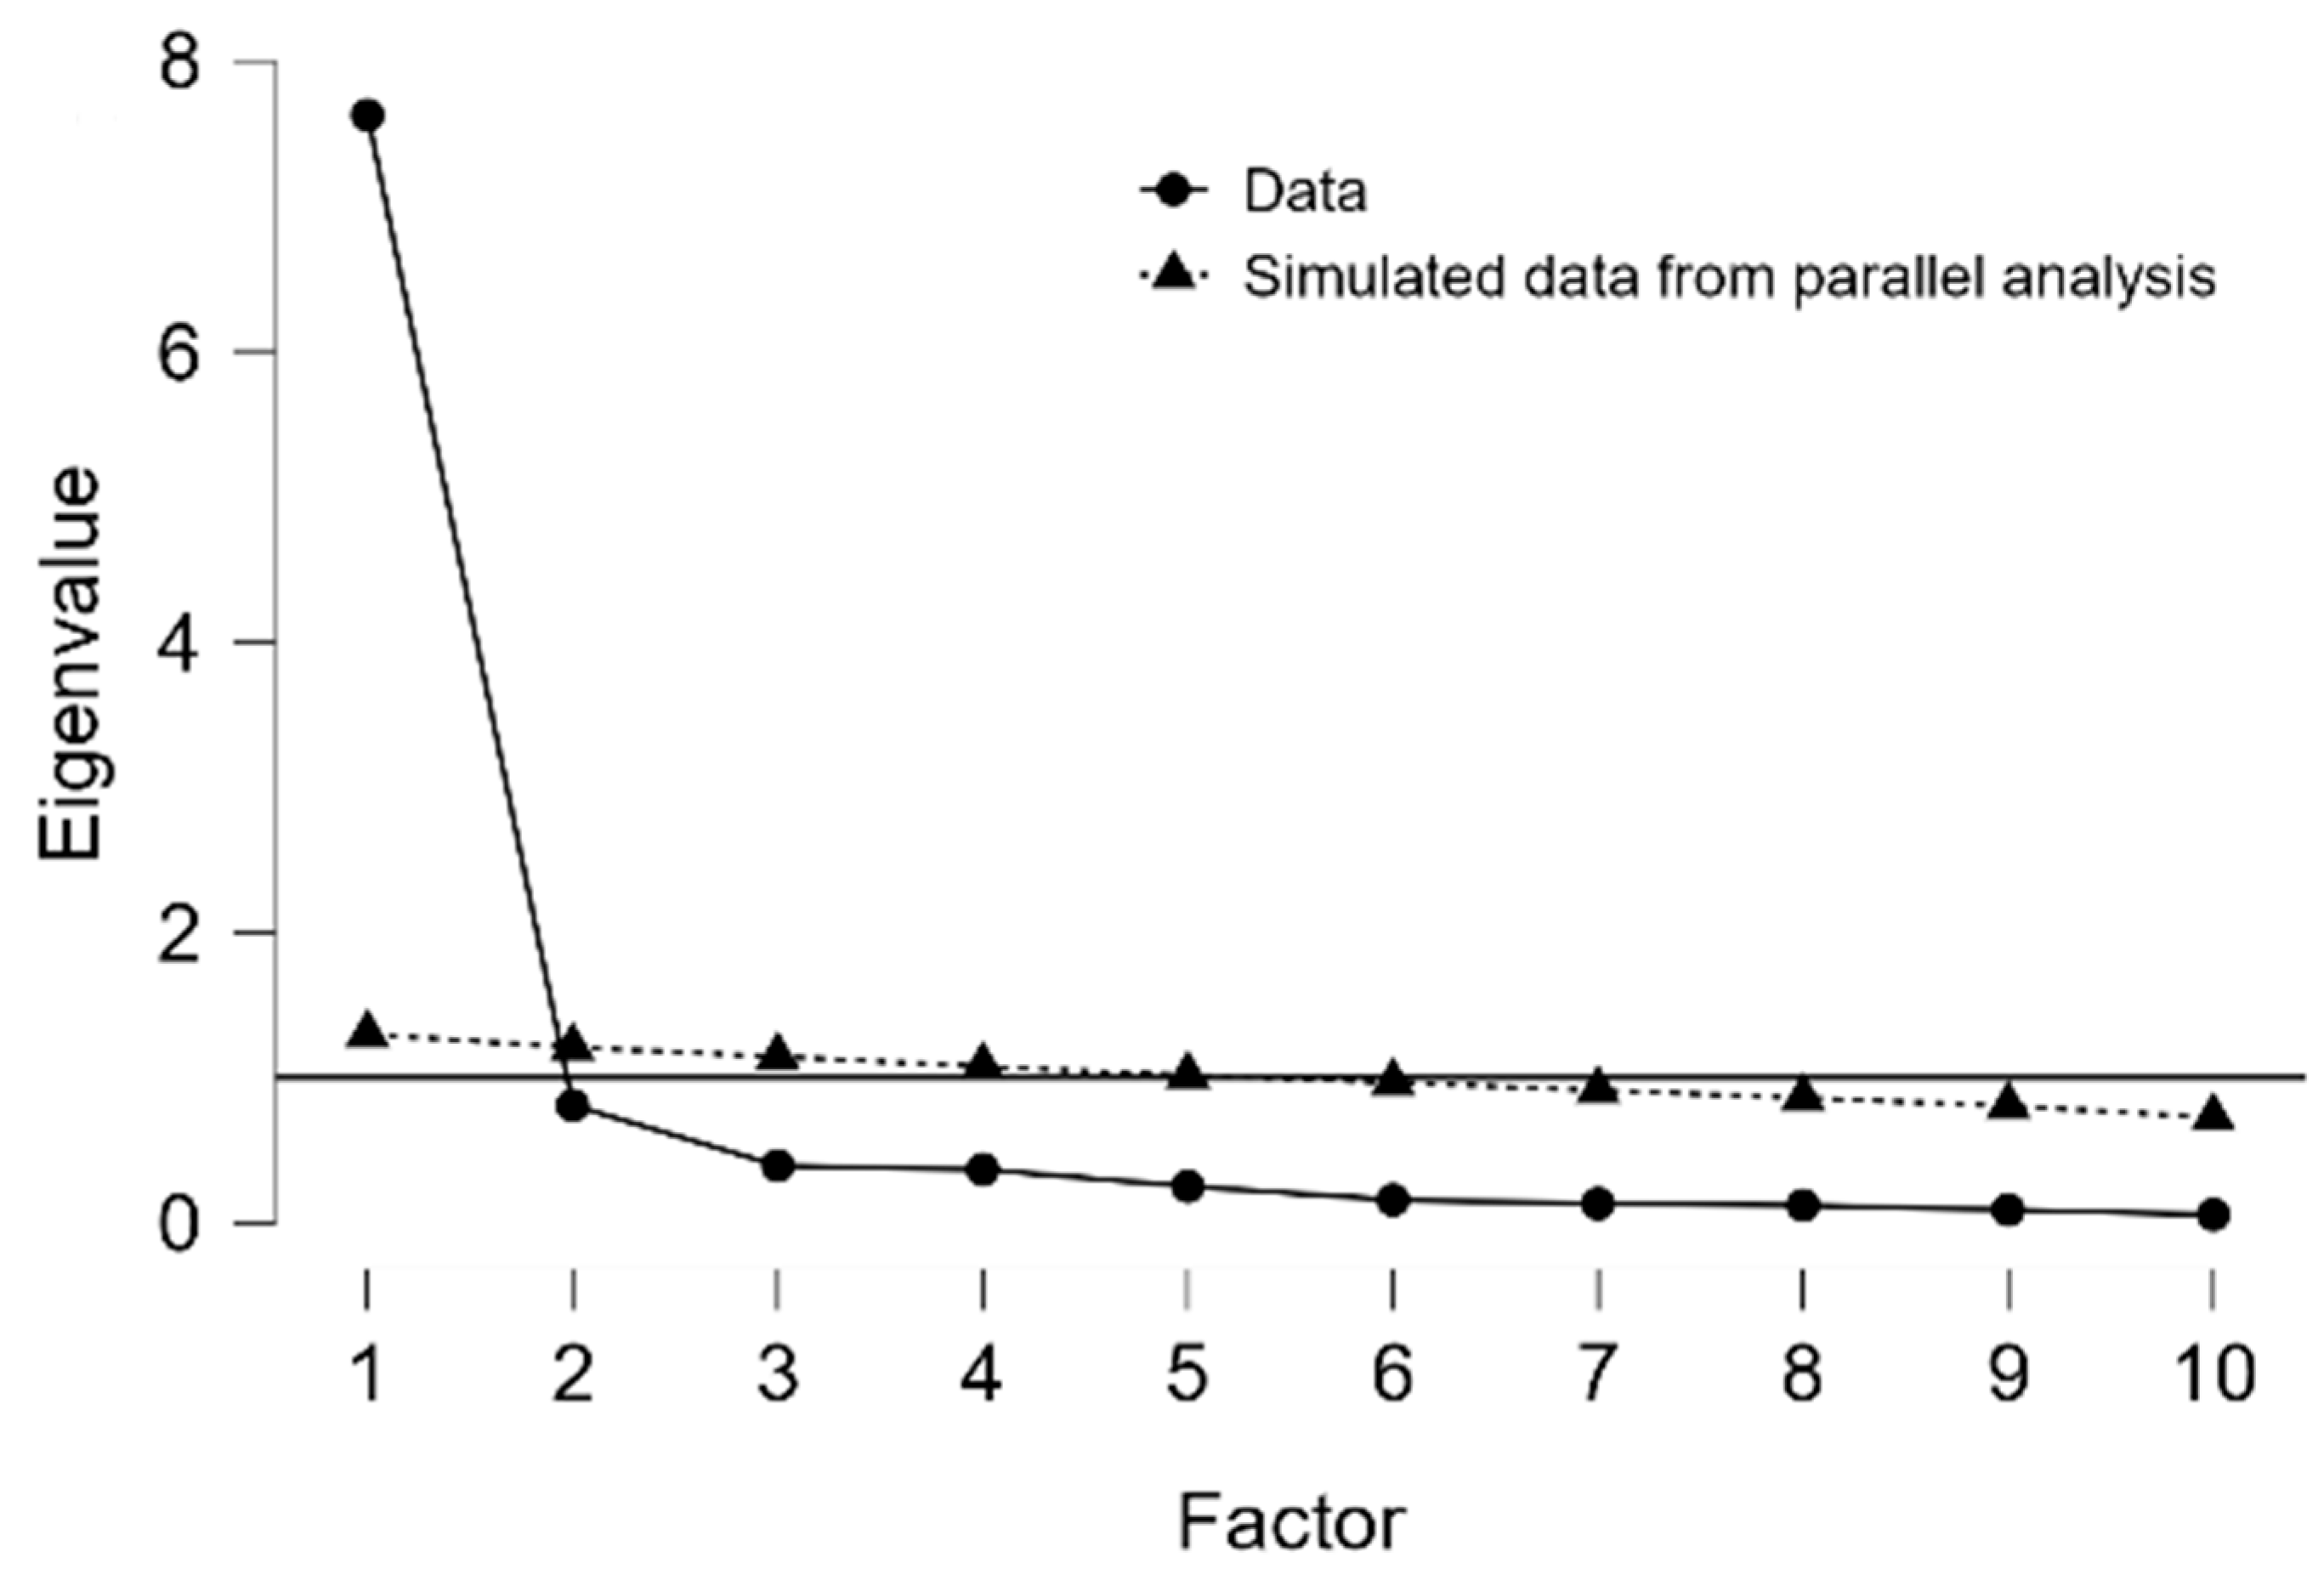
Table 11), indicating a clear unidimensional structure and strong internal consistency among the items. This conclusion is reinforced by the scree plot (
Figure 3), which shows a sharp decline between the first and second factors, followed by clear stabilization, indicating a sharp inflection point and supporting the retention of a single factor. Taken together, these results robustly confirm the instrument’s unidimensionality and strengthen the validity of the measurement model.
Given that the data revealed that 99.65% of cases fall into the “uses AI” category, while only 0.35% fall into the “does not use AI” category, with a sample size of n = 208, this suggests that only one student does not use AI. Using binary regression to predict the behavior of this single negative case (even after oversampling) is methodologically difficult to justify and is likely to lead to unreliable conclusions. Therefore, we have supplemented our analyses with a study of the data on AI frequency (FI1–FI10) collected in the questionnaire, applying linear regression given the high adoption rate, with frequency of AI use measured on a seven-point Likert scale as the dependent variable. Although Likert scales are ordinal, their use as quasi-continuous variables is widely supported in educational and psychological research when multiple items with sufficient variability are combined, as is the case in this study. The aggregation of the ten items provided a stable and sensitive measure of frequency of use, consistent with the TAM and UTAUT theoretical frameworks, which conceptualize use as a gradual rather than dichotomous construct. This approach is methodologically more appropriate than binary regression, given the extreme imbalance in the “uses/does not use” variable and provides more informative estimates of the relative magnitude of the predictors. Consequently, linear regression provides a robust analytical framework that aligns with the nature of the data and the objectives of the study.
The linear regression model showed a significant fit in explaining the frequency of AI use, F(5, 202) = 14.39,
p < 0.001 (ANOVA,
Table 12), explaining 26.3% of the total variability (R
2 = 0.263; adjusted R
2 = 0.244) (
Table 13). Among the predictors included (
Table 14), previous experience with AI emerged as the most influential factor (β = 0.452,
p < 0.001), followed by the purpose of use (β = 0.146,
p = 0.018), while age and gender did not reach statistical significance. The model presented a Root Mean Square Error (RMSE = 0.957) (
Table 13) and a substantial improvement over the null model, as reflected in the decreasing AIC and BIC values. On a scale of 1–7, an RMSE of 0.957 is acceptable and consistent with social science models. It is not extremely low, but it does indicate a reasonably good fit for AI usage frequency data.
The regression assumptions were adequately met: the residuals showed independence (Durbin–Watson = 1.921) (
Table 13), so there is no first-order autocorrelation in the model residuals, no collinearity (VIF between 1.00 and 1.04) (
Table 14), non-redundant information (
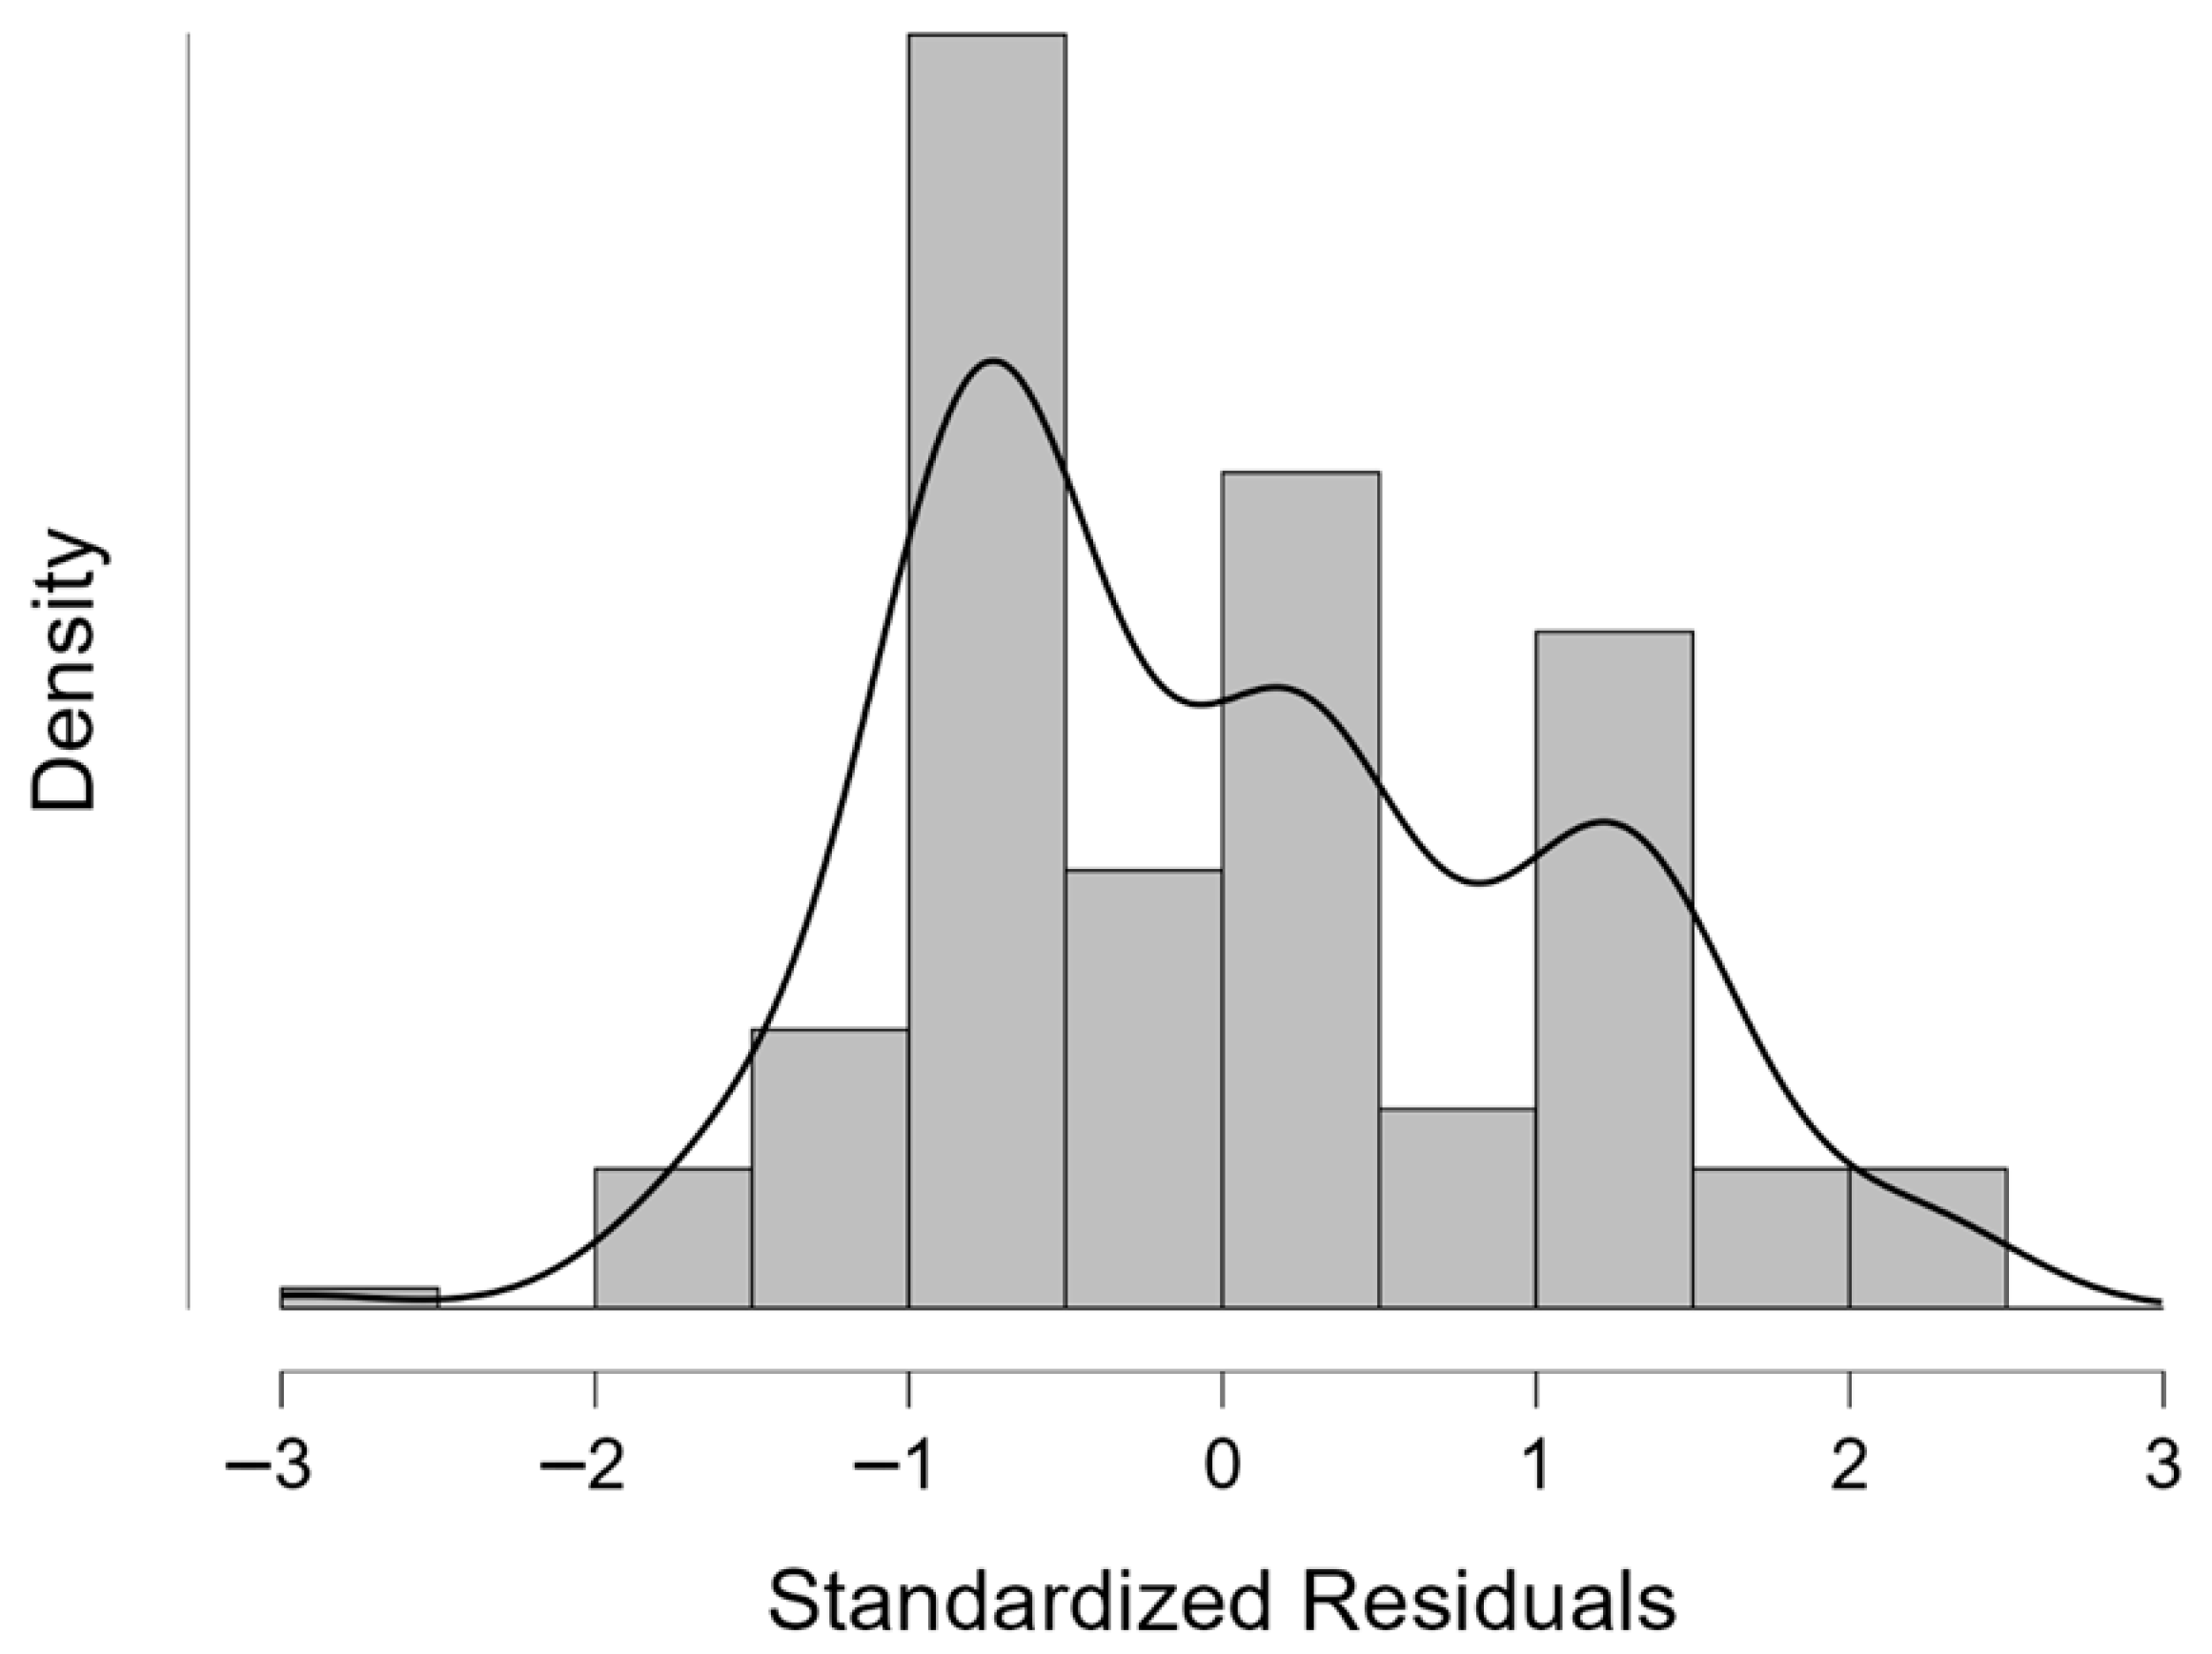
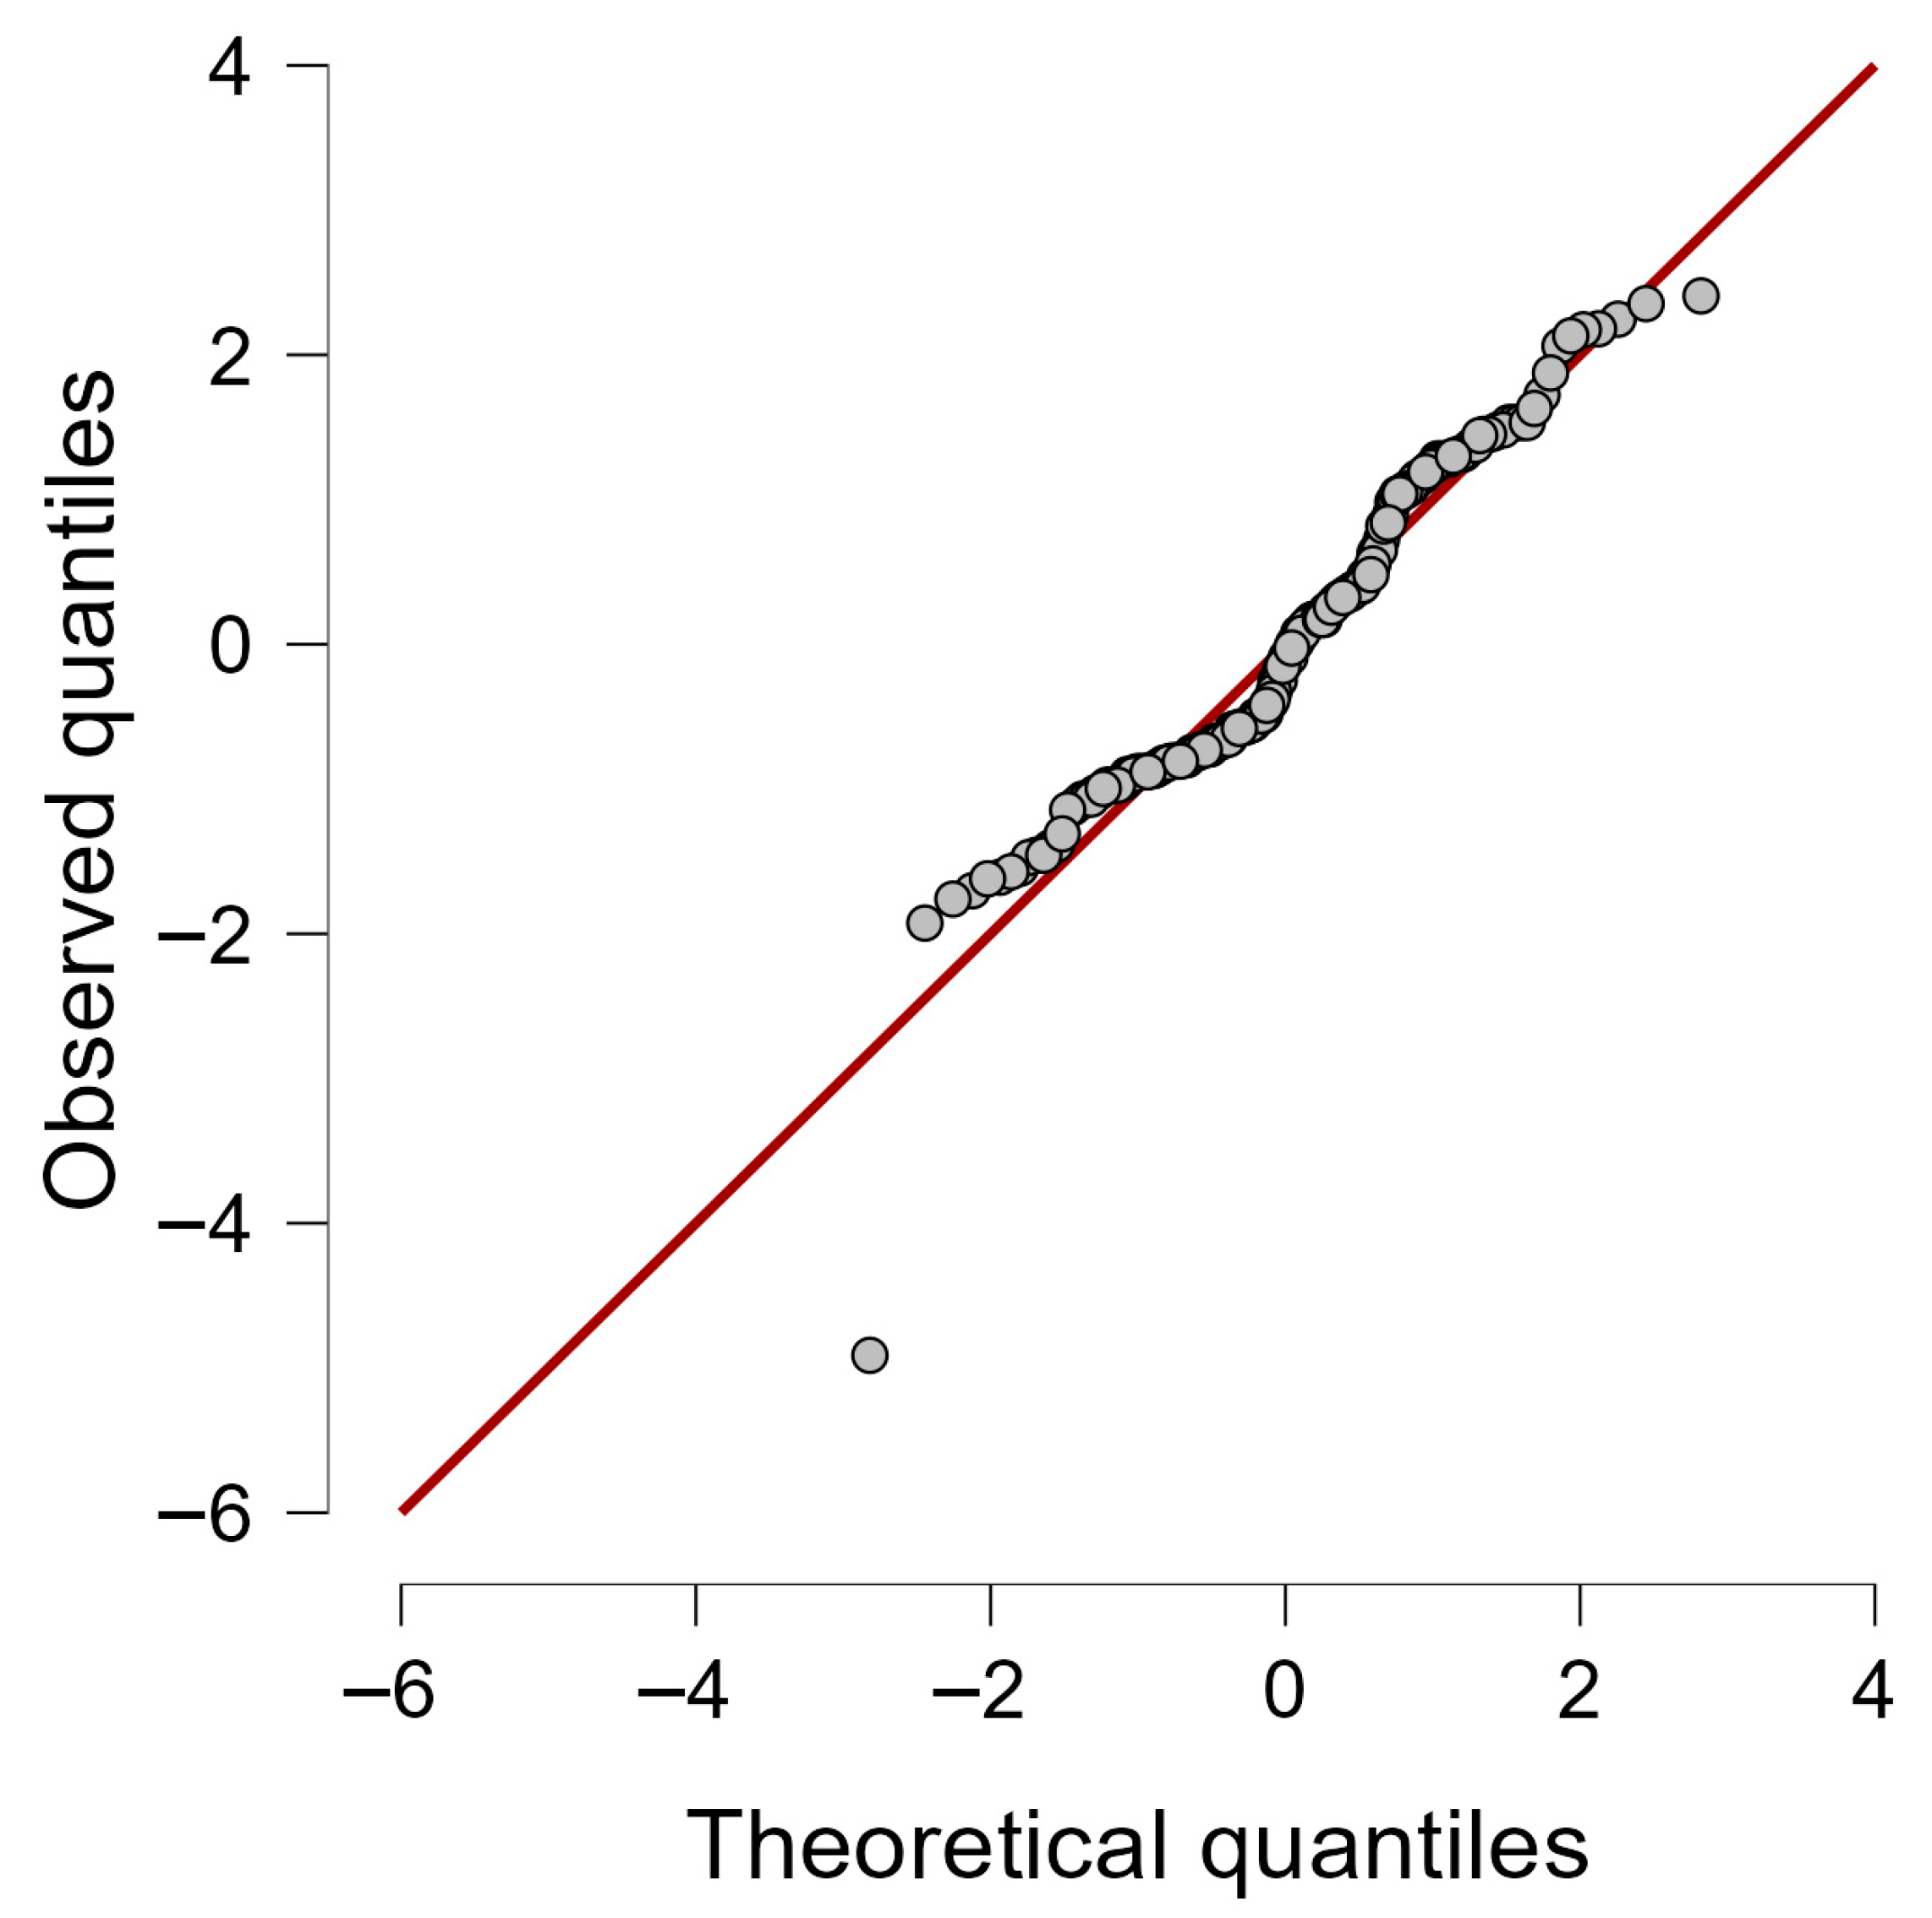
Table 15), and an approximately normal distribution, as evidenced by the histogram of standardized residuals (
Figure 4) and the Q-Q plot (
Figure 5), where the points align with the theoretical distribution and the density is symmetrical with no anomalous patterns. Taken together, these results indicate that the frequency of AI use among students is mainly determined by factors related to experience and purpose of use, while sociodemographic variables play a marginal role in the context of virtually universal AI use. The results align closely with the postulates of the TAM and UTAUT models.
4. Conclusions
The binary logistic regression analysis confirms that all predictors included in the model are significantly associated with the probability of using AI. In relation to the first hypothesis (H1), Experience with AI showed a significant effect (WS = 17.522, p < 0.001), with the 95% CI for the odds ratio (1.572–3.486), indicating that higher levels of experience increase the probability of use. The same result is obtained with linear regression.
Regarding H2, positive expectations of use were a robust predictor (WS = 32.006, p < 0.001). The 95% CI for the odds ratio (1.484–2.255) supports the idea that more positive expectations increase the probability of using AI.
Regarding H3, in the binary logistic regression gender emerges as a significant predictor (WS = 10.389, p = 0.001) and shows substantive differences in the probability of use, indicating that women have substantially higher odds of AI use compared to men, given the coding (0 = men, 1 = women) and the odds ratio (95% CI: 1.361–3.540). These results contradict the results obtained in the linear regression, so H3 is partially rejected.
Finally, while in the binary logistic regression age was also significant (WS = 7.035, p = 0.008), with the 95% CI for the odds ratio (1.169–2.836), supporting H4 and indicating that increasing age is associated with a higher probability of using AI, due to prior experience in the use of AI, although with a more moderate effect than that observed for Experience with AI and Expectations, age is non-significant in the linear regression, so H4 is rejected.
Overall, the results support H1 and H2 and show that all predictors contribute significantly to explaining how experience with AI and positive expectations determine AI use among the entrepreneurship students (aged 17–25) at Tecnológico de Monterrey (Mexico). Although the sample analyzed focused on entrepreneurship students who study entrepreneurship in different degree programs, as it is a cross-disciplinary subject, the results obtained can be extended to other types of students, as the sample was made up of students from different degree programs, mainly related to economics, business administration, humanities, and engineering in its various branches.
Previous experience with AI emerged as the strongest predictor of frequency of use, consistent with the idea that technological familiarity increases perceived ease of use and reduces effort barriers, thereby facilitating more intensive use. Likewise, the purpose of use showed a significant effect, reinforcing the central role of perceived usefulness and performance expectancy in continued adoption. In contrast, neither age nor gender was significant, contrary to what is observed in binary logistic analysis, which is consistent with the literature in contexts where adoption is virtually universal and sociodemographic moderators lose influence. Taken together, these findings confirm that the intensity of AI use among students depends primarily on cognitive and motivational factors, in full agreement with the theoretical frameworks of reference.
4.1. Practical Implications
To translate these findings into practical steps, educators might consider a few actionable strategies. Addressing the impact of expectancy and experience, HEIs could implement AI training programs tailored to enhance students’ expectations and practical engagement with AI. By providing hands-on training and integrating learning experiences that demonstrate the usefulness and ease of AI applications, educators can foster a conducive learning environment.
Furthermore, creating mentorship opportunities where students can learn directly from experienced peers or faculty could bridge the gap between theory and practical application, boosting confidence and proficiency in AI usage. A succinct call-out, like a guide, could be distributed to educators as a quick reference for these strategies, ensuring that the research insights linked to IA use are effectively integrated into educational practices. Taken together, these results underscore that AI adoption depends on technical, psychological and sociodemographic factors.
4.2. Research Limitations
The first limitation deals with the age of the sample. Given that the age distribution is indeed concentrated in the 17–25 age range, the representativeness of older age groups is limited. Therefore, results should be interpreted with caution when generalizing to broader age ranges.
The second research limitation links to oversampling. Although random oversampling improves representation of the minority class, it can also increase the risk of overfitting due to duplicated observations. To mitigate this effect, the results were interpreted with caution and supplemented with additional model performance metrics, including the confusion matrix, sensitivity, specificity, and the area under the ROC curve.
4.3. Future Research Lines
Future research could extend the present findings in several directions. First, given that expectations and experience emerged as the strongest predictors of AI use, future studies should incorporate additional psychological and cognitive variables, such as trust in AI, perceived risk, and digital self-efficacy, to develop more comprehensive explanatory models. Second, the asymmetric classification performance observed in the model suggests the value of applying more advanced analytical approaches, including decision trees, ensemble methods, or clustering techniques, to identify distinct user profiles and improve predictive accuracy. Third, incorporating contextual or institutional factors—such as organizational policies, training opportunities, or access to AI tools—would enable multilevel analyses that capture the broader environment shaping AI adoption. Finally, longitudinal designs would enable the examination of how experience, expectations, and usage patterns evolve over time, providing a dynamic understanding of the determinants of AI use, especially in women.
Finally, future research could explore the use of Dynamic Logistic Ensembles to extend the analysis. This approach would allow a more in-depth examination of the sample’s possible internal heterogeneity by estimating multiple local models and recursively combining their predictions. Given that this method maintains the interpretive structure of logistic regression while improving its ability to identify differentiated patterns within subgroups, its application could offer a more nuanced understanding of how attitudinal and sociodemographic variables interact in predicting the phenomenon under study. The incorporation of this type of advanced model would improve analytical precision and broaden the explanatory scope of future research in this field.