1. Introduction
Linear function graphs are a demanding yet foundational component of school mathematics because they require learners to coordinate symbolic, numerical, visual, and contextual meanings in order to understand relationships between variables. Interpreting a graph is therefore not a matter of reading off values alone. As
Mathai et al. (
2024) note, it involves translating visual information into mathematical meaning, while
Sehole et al. (
2023) show that misconceptions related to graphical representations in the South African context are closely tied to a lack of understanding of linear relationships rather than to simple computational error. Graph teaching is thus an important site for examining the quality of mathematics instruction, since it reveals whether classroom practice supports conceptual understanding or merely enables routine procedural performance. This concern is reinforced by
Uyanik et al. (
2023), who found that even teachers may perform more strongly on routine graph tasks than on those requiring deeper interpretation and reasoning.
A longstanding concern in mathematics education is that procedural success is too often mistaken for genuine understanding. In graph topics, this problem is especially pronounced. Learners may be taught to plot points, identify intercepts, substitute into equations, or read off values without developing a robust understanding of variation, covariation, or the relationships represented by the graph itself. Research on graph teaching suggests that teachers’ knowledge may reflect a similar imbalance.
Özaltun Çelik (
2022) argues that knowledge for teaching line graphs extends beyond solving tasks correctly, requiring attention to how learners interpret axes, scales, trends, and relationships. Likewise,
Uyanik and Özmen (
2025) found that graph teaching often privileges relatively basic interpretation rather than deeper conceptual engagement. Graph instruction may therefore appear secure at the level of routine performance while remaining conceptually fragile at the levels of explanation, representation, and pedagogical judgement.
This concern becomes sharper when considered alongside the literature on teacher confidence. Although confidence is often associated with classroom practice, it is shaped by more than content knowledge alone.
Berg et al. (
2024), for instance, connect mathematics teaching self-efficacy to the use of effective pedagogical practices, while
Marschall (
2023) shows that self-efficacy is influenced by mastery experiences, social persuasion, and affective factors. Perceived self-efficacy is when people believe in their capabilities to execute a given task (
Bandura, 2006).
Grigaliūnienė and Lehtinen (
2025) further demonstrate that teaching self-efficacy varies across career stages, and
Umugiraneza et al. (
2022) found that teachers’ confidence is uneven across mathematical domains and tends to weaken in areas requiring stronger conceptual connections. Confidence, then, cannot be treated as a direct proxy for secure understanding. In line graph teaching, this distinction is especially important because teachers may feel confident handling routine procedures while remaining less secure when required to explain the rate of change, connect multiple representations, or diagnose learner misconceptions.
The significance of conceptual teaching is further highlighted by research on procedural and concept-based instruction. In a South African study,
Ncube and Luneta (
2025) found that concept-based instruction improved learner performance by helping students connect procedures to underlying meaning. That insight is particularly relevant to graphs, where concepts such as gradient, intercepts, and the equation of a straight line can easily be reduced to memorised rules if they are not explicitly linked to graphical and contextual meaning.
Ruf et al. (
2026), in their systematic review of graphing research in K–12 STEM education, similarly conclude that although graphing instruction can support both graph construction and interpretation, substantial difficulties remain in learners’ interpretation and use of graphs. These findings suggest that graph-related difficulty is not simply a matter of insufficient practice. Rather, it is often rooted in how graph knowledge is conceptualised, represented, and taught.
Research on learner difficulty strengthens this argument.
Sehole et al. (
2023) found that learners struggled to identify linear functions, interpret gradients and intercepts, and move between algebraic and graphical representations. In a related line of inquiry,
Patahuddin et al. (
2025) report that learners often experience difficulty reading beyond the data in context-based line graph tasks, even when more basic graph reading is manageable.
Mathai et al. (
2024) likewise show that line graphs are especially demanding because they require learners to coordinate two dimensions and translate spatial features into symbolic relationships. Taken together, these studies indicate that learners’ difficulties with graphs are best understood as conceptual and representational rather than merely procedural. This places considerable demands on teachers, since effective instruction depends not only on knowing how to solve graph tasks, but also on recognising why learners struggle and how teaching may either illuminate or obscure underlying mathematical meaning.
This brings teachers’ knowledge of learner thinking into sharper focus. Recent scholarship suggests that identifying learner error is not enough; what matters is the ability to infer the misconception underlying that error and respond instructionally in productive ways. As
Özaltun Çelik (
2022) makes clear, teaching line graphs requires attention to how learners think, not merely to whether they reach correct answers.
Schwartz-Aviad and Kohen (
2026) extend this argument by conceptualising diagnostic competence as the capacity to recognise students’ difficulties during instruction and make sense of them in real time. From this perspective, teachers’ perceptions of learner difficulty become analytically meaningful only when considered alongside their own conceptual understanding of the topic. A teacher may recognise that learners struggle with graphs, yet still interpret those struggles procedurally rather than conceptually, thereby narrowing the pedagogical response.
The rationale for the present study lies in this intersection of confidence, conceptual understanding, and perceptions of learner difficulty. Although scholarship on graph learning, teacher knowledge, and self-efficacy has expanded, existing studies have tended to focus on pre-service teachers, broad self-efficacy constructs, or mathematics learner performance more generally. Far less attention has been given to how in-service teachers’ confidence, conceptual understanding of graphs, and perceptions of learner difficulty intersect within a single analytic frame, particularly in under-resourced or rural South African contexts. This omission matters because such contexts can reveal how confidence, topic-specific knowledge, and pedagogical orientation operate where professional support is uneven and where routine teaching practices may become entrenched.
Henderson and Rodrigues (
2008) revealed a concerning gap between mathematical competence and confidence. On the other hand,
Mccullouch (
2016) argues that confidence is a key component of excellent mathematics teaching. However,
Pratiwi et al. (
2022) found that new teachers often struggle with low confidence in mathematics teaching, particularly when their conceptual understanding is shaky. Although confidence shapes practice, effective mathematics teaching also requires competence. We assume that teachers’ inadequate conceptual understanding may lead to learner difficulties. Very few studies focus on the three constructs together. It is against this backdrop that this study examines confidence, competence, and their perceptions of learner difficulties together rather than individually.
The present study addresses this gap by examining teachers’ written diagnostic responses on Grade 8 and Grade 9 graphs within a rural professional development context in South Africa. Rather than assuming that confidence reflects competence, the study investigates whether teachers’ reported confidence is supported by conceptual understanding and how their responses reveal procedural or conceptually oriented ways of thinking about teaching graphs. In doing so, the article argues that graph teaching provides a productive lens for examining a broader problem in mathematics education: the possibility that confidence may mask conceptual gaps, with important consequences for how learner difficulties are interpreted and addressed. The study was guided by the following research question: How do teachers’ responses to graph-related tasks reflect their confidence, conceptual understanding, and perceptions of learners’ difficulties in teaching Grade 8 and Grade 9 graphs?
1.1. Theoretical Framework
This study was guided by the combination of the Mathematical Knowledge for Teaching (MKT) and Self-Efficacy (SE) framework. The MKT framework has its intellectual roots in Shulman’s work on teacher knowledge, particularly his argument that effective teaching requires more than subject matter knowledge alone.
Shulman (
1986,
1987) introduced the notion of pedagogical content knowledge to explain the specialised knowledge teachers need to make subject matter comprehensible to learners. His work shifted attention from viewing teacher knowledge as either purely disciplinary or purely pedagogical to recognising the distinctive forms of knowledge involved in teaching particular content.
Building on Shulman’s conceptualisation,
Ball et al. (
2008) developed the Mathematical Knowledge for Teaching framework to account more specifically for the knowledge required in mathematics teaching. They argued that teaching mathematics demands forms of understanding that go beyond common content knowledge, since teachers must explain concepts, interpret learners’ errors, select appropriate examples, and represent mathematical ideas in ways that support understanding. MKT therefore provides a mathematics-specific elaboration of teacher knowledge by foregrounding the specialised knowledge used in teaching mathematics (
Ball et al., 2008).
The framework has since been widely used in mathematics education to examine how teachers understand mathematical content and respond to learners’ thinking. Of particular relevance to this study is the recognition that teachers’ knowledge is often topic-specific rather than uniform across the subject, and that effective teaching also requires knowledge of how learners typically engage with, misunderstand, or struggle with particular concepts (
Hill et al., 2008). This is important in the present study, which focuses on teachers’ responses to questions about graphs, including their explanations of linear and global graphs, gradients, x-intercepts, y-intercepts, and their perceptions of learners’ difficulties.
While MKT refers to the knowledge teachers possess and can teach, SE, on the other hand, explains whether they believe they can successfully use the knowledge in practice. Teachers’ SE was determined by their responses to questions given in the task. For instance, confidence in delivering effective instruction about the line graphs, including confidence in managing behaviour and learning conditions (
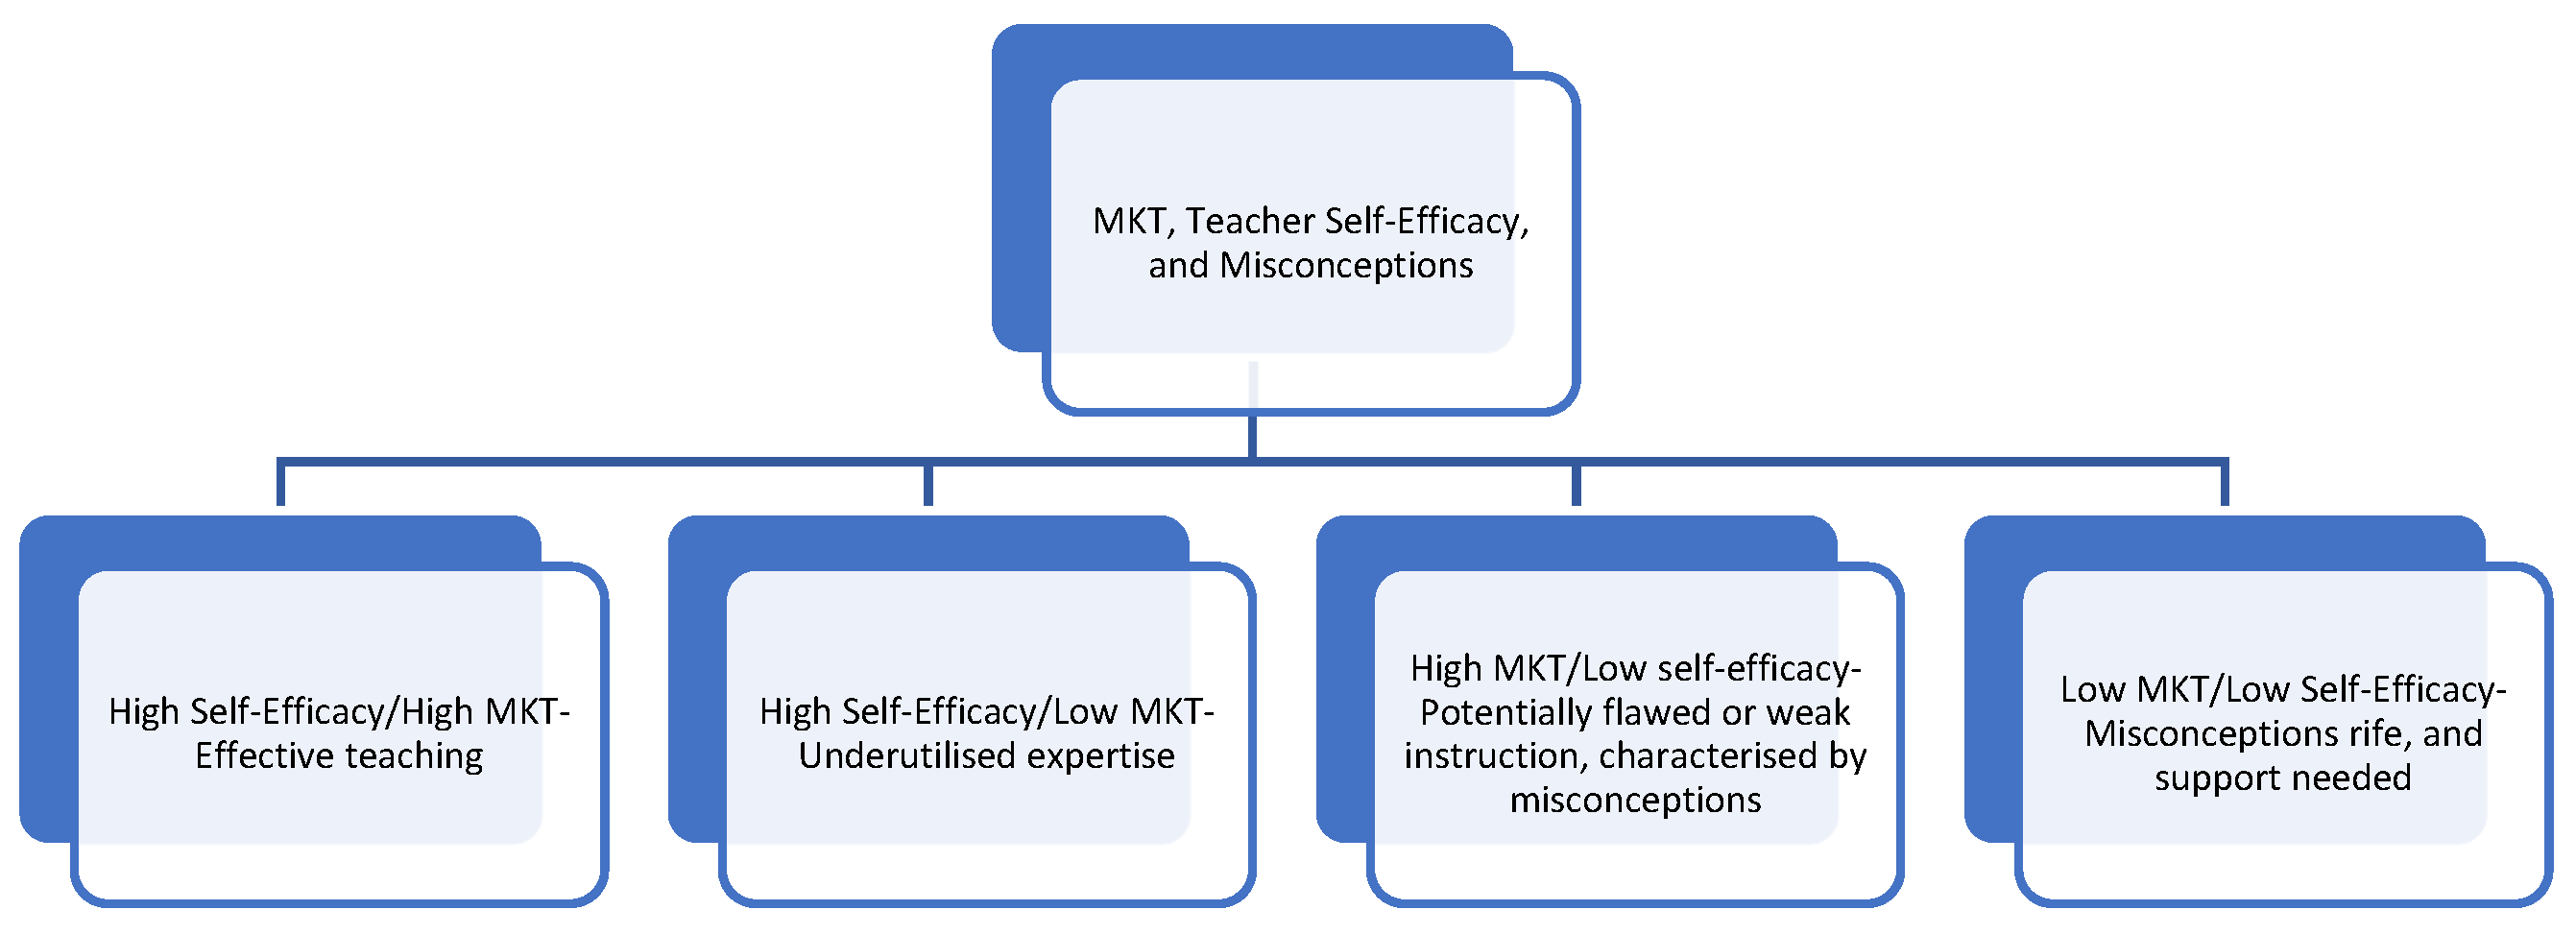
Hussain et al., 2022). Teachers’ SE was not necessarily measured; however, the analysis only shows alignment or the mismatch between MKT and SE. The following indicators were used in the analysis:
Figure 1 illustrates that knowing mathematical content is not enough, but believing that knowledge can be used effectively in classroom contexts is needed. Equally, confidence alone does not translate into effective content delivery. This implies that when practice is merged with competence, it can yield quality instruction.
The suitability of the framework for this study lies in the nature of the data and the inquiry’s purpose. The study does not focus only on teachers’ self-reported confidence in teaching graphs. It also examines the quality of the mathematical understanding reflected in their responses and the extent to which they could identify and interpret learners’ difficulties. These aspects align closely with MKT because the framework focuses on how teachers use mathematical knowledge in teaching contexts rather than on mathematical proficiency in an abstract sense (
Ball et al., 2008). In this study, the framework provided an appropriate lens for interpreting whether participants’ responses reflected conceptual understanding, procedural orientation, and awareness of learner difficulties in relation to line and global graphs, since they are part of the South African Grade 8 and Grade 9 syllabus. In this study, global graphs are visual representations showing the relationship between two variables without the need to calculate values, for example, the graph showing the relationship between temperature and rainfall.
1.2. Literature Review
Research on mathematics teaching suggests that teachers’ effectiveness in a topic such as graphs cannot be inferred solely from their confidence. Studies of mathematics teacher self-efficacy show that confidence is associated with classroom practice but is also shaped by factors such as career stage, prior teaching experience, and professional support rather than by content knowledge alone (
Berg et al., 2024;
Grigaliūnienė & Lehtinen, 2025;
Marschall, 2023). Similarly,
Umugiraneza et al. (
2022) found that teachers’ confidence varies across mathematical domains and tends to decline in areas requiring stronger conceptual understanding. Collectively, these findings indicate that self-reported confidence should not be treated as a direct indicator of secure conceptual understanding. This distinction is particularly important in graph teaching because teachers may be confident with routine tasks such as drawing or reading graphs, but less secure when explaining relationships between variables, rates of change, or the meaning of graphical features.
Research on teachers’ knowledge of graphs reinforces this distinction by showing differences between routine performance and deeper interpretive, explanatory, and pedagogical understanding.
Uyanik et al. (
2023) found that middle school mathematics teachers performed better on direct graph-reading tasks than on those requiring deeper interpretation and reasoning, while
Uyanik and Özmen (
2025) showed that graph teaching similarly tends to privilege relatively basic graph interpretation over richer conceptual engagement. These findings are consistent with
Özaltun Çelik (
2022), who showed that knowledge for teaching line graphs involves more than solving graph tasks correctly; it also entails anticipating how learners interpret axes, scales, trends, and covariation.
Ulusoy (
2025) likewise found that although prospective teachers could formulate mathematically acceptable graph-related problems, these did not always capture the key mathematical ideas embedded in linear graphs. Taken together, these studies suggest that graph teaching requires topic-specific conceptual knowledge that may not always be evident from teachers’ routine performance.
This concern is closely related to the distinction between procedural fluency and conceptual understanding in mathematics instruction. Although both are important, conceptually oriented teaching can help learners connect mathematical procedures to their underlying meaning. In the South African context,
Ncube and Luneta (
2025) found that concept-based instruction improved learner performance by helping learners connect mathematical procedures to their underlying meaning. This is particularly relevant to graph instruction, where concepts such as gradient, intercepts, and the equation of a straight line can easily be reduced to rules when they are not explicitly connected to graphical and contextual meaning.
Ruf et al. (
2026), in a systematic review of empirical research on graphing numerical data in K–12 STEM education, similarly found that although graphing instruction can improve graph construction and interpretation, difficulties in interpretation and use remain. These findings suggest that graph-related difficulties cannot be understood simply as a lack of procedural practice but must also be considered in relation to how graph knowledge is conceptualised and taught.
Research on learners further demonstrates the conceptual and representational nature of these difficulties.
Sehole et al. (
2023) found that learners struggled to identify linear functions, interpret gradients and intercepts, and move between algebraic and graphical representations.
Patahuddin et al. (
2025) similarly found persistent difficulties with reading beyond the data in context-based line graph tasks, even when more basic forms of graph reading were manageable, while
Mathai et al. (
2024) showed that line graphs require learners to coordinate two dimensions and translate spatial features into symbolic meaning. Across these studies, learner difficulties extend beyond computational errors to the interpretation of relationships and movement between representations. This places additional demands on teachers because effective graph instruction requires not only an understanding of the content but also recognition of the conceptual roots of learners’ difficulties.
Teachers’ knowledge of learner thinking and their diagnostic competence are therefore closely connected to conceptual knowledge of graphs. Identifying an error does not necessarily indicate an understanding of the misconception underlying it or how to address it instructionally.
Özaltun Çelik (
2022) showed that teaching line graphs requires attention to how learners think rather than merely whether they produce correct answers. Similarly,
Schwartz-Aviad and Kohen (
2026) conceptualise diagnostic competence as involving the recognition and interpretation of students’ difficulties during instruction. Taken together, this literature suggests that teachers may correctly identify areas in which learners struggle yet lack a sufficiently developed understanding of why those difficulties occur or how teaching practices may contribute to them. Perceptions of learner difficulty, therefore, become particularly meaningful when considered alongside teachers’ conceptual and pedagogical understanding of the topic.
Overall, the literature indicates that teacher confidence, graph-related knowledge, instructional orientation, and knowledge of learner thinking are interconnected aspects of effective graph teaching. Importantly, these dimensions should not be considered in isolation. Confidence may coexist with limited conceptual understanding, particularly when familiarity with routine graph procedures creates a sense of competence that is not accompanied by equally strong interpretive or explanatory knowledge. In turn, a predominantly procedural orientation may limit the extent to which teachers recognise the conceptual and representational sources of learners’ difficulties, even when they can identify the areas in which learners struggle. The literature, therefore, points to an important intersection: effective graph teaching requires not only confidence and procedural competence but also sufficiently developed conceptual knowledge to explain graphical relationships and to interpret learners’ thinking. Despite this growing body of work, an important gap remains. Much of the recent literature focuses on pre-service teachers, broad self-efficacy constructs, or learner performance in general mathematics. Fewer studies examine in-service teachers’ confidence, conceptual understanding of graphs, and perceptions of learner difficulties together within a single study, particularly in under-resourced or rural South African contexts. The present study addresses this gap by bringing these dimensions into a single analytic frame and focusing specifically on graph teaching, a topic in which procedural familiarity may easily mask conceptual weaknesses.
2. Materials and Methods
2.1. Research Approach and Design
This study adopted a qualitative exploratory case study design within a broader engaged scholarship project aimed at strengthening the pedagogical capability of Grade 8 and 9 mathematics teachers in South Africa. The qualitative approach was appropriate because the study sought to understand teachers’ confidence, conceptual understanding, and perceived learner difficulties in teaching Grade 8 and Grade 9 graphs. As
Creswell and Poth (
2018) argue, qualitative research is suited to studies that seek to explore how participants make meaning of a phenomenon in a specific context. The case study design was considered suitable because the inquiry was bounded to one rural circuit, one group of teachers, and one pre-intervention phase of a larger professional development initiative (
Merriam & Tisdell, 2016;
Yin, 2018).
2.2. Study Context
The study was conducted in a rural circuit in the Capricorn North District. It formed part of an engaged scholarship project designed to improve teachers’ pedagogical capability in mathematics. In this article, the focus is limited to the baseline phase of the project, specifically the teachers’ responses prior to the facilitation of graph intervention. Framing the paper this way is important because it makes clear that the article reports diagnostic pre-intervention evidence rather than the intervention’s outcomes.
2.3. Participants and Sampling
The participants were nine teachers from a rural circuit who took part in the professional development project. They were coded P1–P9 to protect their identities. Purposive sampling was appropriate because the study focused specifically on teachers directly involved in the engaged scholarship intervention and able to provide information relevant to the teaching of Grade 8 and Grade 9 graphs (
Creswell & Poth, 2018;
Palinkas et al., 2015). A single criterion guided the selection of participants, namely a background in rural teaching. This criterion was considered essential in light of the shortage of qualified teachers in rural schools (
Du Plessis & Mestry, 2019). Nevertheless, participants’ teaching experience and qualifications were also considered to inform the intervention design.
Of the nine participants, only two had more experience in teaching, that is, 10 and 22 years. All the remaining seven started their teaching career in 2025, with a teaching experience of one year. All the participants had a BEd degree in Further Education and Training (FET), with a specialization in mathematics. Only one participant had a BComm degree in finance, with a postgraduate certificate in education, which is a teaching methodology diploma.
The majority of participants were novice teachers in their first year of teaching Grades 8 and 9, except for two individuals. All participants held a bachelor’s degree, which is a formal teaching qualification. Furthermore, teaching Grades 8 and 9 is regarded as a generalist role since it requires foundational mathematical concepts.
Since the aim was not statistical generalisation but contextual understanding, a small sample size is reasonable in qualitative case study research (
Merriam & Tisdell, 2016).
2.4. Data Generation
Before the intervention was administered, participants were given the task of responding in writing to five open-ended questions:
How confident are you in teaching Grade 9 graphs?
What is the difference between a global graph and a linear graph?
What do x-intercept, y-intercept, and gradient mean?
Which part of graphs do your learners struggle with most?
Can you determine the equation of a straight-line graph from its graph?
The questions, particularly 2, 3, and 5, formed the core focus of the topic of graphs taught in the second term, and were used to measure teachers’ confidence in teaching Grade 9 graphs, their understanding of the distinction between linear and global graphs, their pedagogical explanation of x-intercept, y-intercept, and gradient, the graph concepts they perceived learners to struggle with most, and whether they could determine the equation of a straight-line graph from its graph. These questions were used diagnostically to establish a baseline understanding of teachers’ confidence and content knowledge, and to inform the design of the intervention activities. Because the questions elicited written explanatory responses rather than fixed-choice answers, they generated qualitative data suitable for interpretive analysis.
2.5. Data Analysis
The written responses were analyzed using qualitative content analysis. This approach was appropriate because the dataset consisted of short written responses to a small set of focused questions, and the purpose was to identify recurring patterns in teachers’ confidence, conceptual understanding, procedural orientation, and perceptions of learner difficulty. Qualitative content analysis is useful when the researcher seeks to organize textual data into categories and interpret patterns of meaning in a systematic way (
Hsieh & Shannon, 2005;
Elo & Kyngäs, 2008). In this study, all nine responses were read repeatedly, inductively coded, and then grouped into broader categories aligned with the questions’ focus, such as confidence in teaching graphs, understanding of graph concepts, and perceived learner difficulties.
For certain questions, responses were identical and were therefore not repeated during the coding process. As noted by
Belotto (
2018), coding involves identifying words, phrases, and sentences that convey similar meanings and assigning them to descriptive codes, as illustrated in
Table 1. Participants’ confidence levels were subsequently categorized as high or low based on the wording of their responses.
To ensure interrater reliability, the codes were sent to the second author for final checks. The analysis remained close to participants’ wording while allowing cautious interpretation of recurring patterns. Three aspects of Ball et al.’s professional knowledge were used to analyse participants’ responses. These aspects were specialized content knowledge (knowledge of graph concepts), knowledge of content and learners (their areas of struggle), and knowledge of content and teaching (the ability to explain concepts for conceptual understanding).
2.6. Trustworthiness
To enhance trustworthiness, the study should report credibility, dependability, confirmability, and transferability (
Lincoln & Guba, 1985). Credibility was supported through close engagement with the responses and the inclusion of direct participant excerpts in the findings. Dependability was strengthened by keeping the analysis aligned with the five diagnostic questions used across all participants. Confirmability can be addressed by explaining that the interpretations were grounded in the teachers’ written responses rather than in the facilitators’ assumptions. Transferability should be framed cautiously, with the paper acknowledging that the findings are context-specific and are intended to provide insight into a rural teacher professional development context rather than broad generalisation.
2.7. Ethical Considerations
The study formed part of a larger project that received ethics approval from the Twinning Project. The certificate also specifies that only de-identified data may be used for future secondary research with objectives similar to those of the original study. In this article, participants were anonymised using codes P1–P9, and no identifiable personal information is reported.
3. Findings
Prior to the intervention, nine participating teachers responded to five questions intended to explore their confidence, perceived strengths, and reported challenges in teaching line and global graphs. These responses were used to inform the design of the intervention activities. Analysis of the data suggested some variation in participants’ confidence and conceptual understanding of graph-related content.
3.1. Confidence in Teaching Graphs
Of the nine teachers who participated in the study, three reported limited confidence in teaching graph-related content, while the remaining six reported moderate to high confidence. A tentative pattern emerged: participants who expressed greater confidence also appeared to have more teaching experience; for example, P2.
P1: “Not confident enough”.
P2: “Me, I have been teaching Grade 9 graphs since 2011, and I am very confident in teaching Grade 9”.
P3: “I am full of confidence, open, and enjoying”.
P4: “100% confident”.
3.2. Knowledge of Graph Concepts and Teaching
Participants were also asked whether they could differentiate between line graphs and global graphs. Some of their responses were:
P1: “A linear graph is a straight-line graph”.
P2: No response.
P3: “A linear graph is a straight-line graph—global graph (First time hearing about it)”.
P4: “A linear graph refers to a straight-line graph. A global graph is any graph that is not straight, such as a parabola”.
Two participants did not provide a response to the question concerning the distinction between line graphs and global graphs, while several others offered only partial explanations. These responses largely emphasized the properties of straight-line graphs, with limited reference to broader graph concepts. Additionally, P3 reported encountering the concept of global graphs for the first time despite the topic being included in the Annual Teaching Plan. Collectively, these findings indicate that, despite participants expressing confidence in their ability to teach graph-related content, their understanding of specific graph concepts appears to be uneven. This discrepancy suggests a misalignment between their self-reported confidence and their demonstrated conceptual knowledge of the topic.
Some participants’ omission of Question 2 may suggest uncertainty about the distinction between line and global graphs. This pattern is noteworthy, particularly in cases where participants also reported confidence in teaching graph-related content. This may point to uneven familiarity with specific graph concepts and suggests the need to consider more closely the depth and scope of teachers’ mathematical content knowledge in this area. Although P4 attempted to differentiate between line and global graphs, the response reflected only a partial understanding of the concept.
At the same time, participants appeared to demonstrate stronger mathematical content knowledge of foundational graph concepts, particularly when asked to describe the x- and y-intercepts and the meaning of the gradient. This is evident, for example, in P3’s response to Question 3:
P3: The x-intercept simply means the points on the x-axis where the graphs cut or intercept the x-axis. (The y-value is zero here. The y-intercept is the point where the graph cuts the y-axis. X is zero. P3 not only described the meaning of the gradient in relation to the behaviour of the graph but also extended the explanation to include the idea of rate of change, saying, “the gradient is the slope. It also tells us whether the graph is increasing or decreasing, or how the graph changes per unit interval”.
This suggests a relatively strong content knowledge and understanding of the concept.
Although most participants accurately described the x- and y-intercepts, some explanations were primarily procedural. For example, P7 explained: X-intercept refers to x-values where y = 0, and y-intercept refers to the y-values where x = 0.
A similar characterisation was evident in the responses of P7 and P8:
P7: X-intercept is the value of x when y = 0, and y-intercept is the value of y when x = 0.
P8: X-intercept is the x-value on the y-axis, and y-intercept is the y-value on the x-axis.
These explanations focused mainly on value substitution and emphasised procedures rather than on the intercept concept. As a result, they provided limited insight into the conceptual meaning of the intercept. Although this finding suggests a stronger procedural orientation in participants’ explanations of foundational graph concepts, it also reveals a pedagogical stance that can result in ambiguity. By contrast, global graphs appear to require a more contextualised and conceptual understanding. These responses may therefore point to some reliance on procedures in the teaching of graphs.
3.3. Perceptions and Knowledge of Learner Difficulties in Graphs
A related finding emerged from participants’ responses to Question 4, which focused on the graph topics they perceived learners to find most challenging. Participants indicated the following as learners’ challenges:
P3: “Finding the equations of a linear graph”.
P9: “Finding the point of intersection”.
P6: “If the graph is drawn on a grid, learners struggle to interpret it by calculating the gradient, the equation, etc.”.
Both P3 and P9 indicated that learners experience difficulties with procedures related to determining the equation of a straight line and identifying points of intersection. This is noteworthy, given that some participants had earlier demonstrated sound knowledge of certain graph concepts. This may therefore suggest that teacher understanding of a topic in itself does not always translate into sound pedagogical knowledge for effective teaching. One possible explanation is that procedural aspects of graphs may be emphasised more strongly than the underlying conceptual relationships, making it difficult for learners to recognise connections between ideas.
P6 also highlighted learners’ difficulties in interpreting graphical information. This is a unique and important observation, as graph interpretation requires more than the application of procedures. It calls for an understanding of how different graph features relate to one another and how given information can be used to determine unknown values. Taken together, these responses suggest that while participants appeared more confident with some foundational aspects of graph teaching, they may be less confident in other graph concepts, resulting in an emphasis on procedures instead of helping learners develop deeper conceptual understanding.
Overall, these findings indicate some variation in how graph concepts were understood and potentially taught. A participant may demonstrate a relatively strong understanding in one area while showing limitations in another. This points to the need for ongoing support to strengthen both conceptual and instructional understanding of graph-related content.
4. Discussion
This discussion interprets the findings through three interrelated themes: confidence as a potentially misleading indicator of graph-related knowledge, uneven specialised content knowledge reflected in procedural orientations to graph teaching, and limited diagnostic insight into learners’ difficulties. Interpreted through the Mathematical Knowledge for Teaching framework, these themes suggest that graph teaching in this rural professional development context was shaped not simply by what teachers reported about their confidence, but by variation in how securely and pedagogically they understood the topic. The findings, therefore, point to a broader issue in mathematics education: teachers may appear ready to teach a topic because they are familiar with its routines, while still lacking the depth of understanding needed to explain concepts, interpret learner thinking, and respond instructionally in ways that support conceptual learning.
4.1. Confidence as a Potentially Misleading Indicator of Graph-Related Knowledge
A key finding of the study is that teachers’ reported confidence in teaching graphs did not consistently align with strong conceptual understanding of graph-related ideas. Although most participants expressed moderate to high confidence, their responses revealed uncertainty and unevenness in relation to important concepts, particularly the distinction between line and global graphs. This matters because it suggests that confidence in graph teaching may reflect familiarity with routine classroom practices rather than secure topic-specific understanding. In this respect, the findings support existing literature indicating that teacher confidence is shaped by several factors and should not be interpreted as a straightforward indicator of content knowledge.
Berg et al. (
2024) associate self-efficacy with the use of effective pedagogical practices, while
Marschall (
2023) shows that mastery experiences, social persuasion, and affective conditions influence self-efficacy.
Umugiraneza et al. (
2022) likewise found that teachers’ confidence varies across mathematical domains and tends to weaken in areas requiring stronger conceptual connections. Furthermore,
Umugiraneza et al. (
2022) contend that the level of mathematical knowledge teachers possess influences their confidence in teaching the subject. Therefore, teachers who claim to be more confident in teaching Grade 9 graphs should have an understanding of the topic. The present study sharpens this argument by showing that, in graph teaching, confidence may coexist with conceptually thin or partial understanding.
From an MKT perspective, this theme points to a distinction between self-assurance and pedagogically usable mathematical knowledge. The findings confirm
Ball et al.’s (
2008) assertion that teaching mathematics requires more than confidence or correct performance. However, the findings challenge
Beswick et al.’s (
2012) assertion that teachers’ confidence and their knowledge are connected. In this study, participants demonstrated knowledge gaps when differentiating between line and global graphs, showing that their confidence misaligned with their pedagogical knowledge of Grade 9 graphs. There is a need for specialised content knowledge that enables them to explain the intercepts and distinguish between graph-related concepts to make meaning and content accessible to learners. In the present study, some teachers appeared confident in teaching graphs, yet their written responses suggested that this confidence was not always matched by sufficiently developed specialised knowledge of the topic. This aligns with
Hamerská et al.’s (
2025) finding that there is often a mismatch between performance and confidence, where some participants tend to overestimate their abilities. The significance of this finding lies in its challenge to any assumption that confident teaching necessarily reflects secure knowledge for teaching. Rather, the findings suggest that confidence may obscure underlying conceptual limitations that become visible only when teachers are required to explain, distinguish, or interpret graph-related ideas beyond routine procedures, potentially resulting in the delivery of content at a superficial level.
4.2. Uneven Specialised Content Knowledge and Procedural Orientations to Graph Teaching
A second theme concerns the unevenness of teachers’ conceptual understanding and the extent to which their responses reflected procedural orientations to graph teaching. Participants appeared more secure when dealing with familiar graph features such as gradient and intercepts, but less secure when required to distinguish between graph types or explain concepts in broader relational terms. In several cases, concepts such as intercepts were described mainly through substitution rules rather than through their meaning within the graph. This indicates not an absence of knowledge, but uneven specialised content knowledge, with some aspects of graph teaching understood in ways that were procedurally functional yet not fully conceptually elaborated.
This pattern closely aligns with the literature on graph teaching by
Uyanik et al. (
2023), who found that teachers performed more strongly on direct graph-reading tasks than on tasks requiring deeper interpretation and reasoning. Similarly,
Uyanik and Özmen (
2025) show that graph teaching often privileges relatively basic interpretation rather than richer conceptual engagement. This was demonstrated in teachers’ focus on procedural descriptions of the x- and y-intercepts. On the other hand,
Özaltun Çelik (
2022) argues that knowledge for teaching line graphs involves more than producing correct answers, as shown in participants’ responses. It also requires teachers to anticipate how learners interpret axes, scales, trends, and relationships, and include thorough descriptions of these concepts in a way that would convey meaning. For instance, describing the x-intercept as a point where y = 0 leaves out a crucial aspect of what the x-axis means, and in learners’ minds, this could isolate x as a value from where it is situated on the x-axis. The present study supports and extends this work by showing that even when teachers can provide correct or partially correct responses to graph-related prompts, those responses may still reveal a reliance on procedures rather than on mathematically unpacked understanding.
The distinction between procedural fluency and conceptual understanding is central here.
Ncube and Luneta (
2025) show that concept-based instruction supports meaningful learning by helping learners connect procedures to underlying mathematical ideas. In graph teaching, this is especially important because concepts such as gradient, intercepts, and the equation of a straight line can easily be reduced to rules if they are not explicitly linked to representation and meaning. The present findings suggest that some teachers themselves may hold graph-related knowledge in ways that privilege doing over explaining. Interpreted through MKT, these points indicate uneven specialised content knowledge: teachers may know how to perform or demonstrate a procedure, yet still lack the deeper understanding needed to explain why it works, how it relates to the graph as a representation, and how it connects to broader mathematical relationships. The contribution of this finding lies in showing that procedural orientation is not merely an instructional style. It may also reflect underlying limitations in the form of mathematical knowledge available for teaching.
4.3. Limited Knowledge of Content and Students in Teachers’ Accounts of Learner Difficulty
A third theme concerns teachers’ perceptions of learner difficulty and the extent to which these reflected developed diagnostic understanding. Participants were able to identify several areas in which learners struggle, including finding the equation of a straight line, determining points of intersection, and interpreting graphical information. These observations are consistent with the literature.
Sehole et al. (
2023) found that learners struggle to identify linear functions, interpret gradients and intercepts, and move between algebraic and graphical representations, while
Mathai et al. (
2024) show that line graphs are cognitively demanding because learners must coordinate two dimensions and translate spatial features into symbolic meaning. The present study, therefore, confirms that teachers are aware of important areas of learner struggle in graph work.
However, awareness of learners’ difficulties did not always translate into strong diagnostic insight. Although participants could often identify what learners found difficult, they did not always provide conceptually developed explanations of why these difficulties arise or how they relate to the structure of the mathematical content. In several cases, learner difficulty appeared to be framed in terms of procedures that learners fail to execute rather than in terms of misconceptions, representational confusion, or weak conceptual connections. This suggests that teachers’ diagnostic understanding was itself uneven. From the perspective of MKT, this is especially significant because it points to limitations in knowledge of content and students. As
Hill et al. (
2008) argue, teachers need to anticipate how learners are likely to think about particular mathematical ideas and where they are likely to struggle.
Schwartz-Aviad and Kohen (
2026) similarly emphasise that diagnostic competence involves recognising students’ difficulties and making sense of them in real time. The present study extends this argument by showing that teachers may notice learner difficulty without possessing equally strong conceptual resources for interpreting it.
This matters because the pedagogical response to learner difficulty depends on how that difficulty is understood. If learners’ struggles are interpreted mainly as procedural failure, the instructional response is likely to remain procedural as well. If, however, difficulty is understood as rooted in representational or conceptual misunderstanding, teaching is more likely to address the underlying structure of the problem. The present findings suggest that some teachers may recognise that learners struggle with graphs while still lacking a sufficiently developed account of the conceptual origins of that struggle. In this sense, awareness of learner difficulty and diagnostic depth should not be treated as equivalent.
4.4. Integrating the Themes
Taken together, these themes suggest that graph teaching is an important site for revealing how confidence, topic-specific knowledge, and interpretations of learner difficulty interact in practice. The findings do not suggest that teachers lacked all relevant knowledge. Rather, they point to unevenness across forms of knowledge that matter for teaching: confidence without always secure conceptual grounding, correct or partially correct responses without always strong explanatory depth, and awareness of learner difficulty without always strong diagnostic interpretation. Viewed through the Mathematical Knowledge for Teaching framework, this pattern indicates variation in both specialised content knowledge and knowledge of content and students.
The study’s contribution is to bring these dimensions together within a single analytic frame. Existing scholarship has often examined self-efficacy, graph knowledge, or learner difficulty separately. By considering them together, the present study clarifies how they intersect. Confidence may coexist with conceptual gaps. Procedural competence may coexist with limited explanatory power. Recognition of learner difficulty may coexist with weak diagnostic depth. This is important because it suggests that weaknesses in graph teaching may not always appear as an obvious error or a lack of confidence. Instead, they may remain hidden within routine familiarity and become visible only when teachers are asked to explain concepts, distinguish between related ideas, or interpret learner thinking.
The study’s rural professional development context further underscores this point. Although the data do not suggest that rurality itself causes conceptual weakness, the context matters because it highlights the professional conditions under which teachers’ knowledge is developed and enacted. When sustained, content-focused support is uneven, teachers may rely more heavily on established routines and procedural approaches. The findings, therefore, highlight the importance of professional development that goes beyond confidence-building and procedural rehearsal. Support for graph teaching should focus more directly on strengthening conceptually secure, topic-specific knowledge; on connecting procedures to representations and meaning; and on developing teachers’ ability to interpret learner difficulties in diagnostically informed ways.
5. Conclusions
Overall, the study suggests that graph teaching should not be evaluated simply in terms of teacher confidence or routine success. It should be examined to determine whether teachers possess the depth of understanding needed to explain graph-related concepts meaningfully, anticipate how learners are likely to struggle, and respond in ways that promote conceptual learning. The broader implication is that confidence may mask conceptual vulnerability, with important consequences for the teaching of graphs and for learners’ opportunities to develop meaningful mathematical understanding.
5.1. Limitations
This study has several limitations that should be acknowledged. First, it involved a small sample of nine teachers from one rural circuit, meaning the findings are context-specific and cannot be generalised to all mathematics teachers or school settings. Second, the study relied on written diagnostic responses to a small set of open-ended questions rather than on classroom observations, interviews, or lesson artefacts. As a result, the analysis was limited to what teachers wrote and could not examine how their knowledge and orientations were enacted in actual classroom practice. Third, because the study focused on the baseline phase of a broader professional development project, it does not show how teachers’ understanding may have developed after the intervention. Finally, the study focused specifically on graph teaching in Grades 8 and 9, and the findings may therefore not apply directly to other mathematical topics in which the relationship between confidence, conceptual understanding, and learner difficulty may take different forms.
5.2. Recommendations
Based on the findings, the study recommends that professional development in graph teaching should move beyond general confidence-building and procedural rehearsal to focus more directly on strengthening teachers’ conceptually secure knowledge of graph-related ideas. In particular, support programmes should create opportunities for teachers to unpack concepts such as gradient, intercepts, graph types, and the equation of a straight line in ways that connect procedures to graphical meaning and representation. Teacher development should also place greater emphasis on diagnostic competence by helping teachers identify and interpret learners’ misconceptions in conceptually informed ways rather than primarily in procedural terms. In addition, curriculum support initiatives should encourage the use of tasks that require explanation, comparison, and movement across algebraic, graphical, and contextual representations so that both teachers and learners engage more deeply with underlying mathematical relationships. Finally, future research should extend this work by including classroom observations, interviews, and post-intervention data in order to examine how teachers’ graph-related knowledge is enacted in practice and how it may develop through sustained professional support.