Article

Are Teachers Prepared for the Anthropocene? Climate–Vegetation Integration in Science Teacher Education Across 26 Countries


by
José Carlos Piñar-Fuentes
1,*,
Ana Cano-Ortiz
2,
Luisana Rodríguez Ramírez
1 and
Eusebio Cano
3
1
Faculty of Education, UNIE International University of Business, 28015 Madrid, Spain
2
Department of Didactics of Experimental, Social and Mathematical Sciences, Universidad Complutense de Madrid (UCM), 28040 Madrid, Spain
3
Department of Animal and Plant Biology and Ecology, Section of Botany, University of Jaen, Campus Universitario Las Lagunillas s/n, 23071 Jaén, Spain
*
Author to whom correspondence should be addressed.
Educ. Sci. 2026, 16(1), 56; https://doi.org/10.3390/educsci16010056
Submission received: 24 September 2025 / Revised: 4 December 2025 / Accepted: 17 December 2025 / Published: 31 December 2025

Abstract

This study examines how climate change and vegetation are integrated into teacher education curricula across 26 countries, addressing a critical gap in understanding how future teachers are prepared to respond to the climate and biodiversity crises. To evaluate curricular integration systematically, we developed and validated the Climate and Vegetation Curriculum Integration Index (CCVI), which measures four dimensions: climate change, vegetation, links between the two, and pedagogical strategies. Content analysis of 70 official curriculum documents was conducted, with high inter-rater reliability (κ = 0.72–0.85) and internal consistency (Cronbach’s α = 0.89) confirming the robustness of the instrument. Results show that integration remains partial and uneven: climate change content is more common than biodiversity, while vegetation is often marginalized, perpetuating the phenomenon of “plant blindness.” Exemplary cases in Finland, Germany, Mexico, Norway, and Switzerland demonstrate that high levels of integration are achievable, but intra-country variability often exceeds cross-country differences, highlighting the influence of institutional design. The study concludes that teacher education worldwide is not yet aligned with the urgency of global sustainability challenges. The CCVI provides a practical tool for benchmarking progress and guiding reforms, underscoring the need to embed sustainability as a core element of teacher preparation to foster ecological literacy, resilience, and civic engagement.

1. Introduction

The contemporary climate crisis has established itself as one of the greatest global challenges of our time. Recent scientific evidence shows unprecedented increases in the planet’s average temperature, accompanied by increasingly frequent and severe extreme weather events. (FAO, 2022; Lee et al., 2023; Parmesan et al., 2000). The latest assessment cycle of the Intergovernmental Panel on Climate Change (IPCC) (Lee et al., 2023) warns that human activities have already caused warming of approximately 1.1 °C above pre-industrial levels, causing dangerous disruptions to ecosystems and societies. In fact, there is a rapidly closing ‘window of opportunity’ to limit the temperature increase to 1.5 °C and avoid catastrophic impacts (Bevacqua et al., 2025). Given this situation, the international community has recognised that a sustainable solution is not possible without a robust and urgent educational response (UNESCO, 2021a, 2023).
In 2015, the United Nations adopted the 2030 Agenda and the Sustainable Development Goals (SDGs), emphasising the central role of education in combating climate change and environmental degradation. (Cano-Ortiz et al., 2025; ONU, 2015). Sustainable Development Goal (SDG) 4, Quality Education, includes Target 4.7, which calls for the integration of Education for Sustainable Development (ESD) and global citizenship education into educational systems. In parallel, SDG 13, Climate Action, highlights the need to strengthen education, awareness, and both human and institutional capacity in relation to climate change (ONU, 2015). These global initiatives reflect a growing consensus: education must empower new generations with the knowledge, skills, values, and attitudes required to confront the climate crisis and to promote a sustainable future (González Gaudiano & Meira Cartea, 2020; UNESCO, 2021a).
Within this context, numerous international organisations—from UNESCO to the OECD—have called for strengthening climate education across all levels of education. UNESCO, as a leading advocate of Education for Sustainable Development (ESD), has categorically stated that “there is no solution (to the climate crisis) without education” and urges that climate change be integrated into curricula as a cross-cutting theme in both primary and secondary education (OECD, 2015; UNESCO, 2021a). Education should not only convey climate science but also foster active participation and civic engagement in climate action (Evans et al., 2024; Gal, 2024; Pinheiro et al., 2024; Tang, 2022). In this regard, authors such as González Gaudiano & Meira Cartea (2020) distinguish between educating about climate (focused on scientific content) and educating for change (aimed at transformative socio-environmental action). They advocate the latter approach, which links knowledge with values and sustainable practices.
The OECD emphasises that quality climate education should provide students not only with a deep understanding of environmental issues but also with the motivation and competences to co-develop solutions (Schleicher et al., 2021). Meaningful learning in this field entails linking science with civic and ethical dimensions, equipping students to mitigate climate change and adapt to its impacts through an informed and collaborative approach (OECD, 2019; Shek et al., 2025). The strategic importance of climate education has also been highlighted in international events such as COP26 (Gamboa-Bernal, 2022; Lennan & Morgera, 2022), where, for the first time, Ministers of Education and Environment met jointly to promote the integration of climate change into education systems (UNESCO, 2021a). As a result, several countries have made concrete commitments: for instance, Italy introduced climate and environmental education as a compulsory component of civic education in all schools from 2020, while Latin American nations such as Costa Rica have placed environmental sustainability at the core of their national curricula and teacher training programmes (Jones, 2019; Ministerio de Educación Pública de Costa Rica, 2020).
Despite these advances and international consensus, various reports reveal that current education systems still fall far short of reflecting the severity of the climate crisis (Piñar-Fuentes et al., 2024; UNESCO, 2021a). A global UNESCO analysis reported that only 53% of national curricula make any reference to climate change and usually assign it a very low priority (UNESCO, 2021c). In other words, nearly half of countries do not explicitly incorporate climate-related content into their school curricula, thereby missing a crucial opportunity for awareness-raising (UNESCO, 2021a, 2021c).
With regard to other ecological issues, previous analyses of science curricula also suggest that concepts related to biodiversity and ecosystems often receive only limited and fragmented attention compared with other areas of natural science (Cano-Ortiz et al., 2018, 2021a, 2021b; 2022a, 2025; Piñar-Fuentes et al., 2024; Stagg & Dillon, 2022). This curricular gap arises precisely when scientific evidence underscores that climate change is closely intertwined with biodiversity loss—for instance, around 39% of vascular plant species worldwide are threatened by factors linked to climate change, habitat loss, and overexploitation. (Morrow, 2023), indicating that the climate crisis is also an ecological crisis (Mochel et al., 2013; Ikendi, 2022; Lee et al., 2023).
Nevertheless, in educational practice a fragmented perspective often prevails climate change is addressed mainly from the standpoint of Earth sciences or atmospheric physics, whereas the biological dimension—particularly that related to vegetation and terrestrial ecosystems—receives less attention than might be expected (Mochel et al., 2013; Cano-Ortiz et al., 2021b, 2022a, 2022b, 2022c; Monroe et al., 2019; Stagg & Dillon, 2022). This gap contributes to what recent literature calls plant awareness disparity—historically labelled “plant blindness”—the tendency to undervalue plants compared to animals, leading to an educational shortcoming: overlooking vegetation’s key roles in climate cycles reduces the effectiveness and depth of environmental education (Stagg & Dillon, 2022; Wandersee & Schussler, 1999).
Recent research highlights the need to integrate botanical and plant ecology content into education for sustainability as a means of overcoming this limitation (Stagg & Dillon, 2022). Following a comprehensive review, scholars warn that botany has traditionally been marginalised within the science curriculum, representing a “missed opportunity” to strengthen climate and ecological education (Morrow, 2023). These authors note that neither the importance of plants for sustainability nor the threats they face (e.g., climate change) are being adequately addressed in school science education. Consequently, they propose rethinking the teaching of botany as an integral part of climate change education. Specifically, they argue that teachers should receive greater training and support to challenge their assumptions about plants and to emphasise their critical role in ecosystems (Morrow, 2023; Stagg & Dillon, 2023).
They also suggest increasing the presence of plants in classrooms (for example, through school garden projects, botanical collections, or field activities) to foster student’s emotional and cognitive connections with nature (Morrow, 2023; Stagg & Dillon, 2022, 2023). This perspective aligns with a more holistic approach to environmental education, in which knowing is linked to valuing and acting. Indeed, numerous authors agree that isolated knowledge does not guarantee pro-environmental behavioural change (Pe’er et al., 2007; Stagg & Dillon, 2023). This knowledge must be complemented with practical experiences, ethical reflection, and community participation, enabling students to develop ecological literacy and agency for sustainability (Cano-Ortiz et al., 2021d, 2022a; Orr, 2004; Stagg & Dillon, 2023). Including the dimension of vegetation—from species diversity and their role in biogeochemical cycles to the ecosystem services they provide and conservation strategies—can significantly enrich climate education, making it more tangible, local, and connected to students’ everyday lives (Stagg & Dillon, 2023). In sum, integrating climate change and plant ecology content would not only help to overcome plant awareness disparity (PAD) but also provide more comprehensive training to address the twin crises of climate change and biodiversity.
Teachers play a key role in educational transformation, as they connect scientific content with students’ realities and foster critical engagement. Initial training in Natural Sciences teaching is therefore strategic for advancing climate and ecological education. Yet studies reveal important gaps: a global UNESCO–Education International survey found that although 95% of teachers deem climate change education “essential”, fewer than 40% feel adequately trained or confident to teach it (UNESCO, 2021c). This training gap suggests that many teacher education programmes still do not fully incorporate content on climate change, sustainability, or the specific pedagogy required to address them (UNESCO, 2021a, 2021c). In the specific case of education on vegetation and botany, the situation is equally challenging: teacher training curricula in the sciences have traditionally prioritised areas such as zoology, microbiology, or human physiology over plant ecology, which may in turn lead future teachers to reproduce this imbalance in their own classrooms (Cano-Ortiz et al., 2021a, 2022c, 2025; Hershey, 1996; Quinto-Canas et al., 2021). In response to this situation, bodies such as the European Commission have emphasised the urgency of reorienting teacher education towards sustainability.
A recent Eurydice report (Parveva et al., 2024) analyses how sustainability competences are being incorporated into European education systems and, specifically, highlights the need to integrate them both into teacher competence frameworks and into initial and continuing teacher education programmes. According to the report, some countries have begun to include environmental and climate education explicitly within professional teaching standards and in the training content of faculties of education, providing support and resources to ensure that trainee teachers acquire these competences (Parveva et al., 2024). Nevertheless, the situation varies widely across national contexts. In Spain, for instance, current education legislation (Government of Spain, 2020) recognises sustainable development as a cross-cutting element of the school curriculum, and the Environmental Education Action Plan for Sustainability 2021–2025 (PAEAS) promotes teacher training in this field. Even so, few studies have examined the actual presence of climate change and plant ecology content in the training curricula of future science teachers, or how these teachers themselves perceive their preparedness to teach such topics. (Álvarez-García et al., 2017; Cebrián & Junyent, 2014; Varela-Losada et al., 2016).
In this context, the present article addresses one component of a broader research programme by focusing on a descriptive question: how, and to what extent, are issues of climate change and vegetation integrated into the initial training of science teachers?
The central hypothesis of this research is that the intentional and adequate incorporation of such content into initial training will enhance the climate and ecological literacy of future teachers, strengthening their scientific knowledge, environmental awareness, and self-efficacy to teach these topics as interdisciplinary socio-scientific issues that connect natural sciences with social, economic, and ethical dimensions of sustainability.
Drawing on previous literature, we assume that stronger curricular integration is a necessary (though not sufficient) condition for enhancing future teacher’s climate and ecological literacy; however, this article does not test that assumption directly. Instead, it pursues the main objectives:
  • To analyse the presence and treatment of content related to climate change, vegetation/biodiversity and their interconnections.
  • To associate eco-climatic teaching strategies in initial teacher education curricula (e.g., in science subjects, science didactics, or environmental education) and in the official documents that regulate them.
  • Other components of the wider project (e.g., student’s perceptions and a pilot training intervention) will be reported elsewhere.
Ultimately, the study aims to provide empirically grounded didactic guidelines and curricular recommendations to strengthen climate education and the teaching of botany in teacher training.

2. Materials and Methods

2.1. Study Design and Scope

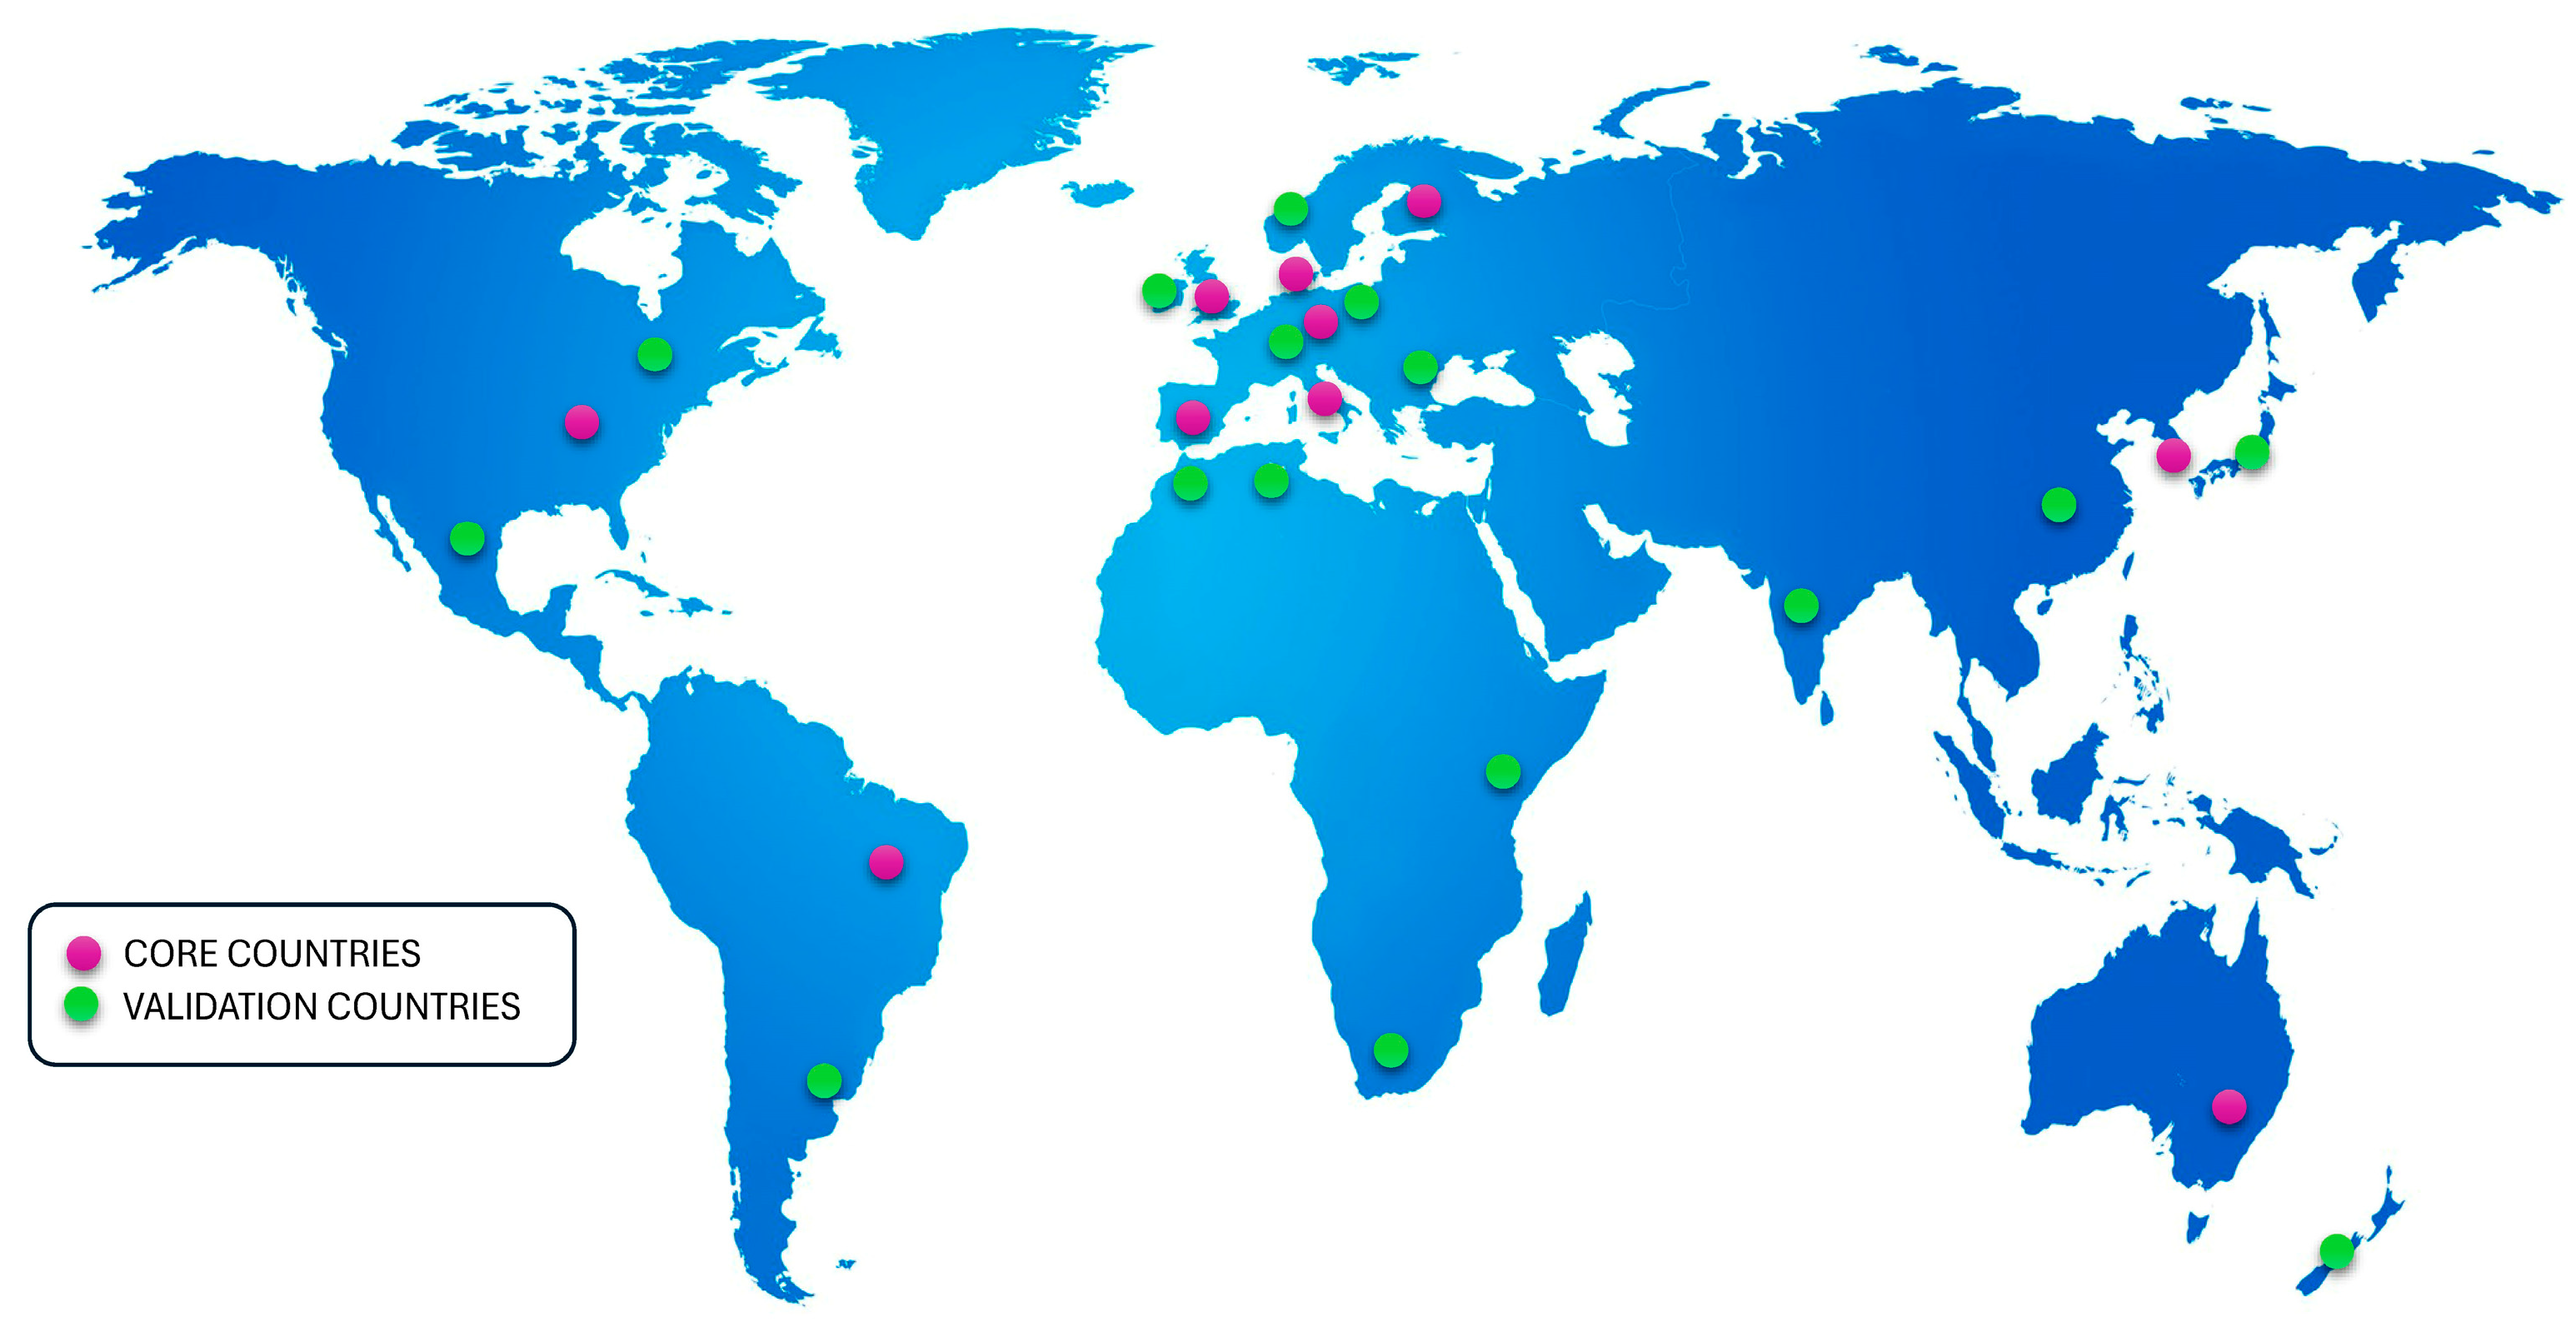
This study adopts a documentary descriptive design to examine how issues of climate change and vegetation are integrated into initial science teacher education curricula (Grazziotin et al., 2022). The unit of analysis consists of official curricular documents—degree plans, programme handbooks, and course syllabi—corresponding to Natural Sciences teacher education programmes (Corpuz et al., 2022). The sampling strategy followed a two-tier structure (Figure 1):
  • Core sample (10 countries): Spain, Finland, Germany, Italy, Denmark, the United Kingdom, the United States, Australia, Brazil, and South Korea. These cases form the primary comparative base, chosen to represent a diverse range of European, Anglo-Saxon, Latin American, and Asian contexts.
  • Validation sample (16 countries): Canada, China, India, Ireland, Mexico, Norway, Poland, South Africa, Ukraine, Argentina, Algeria, Japan, Kenya, Morocco, New Zealand, and Switzerland. These cases were included to extend geographical coverage and to validate the robustness and transferability of the Climate and Vegetation Curriculum Integration Index (CCVI) across broader educational systems.
All documents were retrieved from official institutional or ministerial sources (degree regulations, course syllabi, or national frameworks) and correspond to the most recent versions available at the time of data collection (see Supplementary Materials for the complete list with URLs and retrieval dates). While not exhaustive for each country, the corpus captures a comparative cross-section of prominent science teacher education programmes across 19 national contexts (Table 1). Identical coding and reliability procedures were applied consistently to both the core and validation samples.

2.2. Climate and Vegetation Curriculum Integration Index (CCVI)

To systematically evaluate the extent to which climate change and vegetation-related issues are integrated into teacher education curricula, we developed the Climate and Vegetation Curriculum Integration Index (CCVI). The CCVI is a four-dimensional analytical instrument designed to capture both the presence and the quality of integration of environmental content in official curricular documents. This study makes several contributions. First, it helps to bridge the current fragmentation between climate change and plant ecology, which are often treated as separate domains in teacher education curricula. Second, it introduces a scalable tool—the CCVI—that can be applied and replicated in future cross-national studies. Third, it combines qualitative coding with quantitative comparison, enabling both depth and breadth of analysis. Finally, it shows how the index can be integrated with AI-assisted coding under human oversight, providing methodological innovation while preserving the central role of expert judgement.
In this way, the CCVI functions as both a measurement tool and a conceptual framework for assessing how well science teacher education prepares future educators to tackle the dual crises of climate change and biodiversity loss.

2.2.1. Rationale for the CCVI

Although previous studies and international monitoring reports (UNESCO, 2021c) have assessed the presence of climate change in school curricula, no instrument has been specifically tailored to measure the joint treatment of climate change and vegetation in initial science teacher education. The CCVI was thus conceived to fill this analytical gap, providing a replicable and transparent framework to assess the depth and coherence of integration across countries and institutions.

2.2.2. Structure of the CCVI

The index consists of four dimensions, each scored on an ordinal 0–3 scale, allowing both descriptive and comparative analyses (Table 2):
  • Presence of climate change (0–3)—from absence (0) to extensive and in-depth development (3).
  • Presence of vegetation and biodiversity (0–3)—from absence (0) to central development with dedicated courses/activities (3).
  • Climate–vegetation connection (0–3)—from no relationship (0) to explicit and strong integration of both domains (3).
  • Eco-climatic teaching strategies (0–3)—from no mention of teaching strategies (0) to multiple active, experiential strategies clearly linked to climate and vegetation (3).

2.2.3. Development and Validation

The construction of the CCVI followed a content validation process. Draft descriptors for each dimension were developed based on the literature on environmental and science education (González Gaudiano & Meira Cartea, 2020; Monroe et al., 2019; Stagg & Dillon, 2023). These were then reviewed by experts in science didactics and climate education, who refined wording and provided examples. A pilot calibration was conducted on a subsample of curricula (~10–15%) to ensure clarity, reliability, and coder agreement, resulting in adjustments to anchors and coding guidelines.

2.2.4. Purpose and Applications

The CCVI serves three main purposes:
(a)
Analytical—to quantify and compare the integration of climate and vegetation in teacher education curricula across countries and institutions.
(b)
Diagnostic—to identify curricular gaps (e.g., presence of climate content but absence of vegetation, or lack of teaching strategies).
(c)
Transformative—to inform policy and practice by providing evidence-based recommendations for strengthening sustainability education in teacher preparation.

2.3. Coding Procedures, Reliability, and AI-Assisted Triangulation

All documents were coded using the CCVI through a structured and transparent process. Two trained raters independently applied the index to the full set of curricular documents, following a codebook with explicit descriptors and examples (see Table 2 and Supplementary Materials). Prior to full coding, a pilot calibration on approximately 10–15% of the corpus was conducted to refine anchors, clarify ambiguous cases, and ensure consistent application of criteria. Coders then analyzed the remaining documents independently and blindly (de Raadt et al., 2021). Disagreements were resolved through discussion, and persistent divergences were adjudicated by consensus with a third reviewer when necessary (Dong et al., 2024).
To ensure the robustness of the analysis, we calculated inter-rater reliability for each CCVI dimension. Given the ordinal scale (0–3), we employed quadratic-weighted Cohen’s κ and Krippendorff’s α (ordinal) as complementary statistics (McHugh, 2012). A priori, values ≥ 0.70 were established as the threshold for “substantial agreement.” During the main coding phase, κ values ranged between ~0.72 and 0.85, with α coefficients within a similar range, indicating substantial to near-perfect reliability (Marzi et al., 2024). Additionally, 10% of documents were double coded throughout the process to monitor stability over time.
As an additional safeguard, we implemented AI-assisted triangulation using large language models (ChatGPT model 5.0 by OpenAI and Gemini model 2.5 fast by Google and Copilot by Microsoft and Open AI model GPT4). The models were prompted with a standardised template aligned with CCVI descriptors, and their outputs were compared against human coders’ scores (Appendix A). Agreement was measured using weighted κ, yielding moderate to substantial levels (0.65–0.75). Importantly, human judgement always prevailed: AI results served only as a secondary check to identify potential inconsistencies or overlooked references. Guardrails included documenting model version, prompt structure, and date of application, and excluding AI outputs from final coding decisions (Liffiton et al., 2023). This triangulation strategy reduced cognitive load on coders and increased transparency, while maintaining the interpretive authority of the research team (Akheel, 2025).

2.4. Quantitative Statistical Analysis

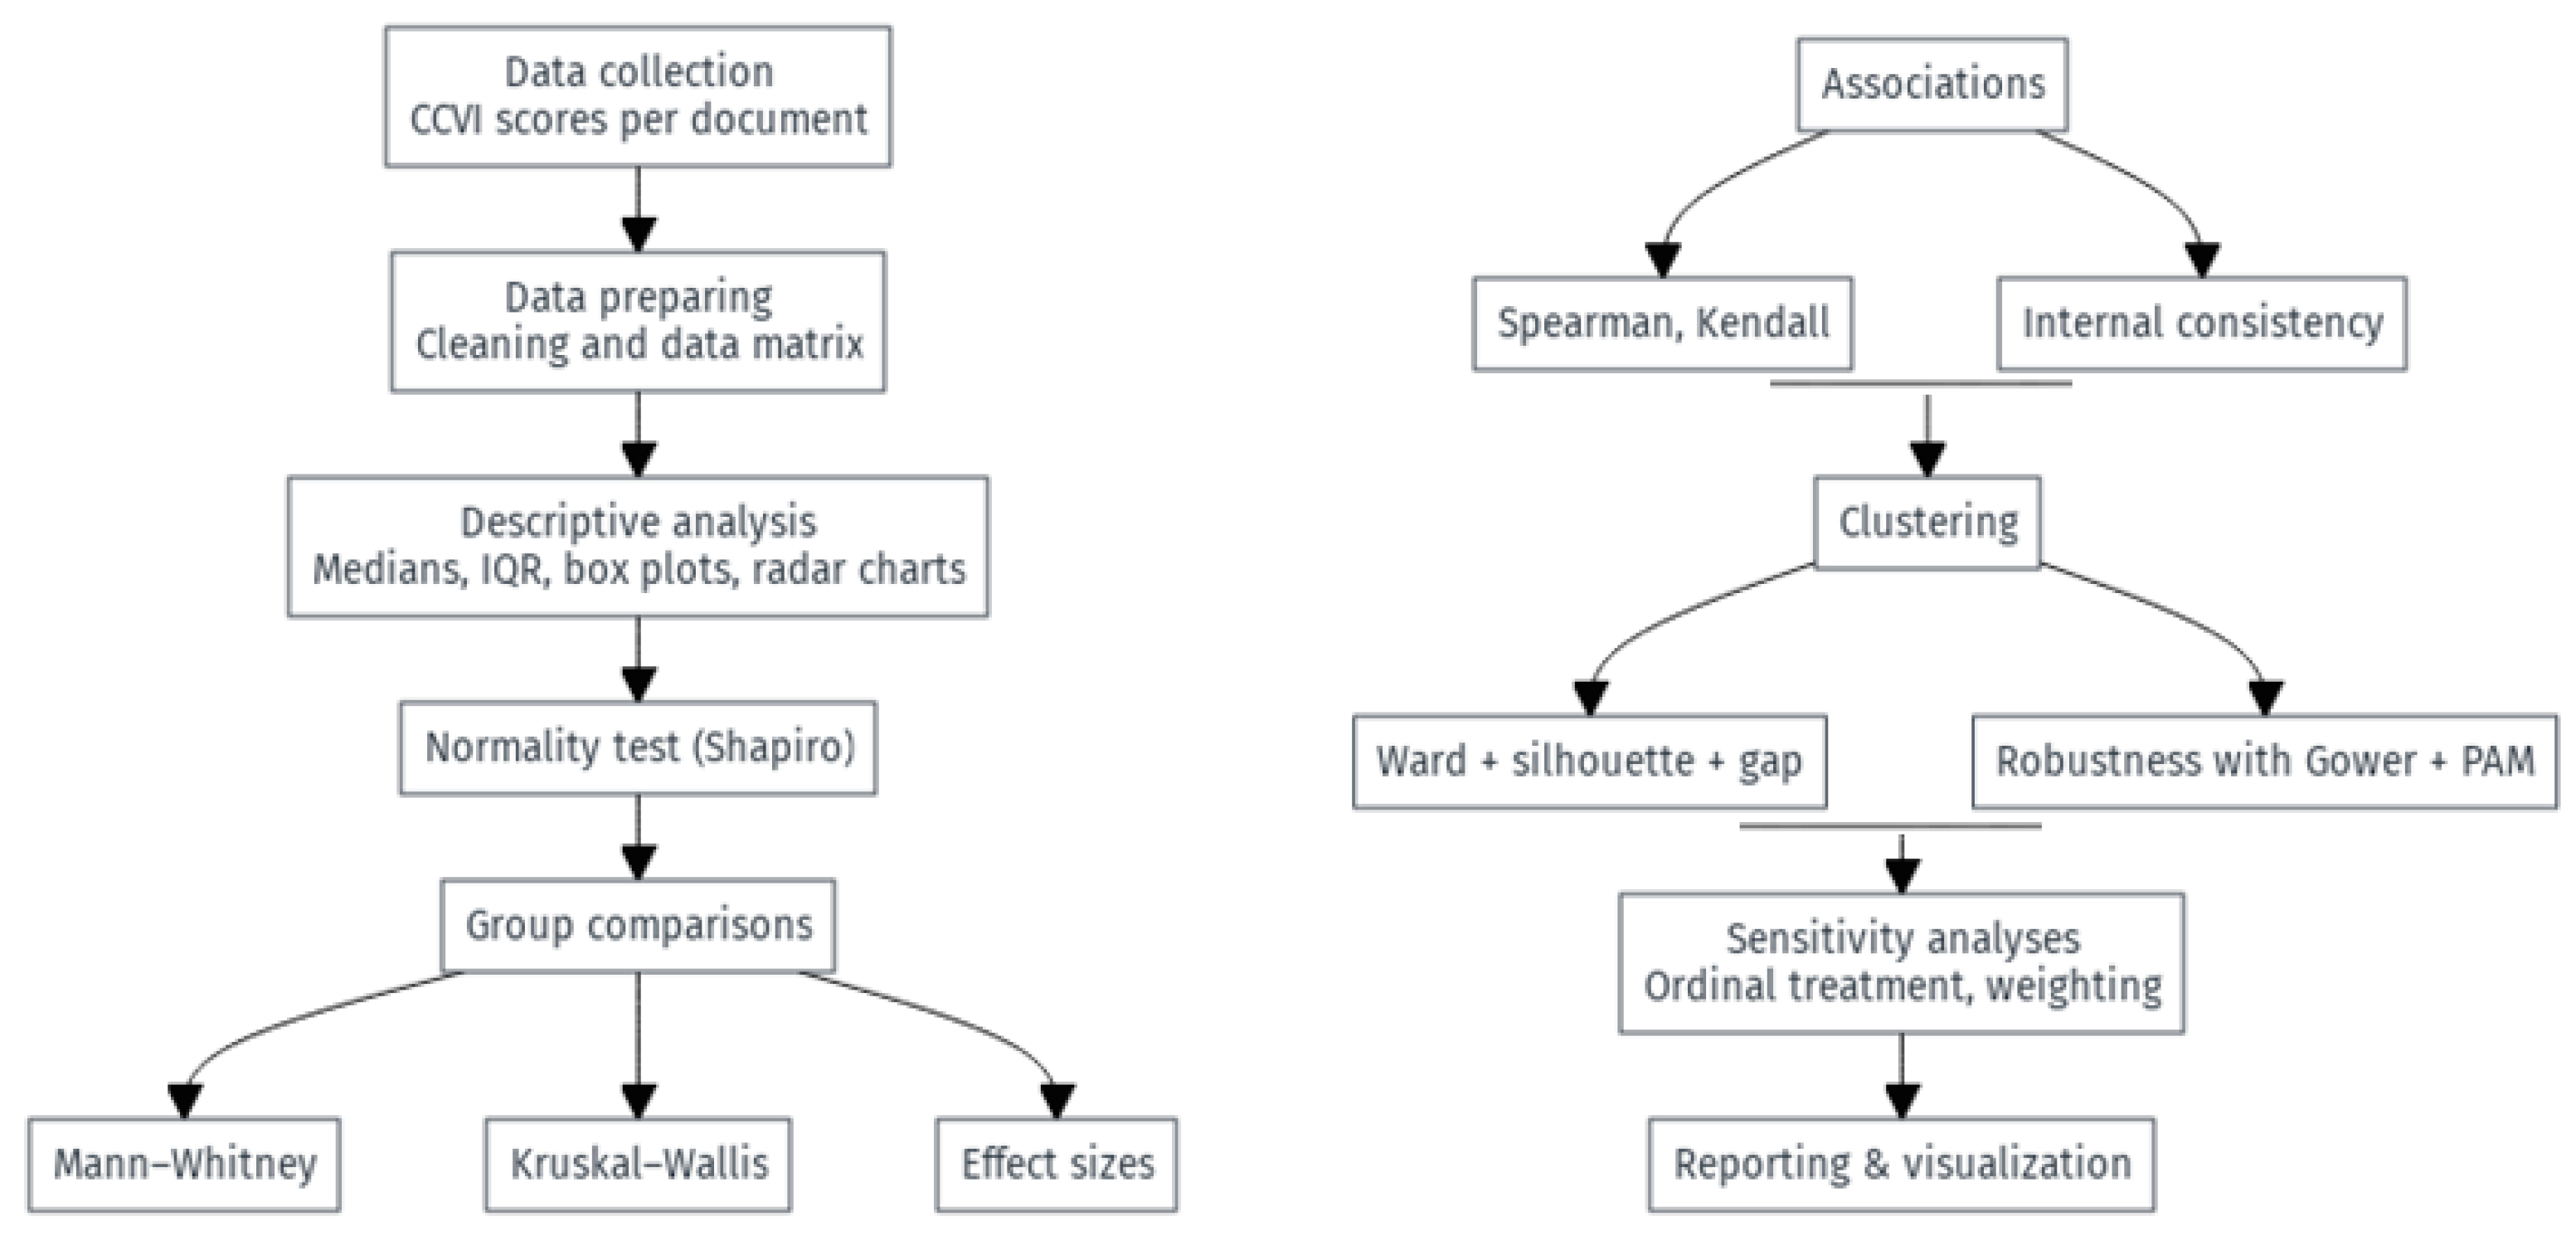
Data structure and preparation (Figure 2). CCVI ratings yield four ordinal scores (0–3) per document. We summarised each dimension with medians and inter-quartile ranges (IQR), and report means/SD only descriptively. For visualisation we used boxplots (dispersion), stacked bars (level distribution 0–3), and an average CCVI radar profile. Missing values (rare) were listwise-deleted for the affected comparison; sensitivity checks confirmed results were unchanged when using simple imputation (mode) per dimension.
Due to the CCVI scales are ordinal and often skewed, we relied on non-parametric procedures for group comparisons. Specifically, we compared two groups (e.g., core vs. validation samples) using Mann–Whitney U tests and three or more groups (e.g., country blocks) using Kruskal–Wallis H tests with tie corrections and Dunn post hoc tests where applicable (Mann & Whitney, 1947). We complemented all p-values with effect sizes appropriate for ordinal data, namely Vargha–Delaney’s A (a common-language effect size) and Cliff’s δ, both accompanied by 95% bootstrap confidence intervals. To control for multiple testing in multi-group and post hoc comparisons, we applied the Benjamini–Hochberg false discovery rate procedure with q = 0.05.
To examine associations among CCVI dimensions, we used Spearman’s ρ and Kendall’s τ-b rank correlations, which are suitable for ordinal variables and robust to ties. When exploring the internal consistency of composites, we estimated ordinal alpha from polychoric correlation matrices rather than relying on Pearson-based coefficients.
To identify curricular profiles, we first standardized the four CCVI dimensions and then conducted hierarchical clustering using Ward’s method with Euclidean distance. The number of clusters (k) was selected by combining two criteria: average silhouette width and gap statistics. We assessed the robustness of these solutions by repeating the analyses with Gower distance (suitable for mixed and ordinal data) and Partitioning Around Medoids (PAM) clustering, and we quantified agreement between alternative partitions using the Adjusted Rand Index (ARI). Cluster stability was further inspected via bootstrap resampling, computing Jaccard indices for cluster memberships.
We also carried out several sensitivity analyses. We re-estimated key comparisons by (i) treating the 0–3 scores as numeric versus strictly ordinal (rank-based), (ii) reweighting the dimensions (equal weights versus emphasizing the “connection” and “strategies” dimensions), and (iii) repeating the clustering with the Gower + PAM specification. Across these checks, the substantive conclusions remained unchanged (summarized in the Supplementary Materials).
In reporting, all inferential tests are presented with the corresponding test statistics, degrees of freedom where relevant, p-value, and effect size with confidence interval. For clustering analyses, we report the chosen number of clusters together with silhouette and gap values, a heatmap of standardized CCVI scores by cluster, and ARI values comparing alternative partitions. The methodological choices for non-parametric tests, ordinal effect sizes, multiple-testing control, cluster number selection, distance measures, robustness checks and partition comparison follow standard references for these procedures.
To perform the various statistical and graphical tests, the Python 3.11 programming language was used through its Jupyter Notebook environment, version 7.0.8, from Anaconda, version 2.6.0.

3. Results

3.1. Descriptive Overview

A total of 70 science teacher education curriculum documents from 26 countries were analyzed using the CCVI. Table 3 summarizes the descriptive statistics for the four dimensions—Climate change (CC), Vegetation/Biodiversity (VEG), Climate–vegetation connection (CON), and Eco-climatic teaching strategies (STRAT)—as well as the total CCVI score (range 0–12).
Overall, the total CCVI scores per document ranged from 1 to the maximum of 12, with a median of 6.0 (IQR = 4.0) and a mean of approximately 6.3. This distribution reflects substantial heterogeneity: while some programmes fully integrated all four dimensions (score = 12), others barely addressed them. On average, therefore, the CCVI profile indicates only a moderate level of integration, around half of the maximum possible score. Within this moderate profile, vegetation/biodiversity and eco-climatic teaching strategies obtained the highest ratings (median = 2.0; mean ≈ 2.0), whereas climate change and climate–vegetation connection displayed consistently lower values (median = 1.0; mean ≈ 1.0), revealing a stronger emphasis on biodiversity content and pedagogical strategies than on climate change or explicit climate–vegetation linkages.
Table 4 shows the average and others descriptives statistics of the CCVI score by country, broken down by dimension and total. There are differences between countries in the degree to which these topics are integrated into teacher training. For example, countries such as Finland (total average ≈10.0) and Germany (≈9.0) have high averages, indicating that their training programs extensively incorporate the four aspects evaluated. Likewise, some countries in the validation group with only one to four documents analysed—such as Mexico, Norway, and Switzerland—achieved the maximum score (Total = 12.0) in some of their respective curricula. In contrast, countries such as India (total average ≈3.5) and Algeria (≈4.0) show much lower averages, reflecting a limited presence of climate change and vegetation in their programs. In general, most countries fall within the average values of the index (Total ~6–8). It should be noted that internal variability is also important: in countries with several documents analyzed (e.g., Argentina, Australia, Canada), scores may fluctuate, but the national average provides an overview of the level of integration in that context.
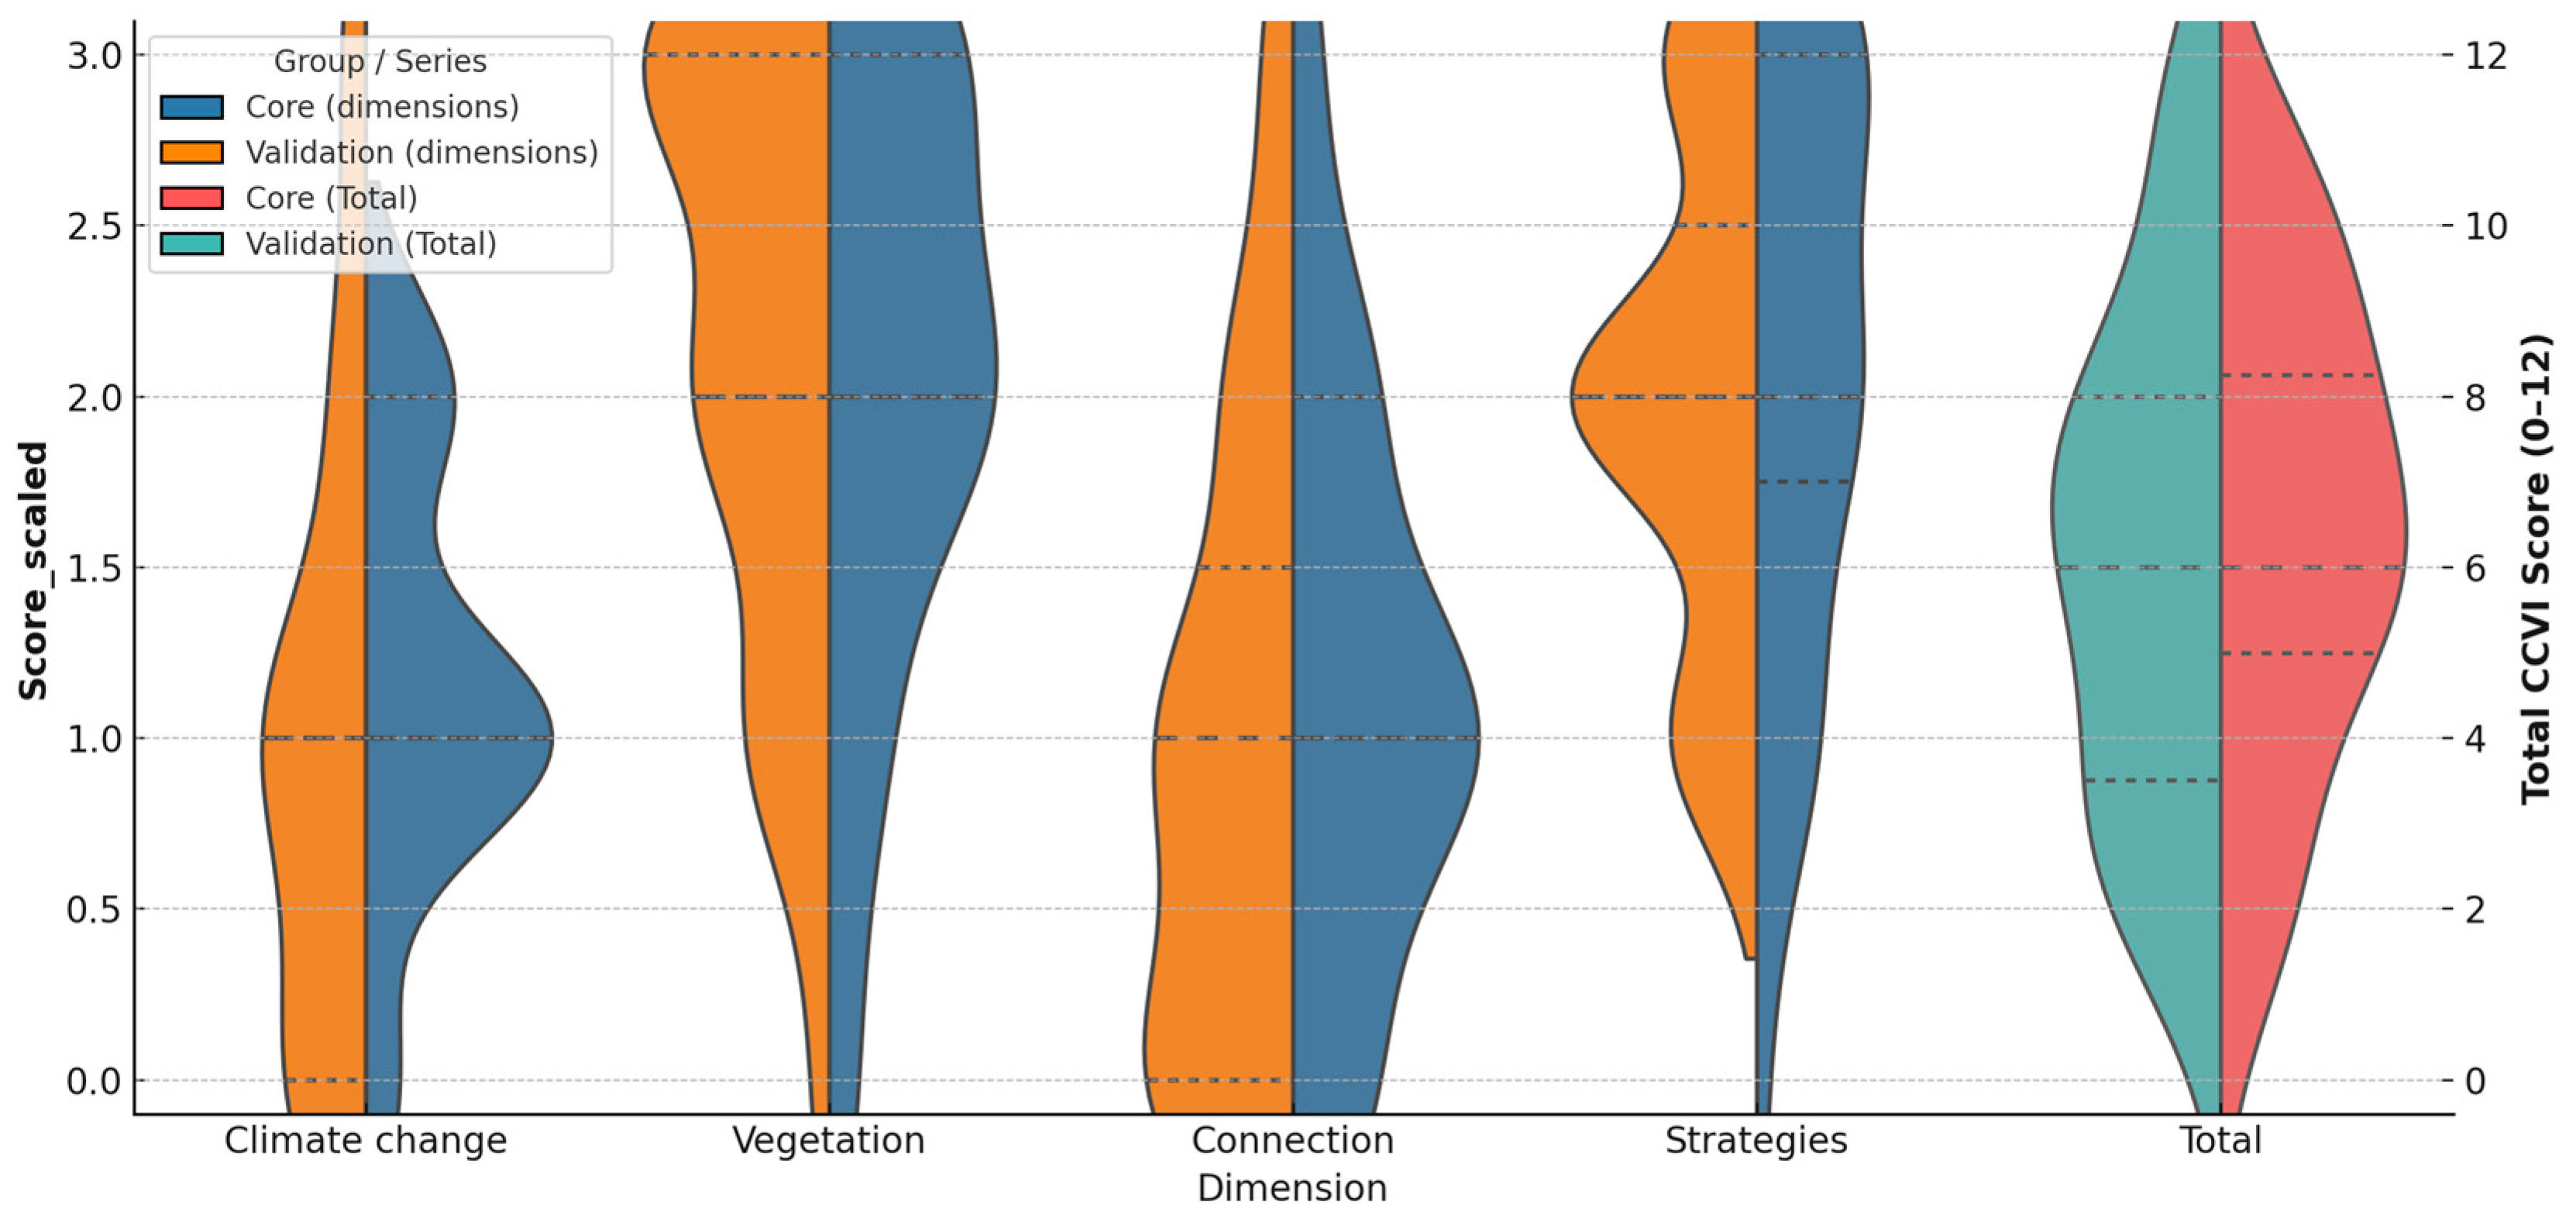
To assess possible biases or systematic differences, the distributions of scores were compared between the countries in the ‘Core’ group (the ten countries focused on in the initial study: Spain, Finland, Germany, Italy, Denmark, the United Kingdom, the United States, Australia, Brazil and South Korea) and the countries in the ‘Validation’ group (the rest). Figure 3 shows the violin plots of the scores in each dimension, differentiating between the two groups of countries. In general, there are no significant differences in the distribution of scores between the Core and Validation groups. The medians for the dimensions of climate change, connection and strategies are practically the same in both groups (approximately 1.0, 1.0 and 2.0, respectively). The dispersion of the scores is also similar, with the interquartile ranges of Core and Validation overlapping extensively (Figure 1). Only in the vegetation/biodiversity dimension is there a slight tendency towards higher values in the Validation group: the median in Validation countries reached a maximum value of 3.0, while in the Core group it was 2.0, and the Validation distribution was more concentrated at the high end (many documents scored 3 in this dimension). Despite this, both groups share similar patterns: for example, in both of them there are cases of documents with very low (0) or maximum (3) scores in each dimension, indicating that the internal variability within each group is greater than the differences between groups. As for the total CCVI scores, these also show a comparable distribution between Core and Validation (medians ~6 in Core vs. ~7 in Validation; wide ranges from 1 to 12 in both cases), reinforcing the idea that the level of integration of climate change and vegetation in teacher training is heterogeneous in all the countries analyzed, with no marked distinction between the groups considered.
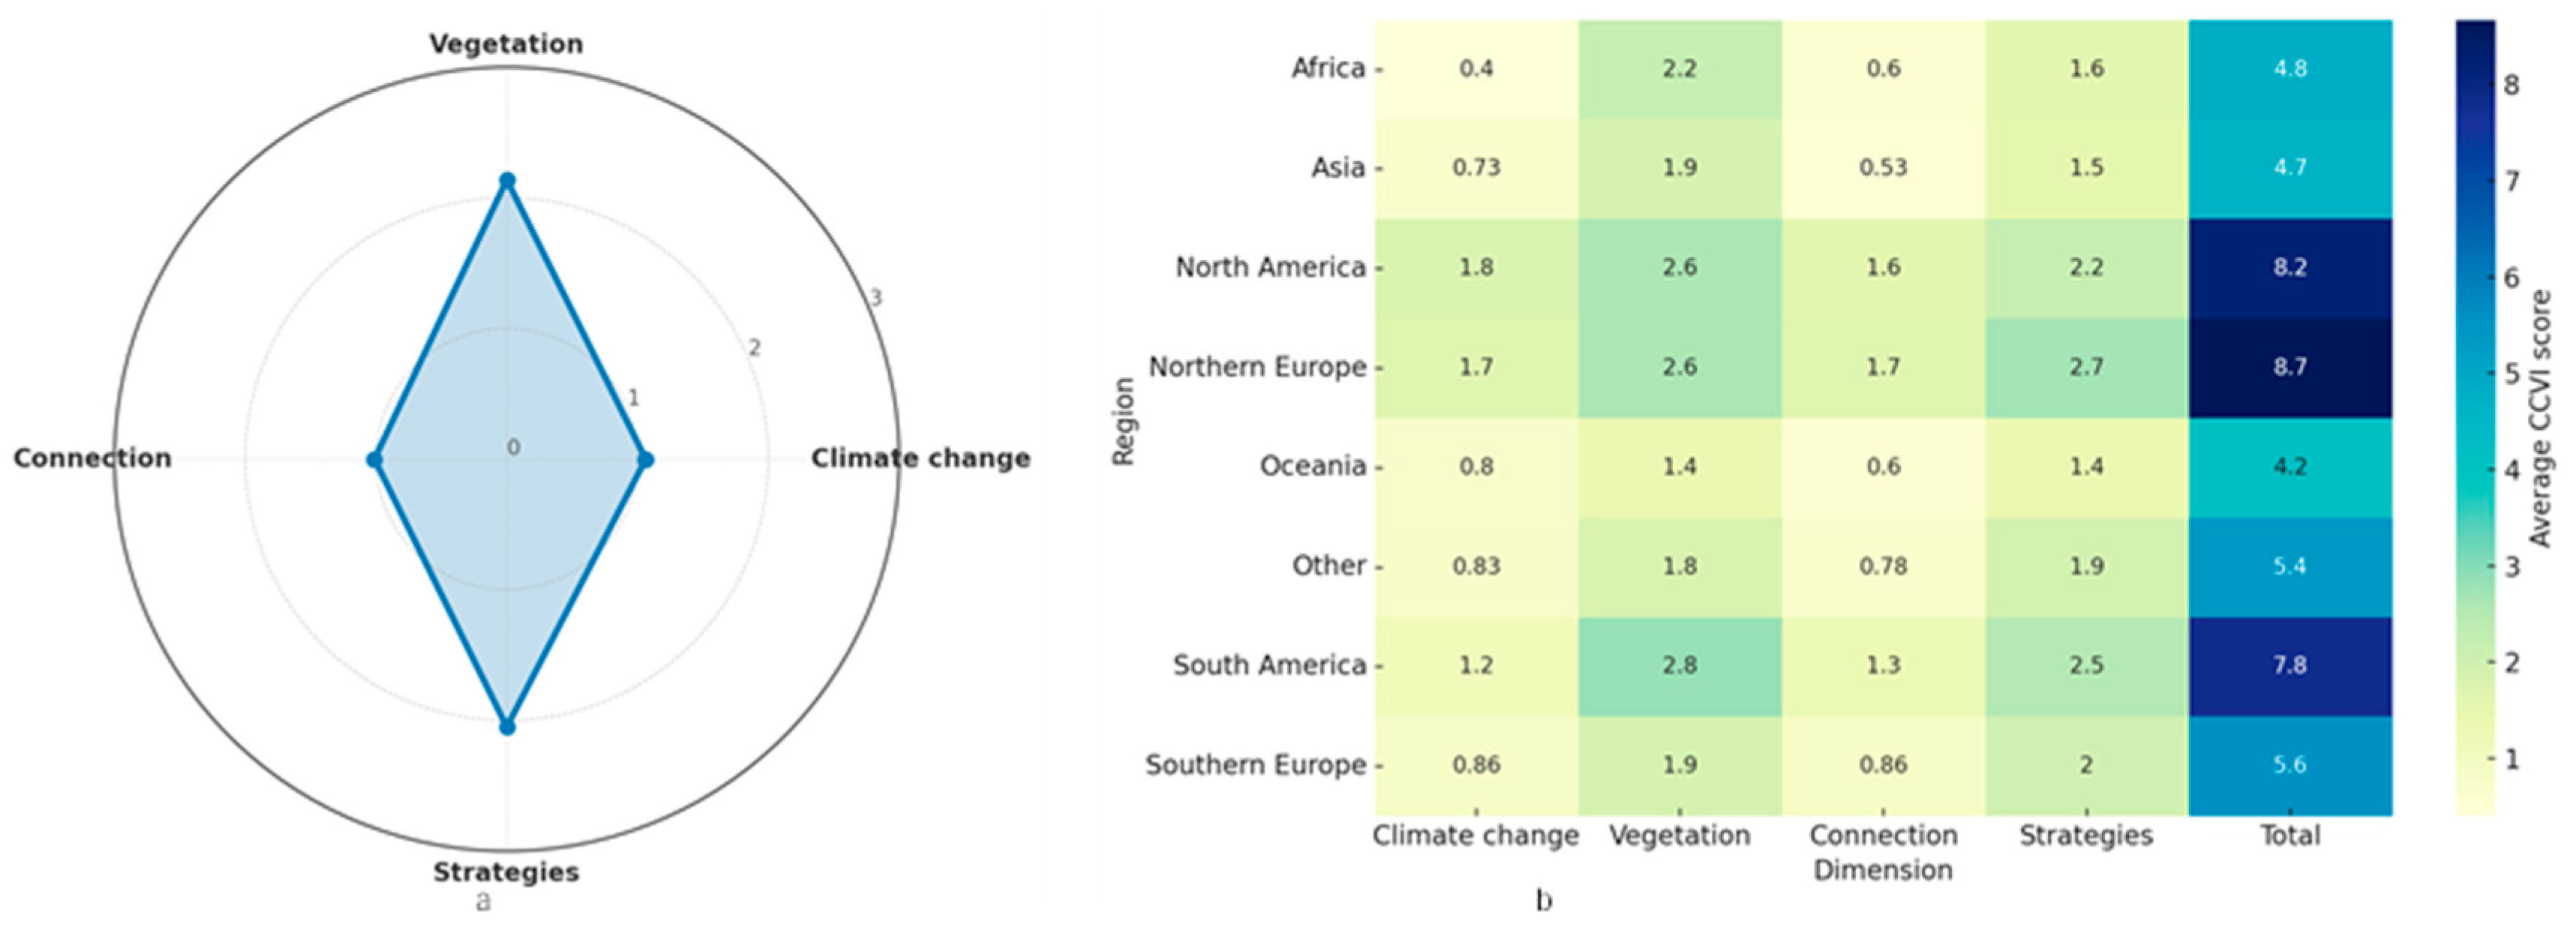
Finally, an average CCVI profile was constructed considering all documents. Figure 4a shows this profile in a radar chart, where each axis corresponds to a dimension of the index and the radial scale ranges from 0 (absence in all documents) to 3 (maximum presence in all documents) and distribution by major regions (Figure 4b).
This graph corroborates the previous findings: the dimensions of vegetation/biodiversity and strategies achieve the highest average values (both ~2 out of 3), while climate change and connection remain at lower values (~1 out of 3). Overall, the shape of the radar is unbalanced towards the dimensions of vegetation and strategies, indicating that, on average, teacher training programs more frequently incorporate biodiversity content and eco-climatic teaching proposals, but tend to include explicit aspects of climate change and the systemic connection between climate and vegetation less regularly. This quantitative characterization provides an overview of the strengths and gaps in the integration of socio-ecological issues into science teacher training, serving as a basis for discussions on where to focus efforts for curriculum improvement.

3.2. Core vs. Validation

To examine the robustness of the CCVI across contexts, we compared the set of documents from the Core group (10 countries, n = 37 curricula) with those from the Validation group (16 countries, n = 33 curricula). Descriptive statistics for each CCVI dimension and for the total score are presented in Table 3, while inferential results from the Mann–Whitney U tests with effect sizes are summarized in Table 5. The distribution of scores is further illustrated in Figure 3.
Overall, the descriptive profiles of the two groups were highly similar. Both Core and Validation sets presented median values of 1.0 for Climate change (CC), 1.0 for Climate–vegetation connection (CON), and 2.0 for Eco-climatic teaching strategies (STRAT). The Vegetation/Biodiversity (VEG) dimension showed a slight difference: while the median remained 2.0 in both groups, the interquartile range was narrower and concentrated at the upper end (2–3) in the Validation group, compared to a wider spread (1–3) in the Core group. For the total CCVI score, medians were identical (6.0) with overlapping IQRs (Core = 3–8; Validation = 4–8), confirming comparable levels of integration across groups.
Inferential analyses supported these descriptive observations. As shown in Table 5, none of the Mann–Whitney U tests reached statistical significance after controlling for multiple comparisons using the Benjamini–Hochberg FDR correction (q = 0.05). The only contrast approaching significance was for the Vegetation/Biodiversity dimension (U = 464.5, p_raw = 0.067; p_FDR = 0.335), where Validation documents tended to score higher. However, the corresponding effect size was small (Cliff’s δ = −0.239, 95% CI [−0.477, 0.007]), and the confidence interval included zero, indicating that the observed trend is not robust. For all other dimensions (CC, CON, STRAT) and for the total CCVI score, group differences were negligible (all |δ| < 0.10) with confidence intervals consistently overlapping zero.
The violin plots in Figure 3 confirm these findings visually. Both groups display wide internal variability, with documents ranging from the lowest to the maximum scores across dimensions. Importantly, the extent of within-group heterogeneity was greater than the differences observed between groups. For instance, in both Core and Validation samples, some curricula completely omitted climate change or vegetation (score = 0), while others achieved the maximum integration (score = 3). This overlap underscores that national or institutional contexts within each group vary more strongly than the average contrast between Core and Validation.
Taken together, the results indicate that the CCVI performs consistently across both groups. Despite geographical and institutional differences, the index produced comparable profiles, suggesting that the integration of climate change and vegetation into science teacher education curricula is heterogeneous worldwide, but not systematically higher in either Core or Validation countries. This supports the external validity of the CCVI and its suitability for cross-national analyses.
In summary, no statistically significant differences emerged between Core and Validation groups across any CCVI dimension or in the overall index. The slight tendency toward higher vegetation scores in the Validation group was small and non-robust. These findings confirm that the CCVI yields stable results across diverse contexts, reinforcing both its external validity and the conclusion that heterogeneity arises primarily within countries rather than between groups.

3.3. Country Patterns

The country-level analysis revealed substantial heterogeneity in the integration of climate change and vegetation across the 26 national contexts examined. Table 4 provides descriptive statistics by country, while Figure 5 and Figure 6 illustrate regional and EU/non-EU comparisons.
At the national level, contrasts were marked. Finland (median Total CCVI = 10.0) and Germany (9.0) stood out as consistent high performers, with robust integration of all four CCVI dimensions. Mexico, Norway, and Switzerland also reached the maximum possible score in at least one curriculum (Total = 12), indicating full incorporation of climate, vegetation, their interconnection, and teaching strategies. In contrast, India (median Total = 3.5), Japan (2.0), Algeria (4.0), and Ukraine (3.0) recorded some of the lowest averages, reflecting limited curricular attention. Most countries fell into an intermediate range (Total CCVI ≈ 6–8), confirming a heterogeneous but balanced global profile.
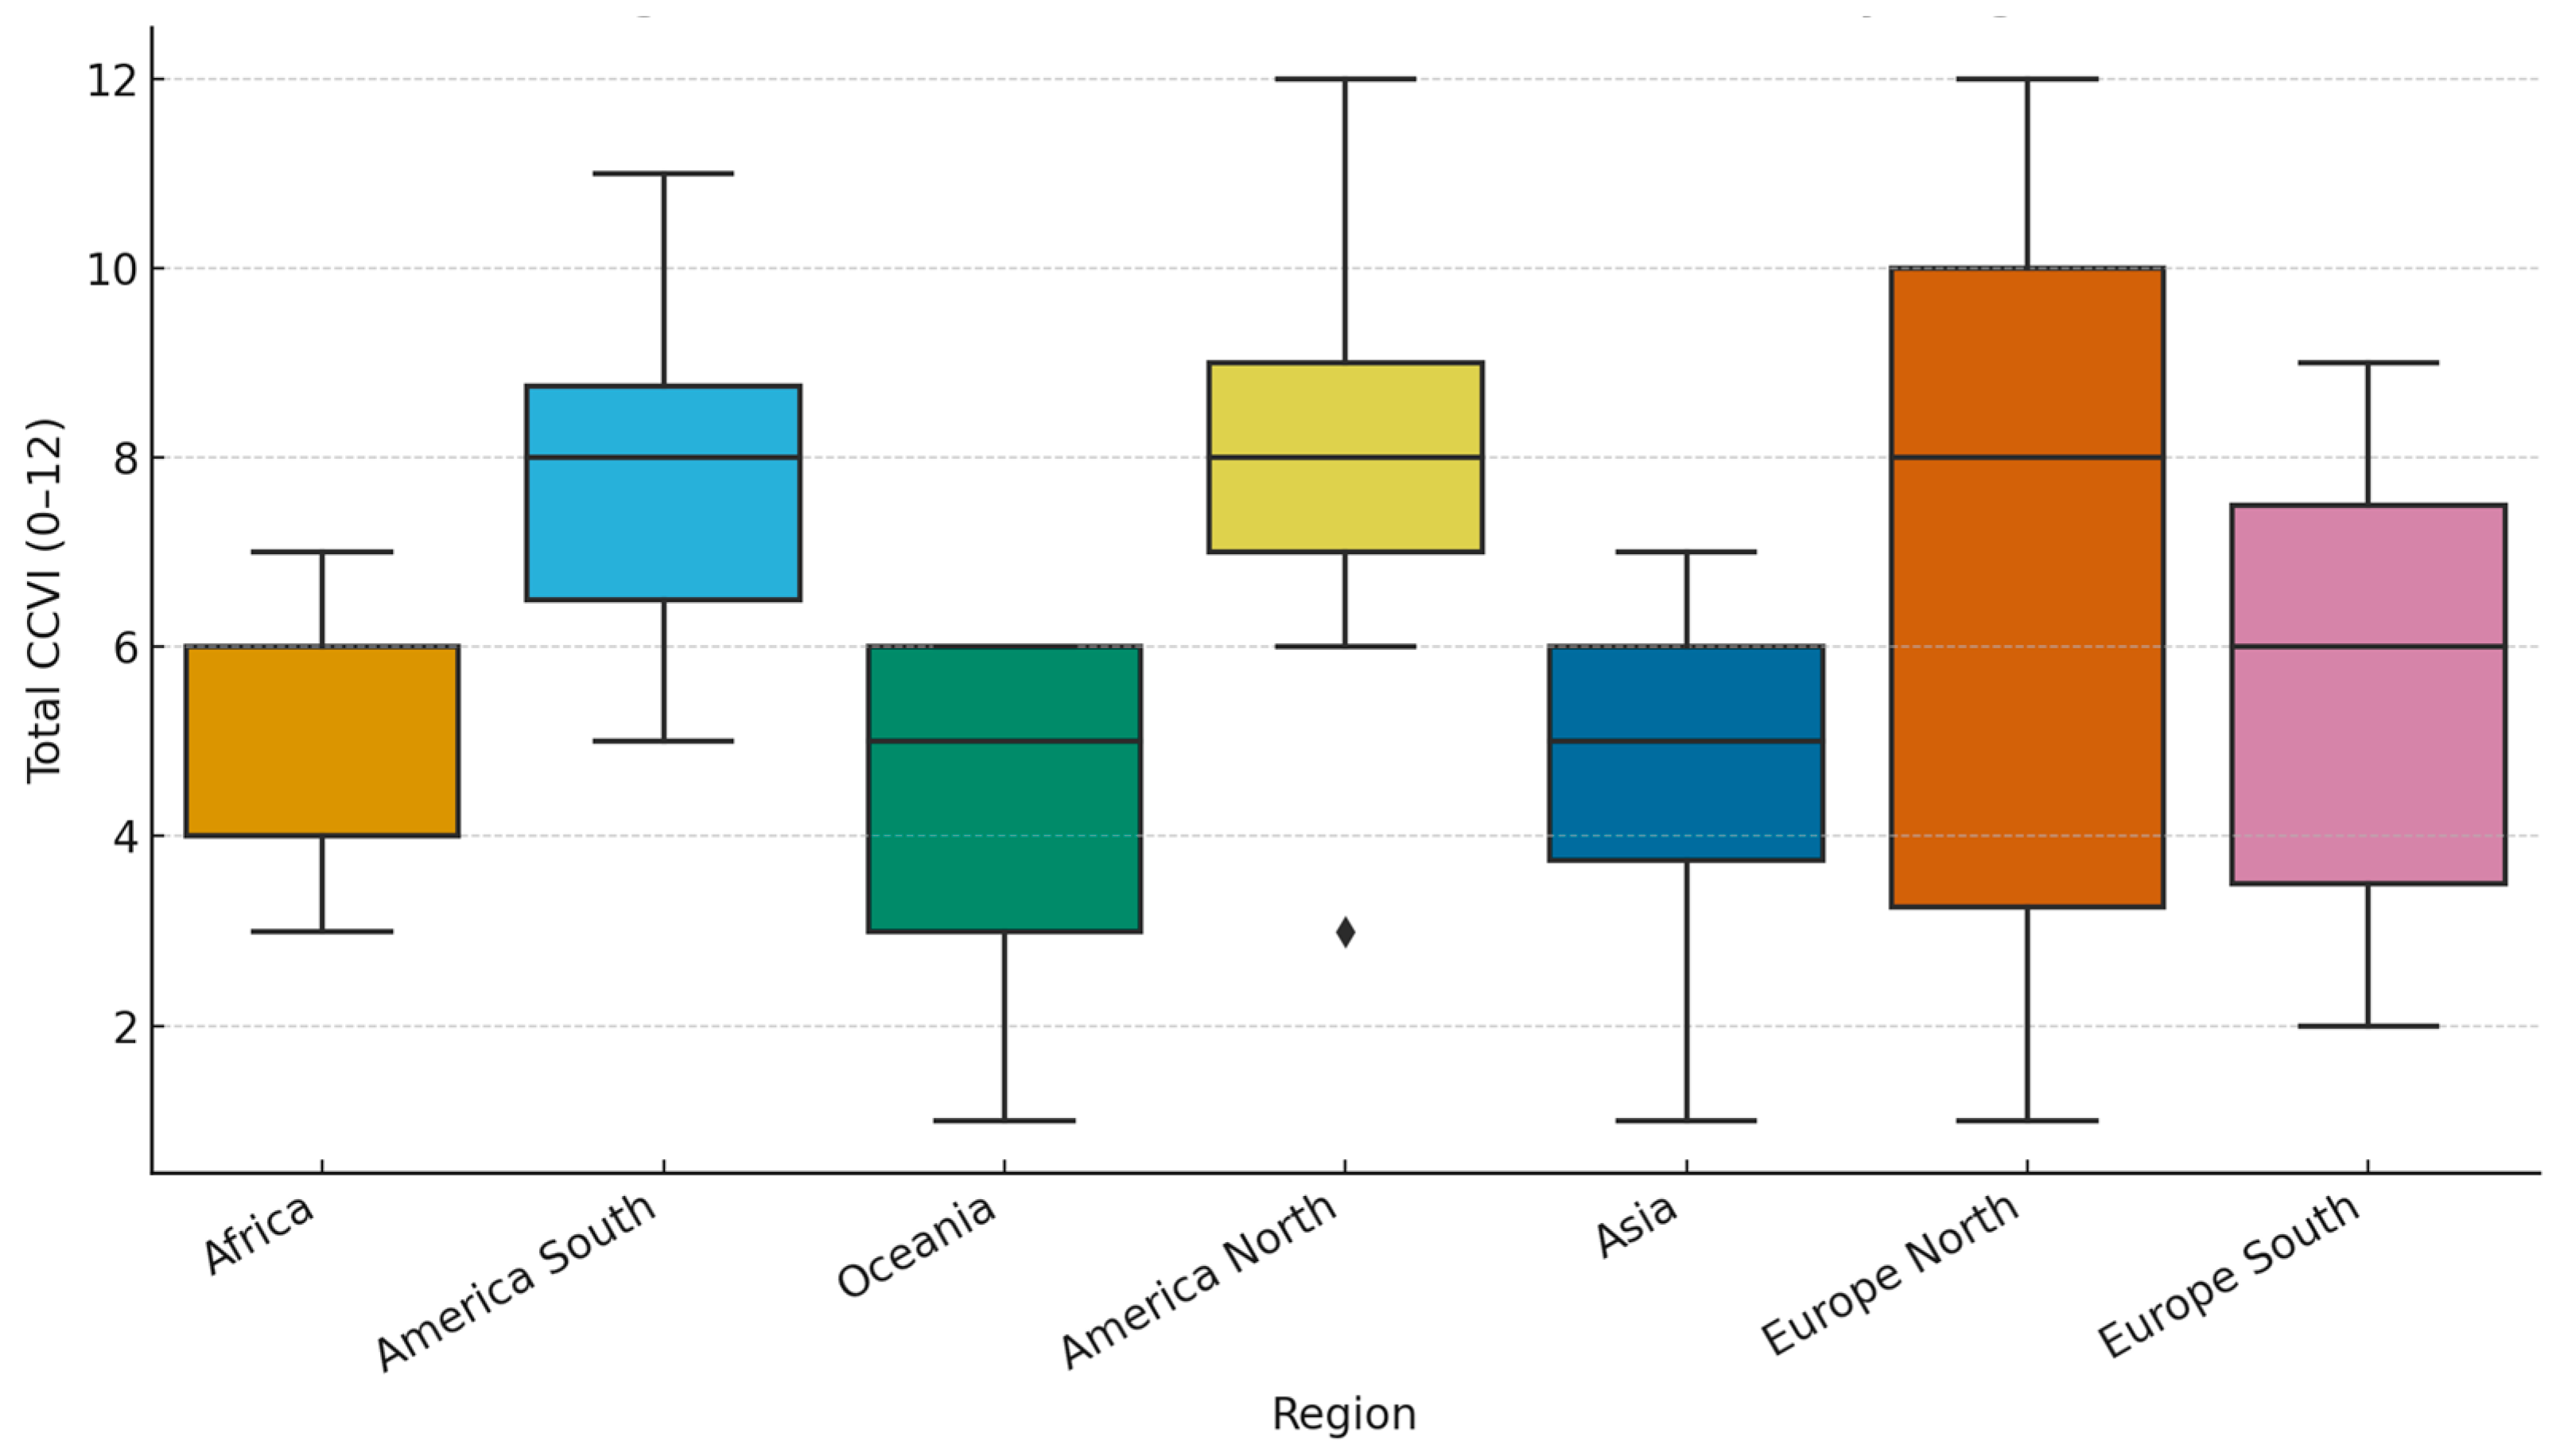
When grouping the 70 curricula by major geographical regions, statistically significant variation emerged for several CCVI dimensions. Kruskal–Wallis tests confirmed differences across regions for the Total CCVI score, as well as for climate–vegetation connection (CON) and eco-climatic teaching strategies (STRAT) (Table 6). Post hoc comparisons using Dunn-type pairwise tests with FDR correction (Table 7) showed that Northern Europe (Finland, Germany, Denmark, Norway, Poland, Ireland, United Kingdom, Switzerland) consistently outperformed Asia (China, India, Japan, South Korea, Ukraine) and Africa (Algeria, Morocco, South Africa, Kenya) in both Total and STRAT. Northern Europe also scored significantly higher than Southern Europe (Spain, Italy) in CON, although other differences within Europe were not significant after correction.
The median Total CCVI for Northern Europe was in the upper range (≈9–10), compared with Africa and Asia, where medians rarely exceeded 4–6. Southern Europe occupied an intermediate position, usually above Africa and Asia but below the Northern European cluster. In the Americas, contrasts were also notable: Mexico (12) and Brazil (8.3) presented strong integration, while Argentina (7.3) and the United States of America (7.3) scored moderately, producing high internal variability within the continent. Oceania (Australia, New Zealand) showed intermediate values (≈6.0), with relatively strong emphasis on vegetation and teaching strategies but weaker climate–vegetation connections. These findings are illustrated in Figure 5, where overlapping distributions nonetheless highlight the relative advantage of Northern Europe compared to Africa and Asia.
At the continental level, a clear gradient emerged. Europe, particularly Northern Europe, consistently achieved the highest CCVI scores. Oceania and the Americas followed, but with strong internal contrasts—Mexico ranking among the highest worldwide, while Argentina and parts of North America remained closer to the average. Africa and Asia systematically recorded the lowest scores, rarely exceeding the mid-range of the scale. These continental differences were statistically supported by the Kruskal–Wallis and Dunn tests and are graphically evident in Figure 5.
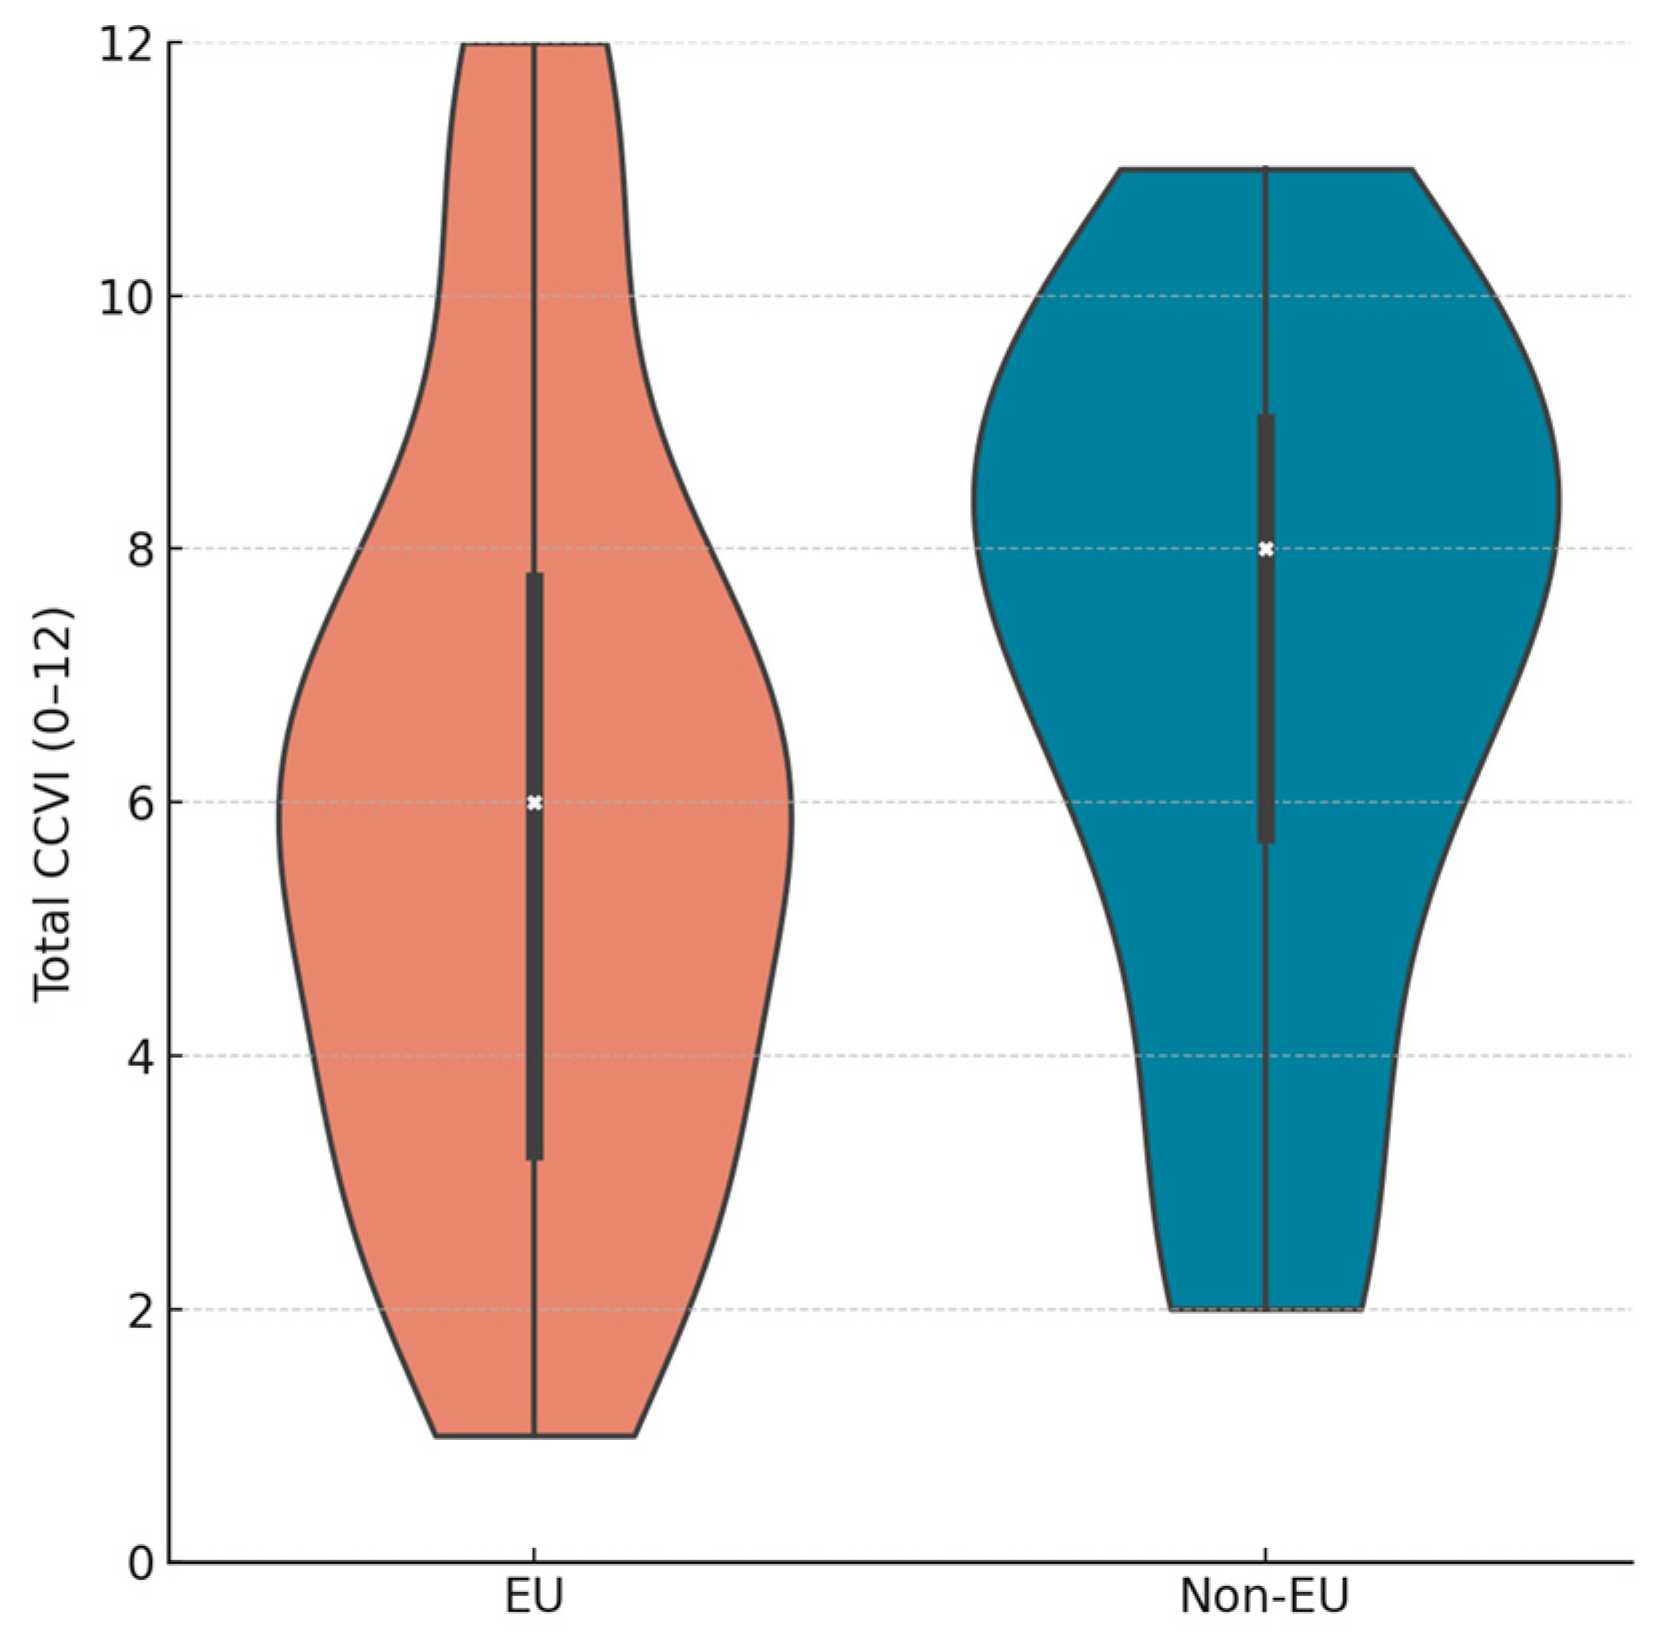
Descriptive statistics showed that EU countries tended to score slightly higher in vegetation and eco-climatic teaching strategies, while non-EU cases covered the widest range of outcomes, from the lowest scores (India, Japan, Algeria) to the highest (Mexico, Norway, Switzerland).
Inferential analyses confirmed one statistically significant difference after FDR correction: the eco-climatic teaching strategies (STRAT) dimension was higher among EU programs (U = 685.5, p_raw = 0.010; p_FDR = 0.050). The corresponding effect size was small-to-moderate (Cliff’s δ = –0.371, 95% CI [–0.610, –0.107]), indicating that EU programs placed somewhat greater emphasis on teaching strategies than their non-EU counterparts. For all other dimensions (Climate change, Vegetation/Biodiversity, Climate–vegetation connection) and for the Total CCVI score, the contrasts were not statistically significant after FDR adjustment (p_FDR ≥ 0.10).
The violin plots in Figure 6 illustrate these findings: EU scores ranged from 2 to 12, while non-EU scores spanned the full scale (1–12). Despite this broader variability, both groups shared the same central tendency (median Total = 6.0), and their distributions overlapped extensively. Thus, while EU countries appear to emphasize pedagogical strategies somewhat more consistently, the overall level of integration is not systematically determined by EU membership.
In sum, the country- and region-level analyses confirm that the CCVI captures meaningful heterogeneity across contexts. While a subset of countries (Finland, Germany, Mexico, Norway, Switzerland) represent high-integration models, most systems exhibit only moderate incorporation, and several remain weak. The evidence underscores that curricular integration of climate change and vegetation in teacher education is shaped less by geography or EU membership than by the strength of national curricular frameworks and policy commitments.

3.4. Relationships Between Dimensions

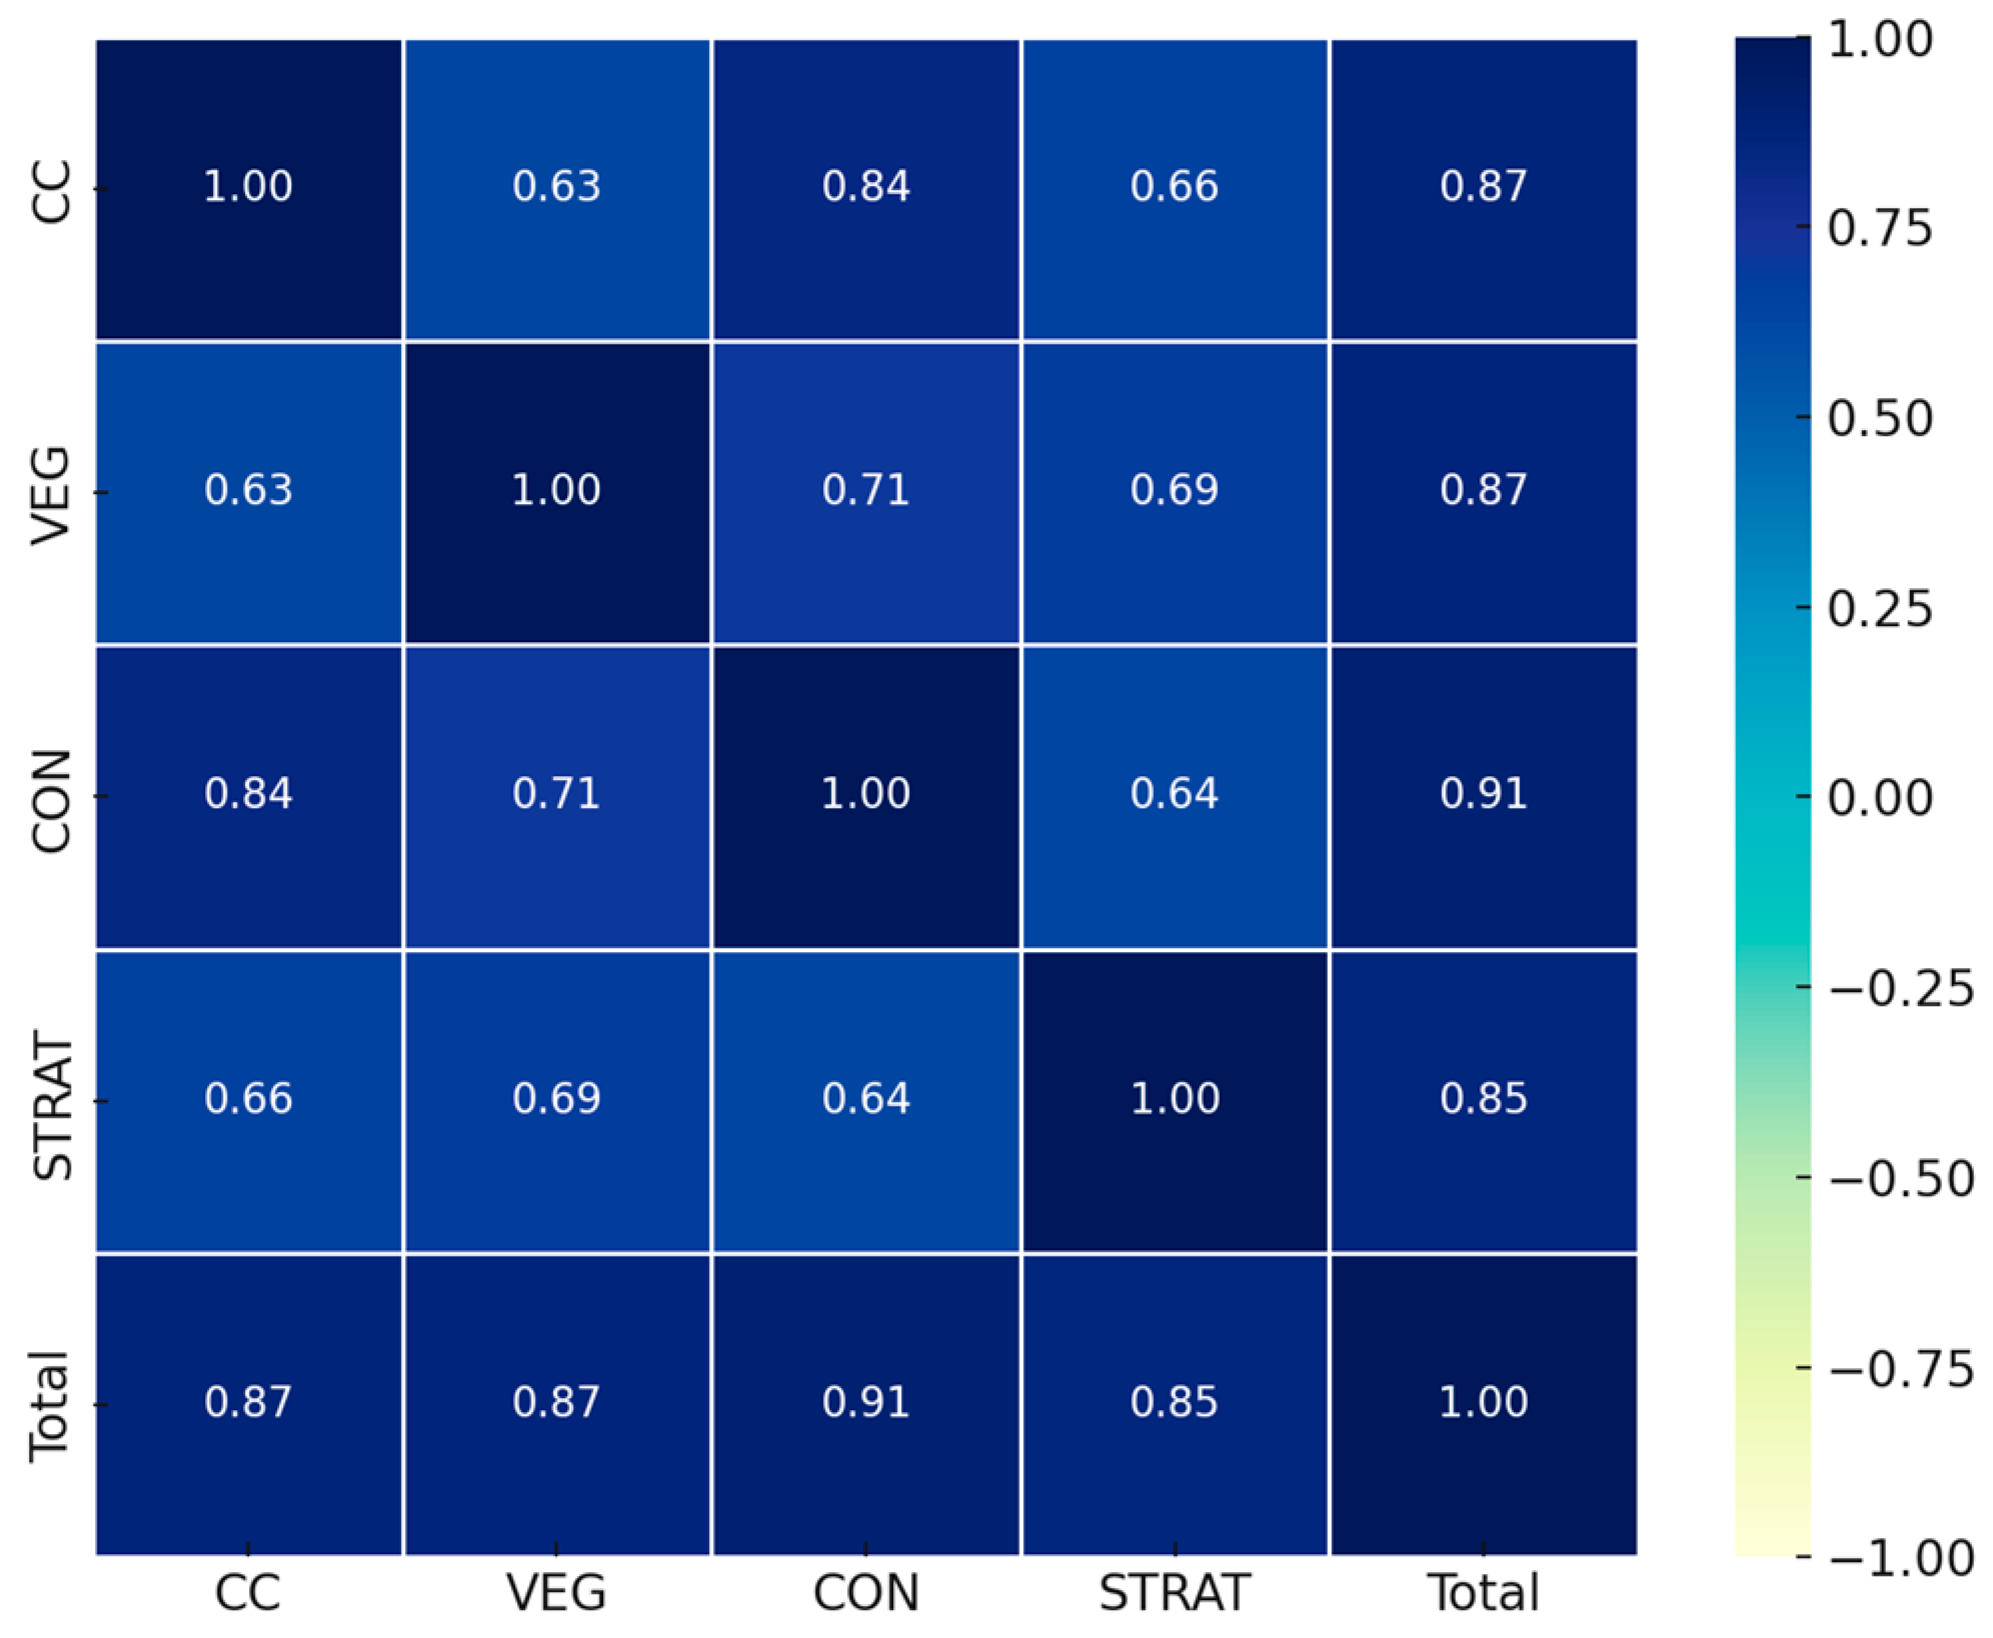
The four CCVI dimensions were strongly interrelated, confirming that they capture related aspects of curricular integration. Table 8 presents Spearman correlations among the dimensions and with the Total score, while Figure 7 visualizes these associations. All coefficients were positive and statistically significant after FDR correction (p < 0.001 in all cases). The strongest relationships were between Climate change (CC) and Climate–Vegetation Connection (CON) (ρ = 0.848) and between each dimension and the Total score (ρ = 0.859–0.904). The weakest, though still substantial, association was between CC and Vegetation/Biodiversity (VEG) (ρ = 0.638). Other notable links included VEG–STRAT (ρ = 0.695) and CON–STRAT (ρ = 0.649), indicating that teaching strategies are more closely aligned with biodiversity and connection content than with climate change per se.
To illustrate these patterns, the VEG–CC panel (ρ = 0.638) highlights that programmes strong in biodiversity content do not always address climate change explicitly. Conversely, the STRAT–CON panel (ρ = 0.649) demonstrates that curricula emphasising eco-climatic teaching strategies are also more likely to highlight the link between climate and vegetation. Across all six pairwise comparisons, the positive direction of the associations confirms that the four dimensions reinforce each other rather than acting independently.
Internal consistency analyses further supported the coherence of the CCVI. Cronbach’s α across the four dimensions was 0.893, which is considered high and indicates strong reliability of the composite index. Item–total correlations were all robust (CC = 0.808, VEG = 0.762, CON = 0.830, STRAT = 0.743), and the “alpha if item deleted” values remained close to the overall α, showing that no single dimension disproportionately influenced the reliability. This demonstrates that the four dimensions together form a stable and balanced construction.
In summary, the results confirm that the CCVI dimensions are highly correlated yet complementary, with biodiversity and teaching strategies most closely aligned, and climate change content more variably connected. The high internal consistency (α = 0.893) validates the CCVI as a coherent and reliable measure of how climate change and vegetation are integrated into teacher education curricula.

3.5. Curricular Profiles

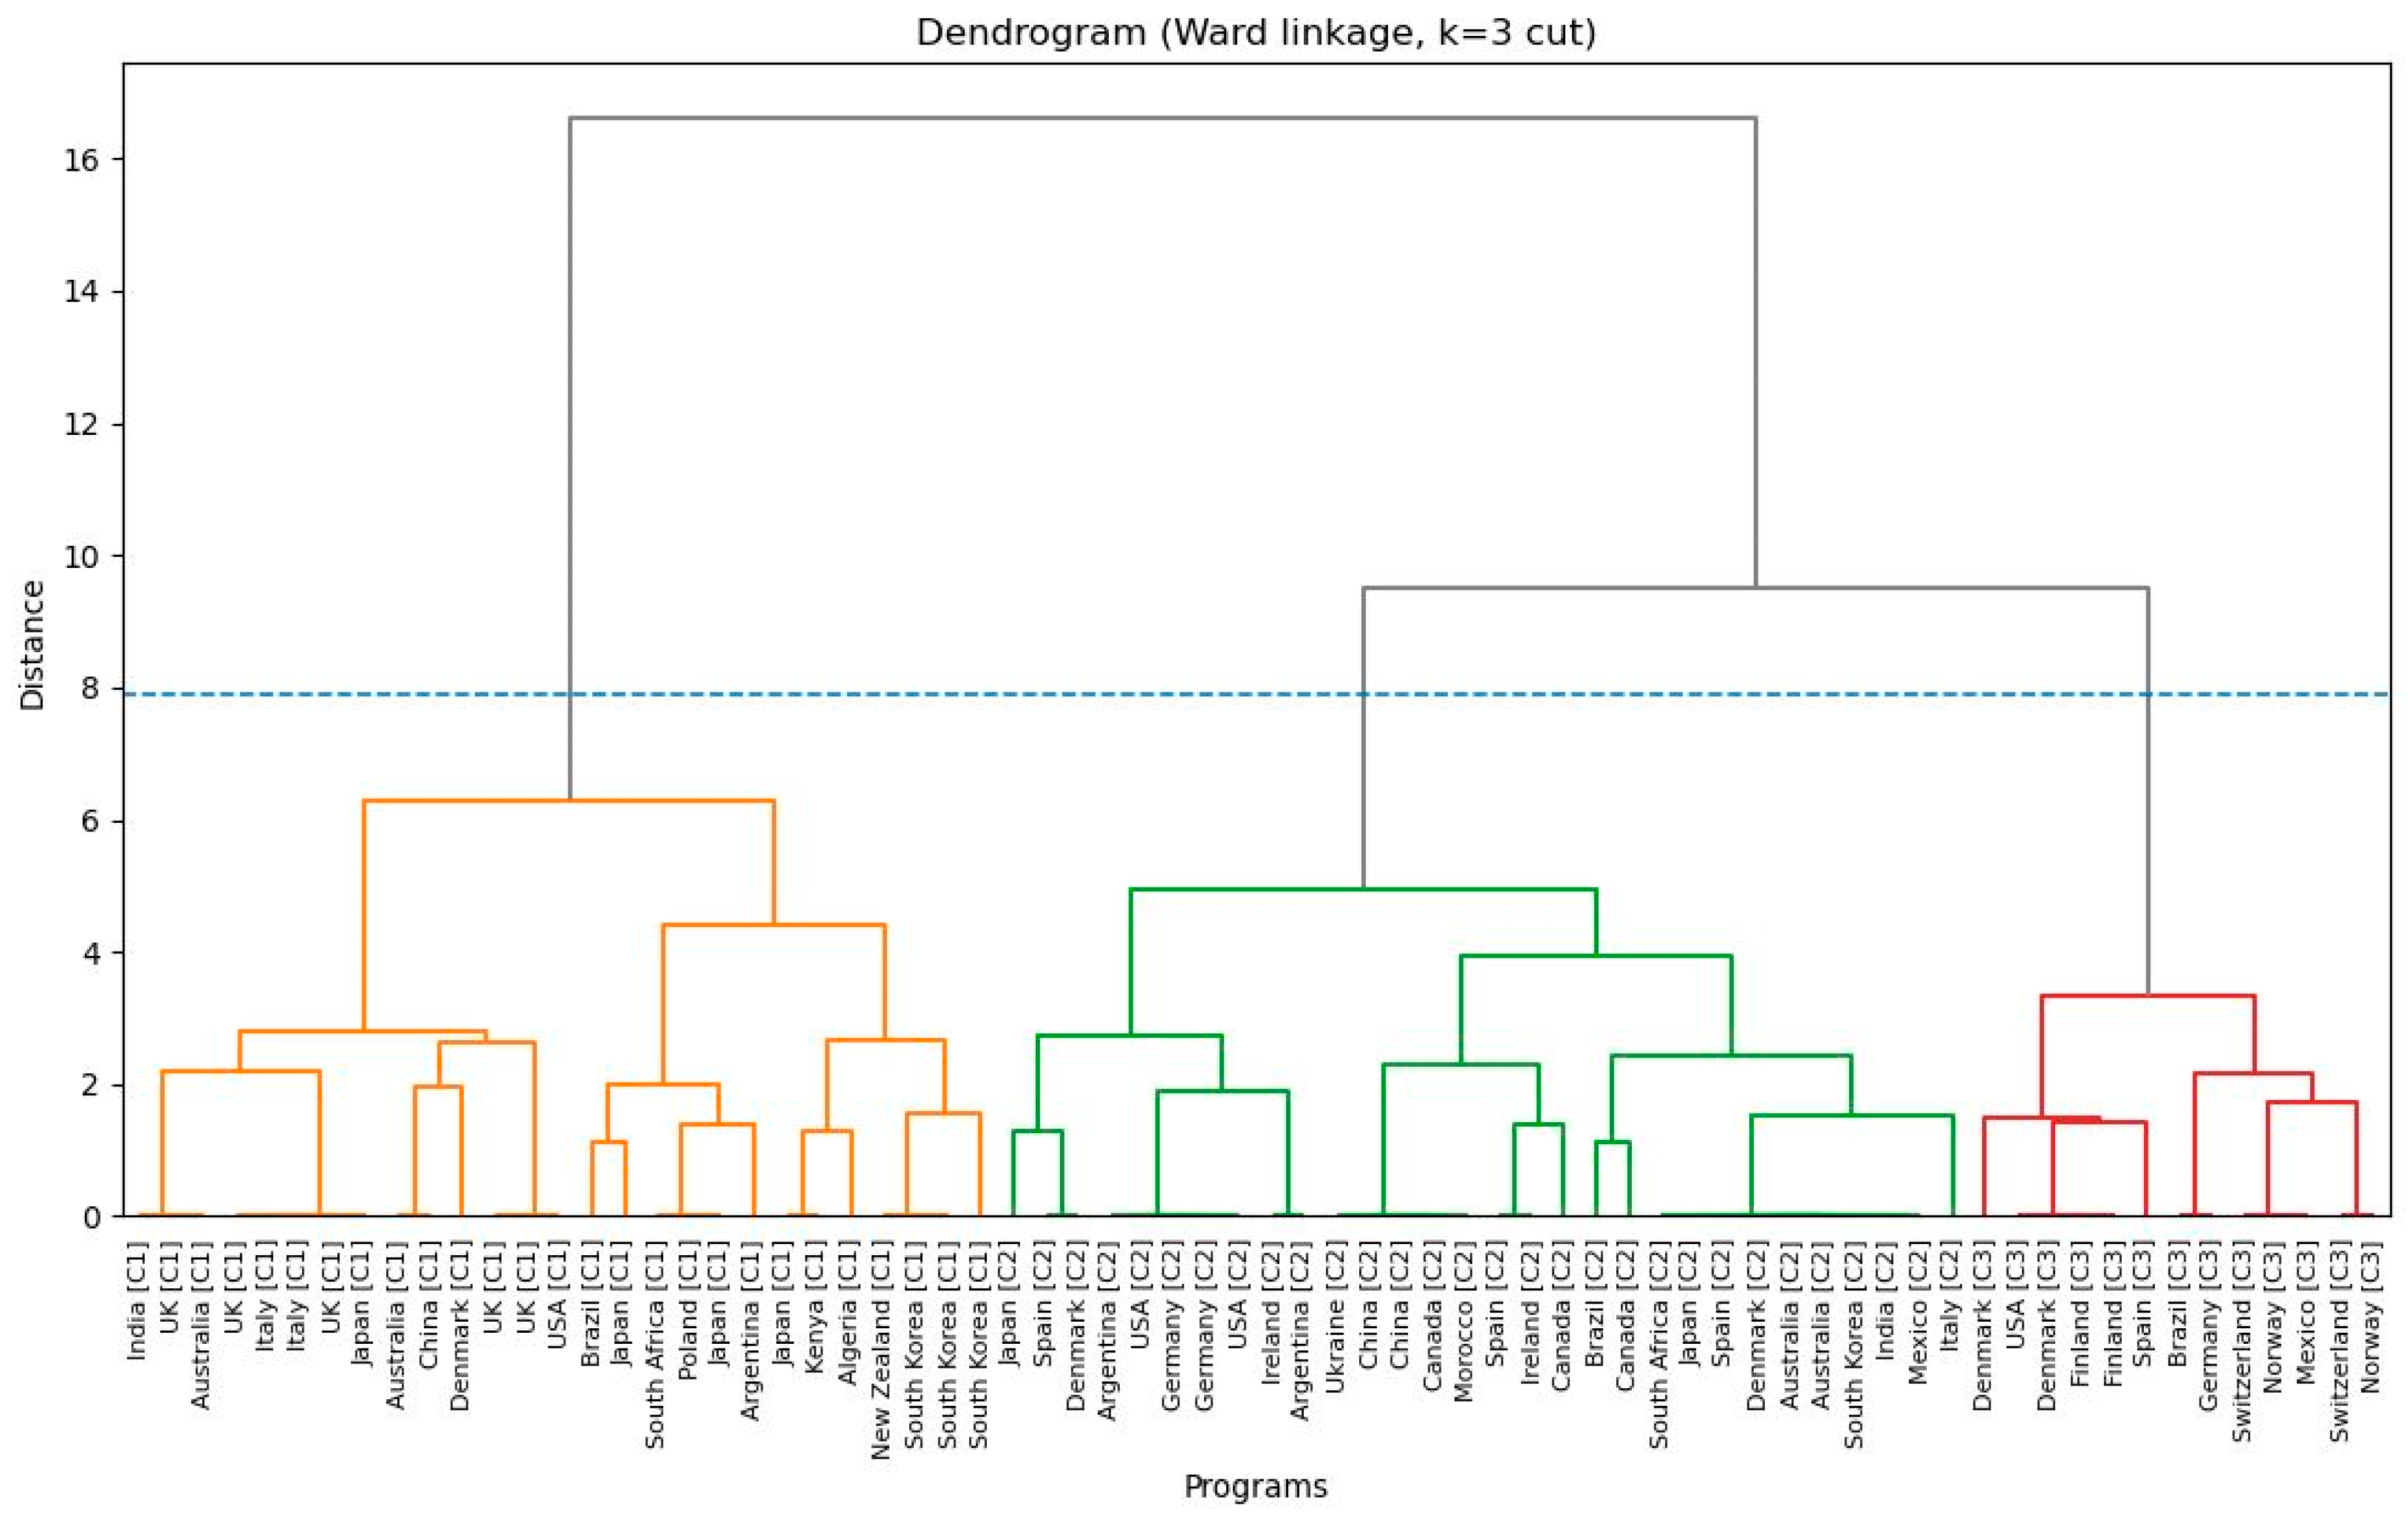
To uncover patterns in how programmes integrate climate change and vegetation, we profiled the four CONSEN dimensions (CC, VEG, CON, STRAT) using hierarchical clustering (Ward’s linkage on z-scores) and validated the solution with a partitional method (PAM) on Gower distances, agreement metrics, and bootstrap stability.
The silhouette sweep across k = 2…6 shows the highest mean silhouette at k = 2, but k = 3 remains acceptable (≈0.36) and is substantively informative for our three implementation strata (Low/Medium/High) used elsewhere in the paper. The k = 3 solution is also visually coherent in the dendrogram with a clear cut and presents well-separated cluster silhouettes.
Cluster centroids (means) indicate a clear gradient:
  • Cluster 1—Low integration (n = 27): CC = 0.33, VEG = 1.41, CON = 0.19, STRAT = 1.33; Total CCVI = 3.26. This group exhibits minimal climate–vegetation connection and limited pedagogical strategies, mapping onto the Low implementation level.
  • Cluster 3—Moderate integration (n = 30): CC = 1.10, VEG = 2.47, CON = 1.17, STRAT = 2.33; Total CCVI = 7.07. Programmes tend to emphasise biodiversity and strategies more than explicit climate content or its link to vegetation, aligning with medium implementation.
  • Cluster 2—High integration (n = 13): CC = 2.38, VEG = 2.92, CON = 2.31, STRAT = 3.00; Total CCVI = 10.62. These programmes score high on all four dimensions, with strong eco-climatic pedagogy and explicit climate–vegetation links—our high profile (Figure 8).
A PAM solution with k = 3 yields a closely related three-profile structure:
  • PAM-1 (n = 24): High; CC = 1.83, VEG = 2.92, CON = 1.96, STRAT = 2.83; Total CCVI = 9.54.
  • PAM-2 (n = 31): Medium; CC = 0.87, VEG = 2.13, CON = 0.74, STRAT = 1.90; Total CCVI = 5.65.
  • PAM-3 (n = 15): Low; CC = 0.13, VEG = 0.93, CON = 0.00, STRAT = 1.20; Total CCVI = 2.27.
Agreement between Ward and PAM clustering is moderate (Adjusted Rand Index, ARI = 0.312), which is expected when contrasting hierarchical and medoid-based partitions that emphasise different geometric properties. Bootstrap resampling (B = 200) indicates good stability for Ward (Avg Jaccard 0.759, Avg ARI 0.649) and acceptable stability for PAM (Avg Jaccard 0.625, Avg ARI 0.546). Together with the silhouette diagnostics, these results support the robustness of a three-profile interpretation.
Using a Spearman-based approach (ordinal approximation), the four-item scale shows high internal consistency (Cronbach’s α ≈ 0.90), and item-total correlations are strong, confirming that the dimensions cohere into a reliable index. Applying the predefined thresholds (Low 0–4; Medium 5–8; High 9–12) to the total CCVI yields: Low = 21, Medium = 33, High = 16 programmes. The boxplot of Total CCVI by Ward cluster mirrors these strata, with Cluster 1 centred in Low, Cluster 3 in Medium, and Cluster 2 in High.
The profiles reproduce a consistent curricular gradient. The Low profile is characterised by negligible climate–vegetation connection and few eco-climatic teaching strategies—suggesting mainly content-oriented or fragmented coverage. The Medium profile reflects a biodiversity/strategies-first pattern with weaker explicit climate content and links, which resonates with the global descriptive tendency of the dataset. The High profile demonstrates systemic integration, where climate, vegetation, their interconnections, and active pedagogies co-occur—consistent with the strongest national exemplars highlighted earlier.

4. Discussion

The findings of this study confirm that, despite the growing international consensus on the urgency of climate change education, the integration of climate- and biodiversity-related content in teacher education curricula remains uneven and, in many cases, insufficient. The Climate and Vegetation Curriculum Integration Index (CCVI) revealed significant heterogeneity: while some teacher education programs integrate climate change and vegetation topics in a comprehensive manner, many address them only superficially or neglect them altogether. This mirrors the global picture drawn by (UNESCO, 2021a), which reported that only about half of national curricula worldwide make explicit reference to climate change. In this sense, our analysis contributes robust empirical evidence that teacher education, a crucial lever for advancing sustainability education, still falls short of addressing the severity of climate emergencies in a systematic and intentional way.
One of the most salient issues emerging from the data is the asymmetric integration of the four CCVI dimensions. Vegetation/biodiversity and eco-climatic teaching strategies reach the highest median scores (around 2 out of 3), whereas climate change and, especially, explicit climate–vegetation connections remain at lower levels (median ≈ 1). Thus, plants are not completely invisible in science teacher education curricula; however, their presence is still only moderate and often disconnected from climate change and from inquiry- or action-oriented pedagogies. In this sense, our findings suggest a more nuanced form of plant awareness disparity: plants appear in the curriculum, yet they are rarely presented as central actors in climate processes or in socio-ecological transformations, which limits their potential to counteract anthropocentric and zoology-centred views.
Contrary to the initial expectation derived from the plant blindness literature, our results indicate that vegetation/biodiversity is not the least represented dimension; instead, plant awareness disparity (PAD) seems to be rooted in the quality, depth and integration of plant-related content rather than in its complete absence from the curriculum.
The neglect of vegetation content is especially problematic given its centrality to climate processes, ecosystem services, and mitigation strategies. By overlooking the role of plants in carbon sequestration, water cycles, and ecological resilience, curricula risk producing new generations of teachers who lack the holistic understanding necessary to explain the ecological dimensions of the climate crisis. Recent scholarship has stressed that the marginalization of botany in science curricula represents a missed opportunity to enhance climate and sustainability education (Morrow, 2023; Stagg & Dillon, 2023). Our results support these arguments and reinforce calls to reposition plant science as a core element of teacher education. Integrating plant ecology alongside climate science would render climate education more tangible and locally relevant, helping teachers connect scientific concepts to the lived environments of their students.
Another key finding concerns pedagogy. The inclusion of climate content in curricula does not automatically guarantee that preservice teachers will learn how to teach these topics effectively. Many of the syllabi we analyzed presented climate change as scientific knowledge to be acquired, without accompanying methodological guidance on how to engage pupils in climate and ecological learning. The CCVI revealed that those few programs which did prioritize biodiversity also tended to incorporate inquiry-based and experiential teaching strategies, creating a strong correlation between content integration and pedagogy. These finding echoes systematic review, which demonstrated that climate change education is most effective when it employs participatory, problem-based, and community-oriented pedagogies (Monroe et al., 2019). In contrast, programs that restricted climate change to theoretical treatment often failed to mention interactive or action-oriented strategies, leaving future teachers without models for fostering student engagement (Bangay & Blum, 2010; Leimbach & Milstein, 2022; McCowan, 2023). This is a consequential gap; simply transmitting climate science is insufficient: as González Gaudiano and Meira Cartea (2020) argue, education must not only inform about climate but also cultivate the values, attitudes, and action competence required for transformative social change. Teacher education should therefore model project-based learning, outdoor education, citizen science initiatives, and interdisciplinary approaches that connect climate issues to civic and ethical dimensions (Evans et al., 2024). Our analysis suggests that without such preparation, new teachers may default to traditional didactic methods, limiting their capacity to empower students as active participants in sustainability transitions.
Most teachers see climate education as essential but feel underprepared due to weak curricular coverage of climate–biodiversity content and pedagogy. Surveys in Spain, Colombia, and globally confirm this gap. Evidence shows that inadequate training lowers teacher confidence and teaching likelihood, while robust curricula improve competence and motivation, demonstrating a direct link between curriculum design and teacher readiness (Morote et al., 2025; Parry & Metzger, 2023; UNESCO, 2021b).
Despite existing challenges, this study contributes significant methodological innovation through the development of the Climate and Vegetation Curriculum Integration Index (CCVI). The CCVI provides a systematic and replicable framework for assessing how teacher education programs integrate climate change and vegetation, demonstrating strong psychometric properties, including high inter-rater reliability (κ = 0.72–0.85; Krippendorff’s α comparable) and internal consistency (Cronbach’s α ≈ 0.89). Its consistent performance across both core and validation samples further supports its external validity. Unlike previous international monitoring efforts, such as UNESCO’s (2021a) reports that broadly tracked climate content in school curricula, the CCVI offers the first tailored instrument for teacher education, filling a critical methodological gap. As such, it equips researchers, policymakers, and institutions with a robust tool for identifying weaknesses, benchmarking progress, and informing curriculum reform (Cano-Ortiz et al., 2021c, 2021d).
A further strength of this study lies in its cross-national scope. By analyzing curricula from 19 countries, it was possible to detect challenges common across contexts, such as the neglect of plant-related content and the limited treatment of pedagogy, while also identifying exemplary programs in Finland, Germany, Mexico, and Switzerland. These cases, which scored highly on the CCVI by integrating climate, biodiversity, and active teaching strategies, illustrate that strong curricular integration is achievable when supported by clear policies and institutional commitment. Thus, the study not only highlights deficiencies but also showcases transferable practices that can guide reforms elsewhere.
Several limitations should be recognized. First, our analysis relied on official curricula and syllabi, which reflect the intended but not necessarily the enacted curriculum; teacher educators may emphasize different content in practice. Second, the wide cross-national scope limited depth within individual countries, and intra-country variation could not be fully captured. Third, disparities in the level of detail across documents may have influenced coding, with some sustainability content possibly taught but not explicitly recorded. Fourth, the study offers only a snapshot, not accounting for longitudinal changes or recent policy reforms, despite the rapid evolution of climate education initiatives. Finally, although the CCVI proved reliable, it simplifies curricular complexity and does not address aspects such as climate justice, indigenous knowledge, or socio-emotional learning (Albright & St John, 2023; Morote et al., 2025).
These constraints also open avenues for future inquiry. Longitudinal studies could track curricular evolution under policy reforms, while impact evaluations should test whether high-integration programs enhance teacher competence and student climate literacy. Qualitative case studies of exemplary programs may reveal institutional enablers of integration, and interdisciplinary research could broaden the scope to other teacher education fields. Refining the CCVI to include justice- and emotion-related dimensions would further strengthen its analytical power.
The implications of these findings extend across educational, social, and economic domains. From an educational perspective, teacher training institutions must move beyond treating sustainability as peripheral and embed it as a core element of professional preparation. This requires the systematic inclusion of climate change, biodiversity, and plant ecology, together with the pedagogical skills needed to teach these topics effectively and in alignment with competence frameworks and accreditation standards (Parveva et al., 2024).
Taken together, the CCVI results show only a moderate average level of integration of climate change, vegetation/biodiversity and eco-climatic teaching strategies, with substantial variability between programs and relatively weaker scores for explicit climate–vegetation connections. Moreover, the cross-national comparison suggests that stronger policy frameworks (e.g., Italy’s Law 92/2019) tend to be associated with higher levels of integration. Considering these empirical patterns and existing research, several broader implications can be outlined:
  • Socially, the fact that many programs still treat climate change and biodiversity in a partial and fragmented way implies that future teachers may not receive sufficient preparation to address these issues in depth with their students. Since teachers play a key role in shaping values and awareness, improving their preparation in climate and biodiversity education can create ripple effects that extend to families and communities. Well-prepared teachers are more likely to foster ecological literacy and civic engagement, enabling young people to participate meaningfully in climate action and to understand its uneven social impacts (Evans et al., 2024).
  • Economically, the moderate integration observed in our sample suggests that education systems are not yet fully exploiting teacher education as a lever for developing the “green skills” increasingly required in global labour markets. Strengthening the curricular presence of climate change, biodiversity and plant ecology—together with inquiry- and action-oriented pedagogies—can help cultivate critical thinking and problem-solving abilities that prepare students for careers in renewable energy, climate-smart agriculture and sustainable infrastructure, positioning teacher education reform as an investment in human capital for a resilient green economy (Shek et al., 2025).
  • Politically, the cross-national differences identified by the CCVI, and the relatively higher integration observed in countries with strong legal frameworks such as Italy’s Law 92/2019 (Gazzetta Ufficiale, n.d.), underscore the importance of policy leadership. Where policy direction is weak or ambiguous, teacher education institutions have fewer incentives and resources to embed climate and biodiversity systematically in their programs. Policymakers should therefore incorporate these issues into teacher standards, curricula and professional development, aligning reforms with SDG 4.7, SDG 13 and international commitments such as the Paris Agreement (UNESCO, 2021a).
  • Environmentally, the finding that many programs pay limited attention to explicit climate–vegetation connections and to eco-climatic teaching strategies has direct consequences for how schools can contribute to mitigation and adaptation. (UNESCO, 2021a) affirms that “there is no solution to the climate crisis without education”; if teachers are not adequately trained, education systems risk falling short of their potential to support societal responses to climate and biodiversity crises. Conversely, well-prepared teachers can lead school-based projects such as reforestation, energy conservation or biodiversity monitoring, which generate tangible ecological and community benefits. In this sense, education for sustainability functions as an upstream intervention that strengthens environmental stewardship and resilience.
In conclusion, while some progress has been achieved, integration of climate change and biodiversity in teacher education remains partial and inconsistent. The CCVI emerges as a valuable tool for monitoring integration and guiding reform. Addressing plant awareness disparity, closing the gap between content and pedagogy, and securing systemic policy support are essential to align teacher preparation with the challenges of climate and biodiversity crises. Preparing teachers for sustainability is not peripheral but foundational for societies navigating the Anthropocene.
The results are expected to contribute to the development of innovative training strategies that empower new science teachers to play a leading role in shaping an environmentally informed, critical, and committed citizenry for planetary sustainability.

5. Conclusions

This study examined how climate change and vegetation (plant ecology) are integrated into initial science teacher education curricula across 26 countries using the Climate and Vegetation Curriculum Integration Index (CCVI). The analysis shows a moderate average level of integration: total CCVI scores cluster around half of the maximum possible value, with substantial variation between programs. Within this profile, vegetation/biodiversity and eco-climatic teaching strategies tend to obtain higher scores than explicit climate change content and, especially, climate–vegetation connections. Thus, plants are not absent from teacher education curricula, but climate change and its links with vegetation are still addressed in a fragmented and often superficial way.
These patterns suggest that, in many of the programs analyzed, teacher education is not yet fully aligned with the urgency of the climate and biodiversity crises. The CCVI offers a practical tool for making the degree and profile of integration visible, comparing programs within and across countries, and identifying exemplary cases that can inform reform. Strengthening explicit climate–vegetation connections, framing plants as central actors in socio-ecological systems, and embedding inquiry and action-oriented pedagogies in science teacher education are key steps to enhance future teachers’ climate and ecological literacy. Advancing in this direction is not only a matter of curricular design but a professional and societal responsibility for education systems navigating the Anthropocene.
Future research should track curriculum reforms longitudinally, assess their impact on teacher and student outcomes, and refine the CCVI to capture dimensions such as climate justice and socio-emotional learning.

Supplementary Materials

The following supporting information can be downloaded at: https://www.mdpi.com/article/10.3390/educsci16010056/s1.

Author Contributions

Conceptualization, J.C.P.-F.; methodology, J.C.P.-F., A.C.-O. and E.C.; software, J.C.P.-F.; validation, J.C.P.-F. and L.R.R.; formal analysis, J.C.P.-F.; investigation, J.C.P.-F., A.C.-O., E.C. and L.R.R.; resources, J.C.P.-F., A.C.-O., E.C and L.R.R.; data curation, J.C.P.-F.; writing—original draft preparation, J.C.P.-F.; writing—review and editing, J.C.P.-F., A.C.-O., E.C. and L.R.R. All authors have read and agreed to the published version of the manuscript.

Funding

This research received no external funding.

Institutional Review Board Statement

Not applicable.

Informed Consent Statement

Not applicable.

Data Availability Statement

No new data were created or analyzed in this study. Data sharing is not applicable to this article.

Conflicts of Interest

The authors declare no conflict of interest.

Appendix A

Standardized prompt for AI-assisted CCVI coding: It defines expert role and task; provides 0–3 anchors for the four dimensions; enforces coding rules (no invention, brief in-text evidence, documents provided only); and specifies the output (0–3 score table + short justifications and confidence). Used solely to triangulate human coding; final decisions were made by human consensus.
Education 16 00056 i001

References

  1. Akheel, S. A. (2025). Guardrails for large language models: A review of techniques and challenges. Journal of Artificial Intelligence, Machine Learning and Data Science, 3(1), 2504–2512. [Google Scholar] [CrossRef]
  2. Albright, J., & St John, E. P. (2023). Higher education in post-neoliberal times: Building human capabilities in the emergent period of uncertainty. Education Sciences, 13(5), 500. [Google Scholar] [CrossRef]
  3. Álvarez-García, O., Sureda-Negre, J., & Comas-Forgas, R. (2017). Evaluación de las competencias ambientales del profesorado de primaria en formación inicial: Estudio de caso. Enseñanza de Las Ciencias. Revista de Investigación y Experiencias Didácticas, 36(1), 117–141. [Google Scholar] [CrossRef]
  4. Bangay, C., & Blum, N. (2010). Education responses to climate change and quality: Two parts of the same agenda? International Journal of Educational Development, 30(4), 359–368. [Google Scholar] [CrossRef]
  5. Bevacqua, E., Schleussner, C. F., & Zscheischler, J. (2025). A year above 1.5 °C signals that Earth is most probably within the 20-year period that will reach the Paris Agreement limit. Nature Climate Change, 15(3), 262–265. [Google Scholar] [CrossRef]
  6. Cano-Ortiz, A., Musarella, C. M., Fuentes, J. C. P., Quinto Canas, R., & Cano, E. (2022c). Botanical education for vocational training students and primary and secondary teacher. Research Journal of Ecology and Environmental Sciences, 2(2), 1–10. [Google Scholar] [CrossRef]
  7. Cano-Ortiz, A., Musarella, C. M., Piñar Fuentes, J. C., Gomes, C. J. P., Del Rio, S., Canas, R. Q., & Cano, E. (2018). Analysis of the conservation of central american mangroves using the phytosociological method. In Mangrove Ecosystem Ecology and Function. IntechOpen. [Google Scholar] [CrossRef]
  8. Cano-Ortiz, A., Musarella, C. M., Piñar Fuentes, J. C., Quinto-Canas, R., Igbareyeh, J., Astrid Laface, V. L., & Cano, E. (2022a). The teaching of environmental sciences in secondary education, high school and university to fight against climate change. In F. Calabrò, L. Della Spina, & M. J. Piñeira Mantiñán (Eds.), New metropolitan perspectives (Vol. 482). NMP 2022—Lecture Notes in Networks and Systems. Springer. [Google Scholar] [CrossRef]
  9. Cano-Ortiz, A., Piñar Fuentes, J. C., & Cano, E. (2021a). Didactics of natural sciences in higher Secondary education. International Journal of Humanities Social Sciences and Education, 8(10), 6–10. [Google Scholar] [CrossRef]
  10. Cano-Ortiz, A., Piñar Fuentes, J. C., & Cano, E. (2021b, September 29–30). Proposals for the learning of plant diversity. 5th International Virtual Conference on Educational Research and Innovation–CIVINEDU, Madrid, Spain. [Google Scholar]
  11. Cano-Ortiz, A., Piñar Fuentes, J. C., Ighbareyeh, J. M. H., Quinto Canas, R., & Cano, E. (2021c). Aspectos didácticos en la enseñanza de conceptos geobotánicos. International Journal of Humanities, Social Sciences and Education, 8(4), 271–276. [Google Scholar] [CrossRef]
  12. Cano-Ortiz, A., Piñar-Fuentes, J. C., Musarella, C. M., & Peña-Martínez, J. (2025). Education for environmental sustainability component: Innovative strategies for experiential learning in natural contexts. Education Sciences, 15(6), 697. [Google Scholar] [CrossRef]
  13. Cano-Ortiz, A., Piñar Fuentes, J. C., Quinto Canas, R. J., Pinto Gomes, C. J., & Cano, E. (2021d). Analysis of the relationship between bioclimatology and sustainable development. In C. Bevilacqua, F. Calabrò, & L. Della Spina (Eds.), New metropolitan perspectives (Vol. 178). NMP 2020—Smart Innovation, Systems and Technologies. Springer. [Google Scholar] [CrossRef]
  14. Cano-Ortiz, A., Quinto Canas, R., Carlos Piñar Fuentes, J., del Río, S., Gomes, J. P., & Eusebio Cano, C. (2022b). Endemic hemicryptophyte grasslands of the high mountains of the Caribbean. Research Journal of Ecology and Environmental Sciences, 2(1), 1–20. [Google Scholar] [CrossRef]
  15. Cebrián, G., & Junyent, M. (2014). Competencias profesionales en educación para la sostenibilidad: Un estudio exploratorio de la visión de futuros maestros. Enseñanza de las Ciencias. Revista de Investigación y Experiencias Didácticas, 32(1), 29–49. [Google Scholar] [CrossRef]
  16. Corpuz, A. M., San Andres, T. C., & Lagasca, J. M. (2022). Integration of Environmental Education (EE) in teacher education programs: Toward sustainable curriculum. Problems of Education in the 21st Century, 80(1), 119–143. [Google Scholar] [CrossRef]
  17. de Raadt, A., Warrens, M. J., Bosker, R. J., & Kiers, H. A. L. (2021). A comparison of reliability coefficients for ordinal rating scales. Journal of Classification, 38(3), 519–543. [Google Scholar] [CrossRef]
  18. Dong, Y., Mu, R., Jin, G., Qi, Y., Hu, J., Zhao, X., Meng, J., Ruan, W., & Huang, X. (2024). Building guardrails for large language models. arXiv. [Google Scholar] [CrossRef]
  19. Evans, R. S., McGregor, H. E., & Reed, B. (2024). Pedagogical principles for encouraging (socially just) youth climate action: A schema for citizenship education curriculum analysis. Education, Citizenship and Social Justice, 20(3), 450–468. [Google Scholar] [CrossRef]
  20. FAO. (2022). FAO strategy on climate change 2022–2031. Food and Agriculture Organization of the United Nations Rome. [Google Scholar]
  21. Gal, A. (2024). Fostering positive engagement: Climate change and environmental activism in the sixth-grade classroom. Environmental Education Research, 30(12), 2272–2290. [Google Scholar] [CrossRef]
  22. Gamboa-Bernal, G. A. (2022). Cumbre del Cambio climático 2021: Más escepticismo que compromisos. Persona y Bioética, 26(1), 1–9. [Google Scholar] [CrossRef]
  23. Gazzetta Ufficiale. (n.d.). Law 20 August 2019, n. 92. Available online: https://www.gazzettaufficiale.it/eli/id/2019/08/21/19G00105/sg (accessed on 23 September 2025).
  24. González Gaudiano, E. J., & Meira Cartea, P. Á. (2020). Educación para el cambio climático: ¿Educar sobre el clima o para el cambio? Perfiles Educativos, 42(168), 157–174. [Google Scholar] [CrossRef]
  25. Grazziotin, L. S., Klaus, V., & Pereira, A. P. M. (2022). Documentary historical analysis and bibliographic research: Study subjects and methodology. Pro-Posições, 33, e20200141. [Google Scholar] [CrossRef]
  26. Hershey, D. R. (1996). A historical perspective on problems in botany teaching. American Biology Teacher, 58(6), 340–347. [Google Scholar] [CrossRef]
  27. Ikendi, S. (2022). Ecological conservation, biodiversity, and agricultural education as integrated approaches for envisioning the future of sustainable agriculture in North America. International Journal of Sustainable Development & World Ecology, 30(2), 152–163. [Google Scholar] [CrossRef]
  28. Jones, G. (2019, November 6). Italy to make climate change study compulsory in schools. World Economic Forum. Available online: https://www.weforum.org/stories/2019/11/italy-to-make-climate-change-study-compulsory-in-schools/ (accessed on 16 September 2025).
  29. Lee, H., Calvin, K., Dasgupta, D., Krinner, G., Mukherji, A., Thorne, P., Trisos, C., Romero, J., Aldunce, P., & Barret, K. (2023). IPCC, 2023: Climate Change 2023: Synthesis Report, Summary for Policymakers. Contribution of Working Groups I, II and III to the Sixth Assessment Report of the Intergovernmental Panel on Climate Change (Core Writing Team, H. Lee, & J. Romero, Eds.). Intergovernmental Panel on Climate Change (IPCC). [Google Scholar]
  30. Leimbach, T., & Milstein, T. (2022). Learning to change: Climate action pedagogy. Australian Journal of Adult Learning, 62(3), 414–423. [Google Scholar]
  31. Lennan, M., & Morgera, E. (2022). The Glasgow climate conference (COP26). The International Journal of Marine and Coastal Law, 37(1), 137–151. [Google Scholar] [CrossRef]
  32. Liffiton, M., Sheese, B., Savelka, J., & Denny, P. (2023, November 13–18). CodeHelp: Using large language models with guardrails for scalable support in programming classes. Koli Calling ‘23: 23rd Koli Calling International Conference on Computing Education Research, Koli, Finland. [Google Scholar] [CrossRef]
  33. Mann, H. B., & Whitney, D. R. (1947). On a test of whether one of two random variables is stochastically larger than the other. Annals of Mathematical Statistics, 18(1), 50–60. [Google Scholar] [CrossRef]
  34. Marzi, G., Balzano, M., & Marchiori, D. (2024). K-Alpha Calculator–Krippendorff’s Alpha Calculator: A user-friendly tool for computing Krippendorff’s Alpha inter-rater reliability coefficient. MethodsX, 12, 102545. [Google Scholar] [CrossRef]
  35. McCowan, T. (2023). The climate crisis as a driver for pedagogical renewal in higher education. Teaching in Higher Education, 28(5), 933–952. [Google Scholar] [CrossRef]
  36. McHugh, M. L. (2012). Interrater reliability: The kappa statistic. Biochemia Medica, 22(3), 276. [Google Scholar] [CrossRef]
  37. Ministerio de Educación Pública de Costa Rica. (2020). Política y plan de acción de educación para el desarrollo sostenible 2020–2025. Ministerio de Educación Pública de Costa Rica. Available online: https://observatoriomesoamerica.minambiente.gov.co/obsmesoamerica/medios/Costa%20Rica/Pol%C3%ADtica%20y%20Plan%20de%20Acci%C3%B3n%20EDS.pdf (accessed on 16 September 2025).
  38. Mochel, F. R., Ribeiro, P. C., & Correa, J. N. (2013). Environmental education games for mangrove restoration and protection involving global changing scenarios. Developing environmental education games for protection of mangrove ecosystems. Proceedings of 7th WEEC Niche, 7, 512–523. [Google Scholar]
  39. Monroe, M. C., Plate, R. R., Oxarart, A., Bowers, A., & Chaves, W. A. (2019). Identifying effective climate change education strategies: A systematic review of the research. Environmental Education Research, 25(6), 791–812. [Google Scholar] [CrossRef]
  40. Morote, Á. F., Sebastiá-Álcaraz, R., Ferrero-Punzano, S. M., Miguel-Revilla, D., Moreno-Vera, J. R., Rodríguez-Pizzinato, L. A., & García, Ó. J. (2025). Climate change, education, training, and perception of pre-service teachers. Social Sciences, 14(4), 236. [Google Scholar] [CrossRef]
  41. Morrow, R. (2023, December 16). La botánica debería enseñarse más ampliamente en las escuelas para promover la concientización sobre el cambio climático. Meteored. Available online: https://www.meteored.mx/noticias/actualidad/la-botanica-deberia-ensenarse-mas-ampliamente-en-las-escuelas-para-promover-la-concienciacion-sobre-el-cambio-climatico.html (accessed on 20 September 2025).
  42. OECD. (2015). Future of education and skills 2030/2040. OECD. Available online: https://www.oecd.org/en/about/projects/future-of-education-and-skills-2030.html#faq (accessed on 20 September 2025).
  43. OECD. (2019). An OECD learning framework 2030. In G. Bast, E. G. Carayannis, & D. F. J. Campbell (Eds.), The future of education and labor (pp. 23–35). Springer International Publishing. [Google Scholar] [CrossRef]
  44. ONU. (2015). Transformar nuestro mundo: La agenda 2030 para el desarrollo sostenible. Naciones Unidas. Available online: https://sdgs.un.org/es/2030agenda (accessed on 20 September 2025).
  45. Orr, D. W. (2004). Earth in mind. On education, environment and human prospect. Island Press. [Google Scholar]
  46. Parmesan, C., Root, T. L., & Willig, M. R. (2000). Impacts of extreme weather and climate on terrestrial biota. Bulletin of the American Meteorological Society, 81(3), 443–450. [Google Scholar] [CrossRef]
  47. Parry, S., & Metzger, E. (2023). Barriers to learning for sustainability: A teacher perspective. Sustainable Earth Reviews, 6(1), 1–11. [Google Scholar] [CrossRef]
  48. Parveva, T., Birch, P., Horváth, A., Piedrafita Tremosa, S., & Sigalas, E. (2024). Aprendizaje para la sostenibilidad en Europa—Creando competencias y apoyo a docentes y centros educativos (P. Birch, Ed.). Publications Office of the European Union. [Google Scholar] [CrossRef]
  49. Pe’er, S., Goldman, D., & Yavetz, B. (2007). Environmental literacy in teacher training: Attitudes, knowledge, and environmental behavior of beginning students. The Journal of Environmental Education, 39(1), 45–59. [Google Scholar] [CrossRef]
  50. Pinheiro, S., Torres, A. C., Pereira, B., Malafaia, C., & Menezes, I. (2024). Citizenship education to promote the participation of young people in climate adaptation: Crossing curricular boundaries through community profiling. Curriculum Perspectives, 44(4), 501–512. [Google Scholar] [CrossRef]
  51. Piñar-Fuentes, J. C., Peña-Martínez, J., & Cano-Ortiz, A. (2024). Integrating thermo-ombroclimatic indicators into sustainable olive management: A pathway for innovation and education. Agriculture, 14(12), 2112. [Google Scholar] [CrossRef]
  52. Quinto-Canas, R., Cano-Ortiz, A., Raposo, M., Piñar Fuentes, J. C., Cano, E., Barbosa, N., & Pinto Gomes, C. J. (2021). Cork oak vegetation series of southwestern Iberian peninsula: Diversity and ecosystem services. In C. Bevilacqua, F. Calabrò, & L. Della Spina (Eds.), New metropolitan perspectives (Vol. 178). NMP 2020—Smart Innovation, Systems and Technologies. Springer. [Google Scholar] [CrossRef]
  53. Schleicher, A., Ikeda, M., Thorn, W., & Tremblay, K. (2021). OECD studies and the case of PISA, PIAAC, and TALIS (pp. 1–42). Springer. [Google Scholar] [CrossRef]
  54. Shek, D. T. L., Chau, G. C. C., & Lee, B. M. (2025). Development of 21st-century skills: A comprehensive analysis based on the OECD learning compass 2030. Quality of Life in Asia, 17, 89–118. [Google Scholar] [CrossRef]
  55. Stagg, B. C., & Dillon, J. (2022). Plant awareness is linked to plant relevance: A review of educational and ethnobiological literature (1998–2020). Plants, People, Planet, 4(6), 579–592. [Google Scholar] [CrossRef]
  56. Stagg, B. C., & Dillon, J. (2023). Plants, education and sustainability: Rethinking the teaching of botany in school science. Journal of Biological Education, 57(5), 941–943. [Google Scholar] [CrossRef]
  57. Tang, K. H. D. (2022). A model of behavioral climate change education for higher educational institutions. Environmental Advances, 9, 100305. [Google Scholar] [CrossRef]
  58. UNESCO. (2021a). Reimagining our futures together: A new social contract for education. UNESCO. [Google Scholar] [CrossRef]
  59. UNESCO. (2021b). Teachers have their say motivation, skills and opportunities to teach education for sustainable development and global citizenship. UNESCO. Available online: https://unesdoc.unesco.org/ark:/48223/pf0000379914 (accessed on 23 September 2025).
  60. UNESCO. (2021c). La UNESCO advierte que solo la mitad de los planes de estudio. UNESCO. Available online: https://www.unesco.org/es/articles/la-unesco-advierte-que-solo-la-mitad-de-los-planes-de-estudio-nacionales-en-todo-el-mundo-hacen (accessed on 15 September 2025).
  61. UNESCO. (2023). Education for sustainable development. Available online: https://www.unesco.org/en/sustainable-development/education (accessed on 15 September 2025).
  62. Varela-Losada, M., Vega-Marcote, P., Pérez-Rodríguez, U., & Álvarez-Lires, M. (2016). Going to action? A literature review on educational proposals in formal environmental education. Environmental Education Research, 22(3), 390–421. [Google Scholar] [CrossRef]
  63. Wandersee, J. H., & Schussler, E. E. (1999). Preventing plant blindness. The American Biology Teacher, 61(2), 82–86. [Google Scholar] [CrossRef]
Figure 1. Geographical distribution of sampling points (countries) in the core group and countries considered for validation.
Education 16 00056 g001
Figure 2. Workflow of the quantitative analysis. The diagram outlines the main steps of the statistical analysis: data collection and preparation, descriptive analysis, non-parametric group comparisons, association tests, clustering with robustness checks, sensitivity analyses, and final reporting and visualization.
Education 16 00056 g002
Figure 3. Distribution of CCVI scores by dimension (Core vs. Validation).
Education 16 00056 g003
Figure 4. Global Average CCVI Profile (a) and average CCVI scores by region and dimension (b).
Education 16 00056 g004
Figure 5. Boxplots of Total CCVI (0–12) by region, with individual points to show the dispersion within each group. The black symbol is an outlier.
Education 16 00056 g005
Figure 6. Distribution of Total CCVI scores: EU vs. Non-EU.
Education 16 00056 g006
Figure 7. Spearman correlations between CCVI dimensions and the Total score. The heatmap displays correlation coefficients (ρ) across Climate change (CC), Vegetation/Biodiversity (VEG), Climate–Vegetation Connection (CON), Eco-climatic Teaching Strategies (STRAT), and the Total CCVI. All correlations were positive and statistically significant after FDR correction, with particularly strong associations between VEG, STRAT, and the Total score.
Education 16 00056 g007
Figure 8. The dendrogram (Ward, k = 3) shows three well-separated clusters: orange (low integration), green (medium), and red (high) with short within-cluster branches and tall between-cluster merges, confirming clear three-profile structure. The blue line represents the cut-off threshold for the clusters.
Education 16 00056 g008
Table 1. Countries selected and brief justification for their inclusion in this study, based mainly on various global rankings, as well as the development of environmental policies in their education legislation.
CountryJustification SummaryCore/Validation
SpainNational education law LOMLOE mandates ESD across curricula and teacher training.Core
FinlandGlobally recognised for high-quality teacher education and top PISA science performance.Core
GermanyNational Action Plan for ESD (2017) integrates sustainability across education, including teacher training.Core
ItalyLaw 92/2019 makes climate change and sustainability compulsory in Civic Education.Core
DenmarkInnovative environmental education; origin of ‘action competence’ approach.Core
United KingdomNational Sustainability and Climate Change Strategy (2022) embed climate/sustainability in teacher CPD.Core
United StatesNGSS adopted in many states, explicitly integrating climate change into science curricula.Core
AustraliaAustralian Curriculum includes sustainability as cross-curriculum priority since 2011.Core
BrazilNational Environmental Education Policy (1999) mandates interdisciplinary environmental education.Core
South KoreaHigh PISA 2022 science performance (528 points), reflecting robust science curricula.Core
CanadaHigh PISA science performance (528 in 2015) and strong teacher education programmes.Validation
ChinaTop-ranked globally in PISA 2018; curriculum reforms embed ‘ecological civilisation’.Validation
IndiaEnvironmental education compulsory since 2004 by Supreme Court ruling.Validation
IrelandPrimary curriculum (1999) integrates environmental awareness; reinforced by ESD to 2030 strategy.Validation
Mexico2020 reform to General Education Law embeds climate change and sustainability.Validation
NorwayCurriculum reform LK20 (2020) makes sustainable development a compulsory cross-cutting topic.Validation
PolandSignificant rise in PISA science performance (22nd in 2006 → 11th in 2018).Validation
South AfricaNational Curriculum (CAPS) integrates environmental education in all grades (R–12).Validation
UkraineInter-Agency Group (2023) embedding environmental education; developing ESD Action Plan.Validation
ArgentinaNational Curriculum Guidelines include environmental education across levels; rising attention to climate change.Validation
AlgeriaReforms include environmental awareness in science curricula; focus on desertification and sustainability.Validation
JapanCurriculum reform (2017) highlights environmental awareness; strong performance in PISA science.Validation
KenyaCompetency-Based Curriculum (2017) integrates environmental sustainability as a core theme.Validation
MoroccoNational Charter for Education includes environmental sustainability; recent climate education initiatives.Validation
New ZealandCurriculum framework highlights sustainability and climate change as cross-curricular priorities.Validation
SwitzerlandTeacher education reforms integrate ESD; strong tradition in environmental education research.Validation
Table 2. Climate and Vegetation Curriculum Integration Index (CCVI): four analytical dimensions with coding scale (0–3) and illustrative examples for curriculum analysis.
DimensionDescriptionScale (0–3)Examples of Coding
1. Presence of
climate change
Evaluates the extent to which climate change concepts, problems or phenomena appear in the curriculum.0 = No mention, 1 = Tangential mention, 2 = Explicit but limited, 3 = Extensive and in-depth development0 = No reference to climate change in programme, 1 = Passing mention in course objectives, 2 = Specific module on “global warming” within a science course, 3 = Dedicated course or multiple modules addressing climate change with theory and practice
2. Presence of vegetation and biodiversityMeasures the inclusion of plant ecology, biodiversity, and vegetation-related content in teacher education programmes.0 = No mention, 1 = Isolated/superficial reference, 2 = Explicit presence in some sections, 3 = Central and sustained treatment0 = Curriculum omits vegetation, 1 = Examples of plants in biology course, 2 = Practical activities on local flora within biology didactics, 3 = Full course on plant ecology or biodiversity with fieldwork
3. Climate–vegetation connectionAssesses the degree to which curricula explicitly link climate change and vegetation, fostering interdisciplinary perspectives.0 = No relationship, 1 = Implicit or anecdotal, 2 = Explicit but partial, 3 = Strong and explicit integration0 = Climate and vegetation taught separately, 1 = Incidental mention (e.g., climate impacts on agriculture), 2 = Section linking climate change with biodiversity loss, 3 = Course module on climate impacts on plant distribution and ecosystems
4. Eco-climatic teaching strategiesIdentifies the presence of teaching methodologies that integrate climate and vegetation in active, experiential ways.0 = No strategies1 = Generic strategies not linked to climate/vegetation2 = At least one specific strategy3 = Multiple explicit active strategies0 = Theoretical content only, 1 = Generic “active learning” with no environmental focus, 2 = One project-based activity on ecosystems, 3 = Field trips, school gardens, project-based learning, and community projects explicitly addressing climate and vegetation
Table 3. Descriptive statistics of CCVI scores by dimension (N = 70 documents).
CCVI DimensionMeanSDMedianIQRMinMax
Climate change (CC)1.060.841.01.003
Vegetation/Biodiversity (VEG)2.140.892.01.003
Climate–vegetation connection (CON)1.010.911.02.003
Eco-climatic teaching strategies (STRAT)2.050.772.01.003
Total CCVI (0–12)6.272.956.04.0112
Table 4. Country-level descriptives (CONSEN scores): median [IQR], mean ± SD, and min–max per country for CC, VEG, CON, STRAT, and Total.
CountryNCONSEN_CC_Median [IQR]CONSEN_CC_Mean ± SDCONSEN_CC_MinMaxCONSEN_VEG_Median [IQR]CONSEN_VEG_Mean ± SDCONSEN_VEG_MinMaxCONSEN_CON_Median [IQR]CONSEN_CON_Mean ± SDCONSEN_CON_MinMaxCONSEN_STRAT_Median [IQR]CONSEN_STRAT_Mean ± SDCONSEN_STRAT_MinMaxCONSEN_Total_0_12_Median [IQR]CONSEN_Total_0_12_Mean ± SDCONSEN_Total_0_12_MinMax
Algeria10.00 [0.00, 0.00]0.00 ± 0.000–02.00 [2.00, 2.00]2.00 ± 0.002–21.00 [1.00, 1.00]1.00 ± 0.001–11.00 [1.00, 1.00]1.00 ± 0.001–14.00 [4.00, 4.00]4.00 ± 0.004–4
Argentina31.00 [0.50, 1.00]0.67 ± 0.580–13.00 [3.00, 3.00]3.00 ± 0.003–31.00 [0.50, 1.50]1.00 ± 1.000–23.00 [2.50, 3.00]2.67 ± 0.582–38.00 [6.50, 8.50]7.33 ± 2.085–9
Australia41.00 [0.75, 1.00]0.75 ± 0.500–11.50 [0.75, 2.00]1.25 ± 0.960–20.50 [0.00, 1.00]0.50 ± 0.580–11.50 [1.00, 2.00]1.50 ± 0.581–24.50 [2.50, 6.00]4.00 ± 2.451–6
Brazil32.00 [1.50, 2.00]1.67 ± 0.581–23.00 [2.50, 3.00]2.67 ± 0.582–32.00 [1.00, 2.50]1.67 ± 1.530–32.00 [2.00, 2.50]2.33 ± 0.582–38.00 [7.00, 9.50]8.33 ± 2.526–11
Canada32.00 [1.50, 2.00]1.67 ± 0.581–23.00 [2.50, 3.00]2.67 ± 0.582–31.00 [1.00, 1.50]1.33 ± 0.581–22.00 [2.00, 2.00]2.00 ± 0.002–27.00 [7.00, 8.00]7.67 ± 1.157–9
China31.00 [1.00, 1.00]1.00 ± 0.001–13.00 [2.00, 3.00]2.33 ± 1.151–31.00 [0.50, 1.00]0.67 ± 0.580–12.00 [1.50, 2.00]1.67 ± 0.581–27.00 [5.00, 7.00]5.67 ± 2.313–7
Denmark51.00 [1.00, 2.00]1.40 ± 0.551–22.00 [2.00, 2.00]1.80 ± 1.100–31.00 [1.00, 2.00]1.20 ± 0.840–23.00 [2.00, 3.00]2.60 ± 0.552–37.00 [6.00, 9.00]7.00 ± 2.743–10
Finland22.00 [2.00, 2.00]2.00 ± 0.002–23.00 [3.00, 3.00]3.00 ± 0.003–32.00 [2.00, 2.00]2.00 ± 0.002–23.00 [3.00, 3.00]3.00 ± 0.003–310.00 [10.00, 10.00]10.00 ± 0.0010–10
Germany31.00 [1.00, 1.50]1.33 ± 0.581–23.00 [3.00, 3.00]3.00 ± 0.003–31.00 [1.00, 2.00]1.67 ± 1.151–33.00 [3.00, 3.00]3.00 ± 0.003–38.00 [8.00, 9.50]9.00 ± 1.738–11
India20.50 [0.25, 0.75]0.50 ± 0.710–11.00 [0.50, 1.50]1.00 ± 1.410–20.50 [0.25, 0.75]0.50 ± 0.710–11.50 [1.25, 1.75]1.50 ± 0.711–23.50 [2.25, 4.75]3.50 ± 3.541–6
Ireland21.00 [1.00, 1.00]1.00 ± 0.001–13.00 [3.00, 3.00]3.00 ± 0.003–32.00 [2.00, 2.00]2.00 ± 0.002–22.50 [2.25, 2.75]2.50 ± 0.712–38.50 [8.25, 8.75]8.50 ± 0.718–9
Italy30.00 [0.00, 0.50]0.33 ± 0.580–11.00 [1.00, 1.00]1.00 ± 0.001–10.00 [0.00, 0.50]0.33 ± 0.580–11.00 [1.00, 1.50]1.33 ± 0.581–22.00 [2.00, 3.50]3.00 ± 1.732–5
Japan60.50 [0.00, 1.00]0.50 ± 0.550–12.00 [2.00, 2.00]1.83 ± 0.411–20.00 [0.00, 0.00]0.17 ± 0.410–12.00 [1.25, 2.00]1.83 ± 0.751–34.50 [3.25, 5.75]4.33 ± 1.632–6
Kenya10.00 [0.00, 0.00]0.00 ± 0.000–02.00 [2.00, 2.00]2.00 ± 0.002–20.00 [0.00, 0.00]0.00 ± 0.000–01.00 [1.00, 1.00]1.00 ± 0.001–13.00 [3.00, 3.00]3.00 ± 0.003–3
Mexico22.00 [1.50, 2.50]2.00 ± 1.411–32.50 [2.25, 2.75]2.50 ± 0.712–32.00 [1.50, 2.50]2.00 ± 1.411–32.50 [2.25, 2.75]2.50 ± 0.712–39.00 [7.50, 10.50]9.00 ± 4.246–12
Morocco11.00 [1.00, 1.00]1.00 ± 0.001–13.00 [3.00, 3.00]3.00 ± 0.003–31.00 [1.00, 1.00]1.00 ± 0.001–12.00 [2.00, 2.00]2.00 ± 0.002–27.00 [7.00, 7.00]7.00 ± 0.007–7
New
Zealand
11.00 [1.00, 1.00]1.00 ± 0.001–12.00 [2.00, 2.00]2.00 ± 0.002–21.00 [1.00, 1.00]1.00 ± 0.001–11.00 [1.00, 1.00]1.00 ± 0.001–15.00 [5.00, 5.00]5.00 ± 0.005–5
Norway23.00 [3.00, 3.00]3.00 ± 0.003–33.00 [3.00, 3.00]3.00 ± 0.003–32.50 [2.25, 2.75]2.50 ± 0.712–33.00 [3.00, 3.00]3.00 ± 0.003–311.50 [11.25, 11.75]11.50 ± 0.7111–12
Poland10.00 [0.00, 0.00]0.00 ± 0.000–02.00 [2.00, 2.00]2.00 ± 0.002–20.00 [0.00, 0.00]0.00 ± 0.000–02.00 [2.00, 2.00]2.00 ± 0.002–24.00 [4.00, 4.00]4.00 ± 0.004–4
South Africa20.50 [0.25, 0.75]0.50 ± 0.710–12.00 [2.00, 2.00]2.00 ± 0.002–20.50 [0.25, 0.75]0.50 ± 0.710–12.00 [2.00, 2.00]2.00 ± 0.002–25.00 [4.50, 5.50]5.00 ± 1.414–6
South Korea41.00 [1.00, 1.00]1.00 ± 0.001–12.00 [2.00, 2.00]2.00 ± 0.002–21.00 [1.00, 1.00]1.00 ± 0.001–11.00 [0.75, 1.25]1.00 ± 0.820–25.00 [4.75, 5.25]5.00 ± 0.824–6
Spain41.00 [1.00, 1.25]1.25 ± 0.501–22.50 [2.00, 3.00]2.50 ± 0.582–31.00 [1.00, 1.25]1.25 ± 0.501–22.50 [2.00, 3.00]2.50 ± 0.582–37.50 [6.75, 8.25]7.50 ± 1.296–9
Switzerland23.00 [3.00, 3.00]3.00 ± 0.003–33.00 [3.00, 3.00]3.00 ± 0.003–32.50 [2.25, 2.75]2.50 ± 0.712–33.00 [3.00, 3.00]3.00 ± 0.003–311.50 [11.25, 11.75]11.50 ± 0.7111–12
UK50.00 [0.00, 0.00]0.00 ± 0.000–01.00 [1.00, 1.00]0.80 ± 0.450–10.00 [0.00, 0.00]0.00 ± 0.000–01.00 [1.00, 2.00]1.40 ± 0.551–22.00 [2.00, 3.00]2.20 ± 0.841–3
USA41.00 [0.75, 1.25]1.00 ± 0.820–23.00 [2.50, 3.00]2.50 ± 1.001–31.00 [0.75, 1.25]1.00 ± 0.820–23.00 [2.75, 3.00]2.75 ± 0.502–38.00 [6.75, 8.50]7.25 ± 2.993–10
Ukraine11.00 [1.00, 1.00]1.00 ± 0.001–13.00 [3.00, 3.00]3.00 ± 0.003–31.00 [1.00, 1.00]1.00 ± 0.001–12.00 [2.00, 2.00]2.00 ± 0.002–27.00 [7.00, 7.00]7.00 ± 0.007–7
Table 5. Mann–Whitney U tests comparing Core (n = 37) and Validation (n = 33) groups across CCVI dimensions (CONSEN scores). Reported are median [IQR], mean ± SD, U statistic, raw and FDR-adjusted p-values, and two effect size measures. A12 = Vargha–Delaney effect size (probability that a randomly selected Validation score exceeds a Core score). A12_CI95 = 95% bootstrap confidence interval for A12. Cliff’s δ = standardized effect size ranging from −1 (all Core > Validation) to +1 (all Validation > Core); values near 0 indicate negligible effects. Cliff’s δ_CI95 = 95% bootstrap confidence interval for δ.
VariableCCVEGSTRATCONCCVI Total
N_Core3737373737
N_Validation3333333333
Core_Median [IQR]1.00 [1.00, 1.00]2.00 [1.00, 3.00]2.00 [1.00, 3.00]1.00 [0.00, 1.00]6.00 [3.00, 8.00]
Validation_Median [IQR]1.00 [0.00, 1.00]2.00 [2.00, 3.00]2.00 [2.00, 3.00]1.00 [0.00, 2.00]6.00 [4.00, 8.00]
Core_Mean±SD1.00 ± 0.711.95 ± 0.972.08 ± 0.860.97 ± 0.876.00 ± 3.00
Validation_Mean±SD1.09 ± 0.982.36 ± 0.742.06 ± 0.701.03 ± 0.956.55 ± 2.94
U616.0464.5632.0598.0557.0
p_raw0.9490.0670.7920.8810.531
A120.5050.3800.5180.4900.456
A12_CI95[0.379, 0.631][0.262, 0.504][0.392, 0.642][0.361, 0.619][0.322, 0.594]
Cliffs_d0.009−0.2390.035−0.020−0.088
Cliffs_d_CI95[−0.242, 0.262][−0.477, 0.007][−0.216, 0.284][−0.278, 0.238][−0.355, 0.188]
p_FDR0.9490.3350.9490.9490.949
Table 6. Kruskal–Wallis tests comparing CCVI dimensions and the Total score across major geographical regions (Europe North, Europe South, America North, America South, Africa, Asia, Oceania). Reported are H statistics and raw p-values; significant results (*) indicate overall regional differences.
VariableGroupsHp_raw
CCOceania, America South, Europe North, Europe South, Asia, America North, Africa9.2910.158
VEGOceania, America South, Europe North, Europe South, Asia, America North, Africa12.6240.049 *
CONOceania, America South, Europe North, Europe South, Asia, America North, Africa9.30.157
STRATOceania, America South, Europe North, Europe South, Asia, America North, Africa21.4980.001 *
Total CCVIOceania, America South, Europe North, Europe South, Asia, America North, Africa15.2970.018 *
Table 7. Dunn-type pairwise comparisons of CCVI dimensions and the Total score across geographical regions (Europe North, Europe South, America North, America South, Africa, Asia, Oceania). Reported are Mann–Whitney U statistics, raw p-values, and FDR-adjusted p-values. Significant results highlight which regional pairs account for the overall differences detected by the Kruskal–Wallis tests. * = significant at 95% level.
VariableGroup1Group2Up_rawp_FDR
CCAmerica NorthAfrica37.50.041 *0.427
CCAsiaAmerica North38.00.026 *0.427
CONAsiaAmerica North35.00.020 *0.307
CONEurope NorthAsia246.50.029 *0.307
STRATAmerica NorthAfrica37.50.030 *0.078
STRATAmerica SouthAfrica25.50.044 *0.102
STRATAmerica SouthAsia79.50.013 *0.058
STRATAsiaAmerica North27.00.006 *0.058
STRATEurope NorthAfrica89.00.023 *0.074
STRATEurope NorthAsia279.50.001 *0.026 *
STRATOceaniaAmerica North5.00.014 *0.058
STRATOceaniaAmerica South3.00.025 *0.074
STRATOceaniaEurope North16.50.010 *0.058
Total CCVIAmerica NorthAfrica38.00.044 *0.131
Total CCVIAmerica SouthAfrica26.50.043 *0.131
Total CCVIAmerica SouthAsia82.50.011 *0.119
Total CCVIAsiaAmerica North21.00.004 *0.082
Total CCVIEurope NorthAsia251.00.027 *0.131
Total CCVIOceaniaAmerica North4.50.019 *0.131
Total CCVIOceaniaAmerica South3.50.042 *0.131
VEGAmerica SouthAsia80.50.010 *0.112
VEGAmerica SouthEurope South34.00.049 *0.202
VEGAsiaAmerica North39.00.045 *0.202
VEGOceaniaAmerica North6.50.027 *0.191
VEGOceaniaAmerica South1.50.011 *0.112
Table 8. Spearman correlations showed that all four CCVI dimensions were positively and significantly associated with each other and with the Total score (all p < 0.001 after FDR correction). Internal consistency Cronbach’s α = 0.888 and strong item–total correlations (ρ = 0.733–0.827), confirming that the four dimensions form a coherent and reliable index. * = significant at 95% level.
Spearman Correlations
Var1Var2rhop_rawp_FDR
CCVEG0.6260.000 *0.000 *
CCCON0.8410.000 *0.000 *
CCSTRAT0.660.000 *0.000 *
CCTotal CCVI0.8740.000 *0.000 *
VEGCON0.7070.000 *0.000 *
VEGSTRAT0.6870.000 *0.000 *
VEGTotal CCVI0.8670.000 *0.000 *
CONSTRAT0.6360.000 *0.000 *
CONTotal CCVI0.9050.000 *0.000 *
STRATTotal CCVI0.8520.000 *0.000 *
Cronbach’s alpha, item–total correlations
DimensionItem–total rho (Spearman)Item–total p_rawAlpha if item deletedOverall Cronbach’s alpha
CC0.8020.000 *0.8430.888
VEG0.7570.000 *0.873
CONN0.8270.000 *0.831
STRAT0.7330.000 *0.875
Disclaimer/Publisher’s Note: The statements, opinions and data contained in all publications are solely those of the individual author(s) and contributor(s) and not of MDPI and/or the editor(s). MDPI and/or the editor(s) disclaim responsibility for any injury to people or property resulting from any ideas, methods, instructions or products referred to in the content.