Article

Non-Semantic Multimodal Fusion for Predicting Segment Access Frequency in Lecture Archives

1
Graduate School of Advanced Science and Technology, Japan Advanced Institute of Science and Technology, Nomi 923-1292, Ishikawa, Japan
2
R&D Section, J-MAX Co., Ltd., Kamiishizu, Ogaki 503-1601, Gifu, Japan
3
Center for Innovative Distance Education and Research, Japan Advanced Institute of Science and Technology, Nomi 923-1292, Ishikawa, Japan
*
Authors to whom correspondence should be addressed.
Educ. Sci. 2025, 15(8), 978; https://doi.org/10.3390/educsci15080978 (registering DOI)
Submission received: 24 April 2025 / Revised: 25 July 2025 / Accepted: 26 July 2025 / Published: 30 July 2025

Abstract

This study proposes a non-semantic multimodal approach to predict segment access frequency (SAF) in lecture archives. Such archives, widely used as supplementary resources in modern education, often consist of long, unedited recordings that are difficult to navigate and review efficiently. The predicted SAF, an indicator of student viewing behavior, serves as a practical proxy for student engagement. The increasing volume of recorded material renders manual editing and annotation impractical, making the automatic identification of high-SAF segments crucial for improving accessibility and supporting targeted content review. The approach focuses on lecture archives from a real-world blended learning context, characterized by resource constraints such as no specialized hardware and limited student numbers. The model integrates multimodal features from instructor’s actions (via OpenPose and optical flow), audio spectrograms, and slide page progression—a selection of features that makes the approach applicable regardless of lecture language. The model was evaluated on 665 labeled one-minute segments from one such course. Experiments show that the best-performing model achieves a Pearson correlation of 0.5143 in 7-fold cross-validation and 61.05% average accuracy in a downstream three-class classification task. These results demonstrate the system’s capacity to enhance lecture archives by automatically identifying key segments, which aids students in efficient, targeted review and provides instructors with valuable data for pedagogical feedback.

1. Introduction

Online learning originated in the 19th century through correspondence education and has evolved significantly in today’s digital age through advances in computer and Internet technologies. The emergence of Open Education Resources (OER) and Massive Open Online Courses (MOOCs) has fundamentally transformed educational accessibility (Saykili, 2018). While the trend toward online education was already growing, the COVID-19 pandemic accelerated this transformation to unprecedented levels, with UNESCO reporting approximately 862 million students, almost half of the world’s student population, affected by school closures across 107 countries (Abuhammad, 2020). This global shift prompted higher education institutions worldwide to rapidly adopt online learning platforms. Even after the pandemic has subsided, most institutions continue to rely on widely adopted online learning platforms, making it increasingly important to enhance the accessibility and effectiveness of recorded lecture archives. Lecture archives are integral to blended learning, enabling students to combine in-person instruction with flexible online review. This study examines a practical blended learning scenario where students attend face-to-face lectures and selectively revisit key segments of unedited recordings to enhance learning efficiency.
Among these blended learning resources, lecture archives, which are complete recordings of face-to-face lectures without editing, have become an increasingly common practice in higher education institutions, especially in countries like the United Kingdom and the United States. For instance, lecture capture is now a common feature in UK universities (Lamb & Ross, 2022), and earlier surveys already showed that a majority of institutions had deployed such solutions by 2014 (Walker et al., 2014). Similarly, high adoption rates are reported in the US, where one study found 95% of responding medical schools regularly record lectures (Khong et al., 2025). This popularity primarily stems from their cost-effectiveness and ease of distribution. In Japan, the Japan Advanced Institute of Science and Technology (JAIST) also exemplifies this trend, having systematically recorded face-to-face lectures through their Learning Management System since 2006, thereby creating an extensive archive for supplemental learning (Hasegawa et al., 2007). However, the unedited, long-form nature of these recordings presents significant hurdles. Beyond the practical difficulties for instructors in manually editing and managing such large volumes of content, they often prove inefficient for student learning. For instance, students can find it difficult to maintain attention throughout extended viewing periods (Guo et al., 2014; Sablić et al., 2021), and contemporary research indicates that the key to enhancing learning with long-form material is not merely shortening it, but providing a meaningful, navigable structure (Seidel, 2024).
This raises the practical question of how to identify which segments learners find most meaningful. While direct measures of cognitive engagement, such as eye tracking or user self-reporting, are often impractical in real-world educational environments, behavioral indicators derived from interaction data offer a promising alternative. Equating “meaningful” segments with “high-engagement” segments, inferred from viewing patterns, provides a scalable approach to improving the accessibility and effectiveness of lecture archives. For example, Guo et al. proposed the use of engagement time—the duration students spend watching a video—as a proxy for interest (Guo et al., 2014).
Building upon this idea, Bulathwela et al. (2020) introduced the VLEngagement dataset, which estimates video-level engagement by computing a normalized viewing duration aggregated across large numbers of users. Specifically, they defined Engagement Score = Average Watch Time/Video Duration, providing a cost-effective and scalable labeling method for large collections of educational videos. However, the engagement labels in this dataset are defined at the whole-video level, resulting in a coarse granularity that limits its applicability to tasks such as segment-level attention modeling or highlight extraction.
Inspired by these approaches, this study proposes to use segment access frequency (SAF) as a more fine-grained and context-appropriate measure of engagement. This metric, calculated from the number of playback events associated with each time segment, provides a practical and scalable solution that does not depend on semantic content or specialized hardware. It is particularly suitable for classroom lecture recordings, which typically lack rich annotations or auxiliary sensors.
This study focuses on lecture archives recorded in real classroom environments in higher educational institutions. These settings are often resource-constrained, which defines the core challenges we address. Specifically, the recordings themselves are typically unedited, capturing the instructor with a fixed, ceiling-mounted camera and microphone, which can result in audio quality that is too noisy or indistinct for reliable automatic transcription. Furthermore, the context of their use is also constrained: the archives serve a small number of learners from a single course, and the viewing data from these learners is collected without any auxiliary hardware such as eye-tracking devices. One representative example of such a setting is the video archive system accumulated at JAIST, where face-to-face lectures are routinely recorded and made available through the institutional LMS. Building on this setting, prior work by Sheng et al. (2022) presented at AIED 2022 initially explored the feasibility of predicting focal periods using access logs, based on a set of manually extracted features and relatively simple models. However, that study lacked systematic comparisons and did not incorporate advanced fusion strategies. Building upon this early validation, the present study significantly extends their prior work through improved feature design, structured fusion methods, and comprehensive model benchmarking.
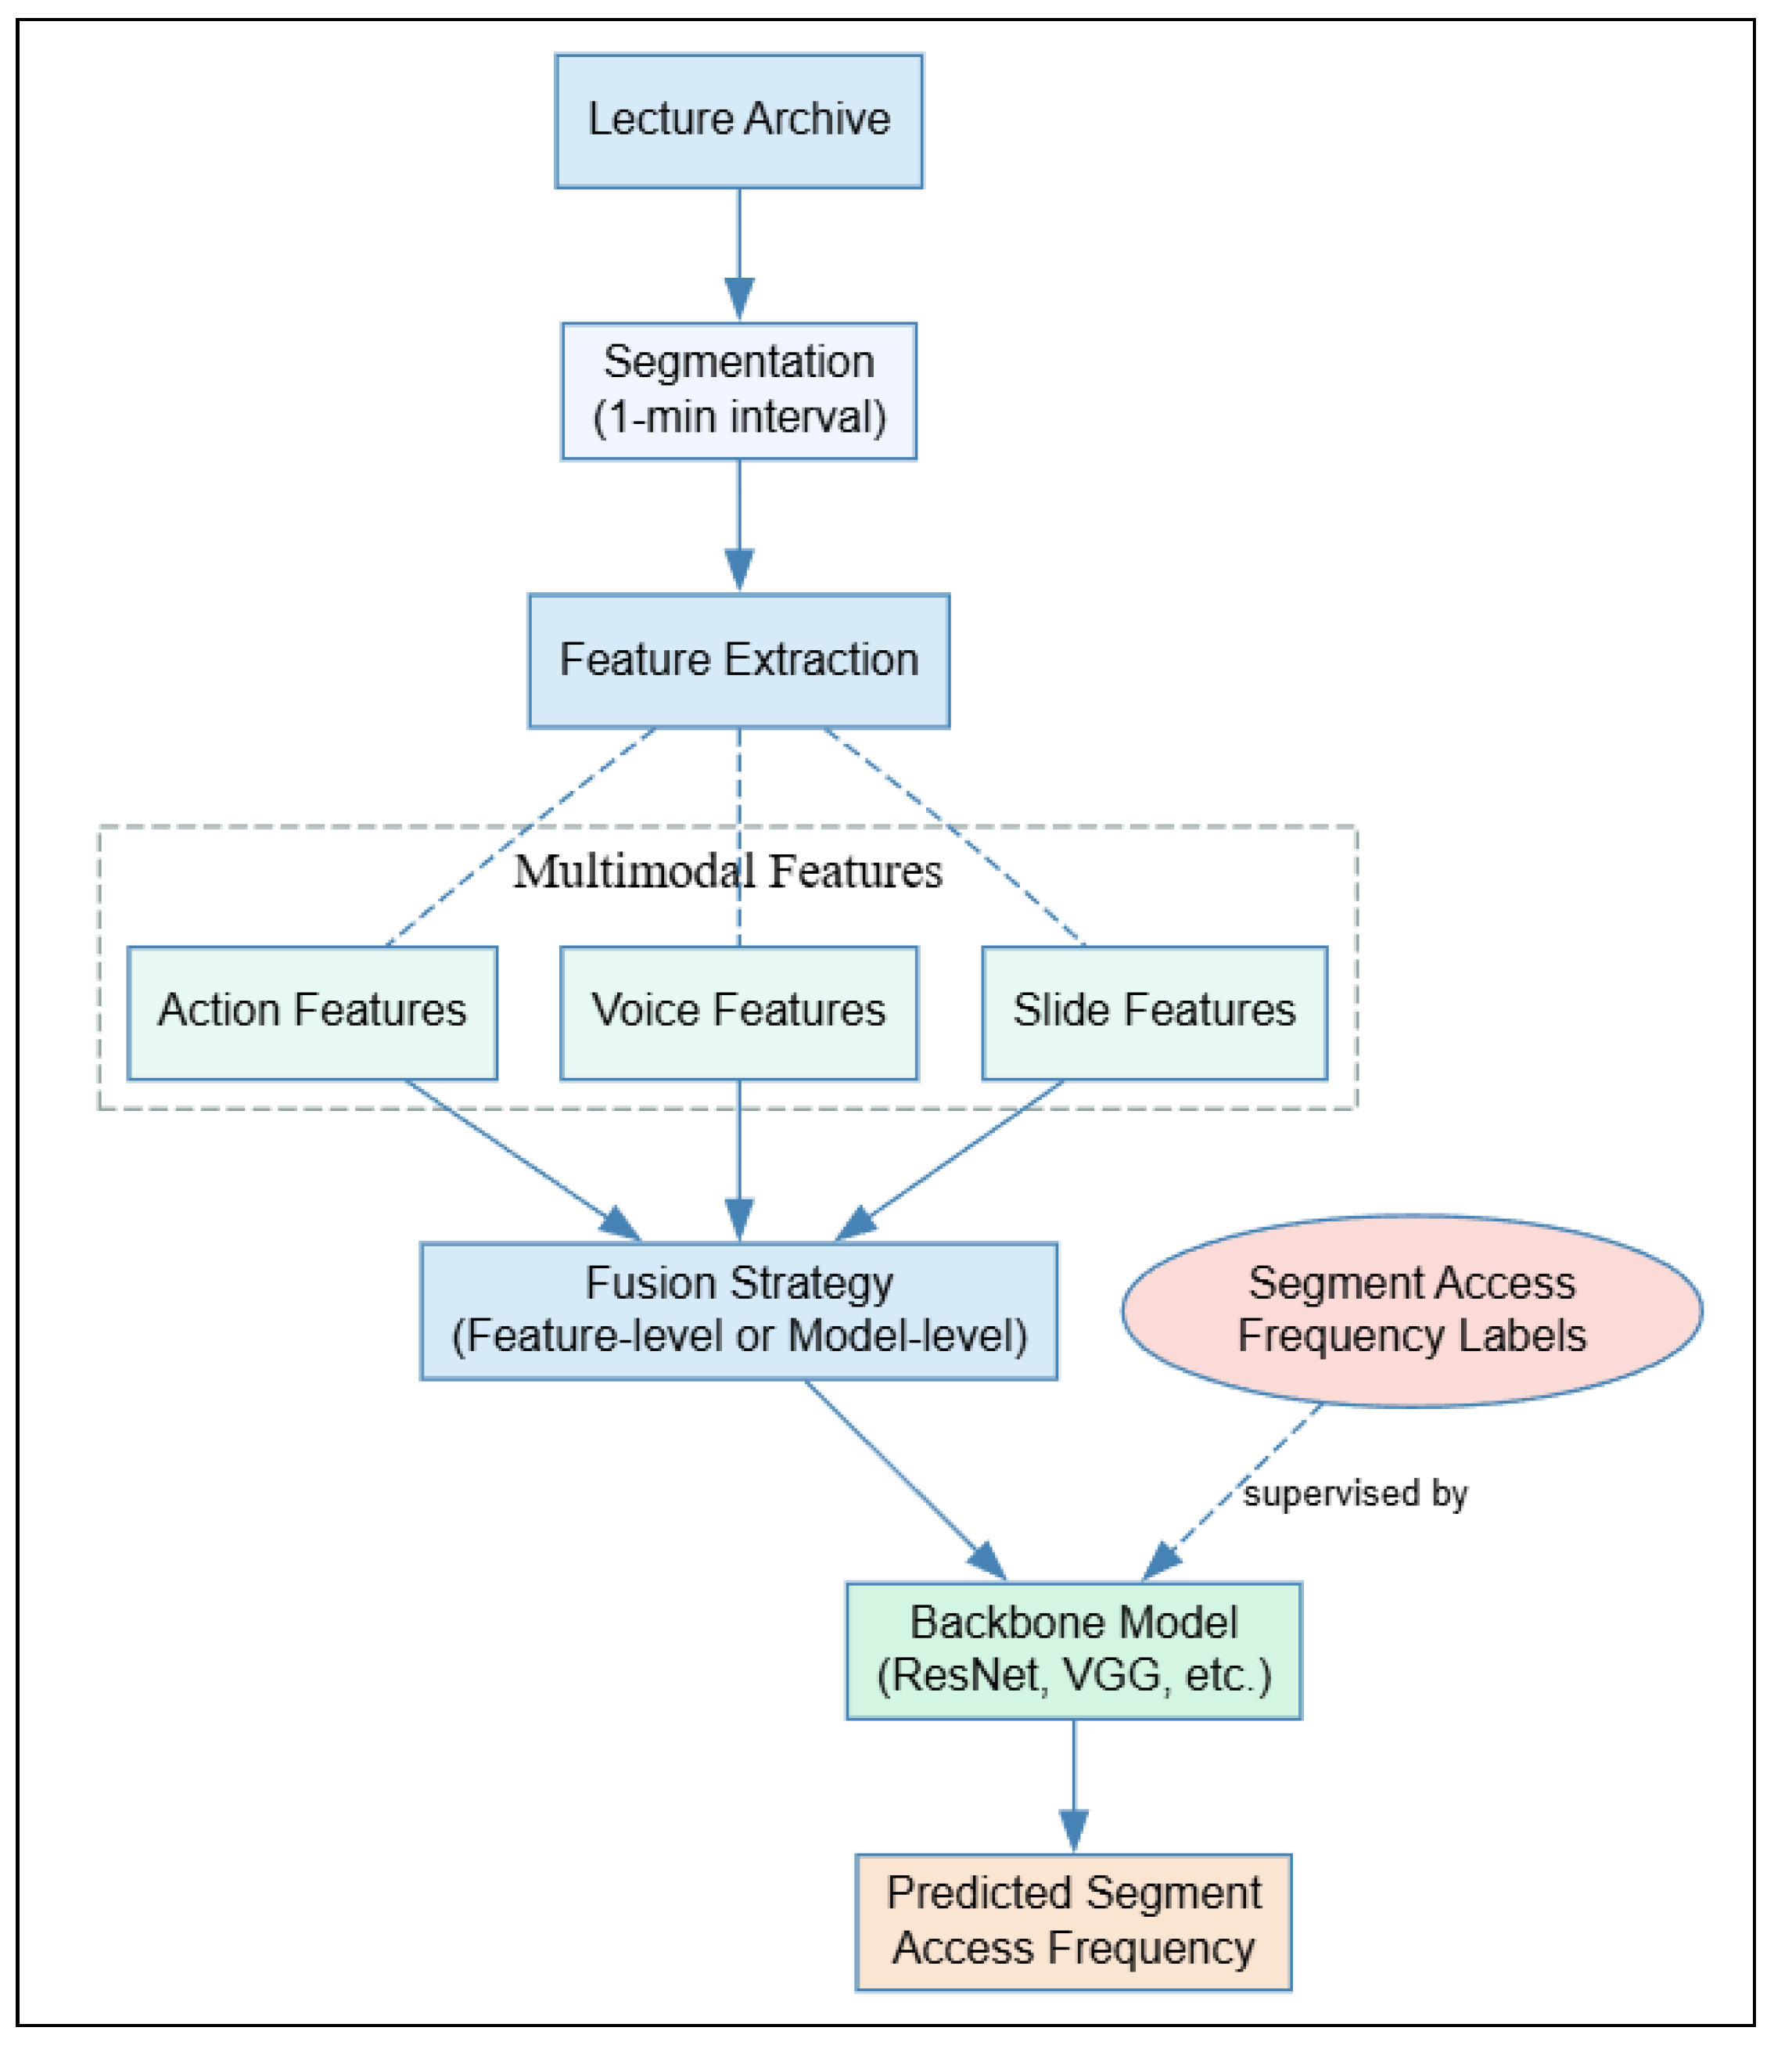
This study aims to develop a lightweight and efficient prediction method based on non-semantic multimodal features to address the challenges of such resource-limited settings. This approach is designed to avoid semantic dependence, enable cross lingual adaptability, and minimize training costs for estimating durations with high SAF in lecture archives. Furthermore, by generating SAF labels automatically from aggregated playback data, the system is intended to support scalable deployment in practical educational contexts.
To systematically validate the feasibility and optimize the design of such a non-semantic framework, this study is therefore guided by the following research questions:
  • Main Research Question: Can segment access frequency (SAF) in lecture archives be accurately predicted using only non-semantic multimodal features, derived from real-world recordings without transcripts or semantic annotation?
  • Sub RQ1: Which non-semantic modality—action, voice, or slide—contributes most to SAF prediction accuracy, and how do combinations of these modalities affect performance?
  • Sub RQ2: Which fusion strategy and neural network backbone provide the optimal balance of prediction accuracy and computational efficiency in resource-constrained educational settings?
To address these research questions, this study makes the following contributions:
  • The proposal of a language-independent prediction framework for estimating Segment Access Frequency (SAF) based on non-semantic features. This lightweight framework functions without relying on semantic understanding or specialized equipment.
  • A comparative analysis of fusion strategies, which demonstrates the superiority of early feature fusion for achieving higher prediction accuracy and training efficiency in resource-limited scenarios.
  • A comprehensive ablation and backbone analysis that identifies the dominant contribution of instructor action features and confirms the effectiveness of ResNet-based architectures for this task.

2. Literature Review

This study is situated at the intersection of two areas: video summarization and student engagement modeling. While video summarization focuses on selecting key content segments, engagement modeling aims to estimate which parts of a lecture attract student attention. This section reviews representative works from both directions to clarify the foundation and scope of the non-semantic, engagement-driven approach.

2.1. Video Summarization

Modern educational platforms offer learners extensive access to recorded lecture videos, prompting the need for technologies to enhance the efficiency of video-based learning (Benedetto et al., 2024). Video summarization addresses this need by enabling educators and students to quickly discern the educational value within lengthy recordings. It generates concise representations of video content through combinations of still images, short segments, visual diagrams, or textual annotations. Early research proposed rule-based methods for extractive summaries, typically selecting representative keyframes, segments, or transcript snippets (Alaa et al., 2024; Dimitrova, 2004).
With advancements in machine learning, deep learning models have gained prominence in video summarization. Recent studies have developed sophisticated approaches tailored to diverse video types. For instance, Singh and Kumar (Singh & Kumar, 2024) introduced a deep learning framework integrating Bayesian fuzzy clustering with a Deep Convolutional Neural Network (Deep CNN), optimized via a hybrid Lion-Deer Hunting (LDH) algorithm. Their approach significantly improved crowd video datasets’ precision, recall, and F1-score. However, it is designed for dynamic scenes with dense motion and clear foreground and background separation, contrasting sharply with the static camera angles, minimal motion, and subtle engagement cues typical of lecture archives. These differences necessitate distinct design considerations for educational contexts.
On the other hand, Kim et al. emphasize the need to move beyond traditional semantic or content-only analyses, advocating for the use of interaction data to optimize video design and highlighting the pedagogical value of editing videos for brevity and improved engagement (Kim et al., 2014).
Various time-series models leveraging recurrent architectures have been explored for video summarization. Agyeman et al. (2019) developed a hybrid model combining three-dimensional Convolutional Neural Networks (3D-CNN) with Long Short-Term Memory (LSTM) layers to classify events in soccer videos, achieving 96.8% accuracy. While effective for sports and surveillance videos with rapid scene changes, such models are less suitable for lecture archives, which feature limited visual variation, sparse motion, and extended durations. Moreover, the high computational cost of training recurrent neural networks (RNNs) on long videos poses practical challenges for resource-constrained educational settings. To improve summarization performance without heavy temporal modeling, some recent methods have focused on enhancing input representation: Tan et al. (2024) used adaptive clustering to extract more meaningful keyframes. In contrast, Khan et al. (2024) introduced multi-scale feature maps to capture both detailed and semantic-level information.
In the education field, Andra and Usagawa (Andra & Usagawa, 2019) summarized lecture videos through an Attention-based Recurrent Neural Network (RNN) that combines segmentation with the summarization process. The RNN architecture generates a natural summary by capturing critical words and conveying a lecture’s central message through attention-based weighting and linguistic features. However, their method significantly depends on semantic analysis of lecture content. Such transcripts are not always available for lecture archives, and the accuracy of existing Automatic Speech Recognition (ASR) techniques is not always satisfactory for audio data with noise and precise terminology. Moreover, the limited availability of annotated data for lecture videos poses another challenge for such methods.
To address the issue of limited annotated data, Vimalaksha et al. (2018) provided a mechanism to segment lecture videos into multiple parts based on crowdsourcing. While this approach alleviates the annotation problem to some extent, manual crowdsourcing methods have their own limitations. They require real-time recording, are labor-intensive, and have strict time synchronization requirements, making them prone to bias. Therefore, despite the contribution of crowdsourcing methods, there remains a need for more generalized approaches to effectively tackle the annotation problem for lecture videos, particularly in contexts with limited resources and multilingual content as addressed in the current research.

2.2. Student Engagement and Attention

Student engagement is crucial in higher education, yet fostering active participation in online learning environments remains a persistent challenge (Vermeulen & Volman, 2024). To address this issue, researchers have examined various instructional and content-related factors that may influence how students interact with lecture materials.
For instance, embedded semantic approaches have been developed to enhance student interaction within classroom settings. Deng and Gao explore how embedding questions within pre-class instructional videos influences learners’ experiences and outcomes in a flipped classroom context (Deng & Gao, 2024). Interestingly, their study revealed no discernible effect on learning performance but did find that the embedded questions significantly reduced students’ total viewing time. Indeed, this illustrates that semantic analysis primarily focuses on textual content and overlooks learner interactions with the video, such as pausing, rewinding, or skipping sections. These behaviors provide crucial insights into attention patterns and engagement levels, which semantic methods cannot capture.
On the other hand, several studies have explored the design of video lectures without treating semantic features as a key element for promoting engagement. For example, Chen and Wu investigated the impact of different video lecture formats on learning outcomes, cognitive load, and emotional responses (Chen & Wu, 2015). Their findings suggest that featuring instructors on screen not only enhances students’ sense of connection but also reduces cognitive overload. This highlights the importance of visual presence and presentation style in maintaining student attention and fostering participation in online learning environments.
With regard to visual presence and presentation style, Shi et al. examined how instructors’ visual attention and lecture delivery styles influence students’ perceived engagement and academic performance across various instructional formats (Shi et al., 2024). Similarly, Zhang et al. employed eye-tracking and visualization technologies to investigate the effects of different instructional delivery styles on student viewing behavior (Zhang et al., 2018). Their analysis showed that students were more responsive to auditory cues—such as pauses and vocal emphasis—than to visual elements like gestures or slide transitions. Collectively, these studies underscore the importance of instructor-related features—both visual and auditory—in shaping student engagement with lecture content. In particular, they highlight the pivotal role of auditory cues in sustaining attention during recorded lectures, even when visual presence is emphasized. These findings suggest that integrating non-semantic instructional features, such as visual presence and vocal modulation, is instrumental in directing learners’ attention toward key concepts in a lecture.
In addition to instructor behavior, students’ behavioral data has also been used to examine engagement at scale. Kim et al. (Kim et al., 2014) conducted a large-scale analysis of video interaction patterns in MOOCs and identified several recurring behaviors—such as replaying specific moments and revisiting explanation-heavy segments—as signals of focused engagement. Such naturally occurring patterns provide a foundation for scalable engagement modeling based on interaction data, without requiring semantic understanding or manual annotation.

2.3. The Position of This Work

This study focuses on estimating high-SAF segments in lecture videos by analyzing non-semantic multimodal features. While SAF is not a direct measurement of cognitive engagement or attention, it serves as a practical behavioral proxy that reflects students’ selective rewatching behavior with minimal overhead. Unlike most existing approaches that rely on semantic content analysis, this work emphasizes how students interact with lecture materials through their actual viewing behaviors. This approach offers three main advantages: it is applicable across different languages as it does not require semantic understanding, it reduces the need for manual annotation by utilizing access logs, and it identifies lecture segments with high access frequency as derived from real usage patterns. By combining features extracted from instructor actions, voice, and slides with patterns of student interaction, the method provides a lightweight and flexible solution for identifying high-SAF segments in real educational settings.

3. Research Design and Methodology

This study proposes a lightweight and scalable system to predict SAF in real classroom lecture archives. The overall workflow, illustrated in Figure 1, consists of four main stages. First, the lecture archives are segmented into uniform time intervals. Second, multimodal features not relying on semantic content—including instructor actions, voice spectrograms, and slide transitions—are extracted from each segment. Third, a deep neural network based backbone model fuses and processes these features. Finally, the model outputs predictions of SAF, supervised by labels automatically generated from aggregated access logs. Notably, the entire pipeline, from feature extraction to label generation can be fully automated without manual intervention. The system is designed to operate efficiently in resource-constrained environments without relying on semantic analysis or specialized hardware.

3.1. Dataset

3.1.1. Lecture Archives

The lecture archives used in this research were recorded from the I239 Machine Learning course offered through the JAIST Learning Management System (JAIST-LMS). The course consisted of seven lessons, each recorded to support students’ reflection and supplemental learning following face-to-face instruction. The archives were distributed via the LMS on the campus network within a few hours after the course, and students were able to skip and watch the lectures freely. A ceiling-mounted camera with a fixed angle and a ceiling microphone captured both the instructor’s and students’ voices. The video files were recorded at 1920 × 1080 resolution and 30 frames per second. Each lesson lasted approximately 100 min. The archives included the podium area, whiteboard, and instructor. In addition, the slide content was integrated into the right-bottom corner of the archives, as shown in Figure 2.

3.1.2. Label Generation

The JAIST-LMS extends Video.js to track students’ access to specific durations of lecture archives. Based on this detailed playback history, SAF labels were generated, defined as the number of times each one-minute segment was accessed across all users.
When finding the important durations for students to watch, they repeatedly skip and briefly view segments of the archives. Such behavior causes noise in the labeling of high-SAF segments. To reduce such noise and ensure data reliability, raw viewing records shorter than one minute were first excluded. The total valid viewing time per student was then computed, and only students who watched more than five minutes of a given lecture were retained and labeled as valid viewers. Segment access frequencies were calculated by aggregating only these valid viewers’ logs.
After data filtering, Table 1 shows that the label dataset is extremely limited in size. On average, each lecture has only 8.71 valid viewers. This is likely because students had already attended the face-to-face class sessions, and the archives were mainly used as a review resource. In such cases, students may choose to revisit only selected parts of the lecture or rely on other materials, such as textbooks or slides, for review. As a result, the overall number of archive viewers is low.
However, this type of review behavior may also indicate stronger learning intent. According to Kim et al. (2014), students who engage in repeated viewing tend to show more focused and high-peak interaction patterns compared to first-time viewers. These behaviors are often goal-driven, as students selectively locate and revisit important parts of the content. Therefore, although the dataset is small, the SAF signals it captures may be more concentrated and meaningful, providing a robust basis for identifying high-SAF segments.
To further adapt the data for model training, the non-instructional portions at the beginning and end of each video were removed. All lecture archives were trimmed or padded to a standardized length of 95 min, focusing exclusively on instructional content. Each archive was then divided into one-minute segments. The SAF for each segment was calculated by summing the number of valid viewers who accessed it.
A centered moving average with a five-segment window was applied to the raw frequency sequence to suppress short term fluctuations. This method averages two preceding and two succeeding values around each time point, thereby enhancing local trend stability while preserving temporal structure. Such symmetric moving averages are widely adopted in time-series analysis to extract smooth trend-cycle components from noisy data (Hyndman & Athanasopoulos, 2018).
The resulting values were then normalized within each lecture by dividing by the maximum segment frequency, yielding SAF labels in the range of [0, 1]. In total, 665 labeled segments were obtained across the seven lectures for subsequent model training and evaluation. The SAF labels were automatically generated from raw csv format access logs through a batch-processing script, eliminating the need for manual annotation.
To illustrate how SAF patterns are aligned with different lecture structures, the distributions for Lesson 1 and Lesson 4 are presented as contrasting examples. Figure 3 and Figure 4 illustrate the processed SAF distributions for Lesson 1 and Lesson 4, respectively. In Lesson 1, the SAF remains low during the initial 30 min, this part consists of basic concepts and course schedule. A sharp increase is observed between minutes 40 and 60, corresponding to the explanation of the Version Space Algorithm—a relatively complex and central topic of the lecture. The SAF then drops around the 70-min mark, coinciding with a break period, before rising again as the lecture resumes. Toward the end of the session, SAF decreases as the class concludes.
In contrast, Lesson 4 exhibits a different pattern. The SAF peaks within the first 15 min, during which the instructor explains the steps for solving example questions. In the remainder of the lecture, a live demonstration using Google Colab is presented. As this portion focuses on practical execution, students are more likely to engage with the shared Colab notebook directly, rather than watching the video again. Consequently, the SAF gradually declines and remains low until the end.
These examples confirm that SAF patterns are closely aligned with lecture content and structure. Peaks and drops in SAF correspond to conceptually intensive segments, breaks, or procedural demonstrations, supporting the validity of SAF as a proxy for student engagement. Based on these observations, the thresholds for the downstream classification task were set: values above 0.6 as high, and below 0.4 as low.

3.1.3. Evaluation Metrics

To assess the performance of the proposed system, both regression-based metrics and 3-classification accuracy are adopted for a comprehensive evaluation. For the primary task of predicting a continuous attention level, represented by normalized SAF values between 0 and 1, we employ the following standard regression metrics:
  • Mean Squared Error (MSE): Measures the average squared difference between the predicted and ground-truth values.
  • Mean Absolute Error (MAE): Computes the average magnitude of absolute prediction errors.
  • Coefficient of Determination ( R 2 ): Indicates the proportion of variance in the ground truth that is explained by the predictions.
  • Pearson Correlation Coefficient (PCC): Evaluates the linear correlation between predicted and ground-truth sequences, reflecting trend similarity.
Additionally, for auxiliary evaluation, we compute the 3-classification accuracy by categorizing SAF values as: High (>0.6), Medium (0.4–0.6), and Low (<0.4).
These SAF thresholds follow the observations discussed in the previous subsection. While the division remains relatively coarse, it offers a simple and interpretable way to evaluate model performance as an auxiliary metric. Given that the primary task is regression, the three-class accuracy serves solely as a supplementary indicator, supporting downstream tasks such as heatmap generation. Future work will explore more adaptive thresholding strategies and finer-grained classification schemes.

3.2. Feature Extraction and Preprocessing

3.2.1. Action Features (A)

According to the previous study by Zhang et al. (2018), the behavior of the instructor influences the attention of students. Therefore, the instructor’s action in the archive segments was obtained by the optical flow (Burton & Radford, 1978), the pattern of apparent motion of objects, surfaces, and edges in each segment caused by the relative motion between observer and scene.
However, the optical flow could not work well because the corner point is always generated on the slide rather than the instructor in a default setting. To solve this problem, the students’ seating area is first masked, and then the instructor’s body structure feature is captured by OpenPose (Cao et al., 2019), the first open-source real-time system available to detect multi-person 2D poses, including body, feet, hands, and facial key points. Next, the optical flow for the instructor’s action is calculated based on the captured body structure. The Lucas-Kanade method is used in this research to calculate the optical flow for every segment (Lucas & Kanade, 1981). Figure 5 shows an action feature map from a one-minute archive segment extracted by this method.

3.2.2. Voice Features (V)

According to a previous study by Wyse (2017), neural networks used in classification or regression can benefit from spectrograms which are a visual representation of the spectrum of signal frequencies as it varies with time (Flanagan, 1972). In addition, they retain more information than most hand-crafted features traditionally used to analyze voice or sound and have a lower dimension than raw data. A SciPy-based approach utilizing the spectrum function was implemented to generate spectrograms from the lecture audio. The spectrograms were computed using Fast Fourier Transform (FFT) with a window size of 1024 samples and an overlap of 128 samples between adjacent windows at a 44.1 kHz sampling rate. This configuration provides sufficient frequency resolution while maintaining temporal precision necessary for analyzing speech patterns in lecture recordings. The spectrogram generation process effectively converts the time-domain audio signal into a two-dimensional time-frequency representation, capturing both temporal and frequency characteristics of the instructor’s voice. The resulting spectrograms were then processed as feature maps for the deep learning model, as shown in Figure 6. This approach enables the model to learn from both the frequency content and temporal dynamics of the instructor’s speech, while maintaining computational efficiency.

3.2.3. Slide Features (S)

Slide transitions indicate lecture pacing and content structure, potentially influencing student engagement. To capture this, numerical features representing net slide progression are extracted, processed through a five-step pipeline to ensure temporal alignment and compatibility with other modalities.
The processing pipeline consists of five steps:
  • Net progression: For each 5-min segment i, the net forward movement is computed as:
    P raw [ i ] = max { x i } max { x i 1 } , where P raw [ i ] = 0 if the difference is negative or zero .
  • Temporal resolution adjustment: Each P raw [ i ] is repeated 5 times to form a 1-min resolution sequence:
    P 1 min = repeat ( P raw , 5 )
  • Smoothing: A moving average filter with window size 5 is applied:
    P smooth [ i ] = 1 5 j = i 2 i + 2 P 1 min [ j ]
  • Normalization: Within each lesson, the values are normalized by the lesson-wise maximum:
    P norm [ i ] = P smooth [ i ] max ( P smooth )
  • Matrix construction: Each normalized value is scaled to 8-bit and expanded into a uniform 2D matrix:
    S [ i ] = 1 h × w · int ( P norm [ i ] × 255 )
    where 1 h × w denotes a matrix of ones with spatial dimensions matching other modalities.
This design ensures that the slide feature is temporally aligned and dimensionally compatible with the action and voice feature matrices for multimodal fusion.

3.2.4. Temporal Smoothing

To enhance the temporal consistency of predictions and suppress short-term fluctuations, smoothing techniques are applied to the attention level sequences produced by the regression model. These smoothed values are subsequently used for interpretation, visualization, and threshold-based classification.
Let y [ i ] denote the predicted attention level at minute i. The following three smoothing methods are applied:
  • Moving Average: A centered rolling mean applied over a window of 5 min:
    y ^ [ i ] = 1 w j = i w / 2 i + w / 2 y [ j ] , w = 5
    This method is simple yet effective in suppressing short-term fluctuations.
  • Savitzky–Golay Filter: Implemented with a window length of 7 and a second-order polynomial, this filter performs local polynomial regression to preserve peak shapes while smoothing the signal.
  • Kalman Filter: A one-dimensional recursive Bayesian estimator was implemented using the FilterPy library, where the state transition and observation matrices were set as F = H = [ 1 ] , with an initial covariance P = 500 , measurement noise R = 0.05 , and process noise Q = 10 4 .
These methods are applied post hoc to the predicted sequences and do not affect the model training process. Among them, the moving average achieves the best trade-off between simplicity and performance in the experiments. Detailed comparisons are presented in Section 2. The smoothed sequences are also used to derive three-class attention zones via thresholding, as described in Section 3.1.3.

3.3. Model Architecture and Experimental Settings

3.3.1. Feature Fusion Strategies

Two deep learning architectures are prepared to detect the focal points of the above mentioned features. The first option, called “Feature Stacking,” converts different feature maps of each archive segment into RGB channels of a single image file. An example of such a stacked input is shown in Figure 7. Specifically, the action features extracted by OpenPose and optical flow are assigned to the R channel, the slide transition features to the G channel, and the spectrogram voice features to the B channel. This method enables the use of well-established deep learning models like VGG-16, VGG-19, ResNet-50, and ResNet-101, which have proven effective in image classification tasks. The primary advantage of this approach is its computational efficiency—by processing all features through a single network path, memory usage and training time can be significantly reduced compared to parallel processing approaches. However, this integration introduces a notable limitation: the compression of feature maps into single-channel images leads to information loss. This is particularly problematic for action features, where lines in different colors represent distinct movement trajectories of tracked corner points. When these colored trajectories are compressed into a single channel, the spatial and temporal relationships between different movement patterns may become less distinguishable, potentially degrading the model’s ability to learn complex motion patterns. The whole architecture of the feature-level fusion strategy is illustrated in Figure 8.
Another option, called “Model Stacking,” employs multiple parallel deep learning models to process different input features independently before combining, as shown in Figure 9. In this architecture, each feature type (action, slide, and voice) is processed by its own dedicated neural network, preserving the complete dimensionality and characteristics of each feature type. The outputs from these individual networks are then concatenated at their fully connected layers to produce a final prediction. While this strategy maintains the complete information of each feature map and potentially allows for feature-specific network optimization, it comes with increased computational costs. These trade-offs will be further evaluated in the experiment section, where the performance and efficiency of this approach are compared with alternative architectures.

3.3.2. Backbone Model Selection

After confirming the superiority of feature-level fusion over model-level fusion in earlier experiments, all subsequent model evaluations are conducted under the feature-level fusion setting. Specifically, several representative backbone architectures are compared to identify the most suitable model for the regression task.
The evaluated backbones include:
  • VGG-based models: VGG16 and VGG19, known for their simplicity and deep convolutional stacks without residual connections.
  • Residual networks: ResNet50 and ResNet101, which introduce skip connections to enable deeper and more stable training.
  • Transformer-based model: Vision Transformer (ViT-16), which leverages self-attention to capture global dependencies.
  • Temporal model: CNN + LSTM, combining spatial feature extraction and sequential modeling.
All models take as input a fused feature map constructed by stacking action, voice and slide modality features into a 3-channel image (480 × 320 × 3), and share a common training configuration. The evaluation is carried out using both regression metrics (MSE, MAE, R 2 , PCC) and the accuracy of the 3-classification.

3.3.3. Experimental Protocol

All models were trained and evaluated using consistent procedures to ensure fair comparison across architectures and fusion strategies. The dataset consisted of seven lecture sessions. For the initial baseline experiment involving only action features and temporal smoothing, a fixed split was used: Lesson 1–5 for training, Lesson 6 for validation, and Lesson 7 for testing. All subsequent experiments—including multimodal fusion, ablation study and backbone comparisons—adopted a 7-fold cross-validation protocol at the lesson level. In each fold, one lesson was used for testing, while the remaining six were used for training and validation.
The Adam optimizer was employed with a fixed learning rate of 1 × 10 5 and the mean squared error (MSE) was used as the loss function. The batch size was set to 16, and the maximum number of training epochs was 200. Early stopping was applied with a patience of 25 epochs based on validation loss. A fixed random seed of 42 was used to ensure reproducibility.
All experiments were implemented in PyTorch 2.6.0 and conducted on a workstation running Ubuntu 24.04. The system was equipped with an Intel Core i9-12900K processor, 128GB DDR4 RAM, and an NVIDIA RTX A6000 GPU.

4. Experiment

This section presents a series of experiments conducted to evaluate the effectiveness of the proposed prediction framework. First, the predictive capacity of instructor action features used in isolation is assessed. Then, two multimodal fusion strategies are investigated: one that combines features before input into the network (feature fusion), and another that processes each modality separately before combining outputs (model fusion). An ablation study is further conducted to examine the relative contribution of each modality. Finally, several backbone architectures are compared to identify the most effective configuration under resource constraints. All experiments are carried out using seven-fold cross-validation, and evaluated using both regression metrics and three-class accuracy.

4.1. Effectiveness of Action Features

Before introducing multimodal fusion, it was first evaluated whether action features alone could serve as a reliable predictor of student attention. As described in 
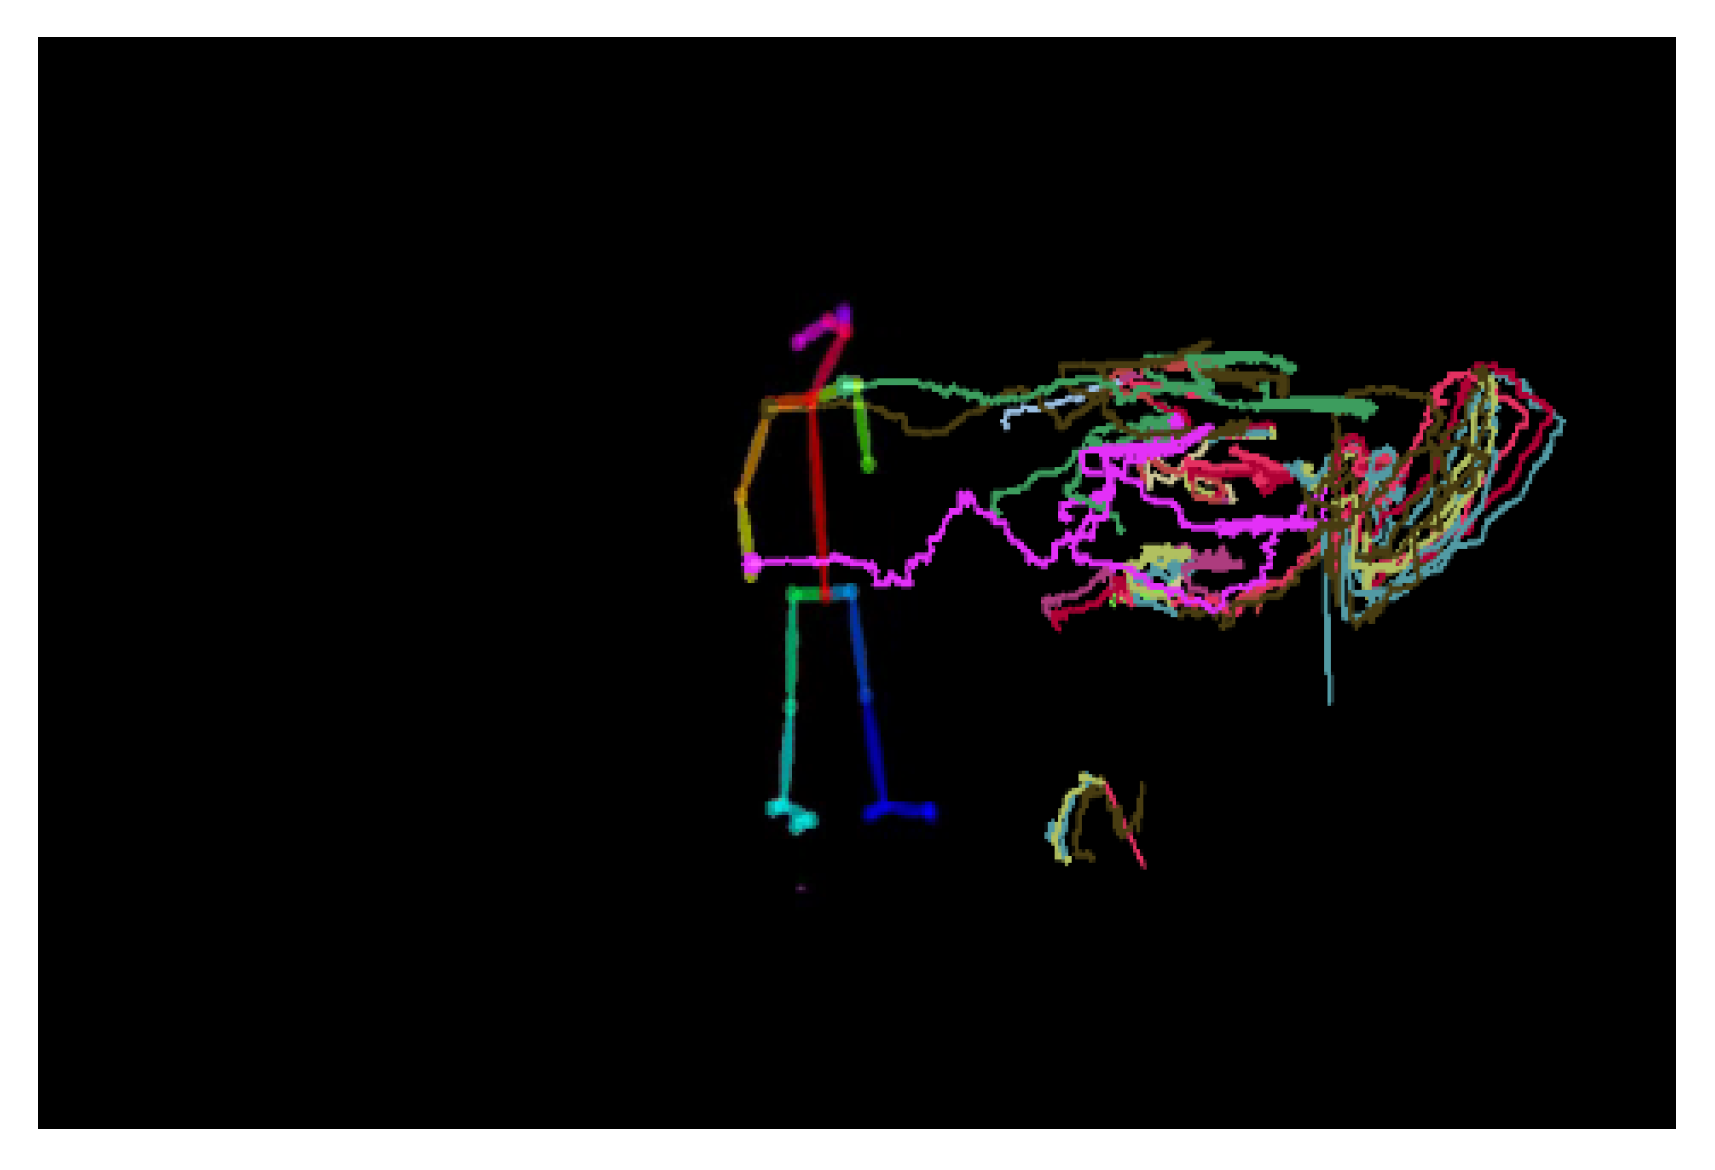
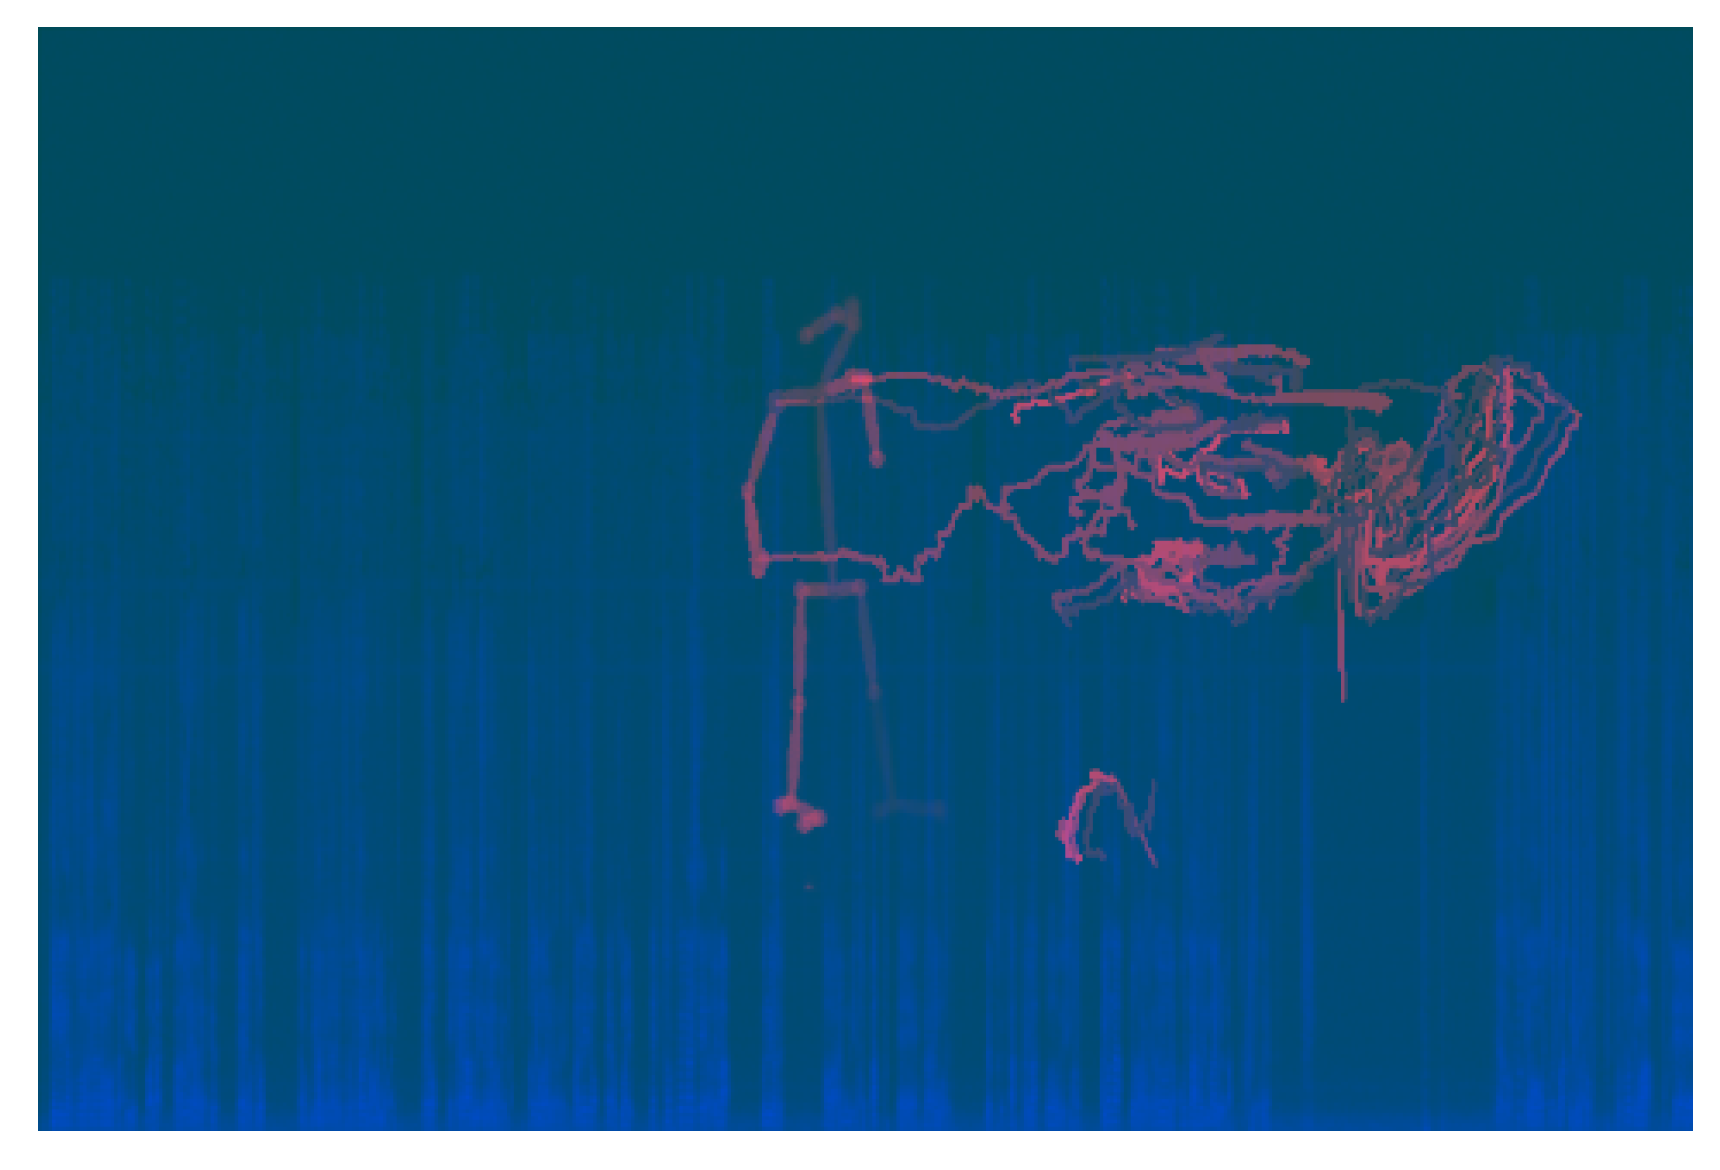
Section 3.2.1, the instructor’s motion patterns were extracted from each lecture segment using OpenPose and optical flow, resulting in time-series visual representations. These action features were then used as the sole input to a ResNet50 model.
To enhance temporal stability, three smoothing strategies were applied to the predicted attention values: Moving Average, Savitzky–Golay filter, and Kalman filter. These were compared against unsmoothed (raw) predictions. For this experiment, a fixed data split was used: Lesson 1–5 for training, Lesson 6 for validation, and Lesson 7 for testing.
The results in Table 2 confirm that the visual motion features extracted from the instructor’s body movements contain sufficient predictive signals. All four smoothing conditions achieved positive R 2 values and moderate Pearson correlation coefficients (PCC), demonstrating that the model could learn meaningful patterns from the action features even without additional modalities.
Among the smoothing methods, the moving average performed best across all metrics, suggesting it effectively suppresses noise while preserving temporal trends. Compared to more complex alternatives such as the Savitzky–Golay filter and Kalman filter, the moving average has a significantly lower computational cost and is extremely simple to implement. Its robustness, interpretability, and real-time applicability make it a strong default choice for smoothing time-series predictions in practical educational settings.

4.2. Fusion Strategies

To evaluate how different fusion strategies impact model performance, two approaches were compared: feature-level fusion and model-level fusion. Both strategies utilized all three modalities—action, voice, and slide—and employed ResNet50 as the backbone to ensure fair comparison.
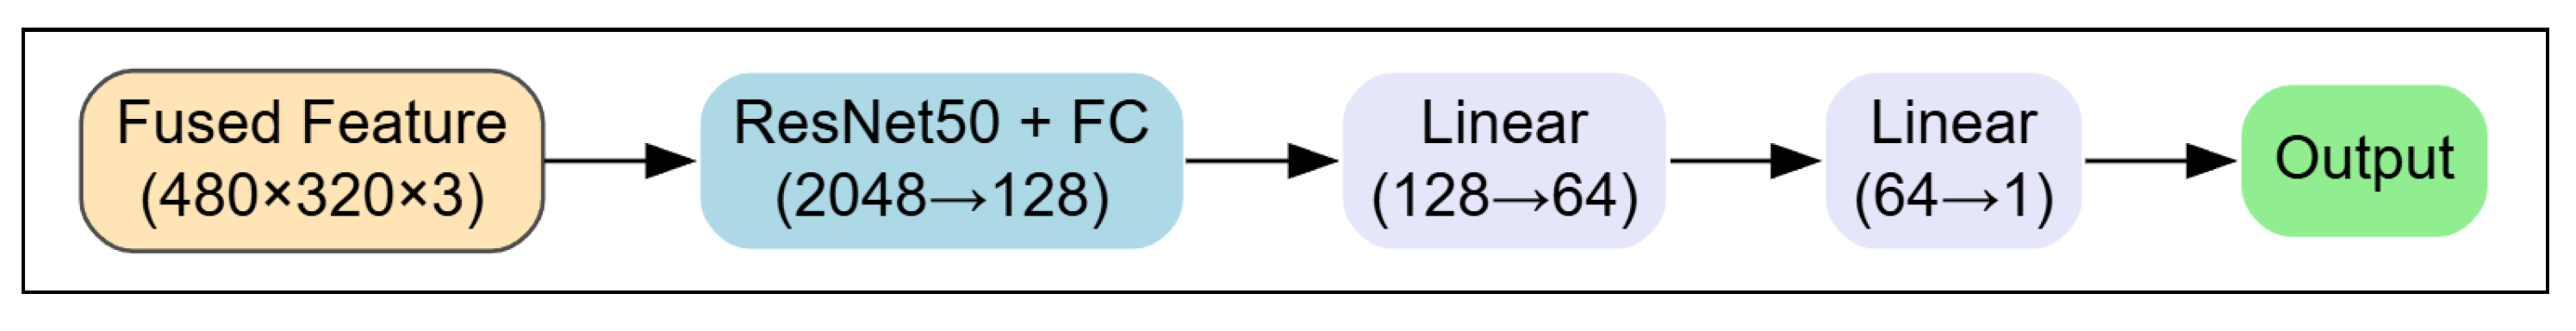
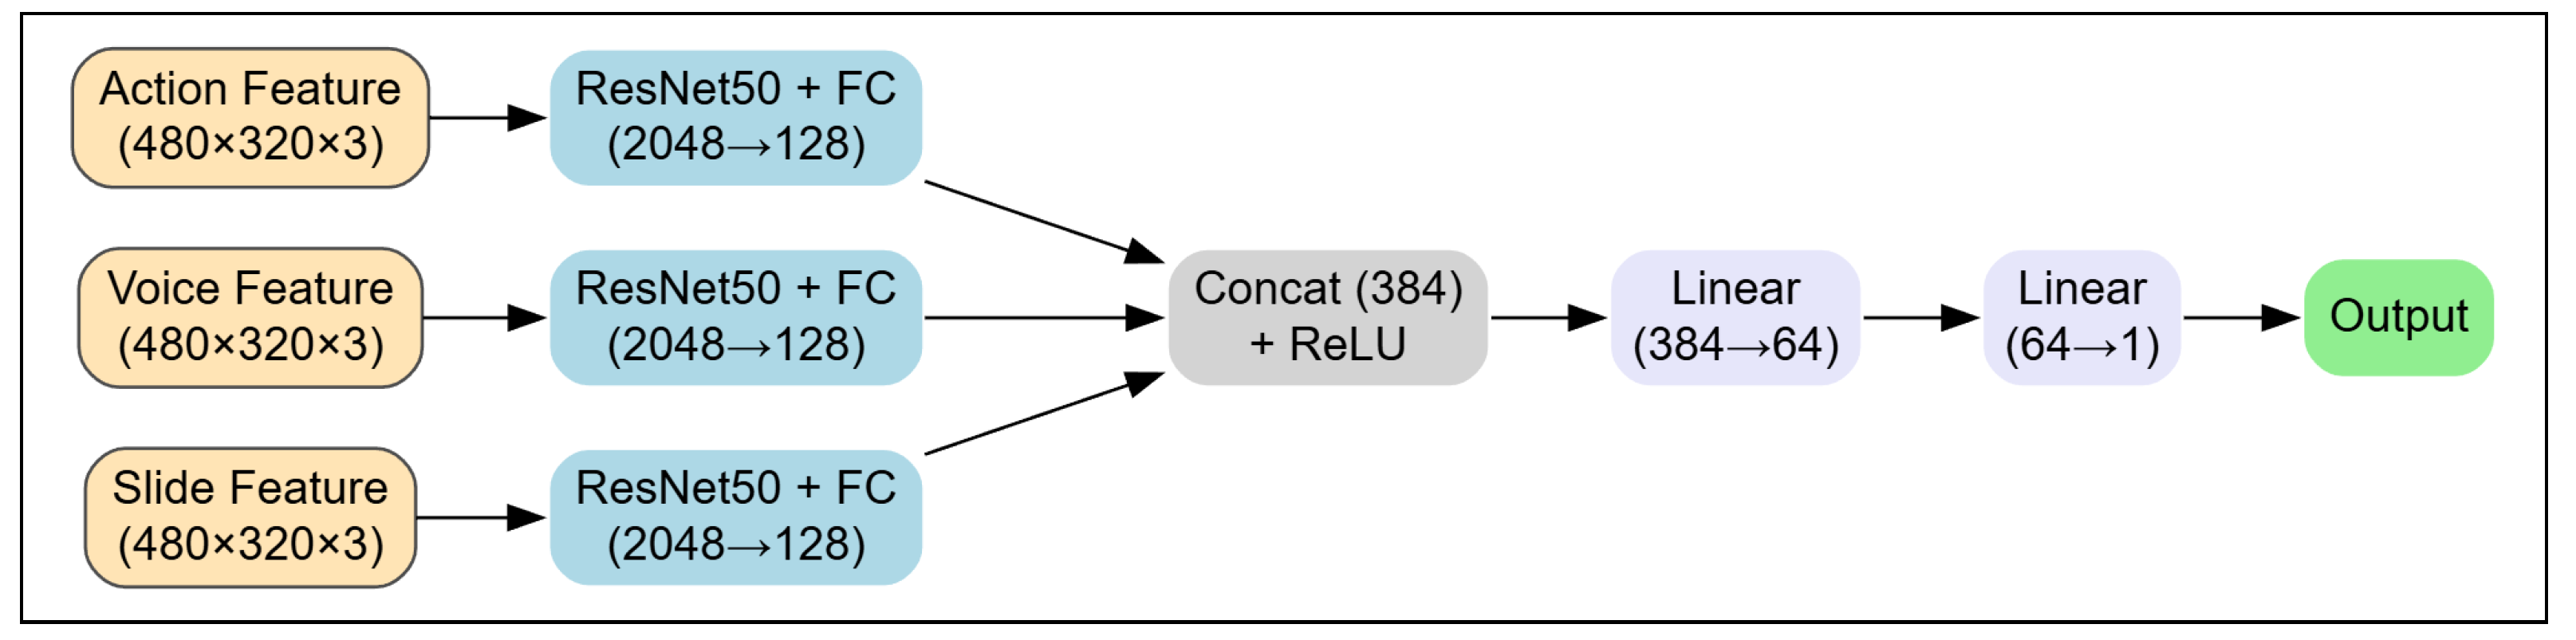
In the feature-level fusion strategy, all modality features were resized and stacked along the channel dimension to form a single RGB-like image (480 × 320 × 3), which was then passed through a single ResNet50 model. In contrast, the model-level fusion strategy assigned each modality its own dedicated ResNet50 network. The output features from each branch were concatenated and passed through a joint prediction head.
All models were trained using identical cross-validation protocols and evaluated using regression metrics (MSE, MAE, R2, PCC). Table 3 shows the results.
Table 3 shows that feature-level fusion outperforms model-level fusion across all regression metrics while requiring significantly less training time. This combination of higher accuracy and computational efficiency makes feature-level fusion a practical choice for real-time lecture archive analysis, enabling scalable deployment in educational platforms.
Despite model-level fusion’s theoretical advantages—preserving the full resolution of each feature map and enabling modality-specific encoding—it suffered from increased parameter count and training instability. These drawbacks outweigh its theoretical flexibility in this setting, where training data is limited and computational efficiency is an important consideration. Based on these comprehensive findings, feature-level fusion was adopted as the default strategy for all subsequent experiments.

4.3. Ablation Study

To further understand the contribution of each modality to the overall performance, an ablation study was conducted by systematically removing one or more modalities from the input. All experiments in this section were performed under the feature-level fusion setting using ResNet50 as the backbone model. The same cross-validation protocol and smoothing method (moving average) were applied across all conditions.
The tested combinations include the full model (A + V + S), all possible two-modality pairs (A + V, A + S, S + V), and individual modalities (A, V, S). The evaluation results are shown in Table 4.
The results show that the full model using all three modalities (A + V + S) achieved the best performance across all metrics, indicating that each modality contributes complementary information to the prediction. Among the single-modality models, action features alone performed the best, while slide features showed the weakest predictive power when used in isolation. This suggests that instructor motion contains the most informative cues, consistent with the findings in Section 4.1.
Interestingly, the combinations A + S and S + V both outperformed their constituent single-modality models, implying that even relatively weak features like slides can enhance the model when combined with stronger signals. These findings highlight the synergistic effect of multimodal fusion and support the inclusion of all three modalities in the final system design.

4.4. Backbone Model Comparison

Six backbone architectures were systematically evaluated to identify the most effective neural architecture for classroom attention prediction. All models were assessed under identical conditions: feature-level fusion with action, voice, and slide inputs, smoothing via moving average, and training with 7-fold cross-validation. The evaluated architectures span three model families: convolutional networks (VGG16, VGG19), residual networks (ResNet50, ResNet101), a transformer-based model (ViT), and a sequential hybrid (CNN + LSTM).
As shown in Table 5, ResNet50 consistently outperformed all other architectures across metrics, demonstrating the best balance between prediction accuracy and training stability. VGG16 followed closely with good consistency across folds, while VGG19 showed slightly diminished performance. Interestingly, ResNet101 underperformed despite its greater depth, likely due to overfitting on the relatively small dataset. The ViT model exhibited promising regression metrics but slightly lower classification accuracy, suggesting its global attention mechanism may require more data to realize its full potential. The CNN + LSTM architecture provided no clear advantages over purely spatial models, indicating that explicit temporal modeling offers limited benefits at the one-minute feature resolution.
Given ResNet50’s superior performance, a more detailed analysis of its fold-wise behavior was conducted to assess reliability and generalization capabilities.
Table 6 reveals considerable performance variation across the seven validation folds for ResNet50. Fold 7 demonstrated exceptional performance with the lowest MSE (0.0145), MAE (0.0951), highest R 2 (0.6376), and strongest correlation (PCC = 0.8491). However, some folds (particularly 2 and 5) yielded negative R 2 values, indicating challenges in capturing variance for certain lesson contexts. Despite these variations, the average metrics across all folds show a moderate positive correlation (PCC = 0.5143), suggesting the model can capture meaningful attention patterns even with limited training data.
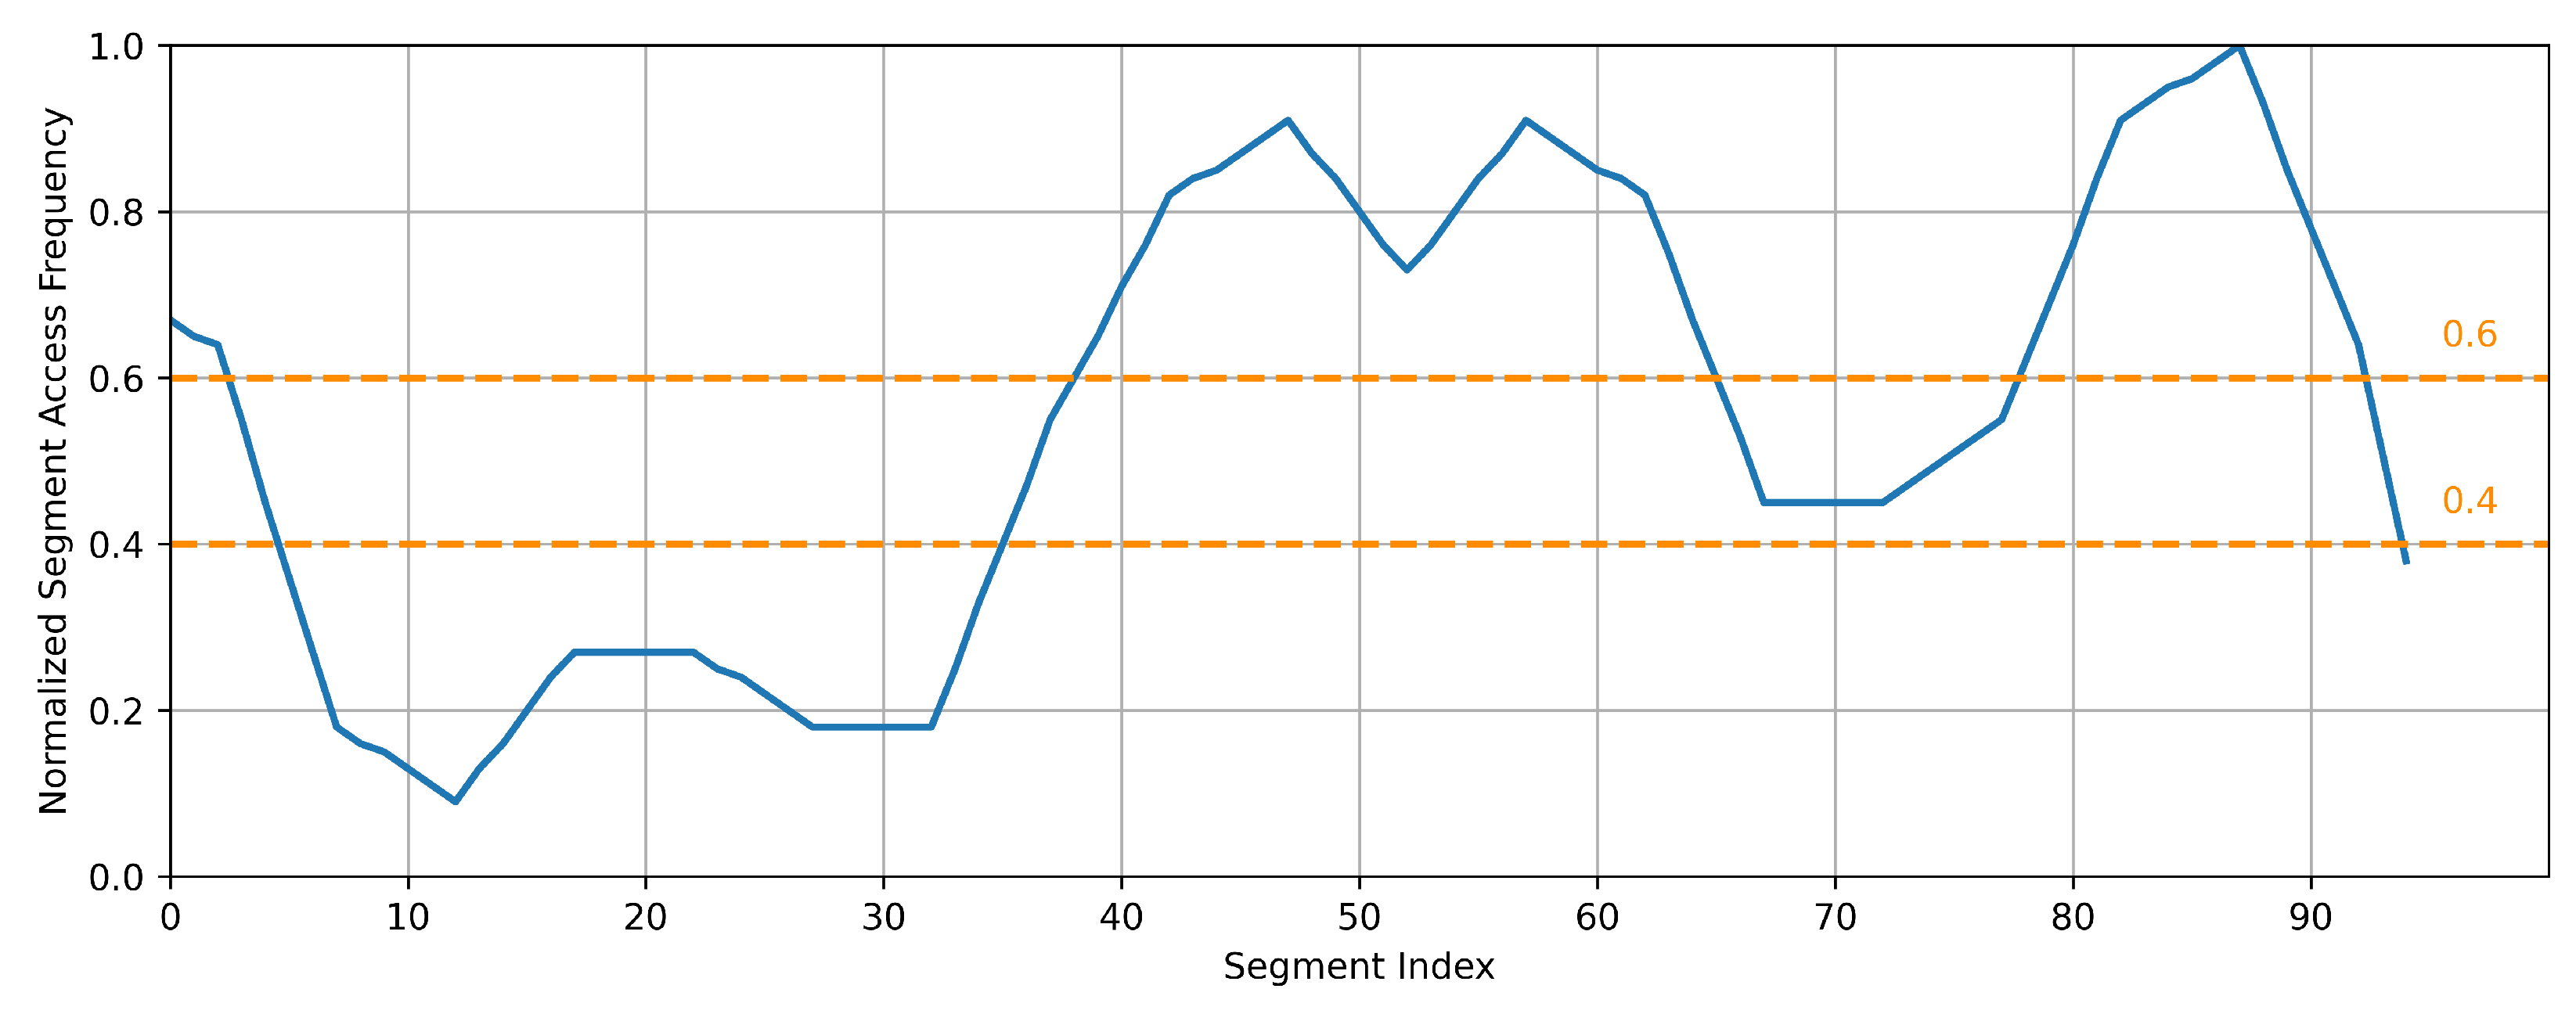
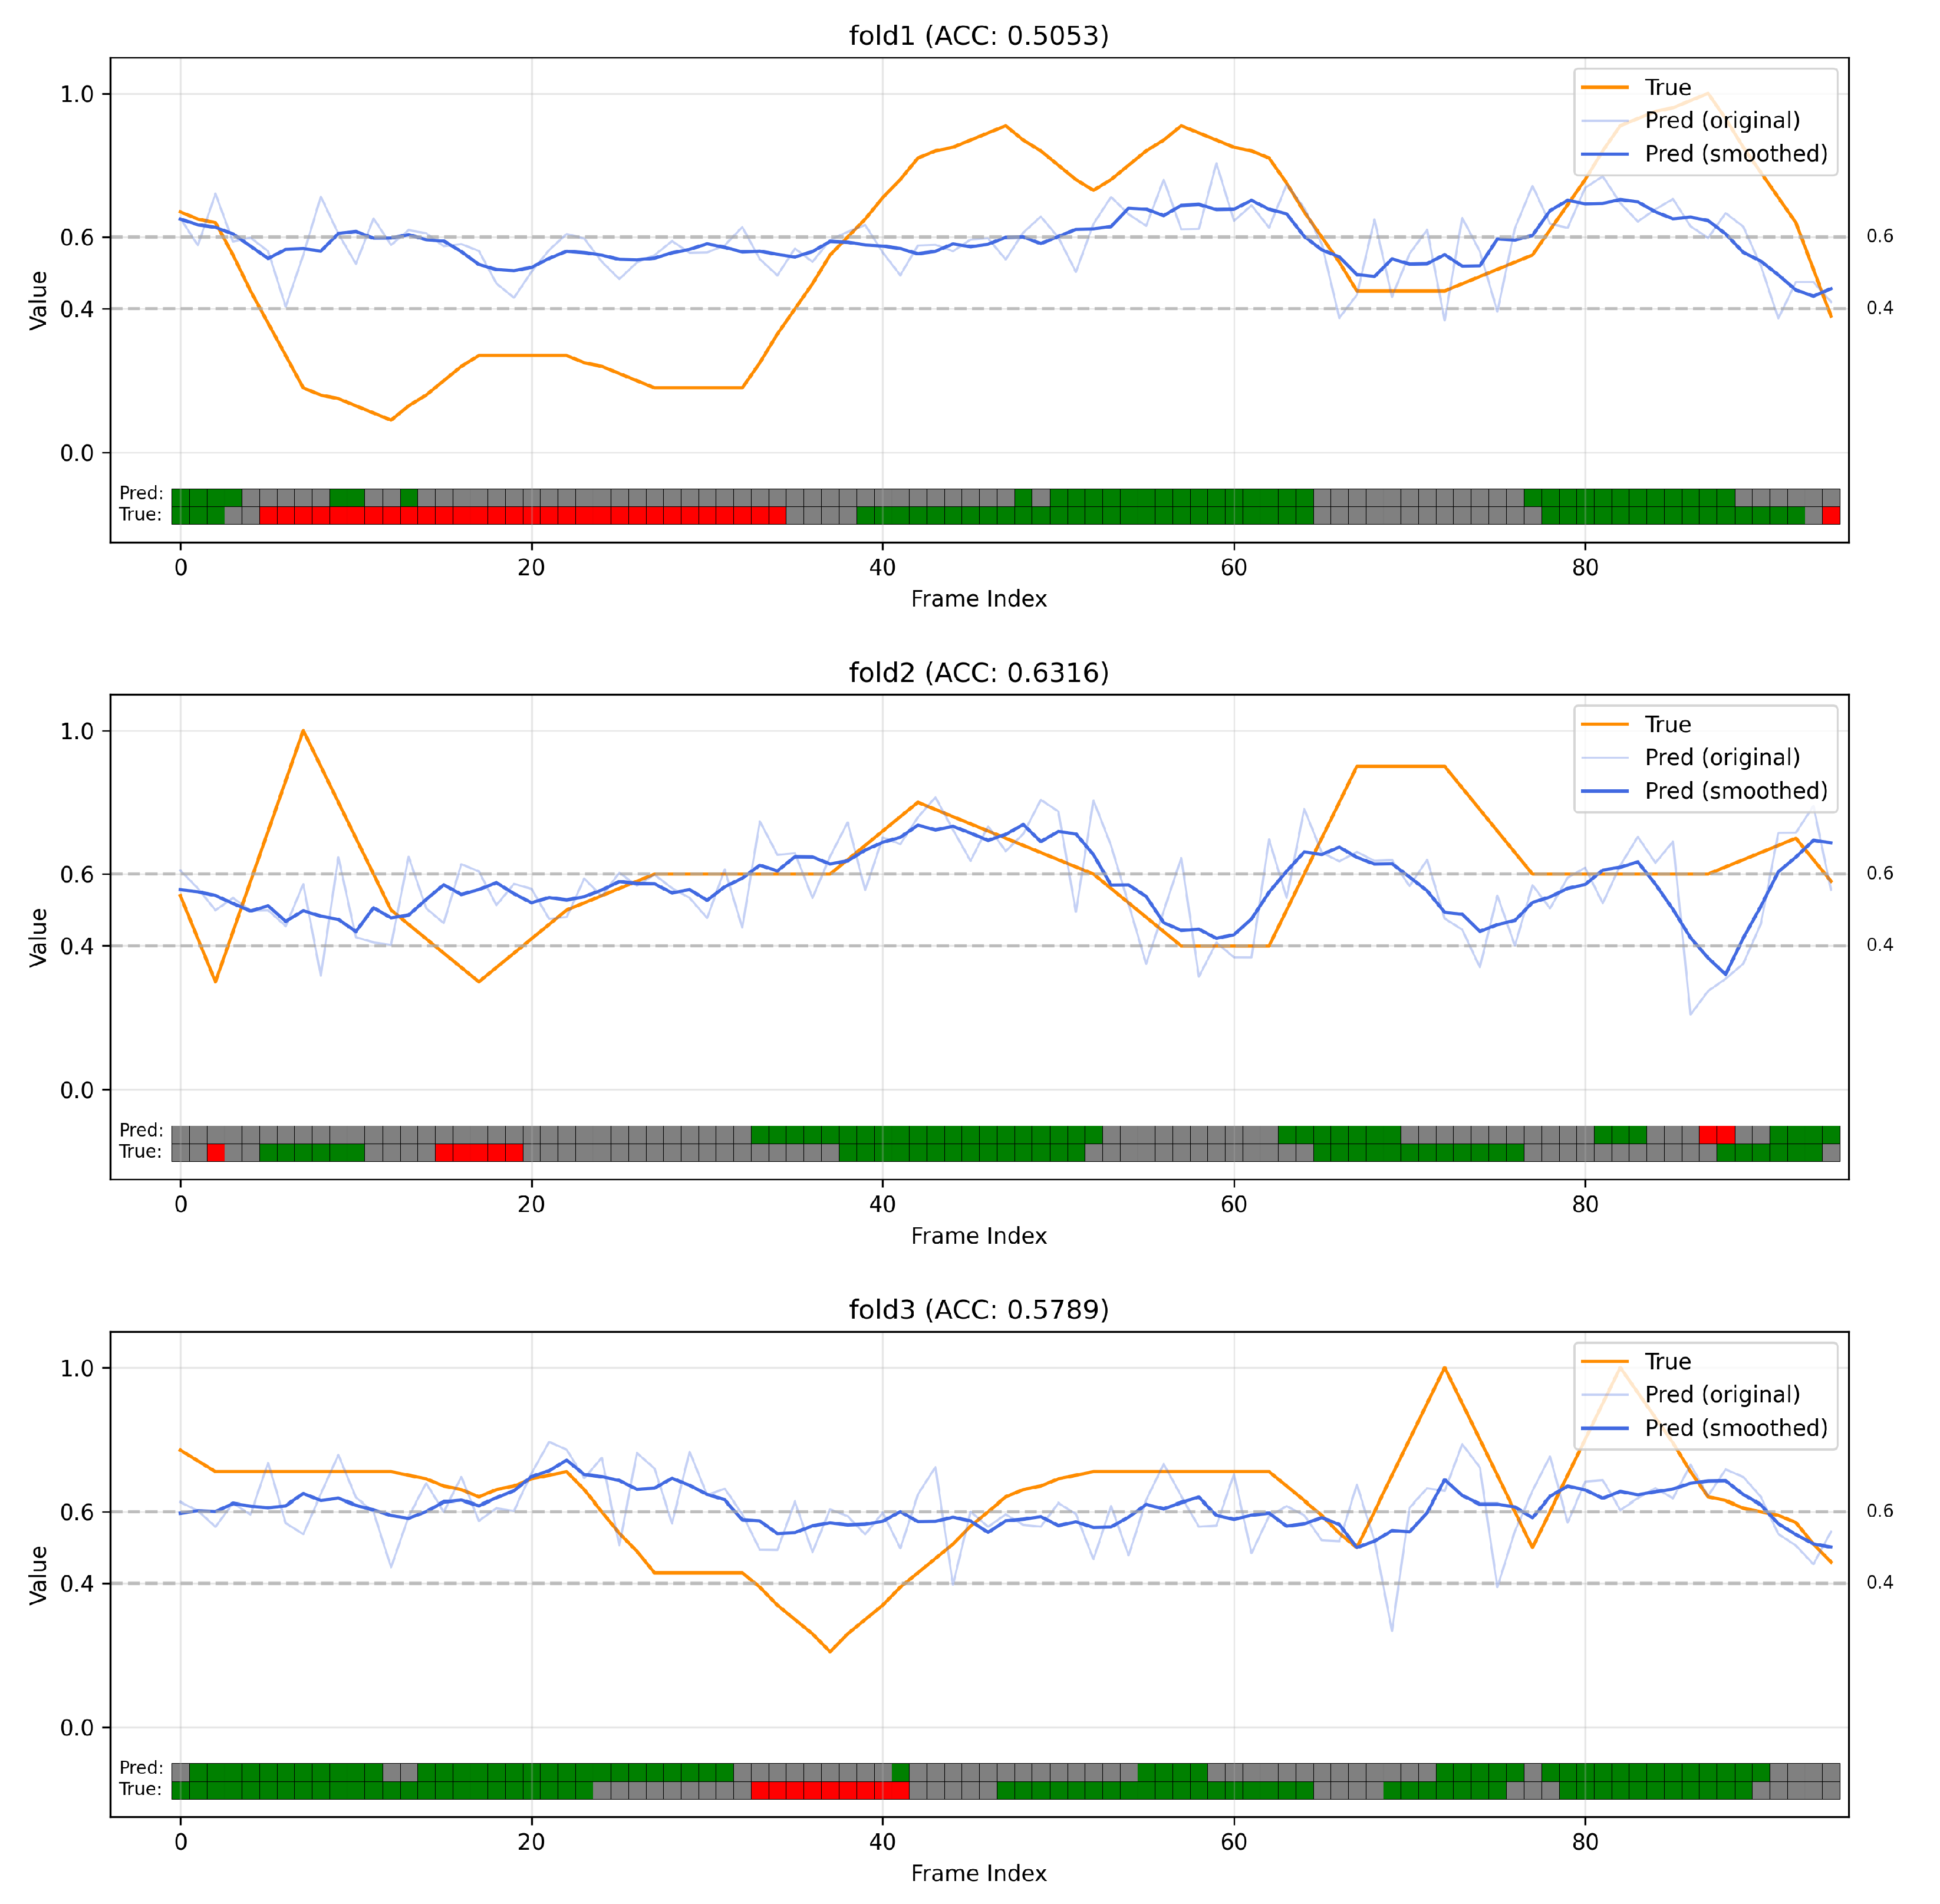
Figure 10 visually compares the predicted Segment Access Frequency (SAF) with the ground-truth labels across the seven validation folds. In each plot, the orange line represents the ground-truth SAF, the light blue line shows the raw predicted values, and the dark blue line indicates the smoothed predictions. Beneath the curves, the rectangular colored blocks display the three-class classification result for each one-minute segment: green for High-SAF, gray for Medium-SAF, and red for Low-SAF. A key observation is that the model’s predictions consistently capture the overall temporal trends of student attention—the rising and falling patterns—even when the absolute numerical accuracy varies. This is evident in folds with poor statistical metrics (e.g., Fold 5, with an R 2 of −0.3305 and 3-class accuracy of 48.42%), where the predicted curve still mirrors the general shape of the ground-truth.
This trend-capturing capability, rather than absolute value precision, is the most critical quality for the intended application. It allows the system to reliably generate an `attention heatmap’ that guides students to conceptually dense segments. The practical utility of this non-semantic approach is underscored by its performance on lessons with known content peaks. For instance, the predicted peak in Fold 1 aligns with the ground truth for Lesson 1, corresponding to the explanation of the Version Space Algorithm, while the peak in Fold 4 correctly identifies the initial segment of Lesson 4, where the instructor demonstrates problem-solving steps. This alignment demonstrates that the model can effectively distinguish high-engagement segments from lulls in the lecture, which is the primary goal for enhancing archive navigation.
These results confirm that ResNet50 offers the most reliable foundation for the multimodal attention prediction framework, providing an optimal balance between prediction accuracy, generalization capability, and computational efficiency. Traditional convolutional architectures—particularly ResNet50 and VGG16—appear well-suited for this task, while more complex models showed no clear advantages under the experimental constraints.

5. Discussion

5.1. Addressing the Research Questions

In this section, we revisit the research questions introduced in the Introduction and evaluate how our findings address each.
Main Research Question: Can segment access frequency (SAF) in lecture archives be accurately predicted using only non-semantic multimodal features, derived from real-world recordings without transcripts or semantic annotation?
The results confirm that non-semantic features can effectively predict SAF despite limited data. The full multimodal approach achieved a Pearson correlation of 0.5143 and 61.05% three-class classification accuracy in 7-fold cross-validation (Table 3 and Table 5). Even using only instructor action features yielded a significant correlation (PCC = 0.5464, Table 2). These findings validate the hypothesis that SAF can be meaningfully predicted without semantic content understanding, even with an extremely limited dataset averaging only 8.71 valid viewers per lecture (Table 1).
Sub RQ1: Which non-semantic modality—action, voice, or slide—contributes most to SAF prediction accuracy, and how do combinations of these modalities affect performance?
The ablation study (Table 4) revealed that instructor action features performed best in isolation, while slide features performed worst. However, any dual-modality combination outperformed its constituent single-modality models, with the full tri-modal fusion achieving optimal results. This confirms the complementary nature of the selected modalities and highlights the primary contribution of instructor actions.
Sub RQ2: Which fusion strategy and neural network backbone provide the optimal balance of prediction accuracy and computational efficiency in resource-constrained educational settings?
The experiments indicate that a combination of feature-level fusion and a ResNet50 backbone provides the optimal trade-off. Feature-level fusion significantly outperformed model-level fusion across all metrics while requiring only 23% of the training time (Table 3). Among the tested backbone architectures, ResNet50 consistently outperformed alternatives across all metrics (Table 5), providing the best balance between accuracy and computational efficiency. Deeper networks like ResNet101 showed worse performance due to overfitting. Similarly, the Vision Transformer (ViT) model did not realize its full potential, and the CNN + LSTM architecture’s explicit temporal modeling offered no significant advantages over purely spatial models at the feature resolution, demonstrating their unsuitability for the resource-constrained context.
These findings provide practical design guidelines for SAF prediction systems in educational environments with resource constraints, demonstrating the potential of non-semantic approaches for improving lecture archive accessibility. By identifying high-SAF segments, the framework enhances lecture archive usability in blended learning, supporting students’ self-directed review after face-to-face instruction and improving integration of online and in-person learning.

5.2. Practical Implications and Potential Applications

To concretely illustrate the practical utility of the framework in an authentic blended learning environment, an in-depth analysis of the results from fold 7 (corresponding to Lesson 7) is conducted, as shown in Figure 10. This lecture exhibits three distinct phases: a high-SAF zone from 0–50 min, corresponding to the explanation of complex example problems; a medium-SAF zone from 50–70 min for conceptual review; and a low-SAF zone from 70–95 min, which features a live programming demonstration. By applying the system to this 95-min lecture, a highlight summary containing only the 22 min of high-SAF segments can be generated. This compresses the content to just 23.16% of its original length, demonstrating significant information compression efficiency.
From the students’ perspective, the system’s most direct value lies in the substantial improvement of learning efficiency. This 22-min summary enables students preparing for exams to bypass lengthy review and demonstration segments, allowing them to directly access the most critical parts of the example explanations for targeted and efficient review. Furthermore, having a clear learning map helps alleviate the sense of intimidation students often feel when confronted with long lecture videos, fostering a more positive and proactive learning experience.
From the instructor’s perspective, the framework serves as a powerful tool for pedagogical diagnosis and intervention. By analyzing the SAF heatmap of existing lectures, instructors can accurately identify common student difficulties and points of confusion. More importantly, the predictive capability of the framework transcends this retrospective analysis to address the cold-start problem in pedagogical feedback. For a new lecture without any viewing data, the model can proactively generate a predicted SAF heatmap. This helps instructors anticipate potential bottlenecks and adjust their teaching materials accordingly, transforming pedagogical assessment from a reactive response into a proactive planning process.

5.3. Limitations

While the approach demonstrates the feasibility of non-semantic multimodal prediction for SAF, several limitations should be acknowledged:
  • Dataset Scope and Diversity. The experiments relied on seven lectures from a single Machine Learning course taught by one instructor, leading to performance variability across validation folds (Table 6). This constrained scope limits the model’s generalizability to diverse educational contexts, such as humanities courses or interactive teaching formats, posing challenges for broader applicability in real-world settings.
  • Engagement Measurement Indirectness. SAF serves as an indirect proxy for engagement, primarily capturing revisitation patterns rather than immediate engagement states. This metric may not fully represent the multifaceted nature of student engagement, particularly during first-time viewing, as it primarily reflects post-hoc revisitation behaviors.
  • Temporal Resolution Constraints. The one-minute segment resolution, adopted to balance granularity and computational efficiency, overlooks transient engagement peaks, such as those triggered by key explanations or student questions. This coarse temporal scale restricts the model’s precision in identifying brief, high-impact segments critical for applications like highlight extraction.
  • Non-semantic Feature Limitations. While the non-semantic approach offers cross-lingual applicability and low training costs, it inherently limits the model’s ability to capture content-driven factors that may influence segment access frequency but are not explicitly reflected in non-semantic features. For example, in the prediction results for Lesson 1 in Figure 10, the model generated moderately high SAF predictions for the first 30 min. This likely occurred because during this segment, the instructor was introducing himself, explaining the course structure and schedule—activities involving continuous speaking, writing, and movement which, without semantic understanding, appear similar to the delivery of information-dense concepts. However, in reality, this portion held little importance for students’ review purposes, leading most students to skip it and resulting in consistently low actual SAF levels.

6. Conclusions

Building on the findings summarized in Table 7, this study has successfully established a lightweight, non-semantic framework for predicting Segment Access Frequency (SAF) in real-world lecture archives. Our results confirm that it is feasible to estimate student engagement patterns from multimodal features without relying on semantic cues. The comprehensive analysis identified the optimal combination of features and model architecture for this task under resource-constrained conditions.
Compared to existing methods, the approach offers three key advantages, summarized as follows:
  • Language independence: The non-semantic feature design allows the model to be applied across different languages without requiring content understanding.
  • Suitability for educational settings with limited scale: The lightweight architecture achieves high computational efficiency and can be trained with limited dataset, such as university lecture archive.
  • Automatic label generation: SAF labels are automatically derived from access logs, eliminating the need for manual annotation or specialized hardware.
To further improve model generalization and practical value, future work will expand to more diverse instructional contexts, integrate fine-grained behavioral cues (e.g., facial expressions and gaze), and explore lightweight semantic augmentation such as OCR-based slide content. The development of downstream applications—such as SAF heatmaps and automated highlight extraction—is also aimed, which will support both learners and instructors by enhancing content navigability, instructional feedback, and lecture archive usability.

Author Contributions

R.S. and S.H. conceived the research; R.S. was responsible for data processing and experimental implementation. All authors contributed to the writing and revision of the manuscript. All authors have read and agreed to the published version of the manuscript.

Funding

This research was funded by JSPS KAKENHI Grant Number 23K28196.

Institutional Review Board Statement

Not applicable.

Informed Consent Statement

Not applicable.

Data Availability Statement

Data are not publicly available but can be obtained from the corresponding author upon reasonable request, as they are part of an ongoing study.

Conflicts of Interest

Authors Ruozhu Sheng and Jinghong Li were employed by the company J-MAX Co., Ltd. The remaining author declares that the research was conducted in the absence of any commercial or financial relationships that could be construed as a potential conflict of interest.

References

  1. Abuhammad, S. (2020). Barriers to distance learning during the COVID-19 outbreak: A qualitative review from parents’ perspective. Heliyon, 6(11), e05482. [Google Scholar] [CrossRef] [PubMed]
  2. Agyeman, R., Muhammad, R., & Choi, G. S. (2019, March 28–30). Soccer video summarization using deep learning [Paper presentation]. 2019 IEEE Conference on Multimedia Information Processing and Retrieval (MIPR), San Jose, CA, USA. [Google Scholar]
  3. Alaa, T., Mongy, A., Bakr, A., Diab, M., & Gomaa, W. (2024). Video summarization techniques: A comprehensive review. arXiv. [Google Scholar] [CrossRef]
  4. Andra, M. B., & Usagawa, T. (2019, March 12–14). Automatic lecture video content summarization with attention-based recurrent neural network [Paper presentation]. 2019 International Conference of Artificial Intelligence and Information Technology (ICAIIT), Yogyakarta, Indonesia. [Google Scholar]
  5. Benedetto, I., La Quatra, M., Cagliero, L., Canale, L., & Farinetti, L. (2024). Abstractive video lecture summarization: Applications and future prospects. Education and Information Technologies, 29(3), 2951–2971. [Google Scholar] [CrossRef]
  6. Bulathwela, S., Perez-Ortiz, M., Yilmaz, E., & Shawe-Taylor, J. (2020). Vlengagement: A dataset of scientific video lectures for evaluating population-based engagement. arXiv. [Google Scholar] [CrossRef]
  7. Burton, A., & Radford, J. (1978). Thinking in perspective: Critical essays in the study of thought processes. Routledge. [Google Scholar]
  8. Cao, Z., Hidalgo, G., Simon, T., Wei, S. E., & Sheikh, Y. (2019). OpenPose: Realtime multi-person 2D pose estimation using part affinity fields. IEEE Transactions on Pattern Analysis and Machine Intelligence, 43(1), 172–186. [Google Scholar] [CrossRef] [PubMed]
  9. Chen, C.-M., & Wu, C.-H. (2015). Effects of different video lecture types on sustained attention, emotion, cognitive load, and learning performance. Computers & Education, 80, 108–121. [Google Scholar] [CrossRef]
  10. Deng, R., & Gao, Y. (2024). Effects of embedded questions in pre-class videos on learner perceptions, video engagement, and learning performance in flipped classrooms. Active Learning in Higher Education, 25(3), 473–487. [Google Scholar] [CrossRef]
  11. Dimitrova, N. (2004). Context and memory in multimedia content analysis. IEEE Multimedia, 11(3), 7–11. [Google Scholar] [CrossRef]
  12. Flanagan, J. L. (1972). Speech synthesis. In J. L. Flanagan (Ed.), Speech analysis synthesis and perception (pp. 204–276). Springer. [Google Scholar]
  13. Guo, P. J., Kim, J., & Rubin, R. (2014, March 4–5). How video production affects student engagement: An empirical study of MOOC videos [Paper presentation]. First ACM Conference on Learning @ Scale (L@S ’14), Atlanta, GA, USA. [Google Scholar]
  14. Hasegawa, S., Tajima, Y., Matou, M., Futatsudera, M., & Ando, T. (2007, March 14–16). Case studies for self-directed learning environment using lecture archives [Paper presentation]. The Sixth IASTED International Conference on Web-based Education (WBE 2007), Chamonix, France. [Google Scholar]
  15. Hyndman, R. J., & Athanasopoulos, G. (2018). Forecasting: Principles and practice. OTexts. [Google Scholar]
  16. Khan, H., Hussain, T., Khan, S. U., Khan, Z. A., & Baik, S. W. (2024). Deep multi-scale pyramidal features network for supervised video summarization. Expert Systems with Applications, 237, 121288. [Google Scholar] [CrossRef]
  17. Khong, P., Holmes, D., Masoudian, B., Lund, G. C., & Garwood, S. (2025). Lecture capture, transcripts, and captioning in US colleges of osteopathic medicine: Descriptive cross-sectional survey. Medical Science Educator, 35, 625–628. [Google Scholar] [CrossRef] [PubMed]
  18. Kim, J., Guo, P. J., Seaton, D. T., Mitros, P., Gajos, K. Z., & Miller, R. C. (2014, March 4–5). Understanding in-video dropouts and interaction peaks in online lecture videos [Paper presentation]. First ACM Conference on Learning @ Scale (L@S ’14), Atlanta, GA, USA. [Google Scholar]
  19. Lamb, J., & Ross, J. (2022). Lecture capture, social topology, and the spatial and temporal arrangements of UK universities. European Educational Research Journal, 21(6), 961–982. [Google Scholar] [CrossRef]
  20. Lucas, B. D., & Kanade, T. (1981, August 24–28). An iterative image registration technique with an application to stereo vision [Paper presentation]. 7th International Joint Conference on Artificial Intelligence (IJCAI’81), Vancouver, BC, Canada. [Google Scholar]
  21. Sablić, M., Mirosavljević, A., & Škugor, A. (2021). Video-based learning (VBL)—Past, present and future: An overview of the research published from 2008 to 2019. Technology, Knowledge and Learning, 26(4), 1061–1077. [Google Scholar] [CrossRef]
  22. Saykili, A. (2018). Distance education: Definitions, generations and key concepts and future directions. International Journal of Contemporary Educational Research, 5(1), 2–17. [Google Scholar]
  23. Seidel, N. (2024). Short, long, and segmented learning videos: From YouTube practice to enhanced video players. Technology, Knowledge and Learning, 29(4), 1965–1991. [Google Scholar] [CrossRef]
  24. Sheng, R., Ota, K., & Hasegawa, S. (2022, July 27–31). An automatic focal period detection architecture for lecture archives [Poster presentation]. 23rd International Conference on Artificial Intelligence in Education (AIED 2022), Durham, UK. [Google Scholar]
  25. Shi, Y., Wang, M., Chen, Z., Hou, G., Wang, Z., Zheng, Q., & Sun, J. (2024). The impacts of instructor’s visual attention and lecture type on students’ learning performance and perceptions. Education and Information Technologies, 29, 16469–16497. [Google Scholar] [CrossRef]
  26. Singh, A., & Kumar, M. (2024). Bayesian fuzzy clustering and deep CNN-based automatic video summarization. Multimedia Tools and Applications, 83(1), 963–1000. [Google Scholar] [CrossRef]
  27. Tan, K., Zhou, Y., Xia, Q., Liu, R., & Chen, Y. (2024, August 7–9). Large model based sequential keyframe extraction for video summarization [Paper presentation]. International Conference on Computing, Machine Learning and Data Science (CMLDS), Singapore. [Google Scholar] [CrossRef]
  28. Vermeulen, E. J., & Volman, M. L. (2024). Promoting student engagement in online education: Online learning experiences of Dutch university students. Technology, Knowledge and Learning, 29(2), 941–961. [Google Scholar] [CrossRef]
  29. Vimalaksha, A., Vinay, S., Prekash, A., & Kumar, N. S. (2018, December 10–13). Automated summarization of lecture videos [Paper presentation]. 2018 IEEE Tenth International Conference on Technology for Education (T4E), Chennai, India. [Google Scholar]
  30. Walker, R., Voce, J., Ahmed, J., Nicholls, J., Swift, E., Horrigan, S., & Vincent, P. (2014). A survey of technology enhanced learning: Case studies. Universities and Colleges Information Systems Association. [Google Scholar]
  31. Wyse, L. (2017). Audio spectrogram representations for processing with convolutional neural networks. arXiv. [Google Scholar] [CrossRef]
  32. Zhang, J., Bourguet, M.-L., & Venture, G. (2018, July 4–6). The effects of video instructor’s body language on students’ distribution of visual attention: An eye-tracking study [Paper presentation]. 32nd International BCS Human Computer Interaction Conference (HCI 2018), Belfast, UK. [Google Scholar]
Figure 1. System pipeline for predicting segment access frequency (SAF) from lecture archives.
Education 15 00978 g001
Figure 2. Original Lecture Archive, I239 Machine Learning.
Education 15 00978 g002
Figure 3. SAF distribution for Lesson 1.
Education 15 00978 g003
Figure 4. SAF distribution for Lesson 4.
Education 15 00978 g004
Figure 5. Action Feature.
Education 15 00978 g005
Figure 6. Voice Feature.
Education 15 00978 g006
Figure 7. Feature fusion input example combining action, voice, and slide features into RGB channels.
Education 15 00978 g007
Figure 8. Process of feature-level fusion (example based on ResNet).
Education 15 00978 g008
Figure 9. Process of model-level fusion (example based on ResNet).
Education 15 00978 g009
Figure 10. Visualizations of 7-fold cross-validation using ResNet50.
Education 15 00978 g010aEducation 15 00978 g010b
Table 1. Valid viewers and total viewing time for each lecture.
LessonValid StudentsTotal Watching Time (min)
Lesson-110532
Lesson-26605
Lesson-311647
Lesson-48408
Lesson-58607
Lesson-69643
Lesson-79939
Average8.71625.86
Table 2. Performance of action feature regression under different smoothing strategies.
MethodMSEMAE R 2 PCC
Raw0.02920.12740.26840.5464
Moving Average0.02390.12060.40260.6505
Savitzky–Golay0.02440.12360.38970.6389
Kalman Filter0.02420.12120.39330.6413
Table 3. Comparison of fusion strategies using ResNet50 with all three modalities (A + V + S).
Fusion StrategyMSEMAE R 2 PCCTraining Time (min)
Feature-level Fusion0.03300.14240.12780.514322.5
Model-level Fusion0.03820.1562−0.01360.387398.4
Table 4. Ablation study on modality combinations using feature-level fusion with ResNet50.
Modality CombinationMSEMAE R 2 PCC
Action + Voice + Slide (A + V + S)0.03300.14240.12780.5143
Action + Voice (A + V)0.03740.15680.01250.3656
Action + Slide (A + S)0.03430.14560.05370.4677
Slide + Voice (S + V)0.03650.15440.01980.4617
Action only (A)0.03820.1575−0.00640.3549
Voice only (V)0.04190.1709−0.03110.4735
Slide only (S)0.04980.1832−0.20600.2819
Table 5. Comparison of backbone architectures using feature-level fusion (A + V + S) with 7-fold cross-validation.
Backbone ArchitectureMSEMAE R 2 PCC3-Class ACC
ResNet500.03300.14240.12780.514361.05%
ResNet1010.04080.1595−0.06410.354550.23%
VGG160.03420.14760.08410.460054.14%
VGG190.03760.1528−0.00130.412851.28%
ViT0.03450.14710.09690.437754.44%
CNN + LSTM0.03720.1510−0.07870.460051.33%
Table 6. Validation results of ResNet50 on each lesson (7-fold cross-validation).
Validation LessonBest EpochMSEMAE R 2 PCC
1130.06230.21130.16930.5323
220.02640.1143−0.13900.2535
340.02270.12170.09580.3366
4280.04520.18500.25960.7772
510.03030.1406−0.33050.2860
660.02980.12860.20200.5655
7910.01450.09510.63760.8491
Average0.03300.14240.12780.5143
Table 7. Summary of research questions, answers, and supporting results.
Research QuestionAnswer SummarySupporting Results
Main RQSAF can be predicted using non-semantic features with moderate correlation (PCC = 0.5143).Table 3 and Table 5
Sub RQ1Action features contribute most; all three modalities improve results.Table 4
Sub RQ2Feature-level fusion + ResNet50 best balance of performance and cost.Table 3 and Table 5
Disclaimer/Publisher’s Note: The statements, opinions and data contained in all publications are solely those of the individual author(s) and contributor(s) and not of MDPI and/or the editor(s). MDPI and/or the editor(s) disclaim responsibility for any injury to people or property resulting from any ideas, methods, instructions or products referred to in the content.

