Article

Probabilistic Language in Spanish Secondary Textbooks

by
Carmen Batanero
1,*,
Macarena Elgueda-Ibarra
2 and
María M. Gea
2
1
Research Group FQM-126, Theory of Mathematics Education and Statistics Education, University of Granada, 18071 Granada, Spain
2
Department of Mathematics Education, University of Granada, 18071 Granada, Spain
*
Author to whom correspondence should be addressed.
Educ. Sci. 2025, 15(8), 979; https://doi.org/10.3390/educsci15080979
Submission received: 19 May 2025 / Revised: 9 July 2025 / Accepted: 25 July 2025 / Published: 30 July 2025

Abstract

Probabilistic language is a main component in the teaching and learning of probability; however, research analyzing probabilistic language in textbooks, which are fundamental didactic tools, is scarce. Consequently, in this research, we studied the various probabilistic languages used in Spanish secondary school textbooks. We performed a detailed content analysis of two complete series (grades 1 to 4; the last with two options) of Spanish prestigious editorials published after the last curricular guidelines in 2022; 10 books in total. We researched the verbal, symbolic, tabular, and graphical language in each textbook. Results suggest differences in the way each editorial introduces its everyday and probabilistic language. Although the number of new symbols is small, some of them are complex or used inconsistently. There is scarce use of tables and graphs, except for tree diagrams and two-way tables, in the study of conditional and compound probability. We conclude with recommendations to improve probabilistic language in textbooks and facilitate the learning of probability in secondary education in this way.

1. Introduction

Teaching probability is important because probabilistic reasoning is needed to help citizens make decisions under uncertainty (Hokor, 2023; Sriraman & Chernoff, 2020). It is a relevant mathematical area and unique in that it deals with random situations (Sharma, 2015). Besides being the basis of statistical inference, it allows the application of many mathematical methods, such as combinatorics, functions, logic, algebra, or proportionality (Batanero & Borovcnik, 2016; Van Dooren, 2014). For example, Tizón-Escamilla and Burgos (2023) described an experience in which the creation of probability problems helped develop prospective teachers’ probabilistic, proportional, and algebraic thinking.
In Spain, education is compulsory from 6 to 16 years of age. This period includes six grades of primary education (6–12 years) and four years of compulsory secondary education (12–16 years).
The importance of probability is recognized in the Spanish curriculum (MEFP, 2022), where probability is part of the stochastic sense, which includes “the analysis and interpretation of data, the development of conjectures and decision making from statistical information, its critical appraisal, and understanding and communicating random phenomena in a wide variety of everyday situations” (p. 412). The Spanish curriculum is based on competencies, one of which is “communicating individually and collectively mathematical concepts, procedures and arguments, using verbal and graphical language, and adequate mathematical terminology” (p. 145). The basic probability content is presented in Table 1. This content is common in grades 1–3 as well as in grades 4A and 4B, so that the publishers can freely distribute the content in the given grades.
Several investigations have revealed the influence of knowing the language used in teaching and learning mathematics (Abedi & Lord, 2001; Morgan et al., 2014). The reason is that the construction of mathematical knowledge occurs through the student’s everyday language and gradually includes new and more abstract terms. This poses challenges due to the multiple semiotic systems in mathematical language: verbal, symbolic, tabular, graphic, and iconic, which can affect the learning difficulty (Lin et al., 2021; Schleppegrell, 2007).
A fundamental resource is the textbook (Fan et al., 2013; Schubring & Fan, 2018), which is used to help implement the intended curriculum (Usiskin, 2013), constituting the written curriculum as an intermediate step between the curricular guidelines and that which is embodied in the classroom (Herbel, 2007). It is an instrument of curricular change and a mediator of innovative practices in curricular reforms (Rezat et al., 2021). This explains the interest in research on mathematics textbooks (e.g., Fan et al., 2013; Schubring & Fan, 2018; Van Den Ham & Heinze, 2018).
Despite this importance, research analyzing probabilistic language in secondary textbooks is scarce. To fill this gap, the aim of this paper was to analyze the different types of language proposed in the topic of probability in a sample of Spanish compulsory secondary education textbooks corresponding to recent curricular decrees (MEFP, 2022). The following research questions are deduced from this objective:
  • What different types of language are used in textbooks, and into what categories can they be classified?
  • Are there differences in the language used by different publishers?
  • Are there differences in language by grade?
The rationale, method, and results of the study are presented below, followed by the conclusions obtained with respect to the questions posed and suggestions to improve the probabilistic language in textbooks for compulsory secondary education.

2. Foundations

2.1. Probabilistic Language

Pimm (1987) highlighted the central role of language in the mathematical classroom because personal and social identity is constituted through language. It constitutes an essential element in mathematical work because it allows representing abstract mathematical objects that are invisible and operating with them, thus having a double function, representational and operational (Godino, 2024). Schleppegrell (2007) discussed the linguistic challenges of teaching mathematics due to the multiple semiotic systems used to construct knowledge: verbal language, symbols, and representations such as graphs and tables. Thus, it is important to correctly learn the language associated with any topic in order to avoid possible semiotic conflicts, which Godino (2024) defined as “any disparity or discordance between the meanings attributed to an expression by two individuals” (p. 231).
Probability, like any discipline, has its own communication code, constituted by a particular terminology used to communicate the ideas of the topic, so that words and terminology are essential in the process of communication. When people begin studying probability, they have already used various words and phrases to describe random events in daily life. However, the meanings of these terms in conversations can slightly differ from their precise definitions in a mathematical setting (Adams, 2003).
In addition, expressions of uncertainty tend to be ambiguous and subjective. This creates conceptual challenges in ensuring that the intended meaning aligns with the context in which the probabilistic ideas are applied (Thatte et al., 2024). As a result, students often struggle to articulate likelihood and navigate varying degrees of uncertainty effectively; thus, many difficulties shown when solving problems in probability are related to the lack of a suitable language with which to interpret the problems (Nacarato & Grando, 2014).
Probability classes in secondary schools rarely negotiate the meaning of terms such as ‘certainty’, ‘impossible’, and ‘less probable’ because teachers assume these expressions are part of students’ vocabulary. However, previous research described students’ different interpretations and uses of these words. For example, Green’s (1983) research highlighted students’ lack of verbal ability to describe probabilistic situations soundly and confusion between terms such as certain and very likely or impossible and unlikely.
Consequently, the language of probability is an essential part of textbook content, and teachers should pay attention to probabilistic language when teaching probability concepts (Groth et al., 2020) and interpret the textbook accordingly with the authors’ intention; for example, presenting tasks in an investigation-oriented manner and not as repetitive practice problems (D. L. Jones & Tarr, 2007).

2.2. Algebraization Levels in the Study of Probability

In different papers, Godino and his collaborators (Godino et al., 2014, 2015) defined levels of reasoning in algebraic work that consider the algebraic processes (e.g., symbolization, generalization, modeling) and objects (e.g., variables, unknowns, equations, patterns, relationships) involved, and the type of language used, in the following way:
  • Level 0. Arithmetic reasoning. The person operates with objects of the first degree of generality, such as particular numbers, and uses verbal, numerical, or iconic languages. The symbol equal is only used in its operational meaning to express the results of the operations.
  • Level 1. Emerging algebraic reasoning. The properties of the operation and the concept of equivalence are used (relational meaning of the equal sign). Functions appear without general rules because variables only represent contextual information.
  • Level 2. Intermediate algebraic reasoning. Symbolic representations intervene to represent general mathematical objects; equations of the form Ax + B = C are solved. Functions appear as general rules.
  • Level 3. Consolidated algebraic reasoning. Symbols are used analytically without reference to contextual information. Operations with indeterminates or variables are performed; equations of the type Ax + B = Cx + D are solved.
  • Level 4. Parameters. Parameters appear to specify families of functions or equations, although no operations with parameters are carried out.
  • Level 5. Operations with Parameters. Analytical operations with variables and parameters are performed.
  • Level 6. Algebraic structures reasoning. This level is characterized by functional algebra and algebraic structures, which appear at the highest level of generality.
Using this framework, Burgos et al. (2021) identified examples of school probability problems whose solutions required each of the above algebraization reasoning levels. In our analysis of the symbolic and tabular representations of probability concepts in the textbooks, we analyze the algebraic reasoning levels involved in their use.

2.3. Previous Research

Authors who examined the probability content in textbooks generally focused on the proposed problems (Díaz-Levicoy et al., 2019; Huerta, 2009; Lonjedo et al., 2012; Ortiz, 2002; Ortiz et al., 2002; Vásquez & Alsina, 2015). Others considered the meaning of probability (classical, frequential, or subjective) or the definitions of the concepts included in the textbooks (Han et al., 2011; Ortiz, 2002; Vásquez & Alsina, 2015).
Finally, a few studies have focused on probabilistic language by differentiating verbal, symbolic, tabular, graphical, and pictorial language. The first of them was conducted by Ortiz (2002), who carried out a detailed analysis of the various types of language in two Spanish textbooks for a secondary school grade equivalent to the current third grade (14–15 years old). He differentiated between mathematics-specific expressions, those that appear both in mathematics and daily life, having a different meaning in each of these contexts, and expressions that have the same meaning in both contexts.
Ortiz (2002) also analyzed the graphical, tabular, and symbolic representations of probability in the textbooks. The variety of symbolic expressions (fractions, decimal and set notations, algebraic symbols, and inequalities) was usually mixed in the same statement, which implied a high complexity for the student. Among the graphical and tabular representations, he obtained tree diagrams, arrow diagrams, Venn diagrams, frequency tables, two-way tables, bar diagrams, and line diagrams.
His study was reproduced by Gómez-Torres et al. (2013) in two series of primary school textbooks, focusing on the terms linked to the concepts of randomness, random experiment, sample space, mathematical expectation, probability, event, and random variable. For each term found, they indicated to which of the meanings (intuitive, classical, frequential, or subjective) it was linked. They also studied numerical, symbolic, tabular, and graphical language, highlighting the richness of the language in the analyzed texts, which supported the communicative component of the probabilistic culture advocated by Gal (2005).
Vásquez and Alsina (2015) also studied probabilistic language in a series of Chilean primary school textbooks. They indicated that ordinary language was dominant over probabilistic language, which they classified in expressions linked to the intuitive, classical, and frequentist meanings of probability. Among the numerical representations of probability, they found whole numbers, fractions, and decimal numbers. For the tabular representation, counting tables and frequency tables were used to summarize the absolute and relative frequencies obtained from the data collection in the random experiments. They observed a scarcity of graphs and tree diagrams in the analyzed texts.
All this research was mainly carried out using primary school textbooks, and the only study that dealt with secondary school was that by Ortiz (2002), which was conducted more than 20 years ago. Moreover, the author only studied two books for the first degree of high school, which is equivalent to the current third grade in secondary school. Our research complements that information by analyzing two complete Spanish series of recently published secondary education textbooks and by studying the evolution of language by grade, not considered by Ortiz (2002).

3. Materials and Methods

This is a descriptive study with a mixed methodology, with a qualitative component based on content analysis, which allows us to delve into the meaning contained in each textbook, examine and categorize the differences observed, and identify recurrent patterns (Drisko & Maschi, 2016). We also include several quantitative variables, such as the number of representations and the number of words in each textbook.
All secondary education textbooks from two editorials were analyzed. Each of them covers grades 1 to 4, and within the latter, options A and B; the first one applied and the second one academic, oriented towards students who wish to pursue scientific studies. The selected publishers were Anaya and Santillana, chosen because they are widely used and occupy the first places in the ranking of Spanish textbook publishers according to sales (https://www.letrasdeencuentro.es/editoriales/libros-de-texto [accessed on 1 October 2023]). The textbooks analyzed are Colera et al. (2023a, 2023b, 2023c, 2023d, 2023e) for the editorial Anaya and Alejo et al. (2023a, 2023b, 2023c), Almécija et al. (2022) and Barbero et al. (2023) for the editorial Santillana.
The analysis considered verbal, symbolic, tabular, and graphical language. For each of them and following the categories used by Ortiz (2002) and later also by Gómez-Torres et al. (2013) and Vásquez and Alsina (2015), we conducted several successive readings of each textbook, identifying and classifying the different language elements and preparing summary tables by publisher and grade. To ensure the reliability of the coding, two of the authors conducted independent readings and analyses and met regularly to agree on any discordant cases. The final result was revised by the third author.

3.1. Variables and Categories

Next, we describe this language and the categories used in the analysis of textbooks.

3.1.1. Verbal Language

From Vygotsky’s (2012) cultural historical perspective, the meaning of concepts is acquired and shared by people through dialogue and interaction, mediated by language. The first type of language used in probability is verbal language, constituted by words used in the texts analyzed to refer to concepts or properties, propose problems, show examples, or construct arguments.
In mathematics, the vocabulary used starts from the usual language in the mother tongue and adds mathematical and specific vocabulary to communicate abstract concepts (Lin et al., 2021; Schleppegrell, 2007), which poses a challenge for the student in statistics and probability in particular (Dunn et al., 2016).
We identified and individually analyzed each word used in the textbooks to describe concepts, properties, procedures, or problems related to probability. The words identified were classified into the three types that appear in mathematics texts, according to Rothery (1980): (1) those that are used in everyday life and in mathematics with the same meaning; (2) those that are used in both everyday life and mathematics with a slightly different meaning; and (3) those specific to mathematics that are not usually used in everyday life. Following Gea (2014), within the latter we differentiated between basic terms that the student should know from the beginning of the study of probability, such as, for example, frequency or relative frequency, which has been introduced in the previous study of statistics. Other terms are specific to probability, for example, sample space or conditional probability. To classify each word into one of these categories, we also took into account similar classifications proposed by Ortiz (2002) and Gómez-Torres et al. (2013).
Different types of words often appear together within the same paragraph in the textbooks. An example is shown in Figure 1, in which we found the following:
  • Everyday words used with their typical meanings for students, such as chance, depend, and occur.
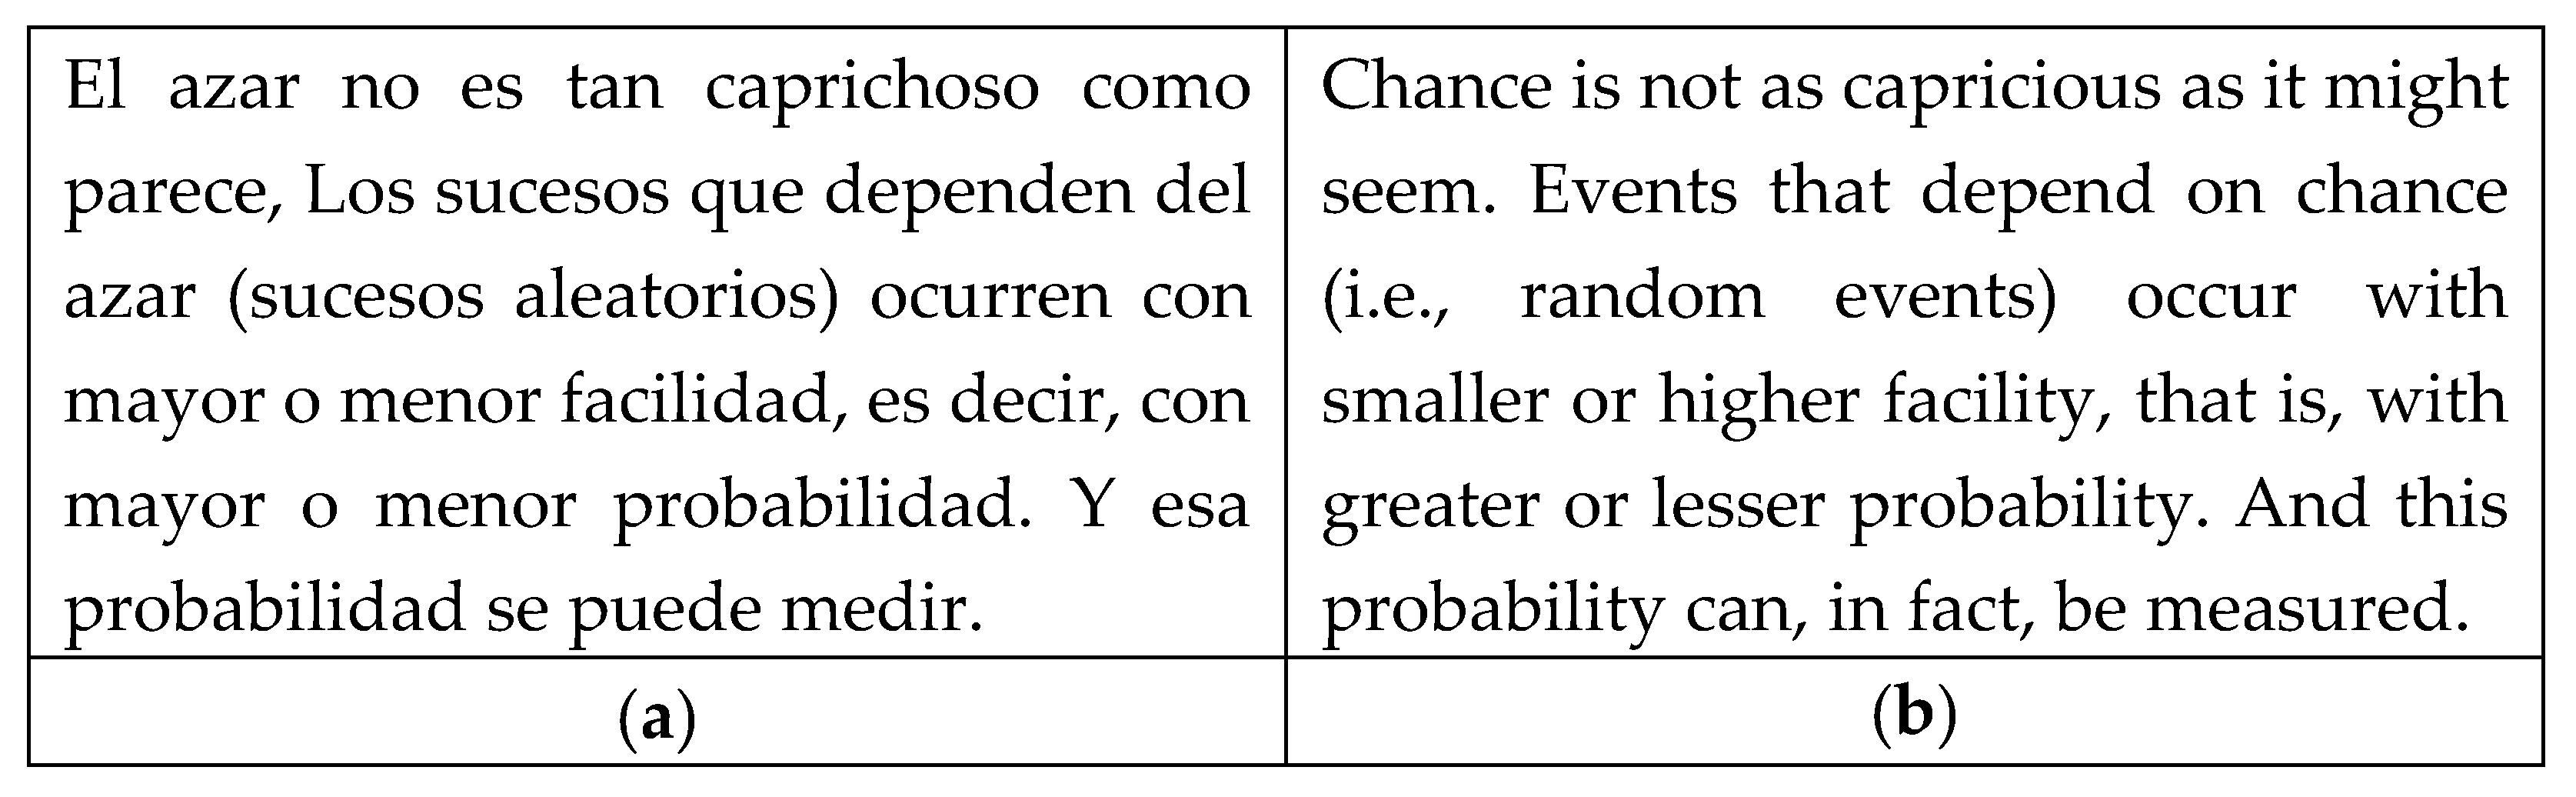
  • Everyday words used with a different meaning: The word facility in this context refers not to lack of difficulty but to something occurring more frequently.
  • Basic mathematical terms, such as higher, smaller, and measured.
  • Basic probabilistic terms, such as probability and random events.

3.1.2. Symbolic Language

Symbols play an important role in mathematics, and students must interpret them in order to read mathematics correctly because they communicate meaning and organize mathematical work (Adams, 2003). They must also be able to represent verbal problems and their resolution through mathematical symbols. According to Gea (2014), symbolic notations and algebraic expressions allow synthetic communication and work with a high complexity level. Skemp (2012), in turn, indicates the following functions of symbols: recording and communicating knowledge, forming new concepts, explaining or justifying solutions to others, and performing routine operations. De Cruz and De Smedt (2013) argue that mathematical symbols help perform mathematical operations with concepts that we cannot imagine and, moreover, constitute concepts themselves.
Symbol learning must consider, according to Hiebert (1998), the following steps: (1) connecting each individual symbol with its referents; (2) acquiring the algorithms for manipulating the symbols and turning them into routines; and (3) using the symbols in the elaboration of more abstract systems of symbols. Despite being essential in mathematical work, they are not usually taught, regardless of students’ difficulties due to unfamiliarity with symbols, interpreting propositions represented by symbols or constructing symbolic expressions (Distéfano et al., 2019).
In our analysis, the different symbols used to refer to probabilistic objects and their operations were identified for each school grade in the two editorials. We also analyzed examples of their use to produce algebraic expressions.

3.1.3. Tabular Language

The statistical tables found in the texts were classified according to Lahanier-Reuter (2003) into data tables, single-variable distribution tables, and two-way tables. Each of them has specific functions that endow them with meaning, as well as different semiotic complexity and difficulty in the student’s work (Gea et al., 2022; Pallauta et al., 2023).
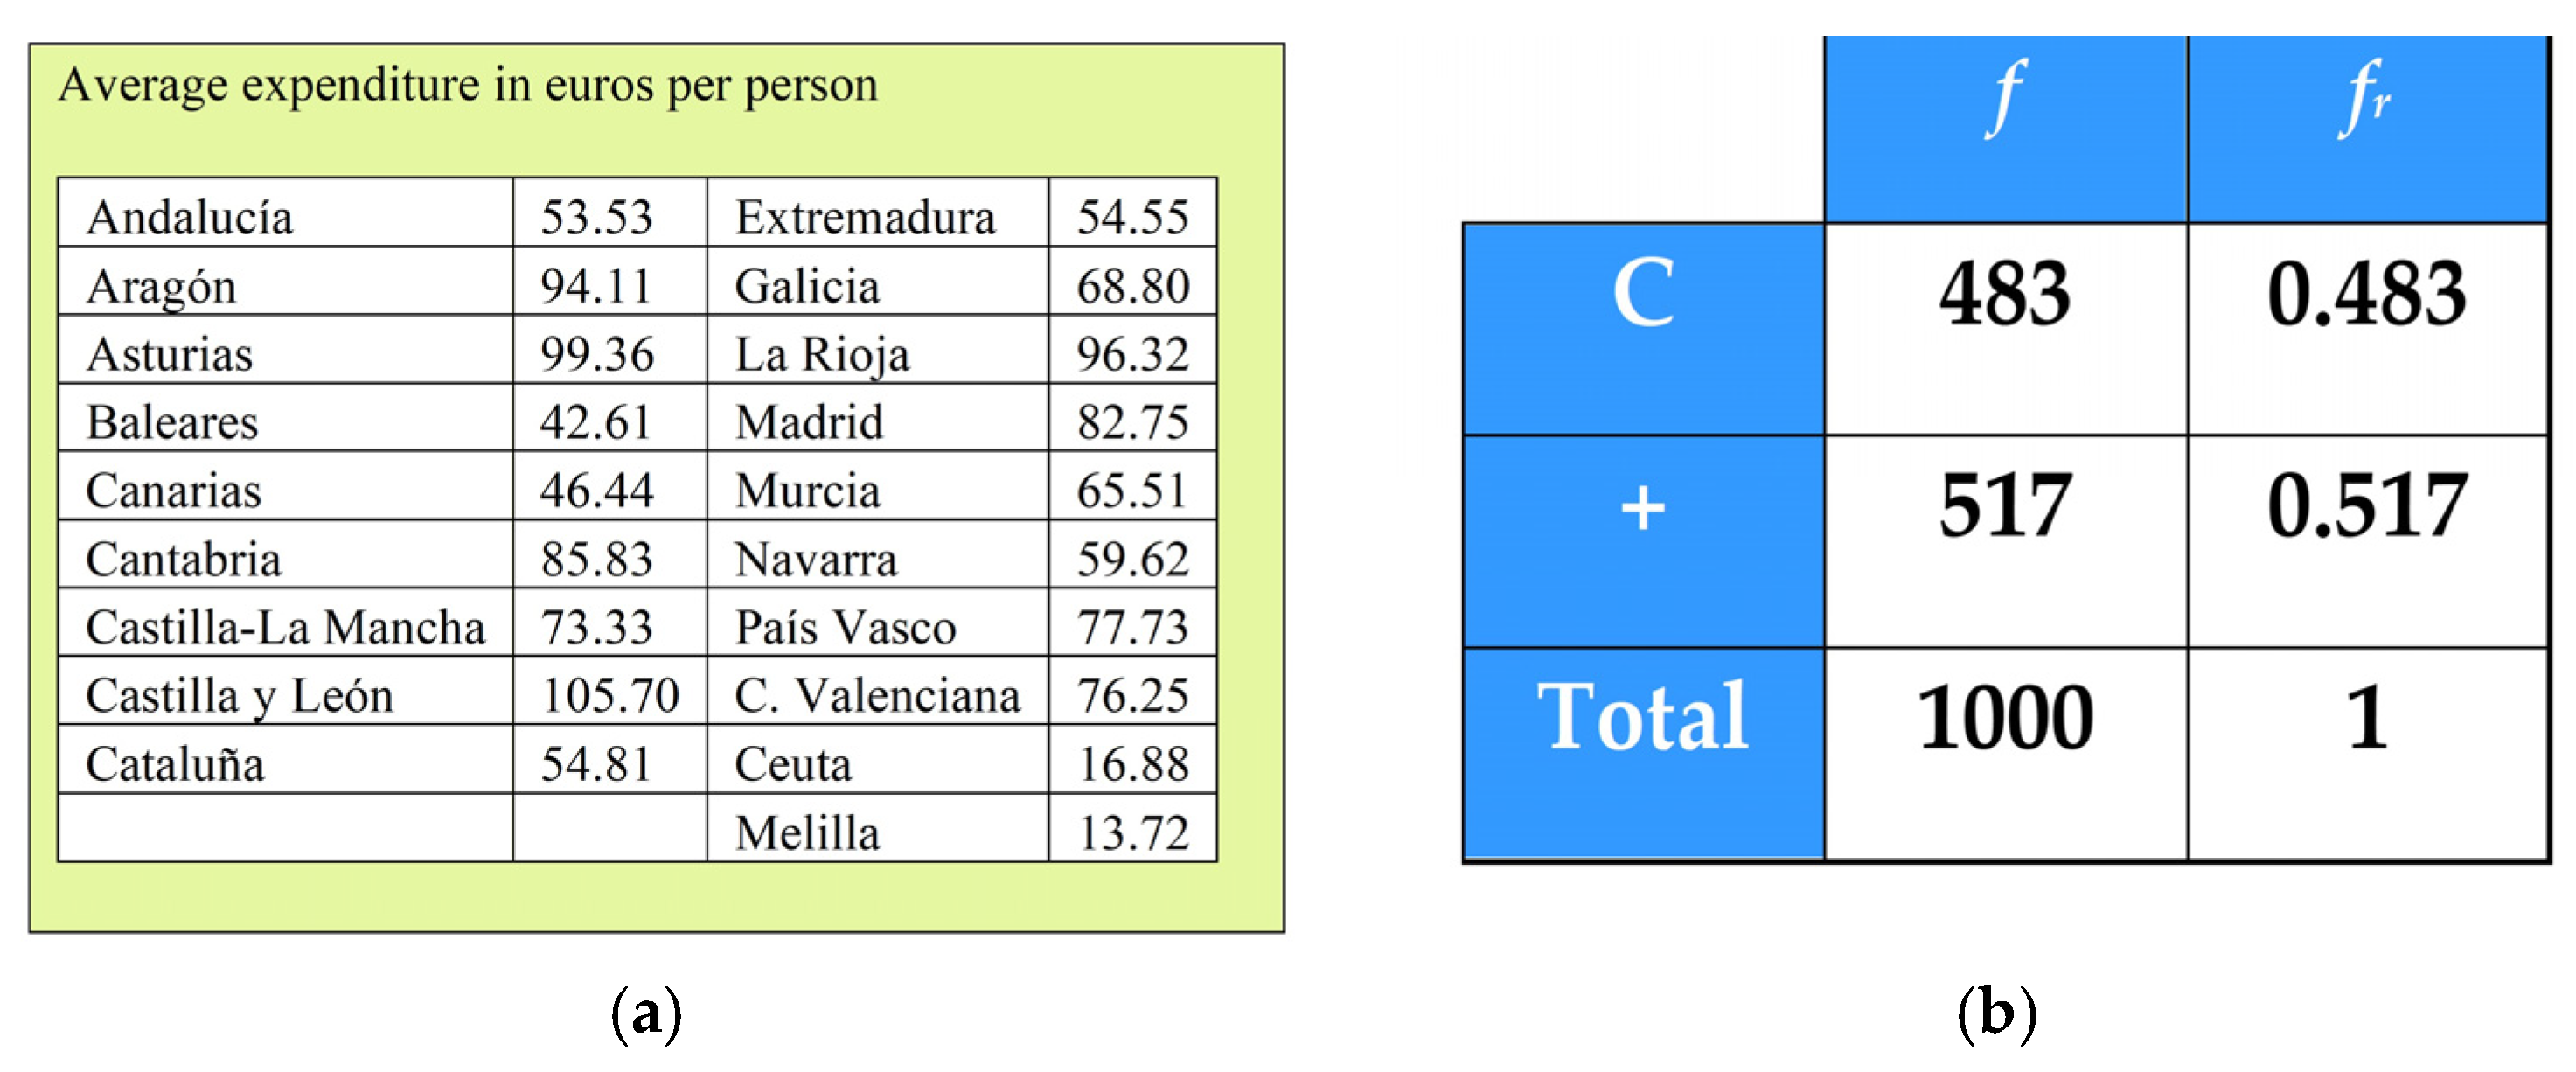
  • Data tables involve the first organization of a dataset and contain the values of one or several variables (Lahanier-Reuter, 2003). Pallauta et al. (2023) assigned an algebraic reasoning level L1 (Godino et al., 2014, 2015) to the work with these tables because the idea of a variable and its values is used but not that of distribution. An example is presented in Figure 2a, which represents the average lottery expenditure per person for different Spanish countries.
  • Frequency tables represent the distribution of a variable; Pallauta et al. (2023) assigned to them an algebraic reasoning level L3 (Godino et al., 2014, 2015) because they involve the ideas of frequency and distribution, in addition to the variable and values. An example is presented in Figure 2b, which represents the distribution of the absolute and relative frequencies of the results when a coin is tossed 1000 times.
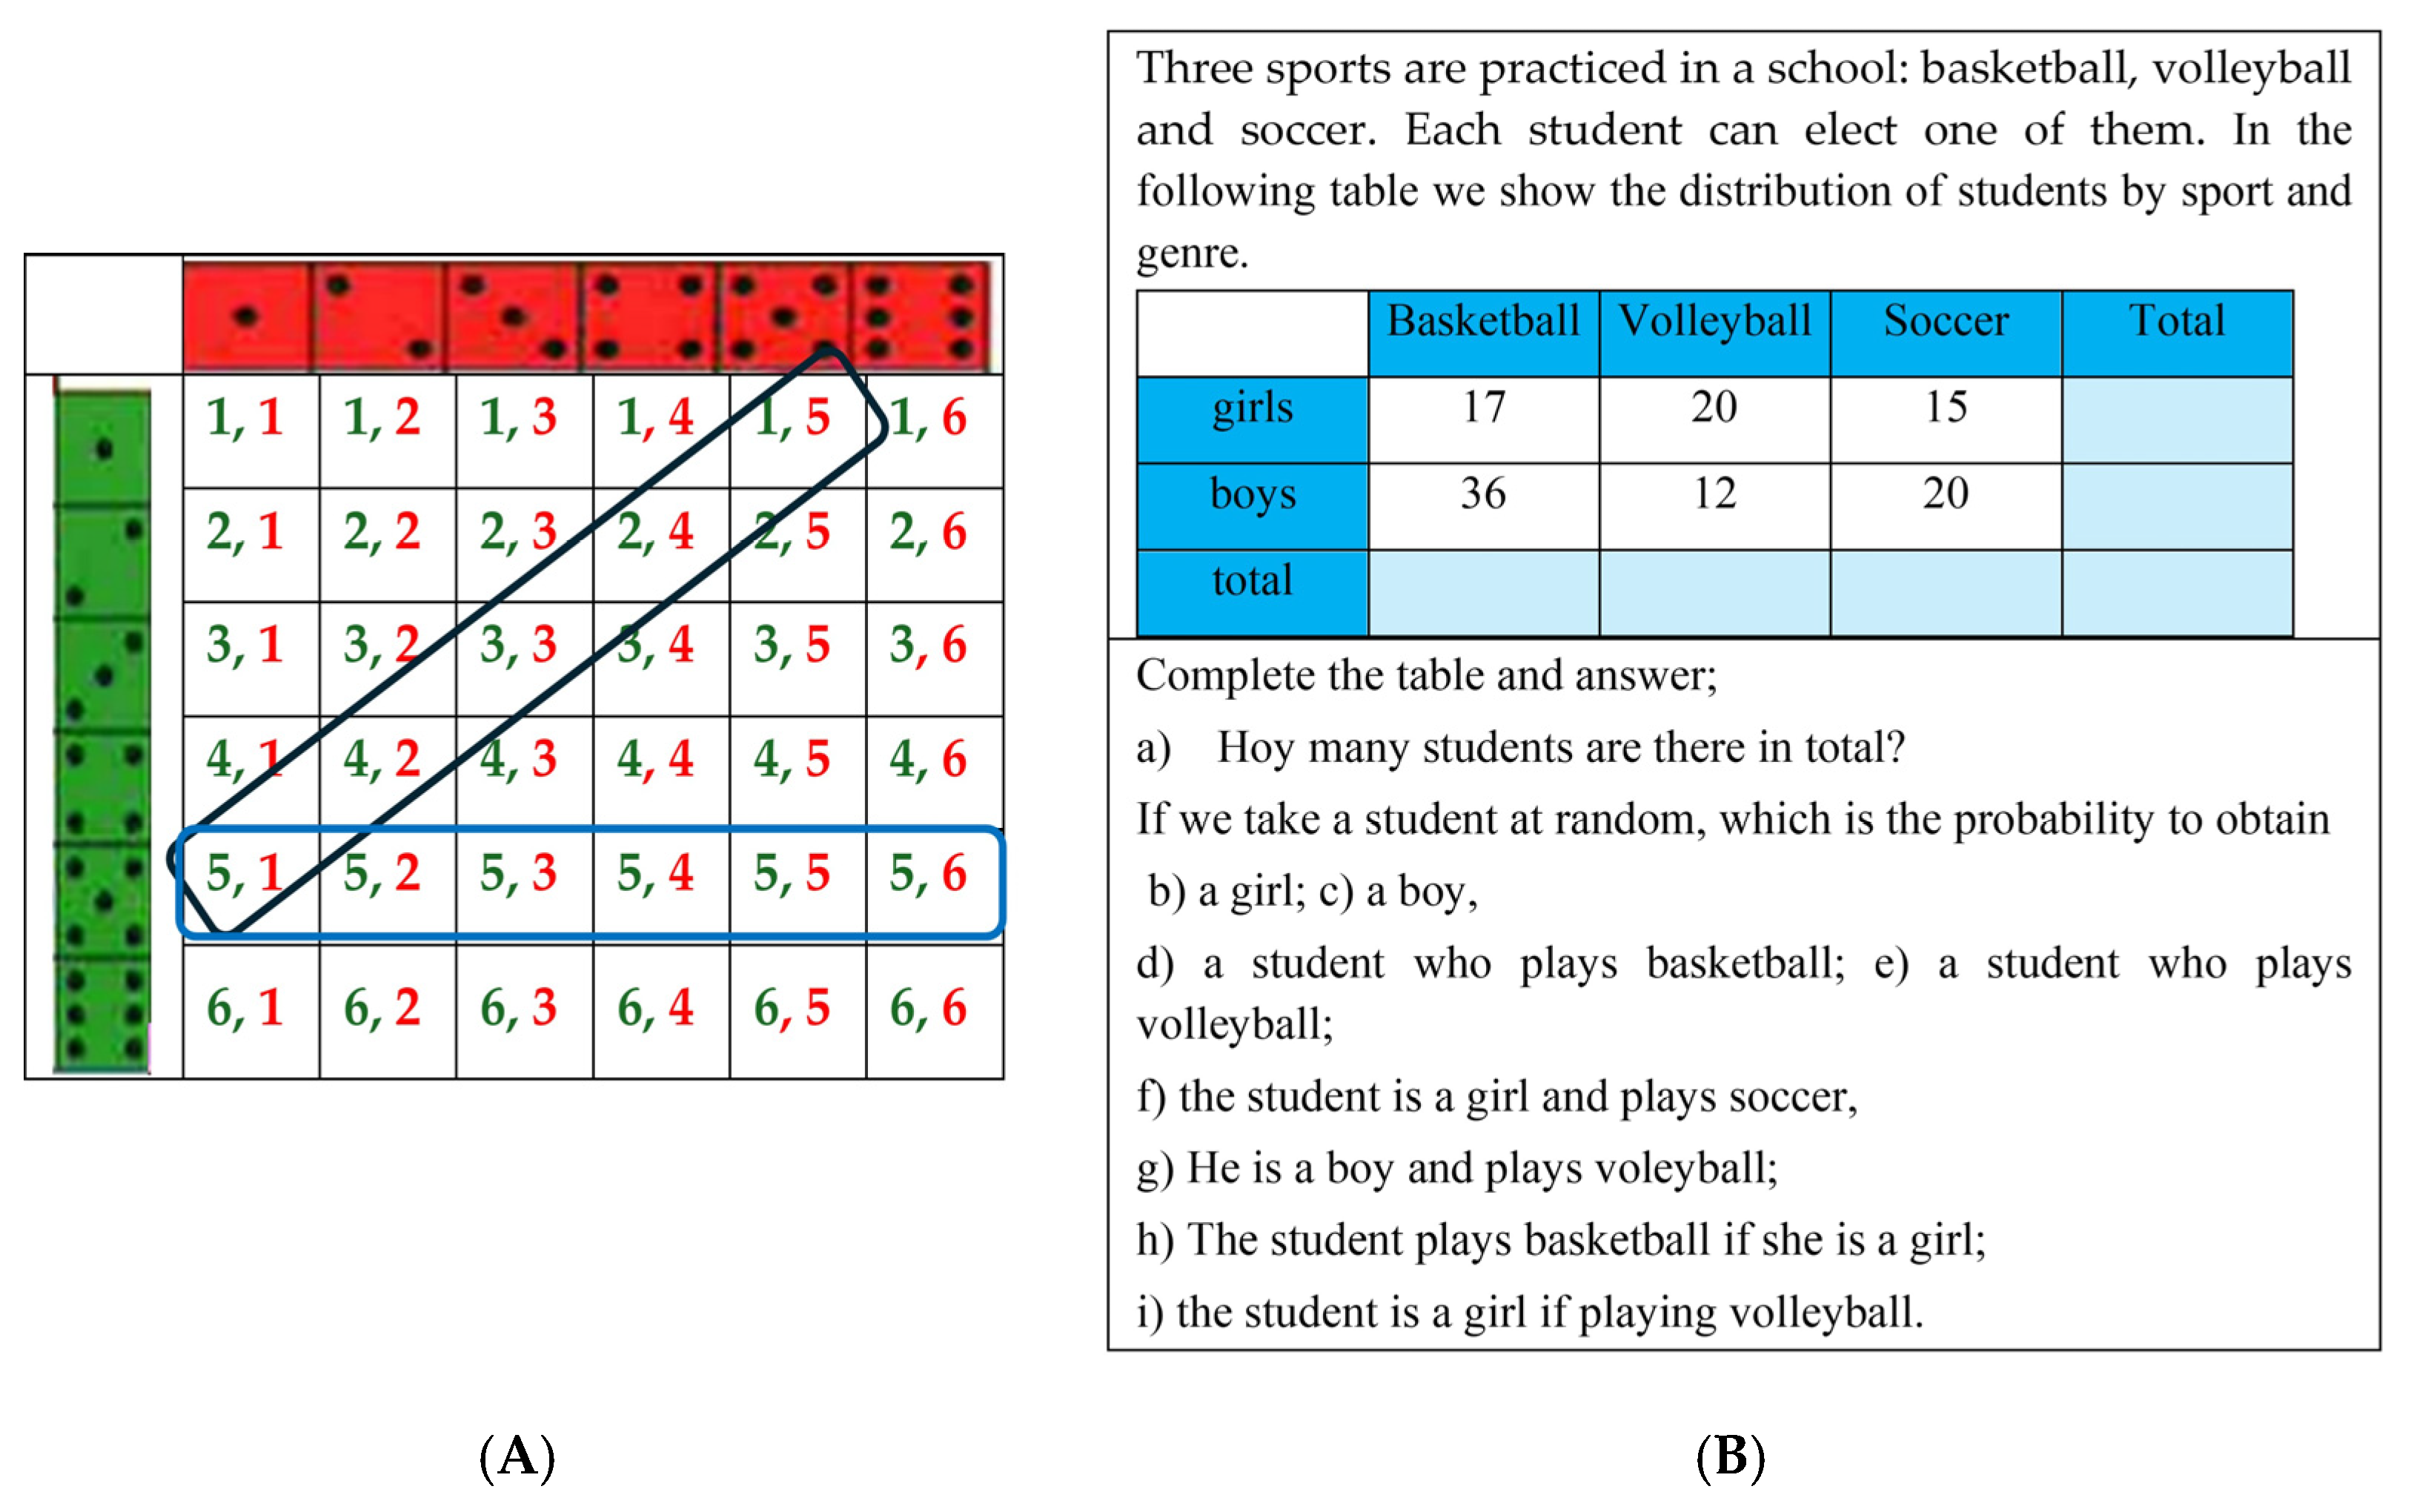
  • Two-way tables. They jointly represent two variables whose modalities are displayed in rows and columns. The body of the table is formed by frequencies or values that correspond to the modalities of the rows and columns. They were assigned algebraic reasoning level L4 (Pallauta et al., 2023) because different distributions joint, marginal by rows, and marginal by columns appear. In addition, we can obtain different conditional distributions by row or column in which the variable that conditions the distribution plays the role of parameter. We found two different uses for this type of table in the textbooks. In the first one (Figure 3A), they are used to list all elementary events of a compound experiment, and in the second one, they are used to classify the data of a compound random experiment (Figure 3B).

3.1.4. Graphical and Pictorial Language

When analyzing the graphical and pictorial representations included in the textbooks to illustrate probabilistic ideas, we found the following categories:
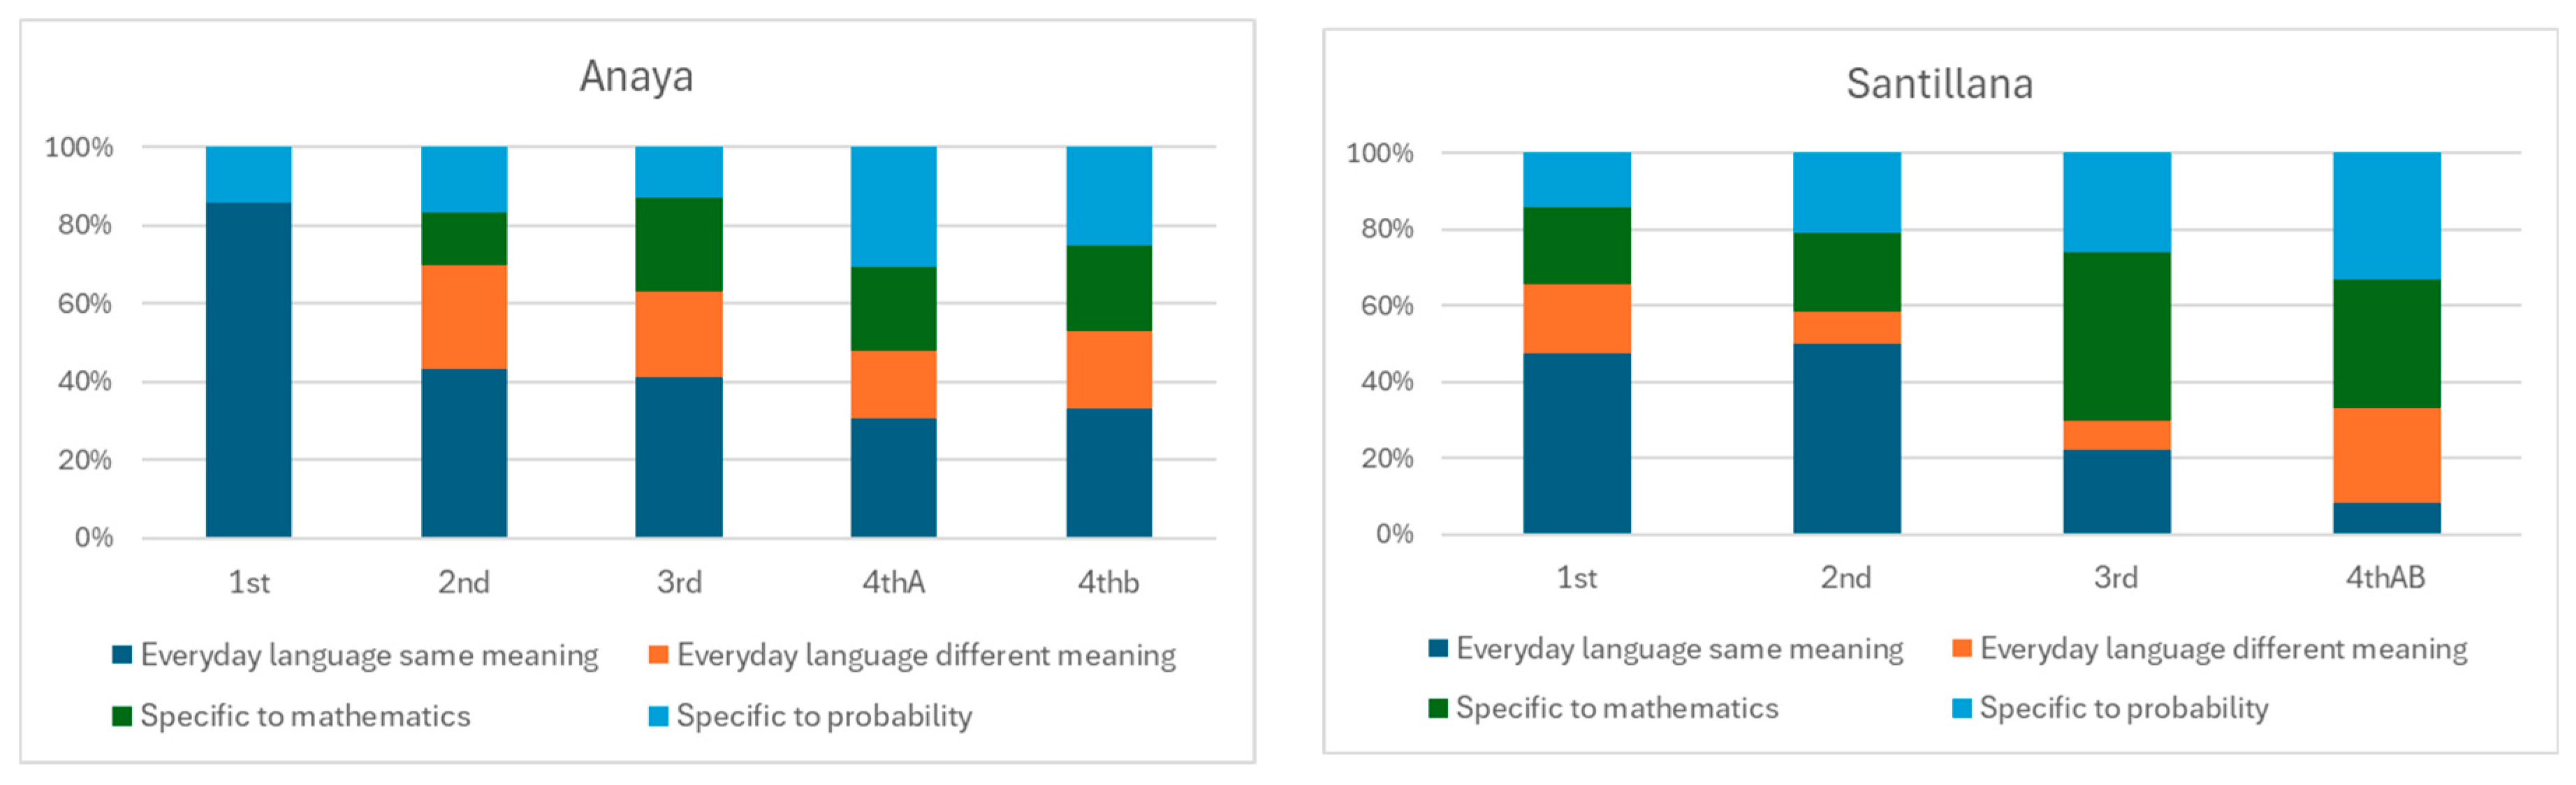
  • Bar graphs. These are graphic representations in which either the values of the variable or the frequencies of these values are represented by bars of the same width, whose length is proportional to the value or frequency represented. An example is presented in Figure 4a.
  • Pie charts. These graphs use a circle divided into circular sectors, each of which is proportional to the relative frequency of a modality of the variable represented.
  • Line graphs. In this graphical representation, a Cartesian system is used in which the values of a variable are represented on the X-axis and its frequencies on the Y-axis, using a polygonal line to join the points obtained in this way. We identified some examples to represent the convergence of the relative frequency of an event as the number of experiments increases toward the theoretical probability.
  • Cartograms. Colored maps in which quantities or colors appear on different geographical areas according to the frequency of the value or modality of a variable represented. An example is presented in Figure 4b.
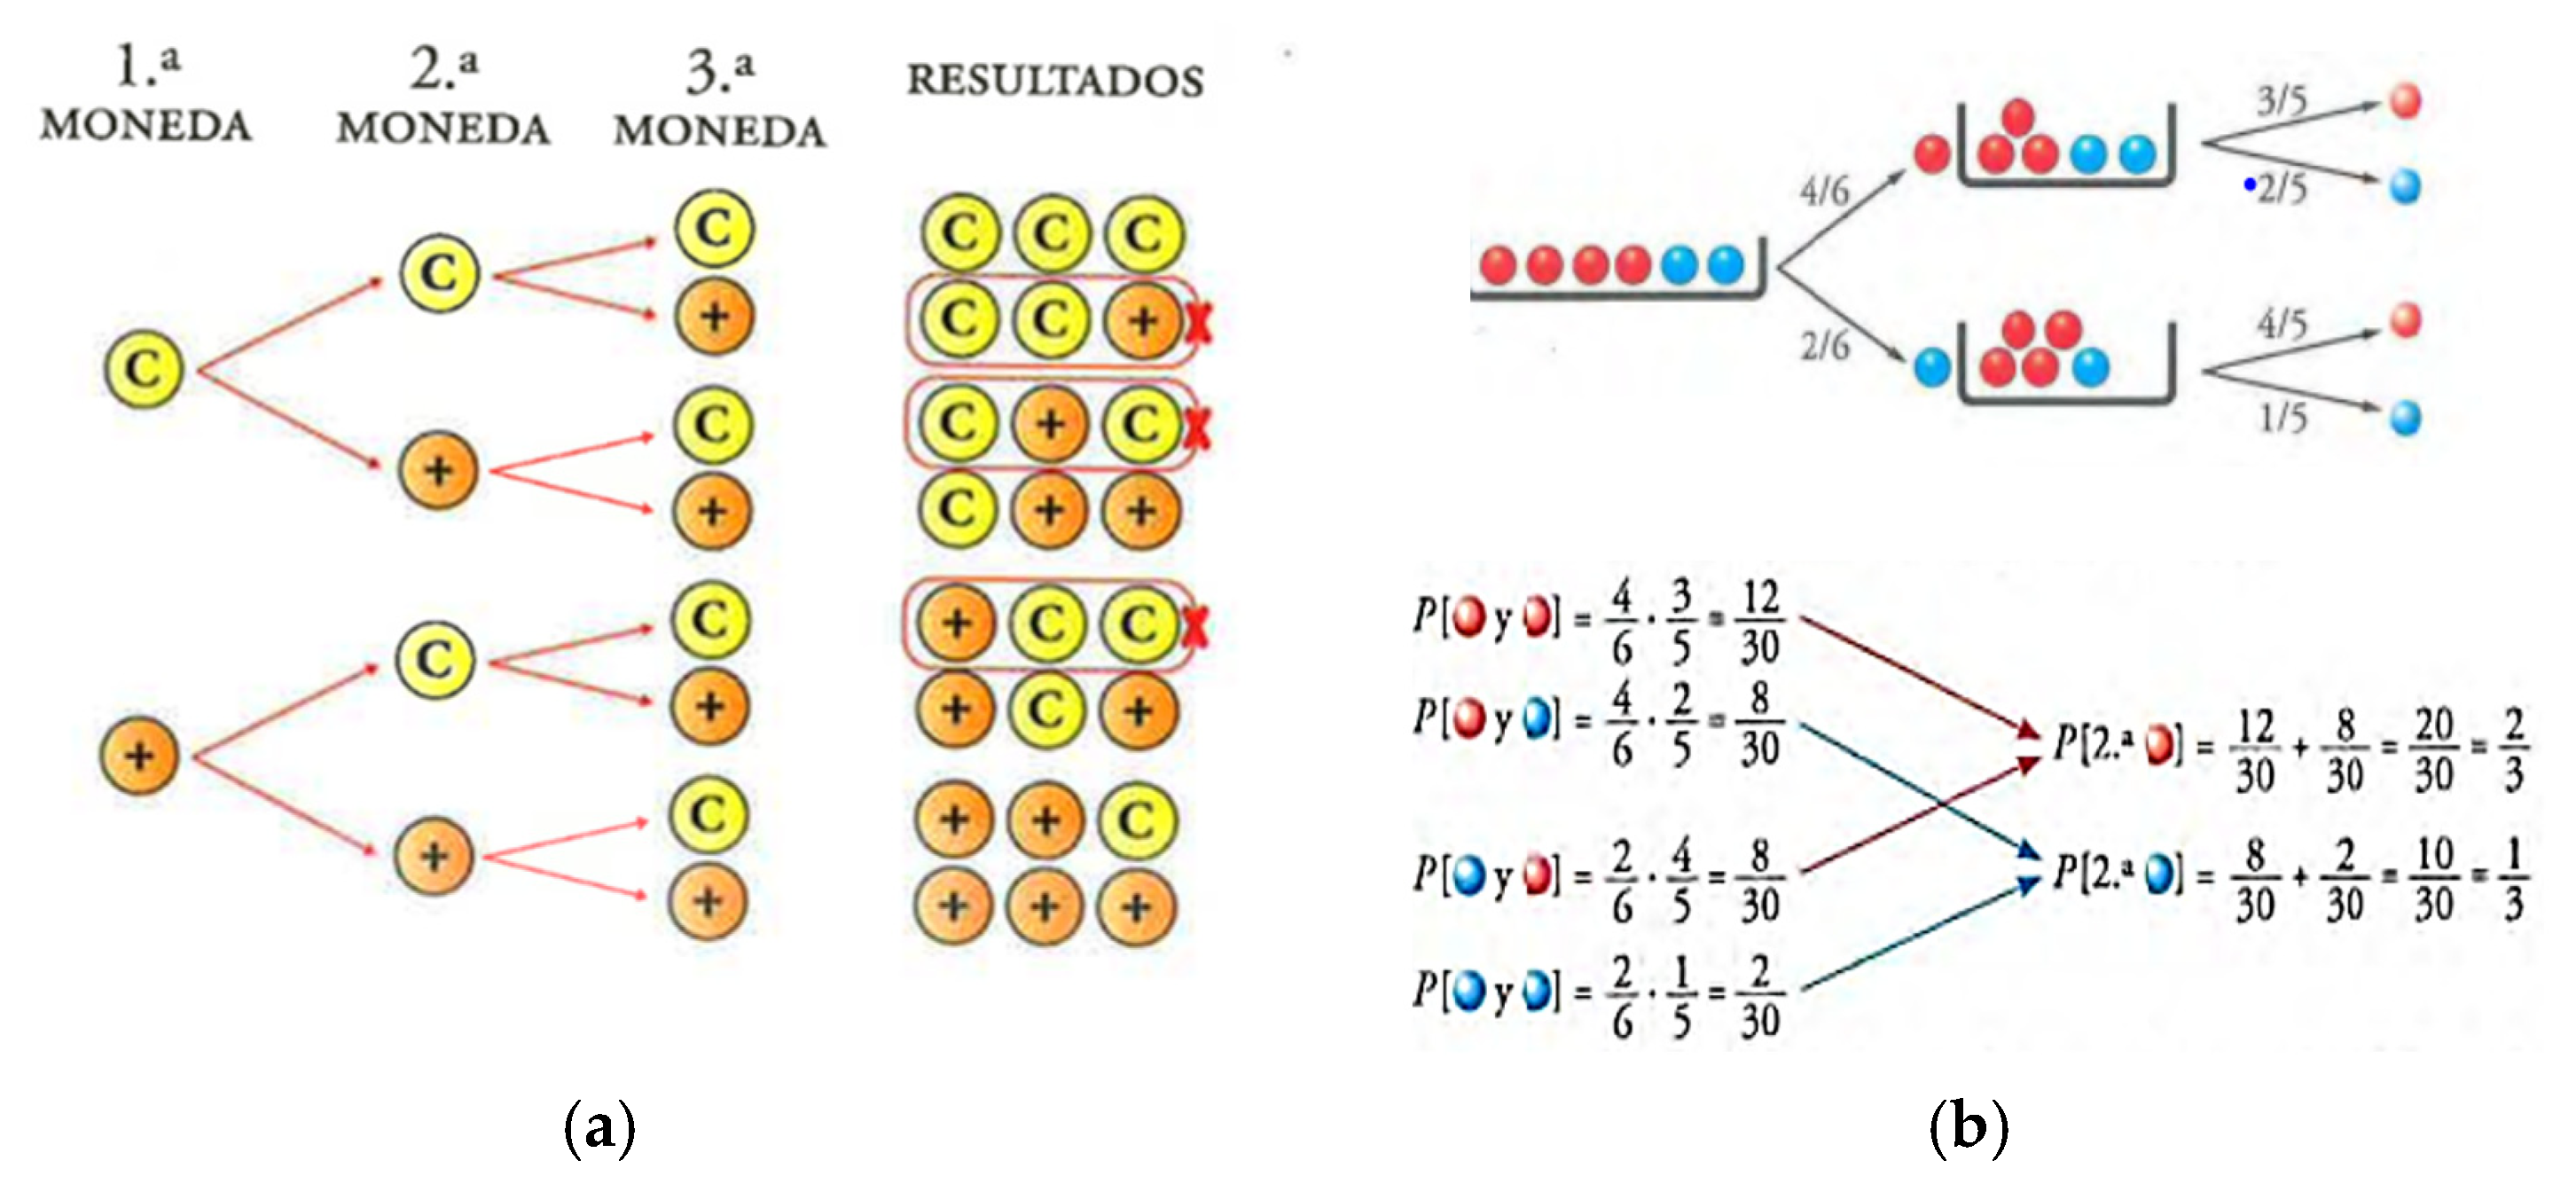
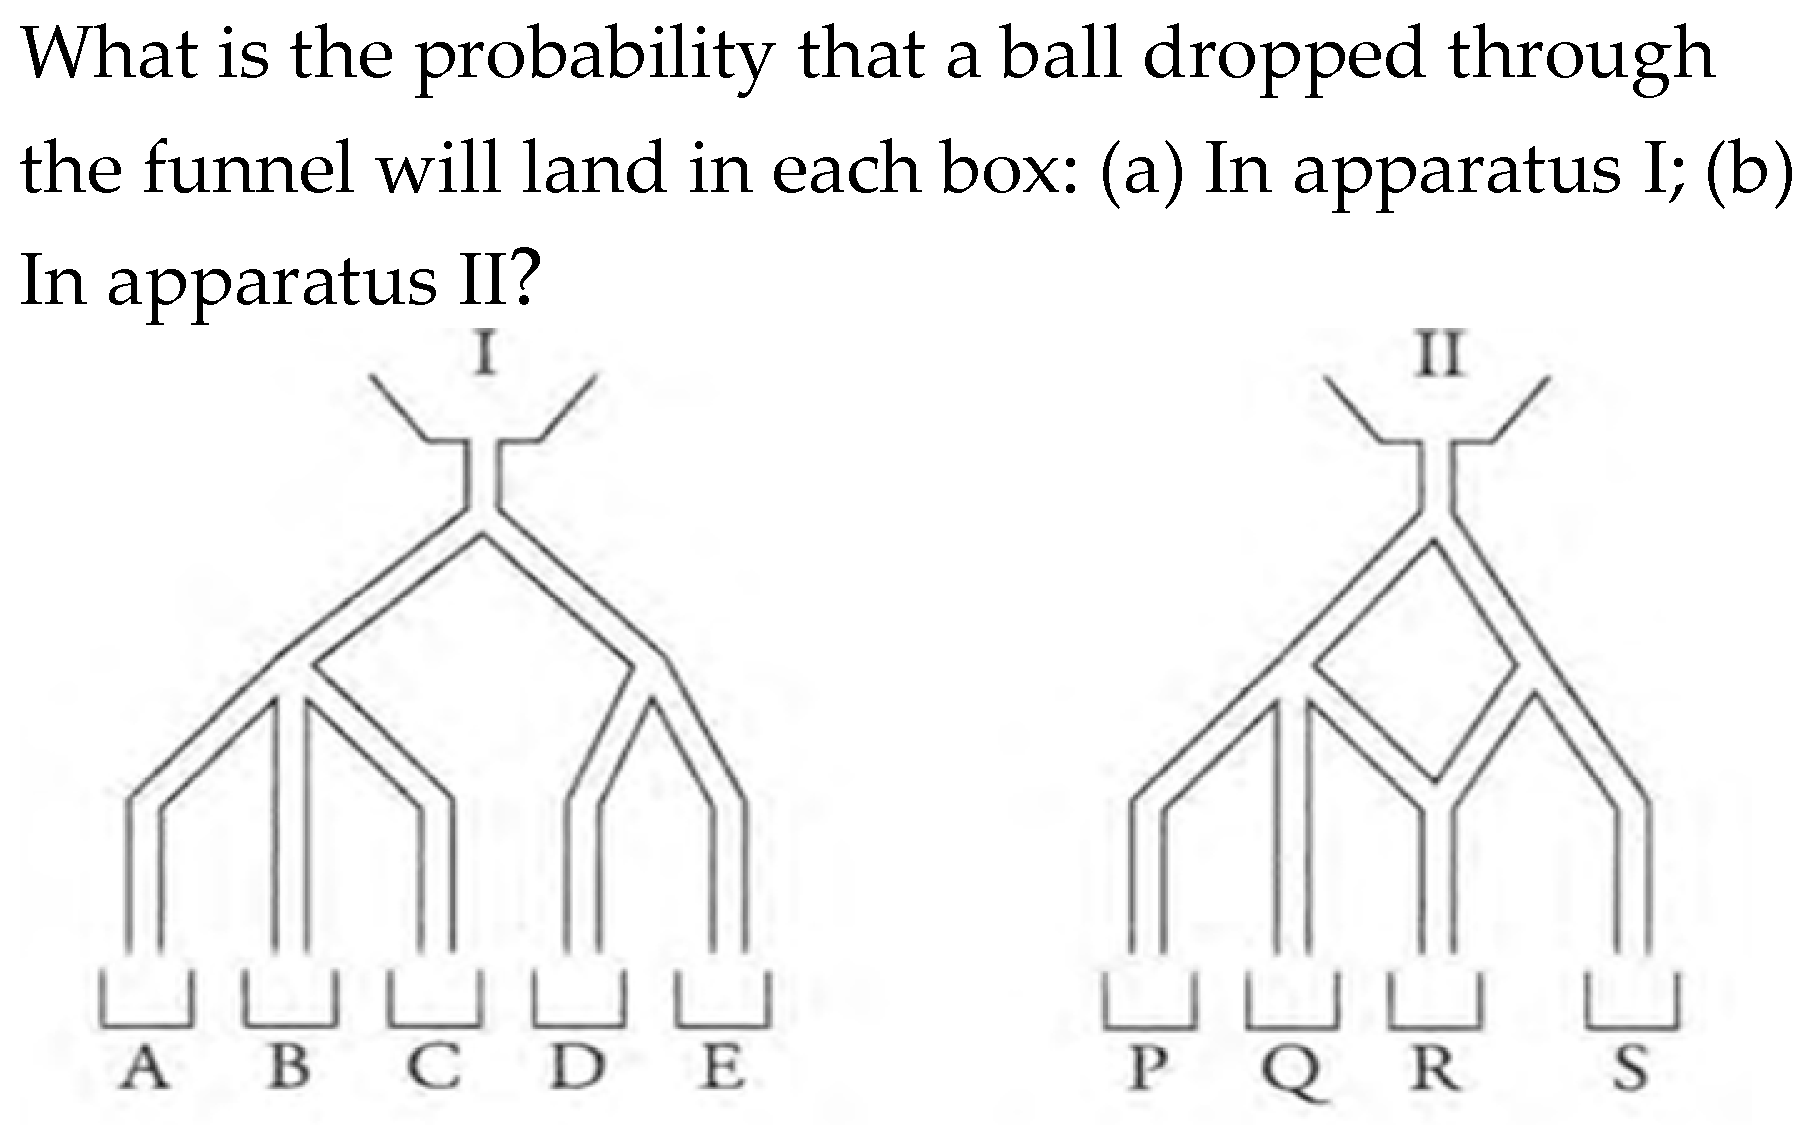
  • Tree diagrams. In these graphs, starting from a first vertex or trunk, different paths or branches are born representing all possibilities and branch out if necessary. Its use in the study of probability was promoted by Fischbein (1975), who indicated that it allows the representation of the mathematical structure of many probability problems and is therefore a productive resource for their resolution. We found two different uses in the textbooks: First, the tree diagram is employed as an aid to the enumeration of all the elements of the sample space in a compound experiment, as shown in Figure 5a. Second, a different application of the tree-diagram is shown in Figure 5b, where the diagram displays the steps in solving compound probability problems, including representations of the events involved in the problem.
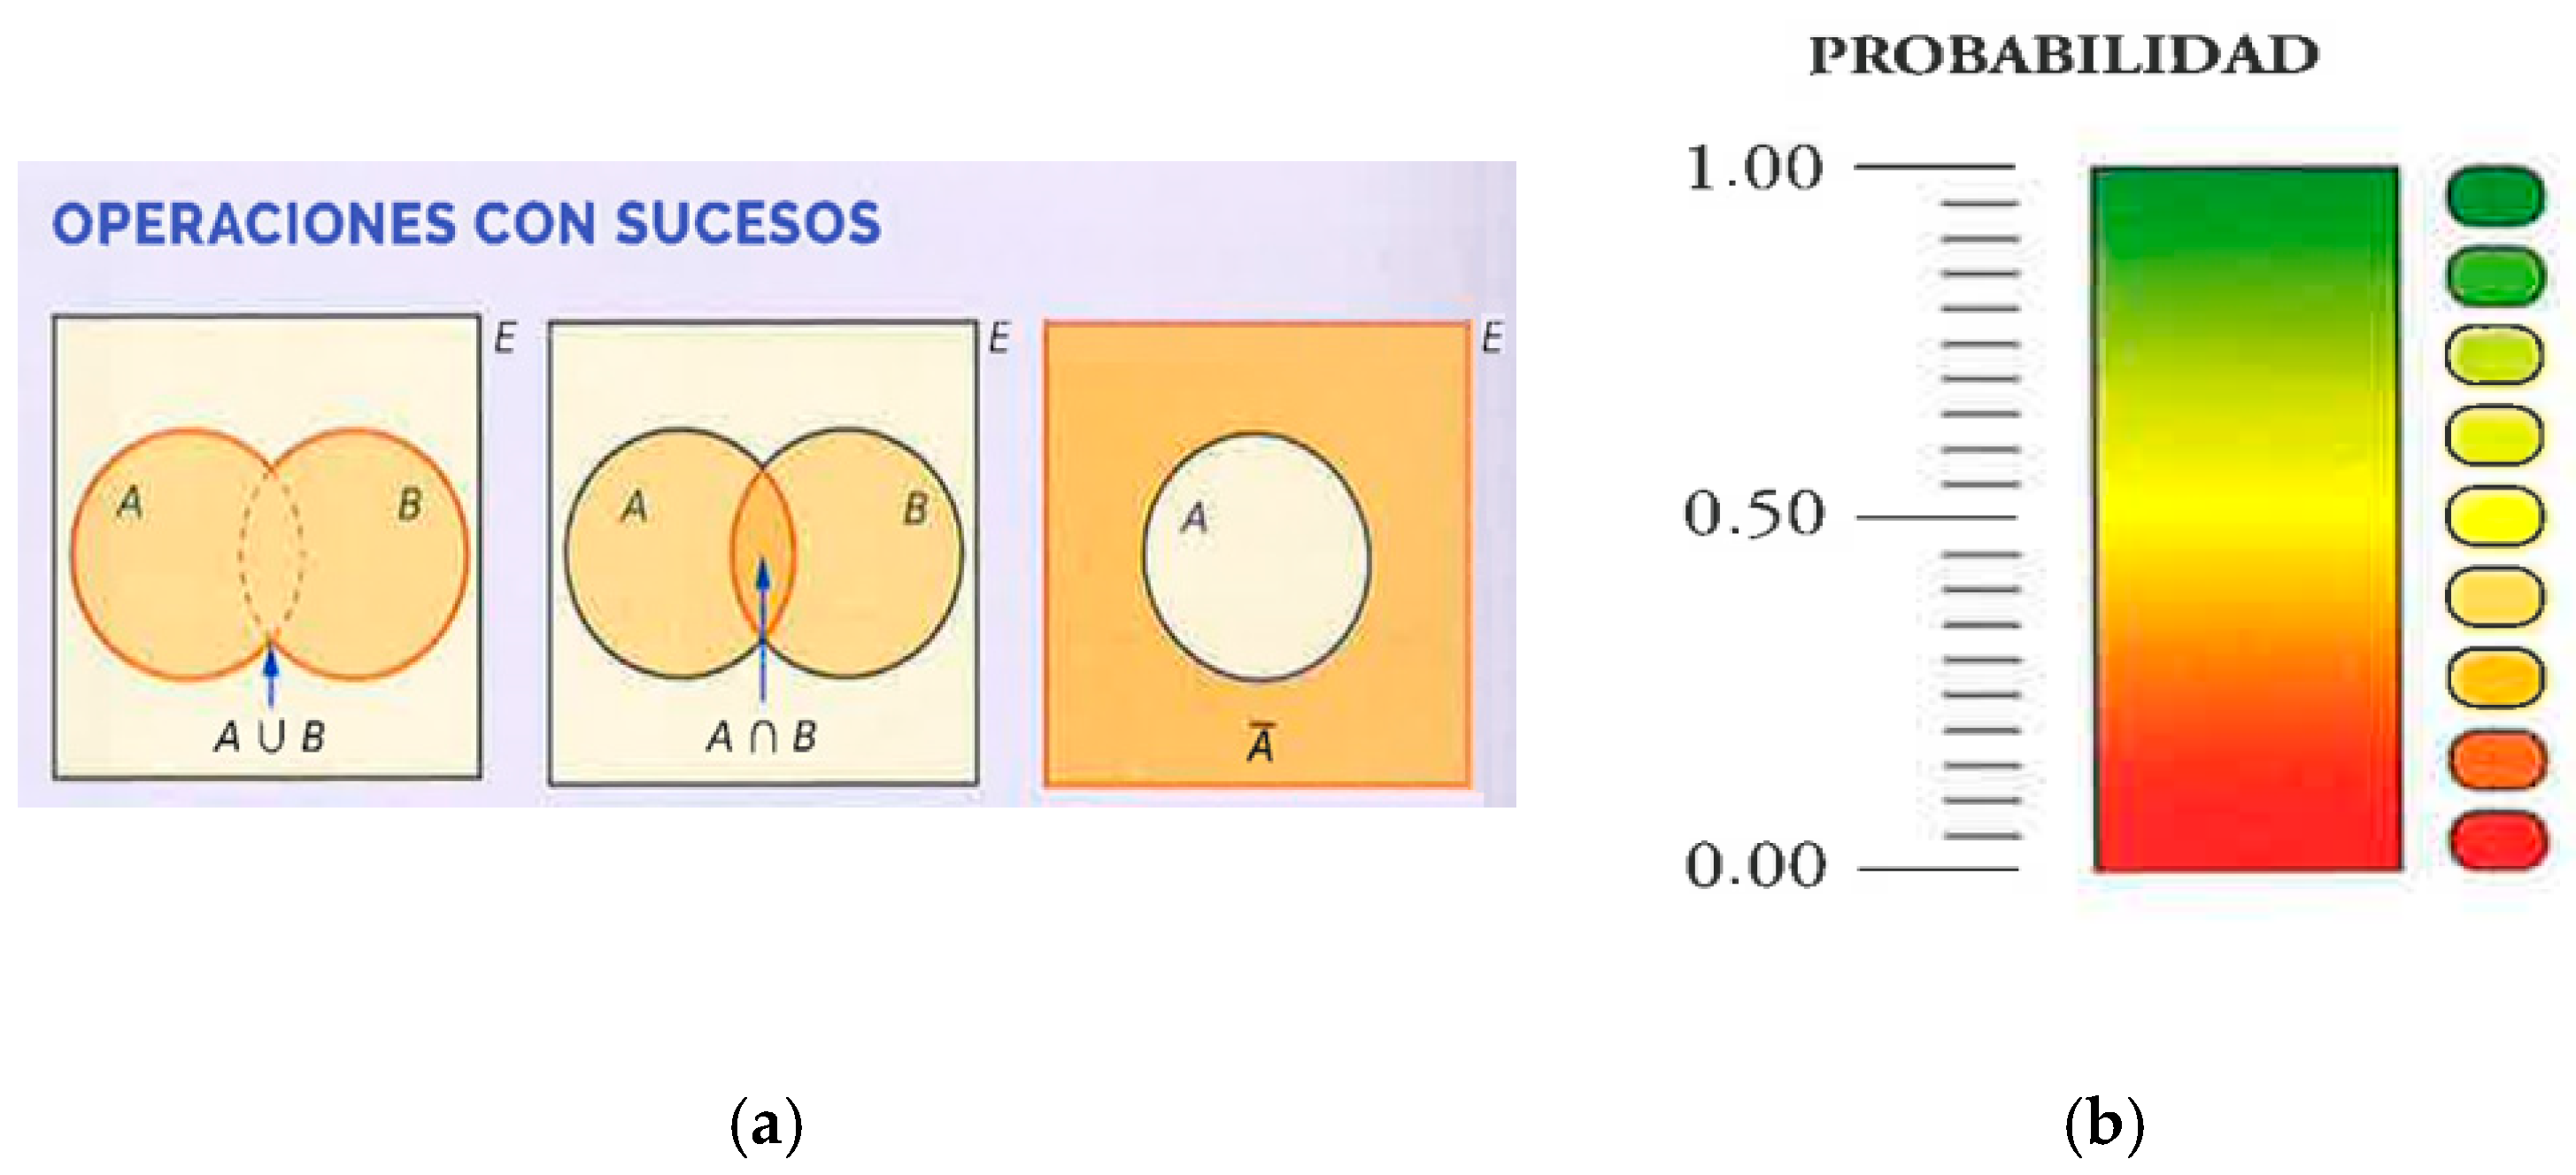
  • Venn diagrams. These diagrams represent all elements of a set in circles and are used in the text to visualize set operations. The events of the sample space are represented by inner circles and are useful for visualizing the operations of union, intersection, and complement, as well as the opposite to a given event. An example is presented in Figure 6a.
  • Probability scale. In this scale, the probability of an event is represented within an interval between zero, which corresponds to an impossible event, and one, which is assigned to a certain event. It is used so that the student qualitatively assigns probabilities to the events of an experiment by placing them physically on the scale. Sometimes, as in Figure 6b, graduation marks and some values are added (in the example, the values 0, 0.5, and 1 have been added).
  • Schematic representation of random devices. The textbooks include representations of random devices, such as coins, urns with balls, roulette wheels, dice, and channels (Figure 7). Their function is usually to increase students’ interest in the proposed activity.
  • Other images and photographs. We found some images or photographs that serve to visually support problem situations or the theoretical exposition of the content.

4. Results

In this section, we present the results obtained for each considered language type.

4.1. Verbal Language

For this variable and following the method of Gea (2014) and Ortiz (2002), we studied the textbooks in the sample in detail and identified words used in the textbooks to describe probabilistic concepts or procedures, present problems, and discuss examples in the lesson. The Appendix A presents the different categories of words introduced for the first time in each grade level by the publisher Anaya, as shown in Table A1, Table A2, Table A3 and Table A4. Similarly, Table A5, Table A6, Table A7 and Table A8 display the same information for the publisher Santillana. The words in these tables are listed alphabetically in Spanish, and each is accompanied by its English translation.
In both editorials (Table A1 and Table A5), we found various words from the students’ everyday language used with their usual meaning. Like Ortiz (2002), some of them serve to refer to random devices (ball, card, coin, dice, lottery drum or urns), the action to be performed on them (cast, draw, pick, roll, throw), or the results (ace, heads, tails). Other terms refer to the probability of an event (possibility) or its degree (possible, probable); in the latter case, adverbs of quantity are used to graduate the probability (a lot, a little).
Other everyday words, displayed in Table A2 and Table A6, have a somewhat different meaning in probability than in daily life. For example, the word “correct” is used to refer to a balanced coin, although in ordinary life it may serve to qualify, for example, a solution or strategy in solving a problem. Likewise, the words certain and impossible do not have the meaning attributed to them in colloquial language, which causes a lot of difficulty to students, as has been proven in some studies, for example, those of Green (1983) or Nacarato and Grando (2014). Neither are the terms union and intersection, which refer to operations with events, employed in the same way in everyday life; for example, intersection can be used in a geometrical sense even in mathematics. Other words, such as “astralagus”, may be unfamiliar to the student. On the other hand, regular or irregular refers to unbiased random devices or even to random experiments with equiprobable or non-equiprobable outcomes. This use of words is common in probability texts and is intended to simplify the subject, although it may cause semiotic conflicts (Godino, 2024), as the student learns the correct terms as learning progresses.
Table A3 and Table A7 show the basic mathematical terms, and Table A4 and Table A8 show the specific probability words that appear in the textbooks for both publishers. The first ones are necessary for understanding the subject and should already be known at the beginning of the course. Some refer to numbers, arithmetic operations, proportion or frequency, geometric figures, or actions, such as compute or count. Others refer to concepts such as relative frequency or proportion, which correspond to the unit of statistics that precedes that of probability, and the student will have to learn the correct terms.
There are not as many specific probabilistic terms as those of the usual language, since the authors tried to describe the concepts of the theme using as much daily language as possible to facilitate their understanding. Even so, we found a variety of terms referring to the simple or compound random experiment (random experiment, simple or compound, dependent and independent experiences). There are also references to the processes and results, the sample space and the events, the representations used, such as the tree-diagram or two-way tables, and the laws of probability (Laplace’s law, Law of large numbers).
Table 2 summarizes the number of terms of each type introduced for the first time by grade level in each publishing house. Figure 8 presents this data in a stacked bar graph. As shown in Table 2, the number of everyday language terms exceeds that of specialized terms, particularly in grades 1 and 2, for both Anaya and Santillana. The number of probability-specific terms and general mathematical expressions is comparable across both publishers.
The majority of words drawn from students’ everyday language are introduced in the early grades, with fewer new terms appearing in next grades. A similar pattern is observed with everyday words that are used with alternative meanings. In contrast, specific mathematical and probabilistic vocabulary shows greater variation: these terms are introduced more frequently in grades 2 and 4A in Anaya, and in grades 1 and 3 in Santillana.
When comparing the types of words introduced by grade level in each publishing house, Anaya begins in grade 1 with primarily everyday language and a few specific probability terms. In subsequent grades, all word categories appear, with a higher proportion of probability-specific terms in grade 4, option A. Santillana includes all four categories of words across the different grade levels, showing a higher proportion of mathematical terms in grade 1 and a greater emphasis on probability-specific language in grade 4 (the same textbook is used for both options A and B). These patterns suggest that the textbook authors follow the recommendation of Groth et al. (2020), which advocates for the incremental introduction of probabilistic language.

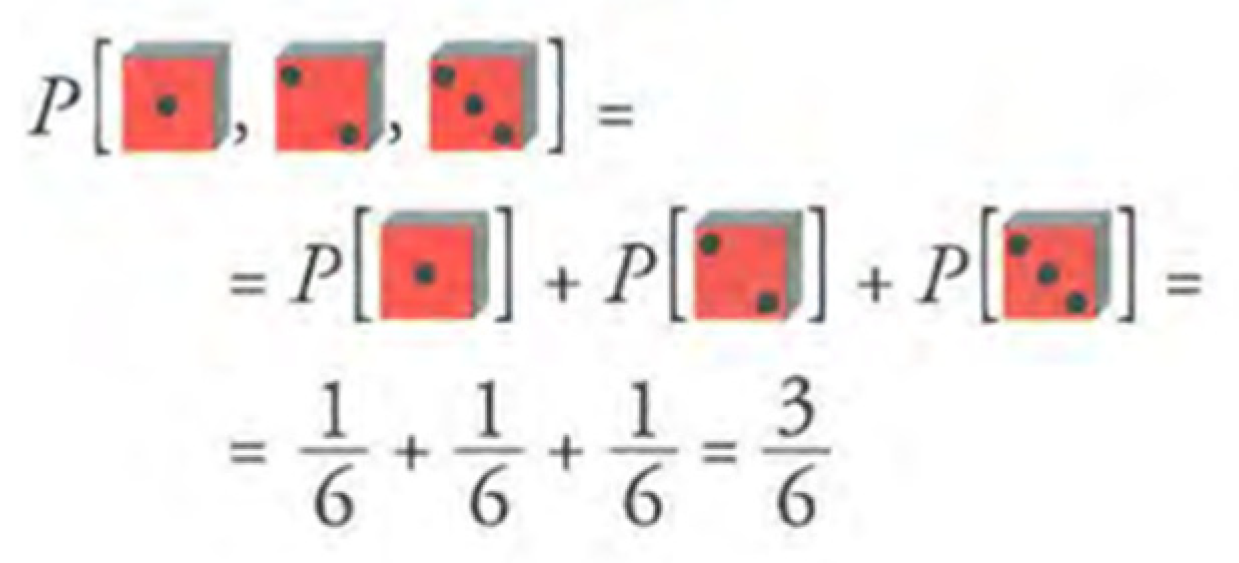
4.2. Symbolic Language

Table 3 includes the symbols found in the texts classified by course. We encountered numerals and fractional or decimal number symbols: the former to indicate integer data (e.g., number of students) or results (e.g., number obtained when throwing a die). Decimal numbers, fractions, and percentages are generally used to express values of probability that mix, both in the exposition of the subject and in the proposed problems. Their use in solving simple problems implies a L0 level of algebraic reasoning (Godino et al., 2014, 2015).
Regarding subscripts, the textbook sometimes mixes their use as a concept symbol, as in the case of relative frequency represented by fr, and to designate the order number in a collection of objects, experiments, or events, e.g., S1, S2.
Similar to Ortiz (2002), we found symbols formed by letters, symbols of fractions, subscripts, functional notation, inequalities and equalities, conditioning symbols, and set notation. Because operations are performed using probabilities, we encountered symbols for arithmetic operations, equality symbols, and parentheses as part of the development of examples and problems. Some letters are used with specific meanings, such as E to refer to the sample space, and S denotes an event. In fact, they play the role of variables in probability expressions such as P(S), which is a functional notation, where P is a function and S is a variable. Although it is not treated in this way in the text, it is implicit.
Therefore, different levels of algebraization were observed in the textbooks (Burgos et al., 2021; Godino et al., 2014, 2015), with not much difference by publisher. Thus, the symbols of whole numbers, fractions, arithmetic operations, the use of the equal sign at the operational level, or the symbols of concrete random experiment results, such as the toss of a coin, correspond to level L0 and appear in both editorials in all the grades.
We also found in grades 2–4 in Anaya and in grades 1–4 in Santillana that the expression of general mathematical objects, such as sample space, event, and complementary events, corresponds to level L2, as well as the expression of probability itself, which is a function in the sample space, as shown by its functional notation P(S). In grade 1, the only algebraic level identified in the Anaya textbooks is Level L0, due to the extremely limited probability content. In the remaining grades, across both publishers, general expressions of mathematical objects are occasionally used in reference to the probability of a concrete event, such as P (face), and then it is worked at level L1. We draw attention to the work with the conditional probability P[B/A], which is a function, where the first event B is the function variable and the second A a parameter; therefore, the indices work for level L4. In both editorials, these expressions are only employed in grade 4 options A and B.
The above symbols are combined with each other in various examples of algebraic expressions; we have considered them as such, as they present operations with previously introduced symbols, although sometimes these expressions are far from those usually used in advanced probability texts, to reduce the formalization of the subject. Such algebraic expressions imply different levels of algebraization when working with probability (Burgos et al., 2021). In the next example, short sentences describing the events involved are used for the probability calculation instead of a symbolic expression; therefore, work is performed at the arithmetic level L0.
P ( w o r k s ) = 0.96 ; P d e f e c t i v e = 0.04 .
In other cases, as in Figure 9, iconic representations of events are used in the algebraic expressions of the probability calculation to facilitate the student’s understanding. By avoiding the use of algebraic symbols, we work at the arithmetic level even when using functional notation.
Another example is the following expression, in which the intersection between events A and B is represented by the expression “and”, as a first step in the calculation. Then, a sentence is included to indicate that event A is expected to occur in the first experiment and event B in the second; finally, the product rule is introduced for the case of dependent experiments.
P [A and B] = P[A]. P[B in the la 2nd/A in the 1st] = P[A]. P[B/A].
In summary, symbols are used in informal algebraic expressions to facilitate comprehension and work with probability. However, operations with abstract symbols and functional notation are also introduced, which indicates a higher level of algebraization. A more formalized use is restricted to grade 4, although not in the whole text. However, in S, set notation is introduced, and the properties of set operations are expressed in general form by means of symbols, as in the following example, in which work is done at the L3 level:
If S ¯ is contrary to S, then S S ¯ = ; S U S ¯ = E .
These symbolic expressions are later used to operate with them:
P S + P ( S ¯ ) = 1   P ( S ¯ ) = 1 − P(S).

4.3. Tabular Language

Following Ortiz (2002), we analyzed the graphical, tabular, and pictorial representations in the textbooks under study. Statistical tables and graphs are among the first contents studied in statistics, and subsequently, they are used to study probability for different purposes. With respect to tables and graphs, and like Ortiz (2002), we only considered those presented in the subject of probability, without analyzing those included in the subject of statistics, which are much more numerous and, moreover, their construction is generally described explicitly.
Table 4 presents the results of the tabular representation analysis in the analyzed texts. We recall that the algebraic reasoning levels assigned to these tables by Pallauta et al. (2023) are L1 for data tables, L3 for frequency tables, and L4 for two-way tables.
We did not find incrementality in the tabular language by grade, as expected, following Groth et al. (2020), because there was no parallel increase in the number of tables by grade. In addition, the higher algebraic reasoning level tables in Anaya appear with similar frequency in the second grade, as in the two options of the fourth grade. In Santillana, they appear only in the fourth grade. The number of tables present in the probability content is 41 in Editorial Santillana and 55 in Editorial Anaya.
Table 4 shows that Anaya does not present tables for the content of probability in the first grade because this publisher considers the teaching of probability only in a learning situation of the unit and not as content to be addressed in this course. In both publishers, the use of two-way tables is predominant, specifically for the results of compound experiments. This accounts for approximately 47% of the tables in editorial Anaya and 53% of the tables in editorial Santillana, which do not use two-way tables to show the sample space of a compound experiment

4.4. Graphical and Pictorial Language

In Table 5, we summarize the different graphical and pictorial representations in the textbooks analyzed.
Anaya uses a greater number of graphical and pictorial representations; we identified 210 representations in Anaya, whereas Santillana has 92 representations. In both editorials, graphical representations are scarce compared to pictorial representations, although the didactic unit on probability immediately follows the one on statistics, in which statistical graphs have been studied. The authors of the texts could have taken advantage of the topic of probability when reviewing these graphs, although they did not. On the other hand, cartograms and line graphs appear only once, although line graphs are appropriate to illustrate the convergence of frequency relative to theoretical probability. In Santillana textbooks, pie charts and line graphs are absent.
The most frequent pictorial representations in both publishers were images and diagrams of random devices, representing 59% in Anaya and 44% in Santillana. The reason for this is the great weight given to the classical meaning of probability, in which most of the proposed problems are contextualized.
It is noteworthy that in Anaya, there are few Venn diagrams and probability scales, whereas in Santillana, there are no probability scales or schematic drawings of random channels.

5. Discussion

In this paper, we presented the results from analyzing the language of probability in two complete series; in total 10 textbooks directed to secondary education grades 1–4, the last with two options: applied (A) and academic (B). In this section, we discuss the research questions that were initially developed and relate our findings to those of previous studies.

5.1. Types and Categories of Language

To answer the first question posed (what type of language is included in the textbooks and how is it categorized?), we examined the probability unit in the sample of textbooks and the verbal, symbolic, tabular, and graphical types considered within mathematical language by Schleppegrell (2007) as multiple semiotic systems.
Regarding verbal language, as in Ortiz’s (2002) study, a great variety of words and expressions were identified, which are used to describe experiments and random generators, the actions performed on them, their results, or allude to their probability. Others allow introducing different concepts linked to probability and, in addition to those cited by Gómez-Torres et al. (2013), include compound experiments, their sample space, conditional and joint probability, and independence, concepts not dealt with in that study, which focused on primary education. In contrast to Gómez-Torres et al. (2013) and Vásquez and Alsina (2015), the terms used focus almost exclusively on the classical meaning of probability, to which the axiomatic meaning is added in the fourth grade and which was not taken into account in the previous studies.
When discussing the type of vocabulary already known by the student, we agree with Adams (2003) that this type of term is used when the study of a new mathematical topic begins. However, a large part of it receives a new meaning in the subject, which is implicit in the texts analyzed, and can provoke semiotic conflicts or interpretations different from those received in mathematics (Godino, 2024) among students.
The properties of polysemy, incrementality, interrelation, and multidimensionality outlined by Groth et al. (2020) are fulfilled in this vocabulary. Polysemy was observed in many of the usual language terms that receive another meaning when studying probability and may contribute to difficulties in their application, such as those found by Green (1983) or G. A. Jones et al. (2007). Incrementality is observed in the fact that the vocabulary acquired in each grade is expanded in the following grades, particularly in the fourth grade, when compound experiments and compound and conditional probability are introduced. The vocabulary is also multidimensional; thus, for example, the terms experiment or event apply to both simple and compound experiments, and the symbolic expressions used in the calculus, such as the product rule, can be generalized indefinitely. Furthermore, there is a strong interrelation between terms such as sample space, event, and probability. All these properties must be acquired for the correct learning of probability and to avoid the challenges posed by using probabilistic language (Nacarato & Grando, 2014; Thatte et al., 2024).
The study of symbolic language suggested a working proposal on the subject with several levels of algebraization (Godino et al., 2014, 2015), which implies different levels of progressive formalization of the subject (Burgos et al., 2021). This is observed in the use of various symbols, from numerals or arithmetic operations to functional notation, and in the case of conditional probability, even the parameter, although its character is implicit.
These symbols are combined in different algebraic expressions, although, to reduce formalization, in formulas such as Laplace’s rule or compound probability, the symbol of an event is often replaced by a verbal description of the event or even by icons. This strategy may initially favor learning, but it will impede synthetic communication and subsequent work with a higher level of complexity in probability (Gea, 2014) and may increase the difficulty of students in interpreting and constructing purely symbolic expressions (Distéfano et al., 2019).
Tabular and graphical representations are scarce, although they can contribute to learning initiated in the subject of statistics. An exception is the two-way table, which is used both to enumerate the sample spaces of the compound experiments and to help in the resolution of the conditional and compound probability problems.
There was also much representation of random devices (sketches, photos, drawings), indicating an overemphasis on the classical meaning of probability.

5.2. Difference Between Editorials

When analyzing the second research question (are there differences between publishers?), we detected a different overall organization of probability teaching in the two publishers analyzed.
The current curricular guidelines (MEFP, 2022) propose probability contents in two blocks: a) some first contents for grades 1 to 3, and other more advanced topics for grade 4. These same guidelines state that in grade 4, two options should be offered: while in option A, aimed at students who will later undertake professional training, mathematics must be applied, in option B (for students who plan to pursue scientific careers), it should be more theoretical and advanced.
These guidelines have led to the fact that in Anaya, there is hardly any content in the first grade, postponing the beginning of the subject to the second grade, except for a few problems of intuitive initiation to probability in the first year. On the other hand, Santillana includes a unit on probability in each of the first three courses, but there is no difference in the fourth course between option A (applied mathematics) and B (academic mathematics), including exactly the same unit in the textbooks for both options.
A greater richness of vocabulary was also detected in Anaya in what refers to everyday language, which indicates a greater effort by this editorial to make the subject accessible to the student. However, the number of mathematical terms was lower, and the specific probabilistic vocabulary was approximately the same.
Another difference is the greater number of tables and graphs in Anaya than in Santillana, which, for example, does not use the two-way tables or the tree diagram to enumerate the sample space of the compound experiments and hardly in the calculation of probabilities of the same, while there is a much greater use in all courses in Anaya. These two visualizations have been recommended by Eichler et al. (2020) and Post and Prediger (2022) for teaching compound and conditional probability, along with others, such as the unit square, which were not considered in the analyzed textbooks.

5.3. Progression by Grade

To answer the third research question (are there differences in language by grade?), the language was analyzed separately by grade.
When comparing the types of words introduced by grade level, Anaya begins in grade 1 with primarily everyday language and a few specific probability terms, while Santillana uses the four types of words from the first grade. The mathematical and probabilistic language is more frequent in the last grades.
Although the symbolic language used does not show much difference in the first three grades, there is a more formalized presentation in the fourth grade, especially in option B of Anaya, where sets notation, operations with sets, and even symbolic operations with probability notation and sets notation are used to introduce properties such as the probability of the complementary of an event. This contributes to the incrementality (Groth et al., 2020) of the symbolic language surrounding that option.
No incrementality per course (Groth et al., 2020) was observed for the tabular and graphical language, except for the contingency table and tree diagram.

6. Conclusions

This study has demonstrated the richness of language in the analyzed texts, where, in addition to vocabulary and symbolic notation, tabular, graphic, and pictorial representations are used to evoke abstract concepts or describe problematic situations. They are also used to show the necessary steps for solving a problem and to carry them out effectively. These representations have conventions that the student must learn, considering the time available for teaching and the ideas of Groth et al. (2020) on the polysemy, interrelation, and multidimensionality of probabilistic language.
Students should recognize the polysemic character of words like certain and impossible, the interrelation between different terms associated with the language of probability, and acquiring this language incrementally. For this purpose, it is important that, in addition to quantitative estimates of probability, qualitative expressions are used because, sometimes, these are forgotten after the acquisition of numerical probability, thus discarding the imprecise meanings used outside the classroom (Groth et al., 2020). Since mathematical symbols can be taught as concepts themselves (De Cruz & De Smedt, 2013), it is important to devote the necessary time to learning probabilistic symbols.
This study updates that of Ortiz (2002), from which two decades have elapsed, and indicates little change with respect to his results, although the authors of the texts have tried to reduce the formalization in the use of language, with respect to the results of the aforementioned author. We also extended the study to the different grades of secondary education, instead of using only one as in the aforementioned work, and we took into account the levels of algebraization reasoning implicit in the different types of symbols, tables, and graphs identified.
We highlight the authors’ commitment to providing examples that resonate with students’ interests and daily lives, as evidenced by the frequent use of everyday language. These words are employed to describe various games of chance that students are familiar with, as well as situations drawn from their own experiences.
We recognize the limitations of the work, having analyzed only two editorials, although this represents an important effort, as 10 books were included in the study. This limitation, however, points to a line for further research by analyzing other publishers or conducting comparative studies with texts from other countries, considering the fundamental role of language highlighted by Pimm (1987).
Finally, the results point to aspects in which the language of probability should be considered by secondary education teachers and textbook writers.

Author Contributions

Conceptualization, C.B. and M.M.G.; Methodology, C.B. and M.M.G.; Formal analysis, M.E.-I.; Data curation, C.B., M.E.-I. and M.M.G.; Writing—original draft, C.B., M.E.-I., and M.M.G.; Writing—review and editing, C.B., M.E.-I., and M.M.G. All authors have read and agreed to the published version of the manuscript.

Funding

This research was funded by Project PID2022-139748NB-100, MICIU/AEI/10.13039/501100011033, Spain/y FEDER, UE and Grant N. 72220183 (ANID, Chile).

Institutional Review Board Statement

Not applicable.

Informed Consent Statement

Not applicable.

Data Availability Statement

Data will be provided in case of reasonable request by M.E.-I.

Conflicts of Interest

The authors declare no conflicts of interest.

Appendix A

Table A1. Everyday words introduced for the first time in each grade during the probability lessons in Anaya, retaining their original meaning.
Spanish Words and TranslationsGradeNumber of Words
Apostar (Gamble), Bola (Ball), Girar (Spin), Posibilidades (Possibilities), Realización (Realization), Sacar (Draw).16
Aleatorio (Random), Aparato (Apparatus), Arrojar (Throw), As (Ace), Azar (Chance), Baraja (Deck), Bastos (Clubs), Bolsa (Bag), Bombo (Lottery drum), Cartas (Cards), Chincheta (Thumbtack), Dado (Dice), Defectuoso (Defective), Depender (Depend), Dominó (Dominoes), Embudo (Funnel, Echar (Launch), Extraer (Extract), Ganar (Win), Juego (Game), Juego de azar (Game of chance), Lanzar (Throw), Moneda (Coin), Naipes (Cards), Observar (Observe), Obtener (Obtain), Ocurrir (Occur), Posiciones (Positions), Prueba (Proof), Puntuaciones (Scores), Recipiente (Container), Resultado (Result), Rey (King) Ruleta (Roulette), Suerte (Luck), Tirar (Cast).236
Algún (Some), Averiguar (Find out), Coger (Pick), Conseguir (Get), Distintas (Different), Efectuar (Perform), Escoger (Select), Devolver (Return), Individuales (Individuals), Influir (Influence), Lotería (Lottery), Ningún (None), Partidas (Games), Posibilidades (Possibilities), Predecir (Predict), Puntuación (Score), Repartir (Distribute), Salir (Come out), Tocar (Win).319
Acontecimientos (Events), Analizar (Analyze), Esquema (Scheme), Experimentación (Experimentation). Observación (Observation), Opciones (Options), Prever (Foresee), Posible (Possible), Previsible (Foreseeable), Provocar (Provoke), Ramificación (Branching), Razonamiento (Reasoning), Simplificar (Simplify), Urna (Urn).4A14
Acontecimientos (Events), Analizar (Analyze), Esquema (Scheme), Experimentación (Experimentation). Observación (Observation), Opción (Option), Posible (Possible), Provoca (Provoke), Ramificación (Branching), Razonamiento (Reasoning), Simplificar (Simplify), Urna (Urn).4B12
Table A2. Everyday words introduced for the first time in each grade during the probability lessons in Anaya used with alternative or unfamiliar meanings.
Spanish Words and TranslationsGradeNumber of Words
Asignar (Asign), Astrálago (Astralagus), Caso (Case), Cara (Head), Comprendido (Included),
Cruz (Tail), Designar (Design), Equitativo (Fair), Experimento (Experiment), Favorable (Favourable), Figura (Figure), Grado de confianza (Degree of confidence), Imposible (Impossible), Probable (Probable), Regular (Regular), Reparto (Distribution), Imperfecto (Imperfect), Irregular (Irregular), Suceso (Event), Seguro (Certain), Taba (Knucklebone), Volver (Turn over).
222
Condición (Condition), Conjunto (Set), Correcto (Correct), Distribuir (Distribute), Desequilibrada (Unbalanced), Elementales (Elemental), Genes (Genes), Incorrecto (Incorrect), Pertenecer (Belong), Relaciones (Relationships). 310
Composición (Composition), Conjetura (Conjecture), Dependencia (Dependence), Independencia (Independence), Operaciones (Operations), Precisión (Accuracy), Vacío (Empty), Ventaja (Advantage).4A8
Composición (Composition), Conjetura (Conjecture), Dependiente (Dependent), Independiente (Independent), Operación (Operation), Precisión (Accuracy), Vacío (Empty).4B7
Table A3. Mathematical terms introduced for the first time in each grade during the probability lessons in Anaya textbooks.
Spanish Words and TranslationsGradeNumber of Words
Aproximadamente (Approximately), Frecuencia (Frequency), Impar (Odd), Mayor (Greater), Menor (Smaller), Mitad (Half), Número (Number), Par (Even), Problema (Problem), Tabla (Table), Término Medio (Mid term).211
Colectivo (Collective), Cuantitativamente (Quantitatively), Cualitativamente (Qualitatively), Diferencia (Difference), Encuestar (Survey), Frecuencia relativa (Relative frequency), Igual (Equal), Medir (Measure), Múltiplo (Multiple), Producto (Product), Proporción (Proportion).311
Contar (Count), Dodecaedro (Dodecahedron), Frecuente (Frequent), Idéntico (Identical), Intersección (Intersection), Numerado (Numbered), Número primo (Prime number), Subconjunto (Subset), Suma (Sum), Soluciones (Solutions).4A10
Conteo (Count), Dodecaedro (Dodecahedron), Idéntico (Identical), Intersección (Intersection), Numerada (Numbered), Número primo (Prime number), Suma (Sum), Soluciones (Solutions).4B8
Table A4. Probability terms introduced for the first time in each grade during the probability lessons in Anaya textbooks.
Spanish Words and TranslationsGradeNumber of Words
Estimar (Estimate)11
Cálculo de probabilidades (Probability calculus), Diagrama en árbol (Tree-diagram), Espacio muestral (Sample space), Experiencia aleatoria (Random experience), Experiencia regular (Regular experience), Experimentos aleatorios (Random experiments), Instrumento regular (Regular instrument), Ley de Laplace (Laplace’s law), Probabilidad (Probability), Simular (Simulate), Suceso aleatorio (Random event), Sucesos individuales (Individual event), Tabla de contingencia (Contingency table), Teoría de las probabilidades (Probability theory).214
A priori (A priori), Experiencia compuesta (Compound experience), Experiencia irregular (Irregular experience), Ley de los grandes números (Law of large numbers), Suceso elemental (Elementary event), Tabla de doble entrada (Two-way table).36
Cálculo combinatorio (Combinatorial calculus), Composición de experiencias (Composition of experiences), Experiencias compuestas dependientes (Dependent compound experiences), Experiencias compuestas independientes (Independent compound experiences), Experiencias dependientes (Dependent experiences), Experiencias independientes (Independent experiences), Ley fundamental del azar (Fundamental law of chance), Probabilidad condicionada (Conditional probability), Regla del producto (Product rule), Situaciones probabilísticas (Probabilistic situations), Sucesos dependientes (Dependent events), Sucesos incompatibles (Incompatible events), Sucesos independientes (Independent events), Suceso universal (Universal event).4A14
Composición de experiencias (Composition of experiences), Experiencias dependientes (Dependent experiences), Experiencias independientes (Independent experiences), Probabilidad condicionada (Conditional probability), Situaciones probabilísticas (Probabilistic situations), Sucesos dependientes (Dependent events), Sucesos incompatibles (Incompatible events), Sucesos independientes (Independent events), Suceso universal (Universal event).4B9
Table A5. Everyday words introduced for the first time in each grade during the probability lessons in Santillana, retaining their original meaning.
Spanish Words and TranslationsGradeNumber of Words
Acertar (Hit), Adivinar (Guess), Aleatorio (Random), As (Ace), Asegurar (Secure), Azar (Chance), Baraja (Deck), Bola (Ball), Bolsa (Bag), Bombo (Lottery drum), Caer (Fall), Carta (Card), Coger (Pick), Dado (Dice), Determinar (Determine), Elegir (Select), Escoger (Choose), Estrategia (Strategy), Extraer (Extract), Ficha (Card), Ganar (Win), Juego (Game), Lanzar (Throw), Lotería (Lottery), Moneda (Coin), Observar (Observe), Obtener (Obtain), Ocurrir (Happen), Parchís (Parcheesi), Predecir (Predict), Premio (Prize), Posibilidad (Possibility), Posible (Possible), Resultado (Result), Repetir (Repeat), Sacar (Draw), Tarjetas (Cards), Tocar (Win), Tirar (Cast), Urna (Urn).140
Averiguar (Find out), Bingo (Bingo), Chincheta (Thumbtack), Devolver (Return), Dominó (Dominoes), Pronosticar (Forecast), Puntuaciones (Scores), Rifa (Raffle), Ruleta (Roulette), Salir (Come out), Sorteo (Raffle), Tómbola (Tombola).212
Apuesta (Bet), Clasificar (Classify), Decidir (Decide), Oportunidad (Opportunity), Secuencia (Sequence), Suerte (Luck).36
Factibilidad (Feasibility), Reemplazar (Replace).4AB2
Table A6. Everyday words introduced for the first time in each grade during the probability lessons in Santillana used with alternative or unfamiliar meanings.
Spanish Words and TranslationsGradeNumber of Words
Cara (Head), Casos (Cases), Casos posibles (Possible cases), Comprendido (Included), Copas (Cups), Datos (Data), Experimento (Experiment), Favorable (Favourable), Figura (Figure), Serie (Series), Suceso (Event), Oro (Gold), Ordenar (Order), Probable (Probable), Trucado (Tricked).115
Cruz (Cross), Palo (Card suit).22
Basto (Clubs), Ramas (Branches). 32
Asociar (Associate), Equilibrada (Fair), Propiedades (Properties), Unión (Union), Vacío (Empty), Valor (Value).4AB6
Table A7. Mathematical terms introduced for the first time in each grade during the probability lessons in Santillana textbooks.
Spanish Words and TranslationsGradeNumber of Words
Calcular (Compute), Cifras (Figures), Cociente (Quotient), Frecuencia relativa (Relative frequency), Igualdad (Equality), Mayor (Greater), Menor (Smaller), Múltiplo (Multiple), Número (Number), Par (Even), Impar (Odd), Negativo (Negative), Número primo (Prime number), Porcentaje (Percentage), Subconjunto (Subset), Tabla (Table), Total (Total).117
Divisor (Divider), Frecuencia (Frequency), Producto (Product), Resta (Difference), Suma (Sum).25
Conjunto (Set), Contar (Count), Factorial (Factorial), Gráfico (Graph), Medir (Measure), Número consecutive (Consecutive number), Divisible (Divisible), Número Natural (Natural number), Paralelogramo (Parallelogram), Permutación (Permutation), Producto (Product), Punto medio (Mid point). 312
Aproximar (Approach), Intersección (Intersection), Multiplicar (Multiply), Positivo (Positive), Resto (Remainder), Rectángulo (Rectangle), Triángulo (Triangle), Vértices (Vertices).4AB8
Table A8. Probability terms introduced for the first time in each grade during the probability lessons in Santillana textbooks.
Spanish Words and TranslationsGradeNumber of Words
Determinista (Determinist), Equiprobable (Equiprobable), Espacio muestral (Sample space), Experimento aleatorio (Random experiment), Experimento determinista (Deterministic experiment), Suceso aleatorio (Random event), Suceso determinista (Deterministic event), Suceso elemental (Elemental event), Regla de Laplace (Laplace’s rule), Resultados favorables (Favourable results), Resultados posibles (Possible results), Probabilidad (Probability).112
Experimento regular (Regular experiment), Suceso compuesto (Compound event), Suceso equiprobable (Equiprobable event), Suceso imposible (Impossible event), Suceso Seguro (Certain event).25
Diagrama de árbol (Tree-diagram), Grado de posibilidad (Degree of possibility), Probabilísticamente (Probabilistically), Suceso contrario (Contrary event), Suceso total (Total event), Suceso Seguro (Certain event), Suceso complementario (Complementary event).37
Experimento compuesto (Compound experiment), Ley de los grandes números (Law of large numbers), Probabilidad condicionada (Conditional probability), Regla del producto (Product rule), Suceso compatible (Compatible event), Suceso dependiente (Dependent event), Suceso independiente (Independent event), Suceso incompatible (Incompatible event).4AB8

References

  1. Abedi, J., & Lord, C. (2001). The language factor in mathematics tests. Applied Measurement in Education, 14(3), 219–234. [Google Scholar] [CrossRef]
  2. Adams, T. L. (2003). Reading mathematics: More than words can say. The Reading Teacher, 56(8), 786–795. [Google Scholar]
  3. Alejo, S., Almodóvar, J. A., Lavado, C., Marín, S., Pérez, L., Pérez, C., Rodríguez, F., & Sánchez, D. (2023a). Matemáticas, 2 ESO. Santillana. [Google Scholar]
  4. Alejo, S., Almodóvar, J. A., Pérez, M., Lavado, C., Marín, S., Pérez, L., Pérez, C., Rodríguez, F., & Sánchez, D. (2023b). Matemáticas, 3 ESO. Santillana. [Google Scholar]
  5. Alejo, S., Almodóvar, J. A., Pérez, M., Lavado, C., Marín, S., Pérez, L., Pérez, C., Rodríguez, F., & Sánchez, D. (2023c). Matemáticas, 4 ESO. Santillana. [Google Scholar]
  6. Almécija, M. E., Barbero, A., Bascuñana, J., Bascuñana, M. I., Gámez, J., Gaztelu, A., Gonfaus, Q., Marín, S., Moyano, M. M., Pérez, C., Ribera, J., Rodríguez, F., Sánchez, D., & Vázquez, J. M. (2022). Matemáticas, 1 ESO. Santillana. [Google Scholar]
  7. Barbero, A., Bascuñana, J., Bascuñana, M. I., Gámez, J., Gaztelu, A., Gonfaus, Q., Marín, S., Pérez, C., Ribera, J., Rodríguez, F., Sánchez, D., & Vázquez, J. M. (2023). Matemáticas, 4 ESO. Opción B. Santillana. [Google Scholar]
  8. Batanero, C., & Borovcnik, M. (2016). Statistics and probability in high school. Sense Publishers. [Google Scholar]
  9. Burgos, M., Batanero, C., & Godino, J. D. (2021). Algebraization levels in the study of probability. Mathematics, 10(1), 91. [Google Scholar] [CrossRef]
  10. Colera, J., Gaztelu, I., & Colera, R. (2023a). Matemáticas, 1 ESO. Anaya. [Google Scholar]
  11. Colera, J., Gaztelu, I., & Colera, R. (2023b). Matemáticas, 2 ESO. Anaya. [Google Scholar]
  12. Colera, J., Oliveira, M. J., Gaztelu, I., Colera, R., & Aicardo, A. (2023c). Matemáticas, 3 ESO. Anaya. [Google Scholar]
  13. Colera, J., Oliveira, M. J., Gaztelu, I., Colera, R., & Aicardo, A. (2023d). Matemáticas A, 4 ESO. Anaya. [Google Scholar]
  14. Colera, J., Oliveira, M. J., Gaztelu, I., Colera, R., Garcia, R., & Aicardo, A. (2023e). Matemáticas B, 4 ESO. Anaya. [Google Scholar]
  15. De Cruz, H., & De Smedt, J. (2013). Mathematical symbols as epistemic actions. Synthese, 190, 3–19. [Google Scholar] [CrossRef]
  16. Distéfano, M. L., Aznar, M. A., & Pochulu, M. D. (2019). Caracterización de procesos de significación de símbolos matemáticos en estudiantes universitarios. Educación Matemática, 31(1), 144–175. [Google Scholar] [CrossRef]
  17. Díaz-Levicoy, D., Ferrada, C., Salgado-Orellana, N., & Vásquez, C. (2019). Análisis de las actividades evaluativas sobre estadística y probabilidad en libros de texto chilenos de Educación Primaria. Premisa, 21(80), 5–21. [Google Scholar]
  18. Drisko, J. W., & Maschi, T. (2016). Content analysis. Oxford University Press. [Google Scholar]
  19. Dunn, P. K., Carey, M. D., Richardson, A. M., & McDonald, C. (2016). Learning the language of statistics: Challenges and teaching approaches. Statistics Education Research Journal, 15(1), 8–27. [Google Scholar] [CrossRef]
  20. Eichler, A., Böcherer-Linder, K., & Vogel, M. (2020). Different visualizations cause different strategies when dealing with Bayesian situations. Frontiers in Psychology, 11, 1897. [Google Scholar] [CrossRef]
  21. Fan, L., Zhu, Y., & Miao, Z. (2013). Textbook research in mathematics education: Development status and directions. ZDM Mathematics Education, 45, 633–646. [Google Scholar] [CrossRef]
  22. Fischbein, E. (1975). The intuitive source of probability thinking in children. Reidel. [Google Scholar]
  23. Gal, I. (2005). Towards “probability literacy” for all citizens: Building blocks and instructional dilemmas. In G. Jones (Ed.), Exploring probability in school: Challenges for teaching and learning (pp. 39–63). Springer. [Google Scholar] [CrossRef]
  24. Gea, M. M. (2014). La correlación y regresión en bachillerato: Análisis de libros de texto y del conocimiento de los futuros profesores [Doctoral dissertation, Universidad de Granada]. [Google Scholar]
  25. Gea, M. M., Pallauta, J. D., Batanero, C., & Valenzuela-Ruiz, S. M. (2022). Statistical tables in Spanish primary school textbooks. Mathematics, 10, 2809. [Google Scholar] [CrossRef]
  26. Godino, J. D. (2024). Ontosemiotic approach in mathematics education. Foundations, tools, and applications. DIGIBUG. Author Edition. [Google Scholar]
  27. Godino, J. D., Aké, L. P., Gonzato, M., & Wilhelmi, M. R. (2014). Niveles de algebrización de la actividad matemática escolar. Implicaciones para la formación de maestros. Enseñanza de las Ciencias, 32(1), 199–219. [Google Scholar] [CrossRef]
  28. Godino, J. D., Neto, T., Wilhelmi, M. R., Aké, L., Etchegaray, S., & Lasa, A. (2015). Algebraic reasoning levels in primary and secondary education. In K. Krainer, & N. Vondrová (Eds.), Proceedings of the ninth congress of the European society for research in mathematics education (pp. 426–432). Charles University in Prague. ERME. [Google Scholar]
  29. Gómez-Torres, E., Ortiz, J. J., Batanero, C., & Contreras, J. M. (2013). El lenguaje de probabilidad en los libros de texto de Educación Primaria. UNIÓN, 9(35). Available online: https://www.revistaunion.org.fespm.es/index.php/UNION/article/view/774 (accessed on 1 July 2025).
  30. Green, D. R. (1983). A survey of probability concepts in 3000 pupils aged 11–16 years. In D. Grey, P. Holmes, V. Barnett, & G. Constable (Eds.), Proceedings of the first international conference on teaching statistics (pp. 766–783). Teaching Statistics Trust. [Google Scholar]
  31. Groth, R. E., Bergner, J. A., & Austin, J. W. (2020). Dimensions of learning probability vocabulary. Journal for Research in Mathematics Education, 51(1), 75–104. [Google Scholar] [CrossRef]
  32. Han, S. Y., Rosli, R., Capraro, R. M., & Capraro, M. M. (2011). The textbook analysis on probability: The case of Korea, Malaysia and US textbooks. Research in Mathematical Education, 15(2), 127–140. [Google Scholar] [CrossRef]
  33. Herbel, B. A. (2007). From intended curriculum to written curriculum: Examining the voice of a mathematics textbook. Journal for Research in Mathematics Education, 38(4), 344–369. [Google Scholar] [CrossRef]
  34. Hiebert, J. (1998). A theory of developing competence with written mathematical symbols. Educational Studies in Mathematics 19, 333–355. [Google Scholar] [CrossRef]
  35. Hokor, E. K. (2023). Probabilistic thinking for life: The decision-making ability of professionals in uncertain situations. International Journal of Studies in Education and Science, 4(1), 31–54. [Google Scholar] [CrossRef]
  36. Huerta, M. P. (2009). On conditional probability problem solving research—Structures and context. International Electronic Journal of Mathematics Education, 4(3), 163–194. [Google Scholar] [CrossRef]
  37. Jones, D. L., & Tarr, J. E. (2007). An examination of the levels of cognitive demand required by probability tasks in middle grades mathematics textbooks. Statistics Education Research Journal, 6(2), 4–27. [Google Scholar] [CrossRef]
  38. Jones, G. A., Langrall, C. W., & Mooney, E. S. (2007). Research in probability: Responding to classroom realities. In F. K. Lester (Ed.), Second handbook of research on mathematics teaching and learning (Vol. 2, pp. 909–955). NCTM & IAP. [Google Scholar]
  39. Lahanier-Reuter, D. (2003). Différents types de tableaux dans l’enseignement des statistiques. Spirale-Revue de Recherches en Éducation, 32(32), 143–154. [Google Scholar] [CrossRef]
  40. Lin, X., Peng, P., & Zeng, J. (2021). Understanding the relation between mathematics vocabulary and mathematics performance: A meta-analysis. The Elementary School Journal, 121(3), 504–540. [Google Scholar] [CrossRef]
  41. Lonjedo, M., Huerta, P., & Fariña, C. (2012). Conditional probability problems in textbooks an example from Spain. Revista Latinoamericana de Investigación en Matemática Educativa, 15(3), 319–337. [Google Scholar]
  42. Ministerio de Educación y Formación Profesional (MEFP). (2022). Real Decreto 217/2022, de 29 de marzo, por el que se establece la ordenación y las enseñanzas mínimas de la Educación Secundaria Obligatoria. MEFP. [Google Scholar]
  43. Morgan, C., Craig, T., Schuette, M., & Wagner, D. (2014). Language and communication in mathematics education: An overview of research in the field. ZDM Mathematics Education, 46, 843–853. [Google Scholar] [CrossRef]
  44. Nacarato, A. M., & Grando, R. C. (2014). The role of language in building probabilistic thinking. Statistics Education Research Journal, 13(2), 93–103. [Google Scholar] [CrossRef]
  45. Ortiz, J. J. (2002). La probabilidad en los libros de texto. Grupo de Investigación en Educación Estadística, Unversidad de Granada. [Google Scholar]
  46. Ortiz, J. J., Cañizares, M. J., Batanero, C., & Serrano, L. (2002, July 7–12). An experimental study of probabilistic language in secondary school textbooks. The Sixth International Conference on Teaching Statistics, Cape Town, South Africa. Available online: https://www.stat.auckland.ac.nz/~iase/publications/1/10_25_ca.pdf (accessed on 1 January 2025).
  47. Pallauta, J., Gea, M., Batanero, C., & Arteaga, P. (2023). Algebraization levels of activities linked to statistical tables in Spanish secondary textbooks. In G. Burrill, L. de Oliveria, & E. Reston (Eds.), Research on reasoning with data and statistical thinking: International perspectives (pp. 17–340). Springer. [Google Scholar] [CrossRef]
  48. Pimm, D. (1987). Speaking mathematically: Communication in mathematics classrooms. Routlege. [Google Scholar]
  49. Post, M., & Prediger, S. (2022). Teaching practices for unfolding information and connecting multiple representations: The case of conditional probability information. Mathematics Education Research Journal, 36, 97–129. [Google Scholar] [CrossRef]
  50. Rezat, S., Fan, L., & Pepin, B. (2021). Mathematics textbooks and curriculum resources as instruments for change. ZDM Mathematics Education, 53, 1189–1206. [Google Scholar] [CrossRef]
  51. Rothery, A. (1980). Children reading mathematics. Worcester College of Higher Education. [Google Scholar]
  52. Schleppegrell, M. J. (2007). The linguistic challenges of mathematics teaching and learning: A research review. Reading & Writing Quarterly, 23(2), 139–159. [Google Scholar] [CrossRef]
  53. Schubring, G., & Fan, L. (2018). Recent advances in mathematics textbook research and development: An overview. ZDM Mathematics Education, 50(5), 765–771. [Google Scholar] [CrossRef]
  54. Sharma, S. (2015). Teaching probability: A socio-constructivist perspective. Teaching Statistics, 37(3), 78–84. [Google Scholar] [CrossRef]
  55. Skemp, R. R. (2012). The psychology of learning mathematics. Routledge. [Google Scholar]
  56. Sriraman, B., & Chernoff, E. J. (2020). Probabilistic and statistical thinking. In S. Lerman (Ed.), Encyclopedia of mathematics education (pp. 675–681). Springer. [Google Scholar]
  57. Thatte, M., Makar, K., & Nimkar, N. (2024). How children with different dialects navigated uncertain language in a statistics investigation. Statistics Education Research Journal, 23(2), 8. [Google Scholar] [CrossRef]
  58. Tizón-Escamilla, N., & Burgos, M. (2023). Creation of problems by prospective teachers to develop proportional and algebraic reasonings in a probabilistic context. Education Sciences, 13(12), 1186. [Google Scholar] [CrossRef]
  59. Usiskin, Z. (2013). Studying textbooks in an information age—A United States perspective. ZDM Mathematics Education, 45, 713–723. [Google Scholar] [CrossRef]
  60. Van Den Ham, A. K., & Heinze, A. (2018). Does the textbook matter? Longitudinal effects of textbook choice on primary school students’ achievement in mathematics. Studies in Educational Evaluation, 59, 133–140. [Google Scholar] [CrossRef]
  61. Van Dooren, W. (2014). Probabilistic thinking: Analyses from a psychological perspective. In E. Chernoff, & B. Sriraman (Eds.), Probabilistic thinking. Presenting multiple perspectives (pp. 123–126). Springer. [Google Scholar] [CrossRef]
  62. Vásquez, C., & Alsina, A. (2015). Un modelo para el análisis de objetos matemáticos en libros de texto chilenos: Situaciones problemáticas, lenguaje y conceptos sobre probabilidad. Profesorado, 19(2), 441–462. Available online: http://hdl.handle.net/10481/37386 (accessed on 2 July 2025).
  63. Vygotsky, L. S. (2012). Thought and language. MIT Press. [Google Scholar]
Figure 1. Example of use of different types of words in only one paragraph. (a) Excerpt taken from Colera et al., 2023b, p. 314. (b) Translation.
Education 15 00979 g001
Figure 2. Examples of tables: (a) data table displaying the average expenditure in lottery in different Spanish regions; (b) frequency table presenting the absolute and relative frequencies of the heads (C) and tails (+) when flipping a coin 1000 times. (a) (reproduced from Almécija et al., 2022, p. 282). (b) (reproduced from Colera et al., 2023c, p. 225).
Education 15 00979 g002
Figure 3. Two-way tables representing (A) the sample space in a compound experiment consisting in throwing two dice; (B) data from a compound experiment used to facilitate discrimination between simple, compound, and conditional probabilities. (A) (reproduced from Colera et al., 2023c, p. 224). (B) (reproduced from Colera et al., 2023d, p. 324).
Education 15 00979 g003
Figure 4. Number of times that the first prize in the national lottery was win in different Spanish regions displayed in (a) a bar chart and (b) a cartogram. (a) (reproduced from Almécija et al., 2022, p. 282). (b) (reproduced from Almécija et al., 2022, p. 283).
Education 15 00979 g004
Figure 5. Tree diagrams used for (a) representing the sample space in a compound experiment consisting in flipping three coins, and (b) facilitating the computation of probabilities in the compound experiments. The blue dot before the fraction 2/5 represents the probability to get a blue marble. (a) (reproduced from Colera et al., 2023b, p. 318). (b) (reproduced from Colera et al., 2023c, p. 318).
Education 15 00979 g005
Figure 6. Representations of (a) Venn diagrams to introduce operations with events; (b) scale of probability. (a) (reproduced from Alejo et al., 2023c, p. 186). (b) (reproduced from Alejo et al., 2023c, p. 225).
Education 15 00979 g006
Figure 7. Scheme of random devices (reproduced from Colera et al., 2023c, p. 318).
Education 15 00979 g007
Figure 8. Number of different types of words introduced for the first time by grade level in each publisher.
Education 15 00979 g008
Figure 9. Mixing symbols and icons in algebraic expressions (reproduced from Colera et al., 2023c, p. 315).
Education 15 00979 g009
Table 1. Basic probabilistic content in compulsory secondary education (MEFP, 2022).
Grades 1–3 (p. 149)Grade 4A and 4B (p. 153; p. 157)
Deterministic and Random Phenomena: Identification. Simple Experiments Assigning Probabilities through Experimentation: The Concepts of Relative Frequency and Laplace’s RuleCompound Experiments: Planning, Execution, and Analysis of Associated Uncertainty Probability: Calculations Using Laplace’s Rule and Counting Techniques in Simple and Compound Experiments (e.g., Tree Diagrams and Tables). Applications for Making Sound Decisions.
Table 2. Number of new words introduced for the first time by grade level in each publisher.
Editorial AnayaEditorial Santillana
Type of Word1st2nd3rd4thA4thB1st2nd3rd4thAB
Everyday language used with the same meaning636191412401262
Everyday language used with different meaning or not well known 22108715226
Specific to mathematics 1111108175128
Specific to probability114614912578
Table 3. Symbols used to represent different objects in both editorials and grades.
Concept RepresentedSymbol UsedEditorial AnayaEditorial Santillana
1st2nd3rd4thA4thB1st2nd3rd4thA4thB
Integer numbers1, 2, 3,…xxxxxxxxxx
Arithmetic operations+ − × / () xxxxxxxxx
Number Pi π x
Fractions and decimalsFraction and decimal symbols xxxxxxxxx
Percentage10%, 30% xxxxxx xx
Coin outcomesC, + xxxx
Absolute frequency f i xxxxx xx
Relative frequencyfr xxxxx xx
Implication xxxxxxxxx
Aproximately xxx x
Order and equivalence >, <, ≠, = xxxxxxxxx
Sample spaceE, {} xxxxxxxxx
EventS, A, B xxxxxxxxx
Contrary event S ¯ ,   A ¯ ,   B ¯ xx xxx
Event 1, Event 2, …S1, S2, … x
Impossible event ; P[∅] = 0 xx xxx
Events operations A B ,   A B x xx
{2, 4, 6} = {2} {4} {6} x
ProbabilityP(S), P C ,   P + , P(accident) xxxx
P(A), P [+] P[defective] xxxxx
Conditional probabilityP[B/A] xx xx
Table 4. Number of different tabular representations by editorial and grade.
Tabular RepresentationsEditorial Anaya Editorial Santillana
Grades1st2nd3rd4thA4thB1st2nd3rd4thA4thB
Data table 32 112111
Frequency table 3312 33
Two-way tableSample space in compound experiments 733
Results in compound experiments 1037911 77
Table 5. Number of graphical and pictorial representations in the textbooks by editorial and grade.
Graphical RepresentationsEditorial AnayaEditorial Santillana
1st2nd3rd4thA4thB1st2nd3rd4thA4thB
Bar graphs 22 1 22
Pie chargs 4
Line graphs 1
Cartogram 1
Pictorical Representations
Diagrama en árbolComposition of sample space 4 2 2
Tool to compute probabilities 552 1 11
Diagramas de Venn 1 44
Escala de probabilidad 11
Random devices pictures 553427261210766
Other pictures 31234165581414
Disclaimer/Publisher’s Note: The statements, opinions and data contained in all publications are solely those of the individual author(s) and contributor(s) and not of MDPI and/or the editor(s). MDPI and/or the editor(s) disclaim responsibility for any injury to people or property resulting from any ideas, methods, instructions or products referred to in the content.

