Abstract
This study presents the design and validation process of a new Bebras-based instrument to assess computational thinking (CT) in 7th-grade students. An initial version of the test, composed of 18 multiple-choice items, was piloted with 80 students and revised based on their performance and classroom feedback. The final version, composed of 17 tasks balanced across CT components and difficulty levels, was administered to 1513 students from 86 Spanish schools. No significant gender differences were found in overall performance, supporting the potential of Bebras tasks to provide equitable assessment. An exploratory factor analysis revealed a dominant factor explaining 20% of the variance, and additional evidence (Lord’s index = 10.61) supported the use of a one-dimensional model despite the ambiguous dimensionality of the domain. BBACT offers a balanced and theoretically grounded tool for assessing CT in compulsory education and lays the foundation for future work exploring its validity and application across diverse contexts.
1. Introduction
The assessment of computational thinking (CT) plays a crucial role in integrating it into primary and secondary schools (Grover & Pea, 2013). As highlighted in the systematic review by Tang et al. (2020), more assessment instruments should be developed, with adequate reports on their validity and reliability. In the review by Rao and Bhagat (2024), the evolution of CT assessment is highlighted, along with the need for further research in non-STEM areas and the potential of Bebras tasks within assessment practices. Evaluation attempts for students under the age of 14 have proven complex due to students’ limitations in code reading (Zhang & Nouri, 2019). Additionally, the broad concept of CT has many different conceptualizations with non-matching sets of components (Bocconi et al., 2022).
Despite these limitations, there are many proposals for assessing CT. As general examples, among the already validated and most reliable tools, we can mention the instrument of Román-González et al. (2017b), oriented to block-based programming. A similar aim guided the development of the Competent Computational Thinking Test (cCTt; El-Hamamsy et al., 2025), a psychometrically validated instrument based on multiple-choice items targeting CT concepts across grades 3 to 6. If we restrict ourselves to students in years 9–12 who have already been exposed to programming, we can rely on Lockwood and Mooney’s (2018) proposal. Additionally, there are validated questionnaires, like the one by Wiebe et al. (2019), where Bebras (Dagiene & Dolgopolovas, 2022) items are enriched with other programming-oriented questions, trying to measure the Bebras components (including components such as abstraction, algorithmic thinking, decomposition, evaluation, and generalization (Dagienė & Sentance, 2016)) and programming at the same time. This broader approach to CT is better supported by the literature, as it aims to include facets beyond programming in the definition of CT.
Given the multidimensional nature of CT and its many interrelated components, assessing it poses a significant challenge, like what occurs in other complex educational domains such as mathematics, science, or language. In these contexts, it is common for large-scale assessments like PISA or TIMSS to report an overall score, even when the internal structure of the test is not strictly one-dimensional. This is justified by the priority given to content validity and the practical need to provide teachers and researchers with a single, interpretable measure of student performance. The present study adopts a similar approach, proposing an instrument that captures a broad range of CT components while offering a total score. Thus, the goals of this article are as follows:
- To create an instrument to assess the CT components of decomposition, pattern recognition, abstraction, modeling, algorithms, and debugging in 7th-grade students.
- To analyze students’ performance, considering item-level performance and group differences, with special attention to gender differences.
Based on those goals, the following research questions are posed:
- Is it possible to identify a preliminary factorial structure in the responses to the Bebras-based CT instrument?
- Are there any significant differences in student performance with respect to gender?
2. Theoretical Framework
2.1. Computational Thinking
Jeanette Wing in 2006 was the first person to coin the term CT, describing it as follows: “CT involves solving problems, designing systems, and understanding human behavior by drawing on the fundamental concepts of computer science” (Wing, 2006, p. 33). Foundational ideas underlying Wing’s premise can be traced back to earlier work by Seymour Papert (1980) and Donald Knuth (1974), who explored the pedagogical potential of algorithmic thinking in mathematics education, particularly through the use of programmable environments such as Logo. Similarly, Knuth emphasized the central role of algorithms as a means to understand and organize knowledge, arguing that algorithmic thinking offers a powerful lens for conceptualizing mathematical problems and promoting deeper learning (Knuth, 1974). Following Wing’s first article on the topic, numerous authors and institutions have attempted to define the concept and delineate its components, although there is still no unanimous consensus within the scientific community (Palop & Díaz, 2024; Palop et al., 2025; Tang et al., 2020; Zeng et al., 2023).
While Wing (2006, 2008) provided a foundational definition, other authors have highlighted different relevant aspects of CT, such as the role of the computer in problem-solving (Barr & Stephenson, 2011); the application of computer science tools and techniques in various natural and artificial processes (Royal Society, 2012); the fundamental role of algorithmic thinking (Brennan & Resnick, 2012); the broad and cross-disciplinary nature of CT, framing it as a general cognitive competence applicable beyond programming contexts (Grover & Pea, 2018); and the importance of problem-solving (Grover et al., 2020).
In response to the diversity of definitions, Román-González et al. (2017b) proposed categorizing them into three groups: generic definitions, with Wing’s (2006) seminal work as a primary example; operational definitions, such as that proposed by CSTA and ISTE (2011); and curricular definitions, with Brennan and Resnick’s (2012) being the most prominent. Furthermore, Palop and Díaz (2024) have recently classified CT definitions based on the components that are emphasized, distinguishing between definitions focused on algorithmic thinking, problem-solving, and “thinking like a computer”. The authors also reviewed the most-cited definitions of CT, highlighting the generally overlooked role of data in these definitions and suggesting incorporating data as a fundamental pillar of CT to be reflected in the definition itself, therefore defining CT as “the way of reasoning that allows people to tackle a problem on some data with the aim of having a computer solve it” (Palop et al., 2025, p. 17).
In addition to the lack of consensus regarding the definition of CT, scientific literature often indicates which components, dimensions, facets, or skills constitute CT. These components are understood as parts of the reasoning process inherent to CT, rather than as a series of cognitive factors. Among the most-cited definitions and conceptions of CT, three stand out, all sharing the components of abstraction, algorithms, and problem decomposition: Barr and Stephenson (2011) proposed the collection, analysis, and representation of data, parallelization, and simulation; Selby and Woollard (2014) highlighted automation, evaluation, and generalization; Grover and Pea (2018) proposed debugging, iteration, generalization, pattern recognition, modelling, and simulation; and Angeli et al. (2016) and Shute et al. (2017) considered generalization, debugging, and iteration.
In addition to listing components, some studies have grouped them into categories. Brennan and Resnick (2012) organized CT components into computational concepts, computational practices, and computational perspectives. Bocconi et al. (2022) conducted a comprehensive review of the scientific literature on CT components, compiling a list that divides them into those focused on problem-solving and those centered on programming and computation. With a similar multi-componential aim, Palop et al. (2025) divide CT into three pillars: data, algorithms, and problem-solving. Additionally, they justify and graphically arrange its components according to their proximity to the pillar they predominantly relate to (Figure 1). Due to its multi-componential structure and its suitability for capturing the diversity of skills involved in CT, this model is adopted as the main theoretical framework for the development of the BBACT instrument. Based on this framework, we identified and selected the components that could be effectively assessed through adapted Bebras tasks.
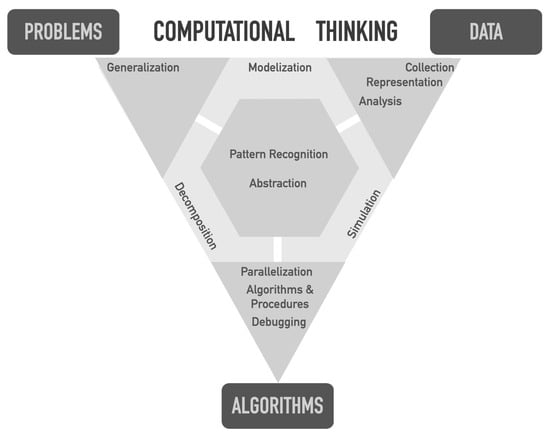
Figure 1.
CT components distribution. Source: Palop et al. (2025, p. 14).
2.2. CT Assessment
Both in the field of CT research and in the educational environment, professionals require methods to assess the effectiveness of their interventions, identify potential deficiencies in teaching and learning processes, and have a reliable guide to the students’ competence levels. Tang et al. (2020, p. 12) indicated that most instruments created to evaluate CT lack evidence of validity and reliability, underscoring the necessity for rigorously validated tools for CT assessment. Additionally, validated instruments have different approaches regarding ages and the conception of CT, so they do not cover the entire spectrum of compulsory education.
Existing instruments can be broadly categorized into three groups, each reflecting a different conception of CT and type of task. Below, we list them divided into three sections. In the first section, we present the pioneering instruments for evaluating CT, which are characterized as focusing on assessing the algorithmic component and utilizing textual programming languages. In the second section, we present a new group of tests that emerged with the rise of block-based programming languages, still primarily focusing on programming skills. Finally, the third section, which represents a minority of the tests, aims to measure a broader construct of CT. Beyond these three groups, which pertain to the components and concepts of CT, there are assessments designed to measure attitudes and motivation toward CT. (Basnet et al., 2018; Huang & Qiao, 2024; Yadav & Chakraborty, 2023).
All early instruments were programming-based, even utilizing specific languages such as Alice. One of the earliest instruments is the Fairy Assessment in Alice (Werner et al., 2012), which measures abstraction, algorithmic thinking, and conditional logic using the Alice programming language. Another early instrument, the Test for Measuring Basic Programming Abilities (Mühling et al., 2015), is focused on program execution through various flow structures. It is also important to remark that the Commutative Assessment (Weintrop & Wilensky, 2015) evaluates computational concepts such as conditionals, defined and undefined loops, and functions using both textual and block-based programming languages.
Within the realm of block-based programming languages, the instrument developed by Mouza et al. (2020) uses Scratch to measure the computational concepts proposed by Brennan and Resnick (2012). One of the most successful instruments is the Computational Thinking Test (CTt) by Román-González et al. (2017a), designed to evaluate concepts such as sequence, loop, iteration, conditionals, functions, and variables within a block-based programming language. There is also a version for younger students named the Beginners Computational Thinking Test (BCCt) by Zapata-Cáceres et al. (2020). Also based on Scratch, we find the Dr. Scratch platform (Moreno-León & Robles, 2015a, 2015b). This feature is reflected in the review by Lu et al. (2022), which found that most CT assessments are related to programming and, in particular, focus on evaluating computational concepts and practices (in the sense of Brennan & Resnick, 2012).
Besides text programming and block-based programming focuses, there is a unique instrument with open-ended and multiple-choice questions aimed to measure the application of CT in everyday life (Chen et al., 2017). Moreover, the instrument by Korkmaz et al. (2017) aims to measure the components of creativity, cooperation, critical thinking, algorithmic thinking, and problem-solving, as proposed by CSTA and ISTE (2011).
2.3. CT Assessment Through Bebras
Bebras (Dagiene & Dolgopolovas, 2022) is a global initiative that promotes CT among children and adolescents through an annual competition. Bebras tasks incorporate the following CT components: abstraction, algorithmic thinking, decomposition, evaluation, and generalization (Dagienė & Sentance, 2016). Their free access has facilitated numerous studies and has made their materials valuable for generating motivation when introducing CT in the classroom (Combéfis & Stupurienė, 2020). Consequently, there arises the question of whether they can also be useful for assessment purposes. Román-González et al. (2017a) noted the growing interest among psychometricians in using Bebras tasks as an evaluation tool. Next, we present the instruments that evaluate CT through Bebras tasks. Following this, we discuss the studies that have attempted to conduct exploratory factor analyses using tests created with Bebras tasks.
Many researchers have developed different instruments based on Bebras tasks to assess CT. Lockwood and Mooney (2018) designed two questionnaires with Bebras items aimed at assessing the CT of adolescents aged 15 to 17. They concluded that Bebras items can be a good way to evaluate CT, but it is necessary to include varied questions in terms of themes and CT components for the instrument to be useful. In an effort to create a compact instrument that integrates different CT components with a block-based programming language, Wiebe et al. (2019) combined the CTt by Román-González et al. (2017a) with Bebras tasks, resulting in an instrument with 25 questions (19 from CTt and 6 from Bebras) for adolescents aged 11 to 13. This approach complements the algorithmic focus while still considering it fundamental. The relationship between the CTt and Bebras tasks was explored by Román-González et al. (2017b), who found a moderate and statistically significant correlation.
This growing interest in assessment through Bebras tasks has encouraged the exploration of the cognitive factors and components of CT. Palts et al. (2017) used data from 7100 participants in the Bebras contest and conducted both confirmatory and exploratory factor analyses, finding only two factors, instead of the five proposed Bebras components. These factors grouped several components and were named algorithmic thinking (including tasks on algorithms and decomposition) and pattern recognition (including abstraction, generalization, and evaluation). Using a similar methodology but different tasks, Souto Oliveira et al. (2021) found three factors, with items related to algorithmic thinking and abstraction appearing consistently, combined with generalization (in the first factor), evaluation (in the second), and pattern recognition (in the third). This indicates that the factorial structure is not very clear and/or that we are able to distinguish dimensions that the instruments do not differentiate. These inconsistencies in factorial structures may be understood in light of what Fernández-Alonso (2005) has described as situations of ambiguous dimensionality, which are common in educational assessments. Despite aiming to measure a single construct, school-based tests often encompass diverse content areas and cognitive processes, thus challenging the assumption of strict one-dimensionality. Therefore, as suggested by (Elosua & López-Jauregui, 2002), one-dimensionality in these contexts should be considered a matter of degree rather than a strict condition, particularly when the content validity of the instrument demands coverage of diverse components.
Researchers have also investigated the relationship between CT learning and gender, although the evidence remains inconclusive. Werner et al. (2012) reported no significant gender differences in the performance of middle school students, whereas Román-González et al. (2017b) identified such differences in similar age groups. Furthermore, Román-González et al. (2017b) observed that gender disparities become more pronounced among older students, a finding that aligns with Atmatzidou and Demetriadis (2016), who reported that girls required more training in robotics to achieve the same proficiency as boys. Similarly, Del Olmo-Muñoz et al. (2020) found that, irrespective of the type of programming activity, boys consistently outperformed girls in CT skills.
Considering the aforementioned studies, there is a need to develop a reliable and validated instrument that balances the components of CT. Moreover, given the discrepancies in the factor structures of different instruments, further research in this area is necessary.
3. Method
3.1. Participants
The participants are 1513 first-year secondary school students (equivalent to 7th grade) from 86 different high schools in Spain. None of the students had prior training in CT. The sample was obtained by convenience, as these were institutions to which the research team had access. Participants were required to accept the clause on the platform where the instrument was administered. Parents and/or legal guardians, as well as school staff, were informed about the study.
3.2. Instrument Design
In the initial design, the instrument called Bebras-based assessment for computational thinking (BBACT) consisted of 18 Bebras tasks1 adapted to single-choice questions with four possible answers, only one of which was correct. The aim of this phase was to explore the preliminary psychometric functioning of the instrument composed. The items were selected based on a prior classification of their difficulty (structured into three levels by the researchers, six items of each difficulty), the CT components according to the Bebras classification, and the researchers’ criteria, aiming to balance components and difficulty.
The researchers conducted a pilot test of the initial design in three classes of 1st-year secondary Spanish school students (N = 80) at a different public school from those used for validation; the test was used only for piloting purposes, not included in the final sample. During this pilot test, both the researchers and the schoolteachers took note of the students’ questions and observations regarding the items and their formulation. The perceived difficulty for each question was calculated following a normal distribution between the top (92.5) and the bottom (20) value, with mean 56.32% and standard deviation 21.84. Questions under 34.48% of success rate were considered difficult, while questions with more than 78.16% success rate were considered easy and can be seen in Table 1.

Table 1.
Summary of items, components, expected and perceived difficulty, success rate of the pilot sample, and decision about the final item set.
Items were selected and adapted based on difficulty, targeted CT component, and classroom feedback from the pilot study. After reviewing both statistical performance (presented in Table 1) and content overlap, one item was removed, and several were rephrased for clarity. The decision criteria included quantitative success rate thresholds and qualitative evaluation by both researchers and teachers. Log order and Log order b were similar, and researchers decided to eliminate the one with the lowest success rate (Log order b). The wording of Items Frieze, Logs, and Watchtower were rephrased to ensure they were appropriate for the required level. The items labelled Jumps, Robot heart, Ball swap, Log order, and Roulette were slightly modified in both wording and content to facilitate comprehension and better focus on the CT component being assessed. Items Rings, Nimm, Bracelet, Footprints, Necklace, Graph, Flipflop, Strip, and Houses remained unchanged. This resulted in a final set of 17 questions that can be seen in Table 1.
This final set of questions was administered to the final sample. This set has a balanced distribution of components, including easy questions that ensure students can solve at least some of the questions to avoid frustration, and difficult questions that enable effective discrimination and accurate assessment of CT.
3.3. Instrument Description
The instrument presented is designed to assess the different components of CT in 1st-year secondary school students (12–13 years old). The selected Bebras tasks, subsequently adapted, address the need to obtain a stable, sufficient, and suitable set of tasks, ensuring the necessary psychometric properties to reliably assess CT, in line with the suggestions by Román-González et al. (2017a).
It is important to emphasize that this instrument does not consider the individual components as measurable cognitive factors but rather as interrelated parts of the CT reasoning process. However, given previous results in similar evaluations using Bebras tasks, the combination of several components could result in a factor forming a factorial structure. Conducting a factorial analysis of the results is crucial to compare them with those of Palts et al. (2017) and Souto Oliveira et al. (2021), shedding further light on a still underexplored topic. The full instrument (in English) can be found at https://hdl.handle.net/10651/75100.
3.4. Process and Analysis
Data were analyzed in different steps using R, version 4.4.2. First, and, given the dichotomous nature of the items, frequencies and percentages for correct and incorrect responses were calculated in the whole sample and in each sub-sample, per item.
First, the percentage of correct responses was used to estimate the difficulty of each item. Second, differences in the proportion of correct vs. incorrect responses for the total scale and for each item according to gender were calculated. ANOVAs were used to explore between-group differences in the whole scale, while the χ2 statistic was used to examine differences for each item separately. These analyses provided information about possible differences in the difficulty of the items according to gender.
Lastly, the internal structure of the BBACT scale was analyzed through Exploratory Factor Analysis (EFA). To assess the suitability of the data for EFA, we computed a polychoric correlation matrix and applied Varimax rotation (similar results were obtained when other rotations were applied). Although the Kaiser–Meyer–Olkin (KMO) index and Bartlett’s Test of Sphericity were also calculated as reference indicators, greater emphasis was placed on indices specifically recommended for ambiguous dimensionality contexts in educational assessments. In particular, we considered the percentage of variance explained by the first factor, as Reckase (1979) proposes that a value above 20% may justify the use of one-dimensional models. Additionally, we applied the index proposed by Lord (1980), which compares the relative difference between the first and second eigenvalues to that between the second and third. This ratio, when greater than 5, is considered evidence in favor of one-dimensionality (Elosua & López-Jauregui, 2002). These criteria were used to guide decisions regarding the dimensional structure of the scale and the legitimacy of applying one-dimensional models in subsequent analyses.
4. Results
4.1. Performance of the Total Sample in Each Item from BBACT
Table 2 shows the frequencies and percentages of correct responses for each item. The percentage of correct answers ranges from 16.83% (Item 7) to 89.19% (Item 5), indicating a wide variability in item difficulty across the instrument.
Table 2.
Frequencies and percentages of correct and incorrect responses for each item and results from Binomial Test.
4.2. Performance in Each Item from BBACT According to Gender
ANOVA indicated that there were no statistically significant differences between male and female students in total scores (F = 0.057; p = 0.812; η2p = 0.00004). The mean score for female students was 8.02 (SD = 2.82), while for male students it was 8.06 (SD = 2.71). Due to the small sample sizes in the non-binary and other gender groups, these categories were excluded from the analysis to avoid distortions in the results. Frequencies and percentages of correct responses can be seen in Table 3.
Table 3.
Frequencies and percentages of correct responses for each item according to gender group.
Further analyses of the differences in correct responses by gender for each item, using the χ2 statistic, as can be seen in Table 4, did not reveal any statistically significant differences (all p-values > 0.05). This suggests that item-level performance was consistent between male and female students across the entire instrument. Non-binary and other gender categories were not included in this analysis due to insufficient sample sizes.
Table 4.
Frequencies and percentages of correct responses for each item and χ2 test value.
4.3. Exploratory Factor Analysis
The initial EFA was conducted using the common criterion of retaining factors with eigenvalues greater than 1. This approach yielded a seven-factor solution that explained 49.9% of the total variance. Although this proportion is relatively modest, the first factor alone accounted for 27% of the variance, suggesting the presence of a dominant dimension. Despite these findings, the multifactorial structure obtained does not appear to reflect the underlying construct of the instrument adequately, nor does it offer a theoretically meaningful organization of the items. Given that the BBACT is an academic performance test designed for middle school students and reflects characteristics typical of educational assessments, alternative approaches more suited to this type of instrument were explored.
In light of Reckase’s (1979) criterion for instruments with ambiguous dimensionality, common in educational tests, attention was directed toward the variance explained by the first factor under a one-dimensional model. In this case, the first factor accounted for 20% of the total variance, which meets the threshold established by Reckase to consider the data sufficiently one-dimensional for practical purposes.
Additionally, Lord’s index was calculated to assess the strength of the first factor. This index is calculated by computing the ratio between the difference of the first and second eigenvalues and that of the second and third. For the BBACT, this index was 10.61, well above the threshold of 5 proposed by Lord, providing further empirical support for the one-dimensionality of the instrument (Elosua & López-Jauregui, 2002).
5. Discussion
BBACT has emerged as an effective assessment tool for evaluating CT in 7th-grade students, covering several key components. This finding is aligned with Lockwood and Mooney’s (2018) work targeting older age groups (15 to 17 years); this coincidence emphasizes the importance of incorporating varied Bebras tasks in terms of themes and CT components to ensure the instrument’s utility. Additionally, Wiebe et al. (2019) developed a test valid for 7th grade, which was a modification of the CTt incorporating Bebras tasks, but in that case, the algorithmic component remained predominant, and the dimensions were not balanced. On the contrary, BBACT addresses that imbalance by including a comprehensive range of CT components: decomposition, pattern recognition, abstraction, modeling, algorithms, and debugging. This new balanced approach ensures that students are assessed on a broader spectrum of CT components, not focusing only on algorithms. By doing so, BBACT evaluates a wider range of CT components but also provides a more holistic measurement of students’ abilities. Thanks to this balance, it is possible to identify, both individually and at the group level, which components students excel in, which is a significant advantage in the educational context, compared with previous CT instruments.
BBACT incorporates a diverse array of questions, spanning from easy to challenging items. This balance of difficulty levels is reflected in the performance data, which reveal significant differences in correct and incorrect responses across the items. The scores for the questions range from 15.2 to 93.7, with a mean of 52.69 and a standard deviation of 22.32. According to this distribution, the items can be classified into three categories based on difficulty, as follows:
- Difficult items: 3 items with accuracy rates below 30.37%.
- Average difficulty items: 11 items with accuracy rates between 30.37% and 75.01%.
- Easy items: 3 items with accuracy rates above 75.01%, including 2 items that are very easy, with accuracy rates exceeding 90%.
This classification highlights the importance of having a wide spectrum in terms of question difficulty, which becomes crucial for classroom assessment practices, considering that teachers and researchers sometimes perceive difficulties differently from students, leading to a metadidactic conflict (Arzarello & Ferretti, 2021) between classroom practices and the validity of assessment tools. By incorporating a wide spectrum of question difficulties, BBACT provides a comprehensive evaluation of students’ CT performance.
When analyzing the differences between researchers’ estimated difficulty and the instrument performance, we find that, initially, researchers distributed the questions to ensure representation of all difficulty levels across all components, except for a high difficulty modeling question. However, the sample distribution of question difficulties across components revealed distinct patterns. In the low difficulty category, there are no decomposition items, while patterns and debugging/algorithms items are present. The average difficulty category encompasses items across all components. For high difficulty, every component appears except modeling. This distribution indicates a varied presence of difficulty levels within each component, suggesting a balanced approach in the question design, as can be seen in Table 5 (component associated with each question can be seen in Table 1).
Table 5.
Difficulty distribution by components.
PISA (OECD, 2022) evaluation reveals a gender gap in mathematics results favoring boys, with a difference of 10 points in Spain. Given that CT is closely linked to mathematics, it is logical that some studies find a positive correlation between mathematics and CT performance (Chongo et al., 2020), find that mathematics could be a predictor of CT level (Guggemos, 2021) and even suggest that work in CT can improve performance in mathematics (Isharyadi & Juandi, 2023). Consequently, it is not surprising that tests evaluating CT and assessed interventions might reflect this gender gap.
The international ICILS assessments on digital competence in 2018 and 2023 included a specific test on CT. In the case of ICILS 2018 (Fraillon et al., 2019, p. 89), the two tasks used to assess CT were mainly based on programming, and the gender results showed a significant difference in favor of boys across all countries. However, when disaggregated by country, significant differences were observed in only two of them. In the case of ICILS 2023 (Fraillon, 2025, pp. 5, 138), the four tasks proposed to assess CT were based on programming, simulation, and data analysis. As in the previous cycle, the overall average favored boys significantly, but country-level differences were not consistent.
As mentioned in the theoretical framework, some authors reported gender differences favoring boys, particularly in higher grades (Atmatzidou & Demetriadis, 2016; Del Olmo-Muñoz et al., 2020; Román-González et al., 2017b), and that could be attributed to females’ lower CT self-concept (Guggemos, 2021). However, in our study, no significant differences were found in overall performance between genders. This finding supports the idea that the use of Bebras tasks instead of Scratch-based tasks could account for this lack of gender difference: Izu et al. (2017), using data from 115,400 students in grades 3–12, also found no significant gender differences in performance when solving Bebras tasks. This finding also supports the idea that in low grades, the evidence about gender is inconclusive, having different results in different assessments. Future studies with larger samples should pay close attention to this aspect. This finding marks the beginning of a highly relevant topic: exploring gender in relation to CT. Although this relationship is just beginning to be explored, it remains largely uncharted. Many instruments and evaluations mentioned in the theoretical framework do not examine student performance by gender (see Lockwood & Mooney, 2018; Mühling et al., 2015; Palts et al., 2017; Souto Oliveira et al., 2021; Weintrop & Wilensky, 2015).
After testing different factorial models, none of them reflected the theoretical structure of the test. This situation, in line with Fernández-Alonso (2005), corresponds to what is known as a test with ambiguous dimensionality. These types of tests are common in educational contexts, with prominent examples including large-scale assessments such as PISA or TIMSS. Despite covering a wide range of content and cognitive processes, these instruments report a single score per domain (e.g., mathematical or linguistic competence), assuming one-dimensionality for practical purposes. Given its similar nature and purpose (to assess the general construct of CT in school settings), the BBACT can be considered to belong to this group. Consequently, specific indices should be applied to evaluate whether a one-dimensional model is acceptable.
Reckase (1979) proposed that a test may be considered sufficiently one-dimensional if the first factor explains at least 20% of the total variance. In the case of BBACT, this condition is met, as the first factor accounts for exactly 20% of the variance. Additionally, Lord’s (1980) index was calculated to assess the dominance of the first factor, yielding a value of 10.61, well above the recommended threshold of 5 (Elosua & López-Jauregui, 2002). This provides further empirical support for interpreting the BBACT as essentially one-dimensional. Finally, according to Cuesta and Muñiz (1994, 1995), when one dominant factor is present, one-dimensional item response models tend to capture that main construct accurately, even if additional minor factors exist. This interpretation allows for the use of a global score that reflects students’ overall CT competence.
6. Conclusions
BBACT offers a promising tool for measuring CT in 7th-grade students, although further adjustments and validations are required. This exploratory study lays a solid foundation for future research and developments, highlighting the importance of accurate and equitable assessment of CT in different educational contexts. To this end, it would be beneficial to conduct comparisons between groups of students engaged in holistic CT learning programs and those focusing exclusively on specific tools, such as Scratch. This would allow for a better understanding of how different educational approaches impact CT development.
As a summary, the component Decomposition is assessed in items 1 (Rings), 2 (Jumps), 3 (Frieze), and 4 (Nimm); item 3 also incorporates Pattern Recognition. The component Pattern Recognition is further addressed in items 5 (Bracelet), 6 (Footprints), 7 (Necklace), and 8 (Logs), while item 14 (Roulette) and item 15 (Strip) combine it with Abstraction. The Algorithms component appears in item 9 (Robot Heart) and is integrated with Debugging in items 10 (Ball Swap) and 11 (Log Order). Abstraction is also present in items 12 (Graph) and 13 (Flipflop). Lastly, the Modeling component is targeted by items 16 (Houses) and 17 (Watchtower). This distribution ensures comprehensive coverage of key CT components, allowing for both general assessment and component-specific analyses.
Moreover, expanding the questionnaire item bank is crucial to improve its psychometric fit and explore their psychometric properties. A greater number and variety of questions would enable a more comprehensive and accurate assessment of students’ CT. This approach could also facilitate the identification of response patterns and the detection of specific areas requiring reinforcement in CT development.
Further research is needed to fully explore the potential of this instrument, including comparisons between different CT teaching approaches and the expansion of the item bank. These steps are essential to enhance the accuracy and utility of the questionnaire in assessing CT in 7th-grade students.
Author Contributions
Conceptualization, J.J.S., B.P. and L.J.R.-M.; methodology, J.J.S., B.P. and L.J.R.-M.; software, J.J.S., T.G. and C.R.P.; validation, J.J.S., B.P., T.G., C.R.P. and L.J.R.-M.; formal analysis, J.J.S., B.P., T.G., C.R.P. and L.J.R.-M.; investigation, J.J.S., B.P. and L.J.R.-M.; resources, J.J.S., B.P., T.G., C.R.P. and L.J.R.-M.; data curation, J.J.S., B.P., T.G., C.R.P. and L.J.R.-M.; writing—original draft preparation, J.J.S.; writing—review and editing, J.J.S., B.P. and L.J.R.-M.; visualization, J.J.S., B.P. and L.J.R.-M.; supervision, J.J.S., B.P. and L.J.R.-M.; project administration, J.J.S. and L.J.R.-M.; funding acquisition, J.J.S., T.G., C.R.P. and L.J.R.-M. All authors have read and agreed to the published version of the manuscript.
Funding
This research was funded by: Grant FPU21/05874 by Ministerio de Ciencia, Innovación y Universidades of Spain (J.J.S.). Project PID2022-139886NB-I00 by Ministerio de Ciencia, Innovación y Universidades of Spain (T.G., C.R.P.). Project PID2021-122180OB-100 by Ministerio de Ciencia, Innovación y Universidades of Spain (T.G., C.R.P.). Project GRUPIN-IDE/2024/000713 from Agencia de Ciencia, Competitividad e Innovación Empresarial Asturiana SEKUENS (J.J.S., T.G., C.R.P., L.J.R.-M.). The data used in this study were collected as part of a project funded by the Education Endowment Foundation, in partnership with the BHP Foundation, within the initiative ‘Building a Global Ecosystem of Evidence for Teaching’ and commissioned by EduCaixa–‘la Caixa’ Foundation as part of the project ‘MAPS–Mathematical Pathways to Computational Thinking’ (all authors).
Institutional Review Board Statement
The study was conducted in accordance with the Declaration of Helsinki, and approved by the Ethics Committee of the University of Oviedo (protocol 15-RI-2022, approved 9 November 2022).
Informed Consent Statement
Informed consent was obtained from all subjects involved in the study.
Data Availability Statement
The data presented in this study are available on request from the corresponding author in accordance with consent provided by participants.
Acknowledgments
Authors want to acknowledge their colleague Rubén Fernández Alonso, for his valuable comments.
Conflicts of Interest
The authors declare no conflicts of interest.
Abbreviations
The following abbreviations are used in this manuscript:
| CT | Computational thinking |
| BBACT | Bebras-based assessment for computational thinking |
| EFA | Exploratory factor analysis |
Note
| 1 | The bebras tasks used in the test were taken from various Bebras repositories, including Bebras Australia (https://www.amt.edu.au/bebras-365) (accessed date: 1 March 2023), Bebras UK (https://www.bebras.uk/), Bebras USA (https://www.bebraschallenge.org/), and Bebras main webpage (https://www.bebras.org/) (accessed date: 1 March 2023). |
References
- Angeli, C., Voogt, J., Fluck, A., Webb, M., Cox, M., Malyn-Smith, J., & Zagami, J. (2016). A K-6 computational thinking curriculum framework. Journal of Educational Technology and Society, 19(3), 47–57. [Google Scholar]
- Arzarello, F., & Ferretti, F. (2021). The connection between the mathematics INVALSI test and the teaching practices. In INVALSI data to investigate the characteristics of student, schools and society: IV Seminar “INVALSI data: A tool for teaching and scientific research (pp. 96–109). FrancoAngeli. [Google Scholar]
- Atmatzidou, S., & Demetriadis, S. (2016). Advancing students’ computational thinking skills through educational robotics: A study on age and gender relevant differences. Robotics and Autonomous Systems, 75, 661–670. [Google Scholar] [CrossRef]
- Barr, V., & Stephenson, C. (2011). Bringing computational thinking to K-12. ACM Inroads, 2(1), 48–54. [Google Scholar] [CrossRef]
- Basnet, R. B., Doleck, T., Lemay, D. J., & Bazelais, P. (2018). Exploring computer science students’ continuance intentions to use Kattis. Education and Information Technologies, 23, 1145–1158. [Google Scholar] [CrossRef]
- Bocconi, S., Chioccariello, A., Kampylis, P., Dagienė, V., Wastiau, P., Engelhardt, K., Earp, J., Horvath, M., Jasutė, E., Malagoli, C., Masiulionytė-Dagienė, V., & Stupurienė, G. (2022). Reviewing computational thinking in compulsory education. JRC Publications Repository, 138. [Google Scholar] [CrossRef]
- Brennan, K., & Resnick, M. (2012, April 13–17). New frameworks for studying and assessing the development of computational thinking. AERA Annual Meeting, Vancouver, BC, Canada. [Google Scholar]
- Chen, G., Shen, J., Barth-Cohen, L., Jiang, S., Huang, X., & Eltoukhy, M. (2017). Assessing elementary students’ computational thinking in everyday reasoning and robotics programming. Computers & Education, 109, 162–175. [Google Scholar]
- Chongo, S., Osman, K., & Nayan, N. A. (2020). Level of computational thinking among students. Science Education International, 31(2), 159–163. [Google Scholar] [CrossRef]
- Combéfis, S., & Stupurienė, G. (2020). Bebras based activities for computer science education: Review and perspectives. In K. Kori, & M. Laanpere (Eds.), Informatics in schools. Engaging learners in computational thinking. ISSEP 2020. Lecture notes in computer science (Vol. 12518, pp. 15–29). Springer. [Google Scholar] [CrossRef]
- CSTA & ISTE. (2011). Operational definition of computational thinking for K-12 education. National Science Foundation. [Google Scholar]
- Cuesta, M., & Muñiz, J. (1994). Utilización de modelos unidimensionales. Psicothema, 6(2), 283–296. [Google Scholar]
- Cuesta, M., & Muñiz, J. (1995). Efectos de la multidimensionalidad. Psicología, 16(1), 65–86. [Google Scholar]
- Dagiene, V., & Dolgopolovas, V. (2022). Short tasks for scaffolding computational thinking by the global Bebras challenge. Mathematics, 10(17), 3194. [Google Scholar] [CrossRef]
- Dagienė, V., & Sentance, S. (2016). It’s computational thinking! Bebras tasks in the curriculum. In Informatics in schools (pp. 28–39). Springer. [Google Scholar] [CrossRef]
- Del Olmo-Muñoz, J., Cózar-Gutiérrez, R., & González-Calero, J. A. (2020). Computational thinking through unplugged activities in early years of primary education. Computers & Education, 150, 103832. [Google Scholar] [CrossRef]
- El-Hamamsy, L., Zapata-Cáceres, M., Martín-Barroso, E., Mondada, F., Zufferey, J. D., Bruno, B., & Román-González, M. (2025). The competent Computational Thinking test (cCTt): A valid, reliable and gender-fair test for longitudinal CT studies in grades 3–6. Technology, Knowledge and Learning, 1–55. [Google Scholar] [CrossRef]
- Elosua, P., & López-Jauregui, A. (2002). Indicadores de dimensionalidad para ítems binarios. Metodología de las Ciencias del Comportamiento, 4, 121–137. [Google Scholar]
- Fernández-Alonso, R. (2005). Evaluación del rendimiento matemático [Unpublished Doctoral thesis, Universidad de Oviedo]. [Google Scholar]
- Fraillon, J. (2025). ICILS 2023 international report: An international perspective on digital literacy (revised). Springer. Available online: https://www.iea.nl/publications/icils-2023-international-report (accessed on 20 May 2025).
- Fraillon, J., Ainley, J., Schulz, W., Friedman, T., & Duckworth, D. (2019). Preparing for life in a digital world: IEA international computer and information literacy study 2018 international report. Springer. Available online: https://www.iea.nl/publications/study-reports/international-reports-iea-studies/preparing-life-digital-world (accessed on 13 February 2023).
- Grover, S., Fisler, K., Lee, I., & Yadav, A. (2020, March 11–14). Integrating computing and computational thinking into K-12 STEM learning. Proceedings of the 51st ACM Technical Symposium on Computer Science Education (pp. 481–482), Portland, OR, USA. [Google Scholar] [CrossRef]
- Grover, S., & Pea, R. (2013). Computational thinking in K–12: A review of the state of the field. Educational Researcher, 42(1), 38–43. [Google Scholar] [CrossRef]
- Grover, S., & Pea, R. (2018). Computational thinking: A competency whose time has come. In S. Sentance, E. Barendsen, & C. Schulte (Eds.), Computer science education: Perspectives on teaching and learning in school (pp. 20–35). Bloomsbury Academic. [Google Scholar]
- Guggemos, J. (2021). Predictors of CT and its growth. Computers & Education, 161, 104060. [Google Scholar]
- Huang, X., & Qiao, C. (2024). Enhancing computational thinking skills through artificial intelligence education at a STEAM high school. Science & Education, 33, 383–403. [Google Scholar] [CrossRef]
- Isharyadi, R., & Juandi, D. (2023). CT in mathematics education: Benefits and challenges. Formative, 13(1), 69–80. [Google Scholar] [CrossRef]
- Izu, C., Mirolo, C., Settle, A., Mannila, L., & Stupuriene, G. (2017). Exploring bebras tasks content and performance: A multinational study. Informatics in Education, 16(1), 39–59. [Google Scholar] [CrossRef]
- Knuth, D. E. (1974). Computer science and its relation to mathematics. The American Mathematical Monthly, 81(4), 323–343. [Google Scholar] [CrossRef]
- Korkmaz, Ö., Çakir, R., & Özden, M. Y. (2017). Validity and reliability of the computational thinking scales. Computers in Human Behavior, 72, 558–569. [Google Scholar] [CrossRef]
- Lockwood, J., & Mooney, A. (2018, September 3). Developing a computational thinking test using Bebras problems. Proceedings of the CC-TEL 2018 and TACKLE 2018 Workshops, Leeds, UK. [Google Scholar]
- Lord, F. M. (1980). Applications of item response theory to practical testing problems. LEA. [Google Scholar]
- Lu, C., Macdonald, R., Odell, B., Kokhan, V., Demmans Epp, C., & Cutumisu, M. (2022). A scoping review of computational thinking assessments in higher education. Journal of Computing in Higher Education, 34(2), 416–461. [Google Scholar] [CrossRef]
- Moreno-León, J., & Robles, G. (2015a, August 12–15). Analyze your Scratch projects with Dr. Scratch and assess your computational thinking skills. Scratch Conference (pp. 12–15), Amsterdam, The Netherlands. [Google Scholar]
- Moreno-León, J., & Robles, G. (2015b, November 9–11). Dr. Scratch: A web tool to evaluate Scratch projects. WiPSCE ’15 Proceedings of the Workshop in Primary and Secondary Computing Education (pp. 132–133), London, UK. [Google Scholar] [CrossRef]
- Mouza, C., Pan, Y. C., Yang, H., & Pollock, L. (2020). A multiyear investigation of student computational thinking. Journal of Educational Computing Research, 58(5), 1029–1056. [Google Scholar] [CrossRef]
- Mühling, A., Ruf, A., & Hubwieser, P. (2015, November 9–11). Design and first results of a psychometric test for programming abilities. Proceedings of the 10th Workshop in Primary and Secondary Computing Education (pp. 2–10), London, UK. [Google Scholar] [CrossRef]
- OECD. (2022). PISA 2022. Results volume I: The state of learning and equity in education. OECD Publishing. [Google Scholar] [CrossRef]
- Palop, B., & Díaz, I. (2024). El pensamiento computacional en el aula. In L. Velázquez (Ed.), Nuevos escenarios educativos, el enfoque competencial y las metodologías activas (pp. 215–244). Grupo Magro Editores. [Google Scholar]
- Palop, B., Díaz, I., Rodríguez-Muñiz, L. J., & Santaengracia, J. J. (2025). Redefining computational thinking: A holistic framework and its implications for K-12 education. Education and Information Technologies, 30, 13385–13410. [Google Scholar] [CrossRef]
- Palts, T., Pedaste, M., Vene, V., & Vinikienė, L. (2017, November 16–18). Tasks for assessing CT skills. ICERI2017 Proceedings (pp. 2750–2759), Seville, Spain. [Google Scholar] [CrossRef]
- Papert, S. (1980). Mindstorms: Children, computers, and powerful ideas. Basic Books. [Google Scholar]
- Rao, T. S. S., & Bhagat, K. K. (2024). Computational thinking for the digital age: A systematic review of tools, pedagogical strategies, and assessment practices. Educational Technology Research and Development, 72(4), 1893–1924. [Google Scholar] [CrossRef]
- Reckase, M. D. (1979). Unifactor latent trait models. Journal of Educational Statistics, 4(3), 207–230. [Google Scholar] [CrossRef]
- Román-González, M., Moreno-León, J., & Robles, G. (2017a, July 13–15). Complementary tools for computational thinking assessment. Proceedings of the International Conference on Computational Thinking Education (pp. 154–159), Hong Kong, China. [Google Scholar]
- Román-González, M., Pérez-González, J. C., & Jiménez-Fernández, C. (2017b). Which cognitive abilities underlie computational thinking? Computers in Human Behavior, 72, 678–691. [Google Scholar] [CrossRef]
- Royal Society. (2012). Shut down or restart? The way forward for computing in UK schools. Royal Society. [Google Scholar]
- Selby, C. C., & Woollard, J. (2014, March 5–8). Computational thinking: The developing definition. SIGCSE ’14, Atlanta, GA, USA. [Google Scholar]
- Shute, V. J., Sun, C., & Asbell-Clarke, J. (2017). Demystifying computational thinking. Educational Research Review, 22, 142–158. [Google Scholar] [CrossRef]
- Souto Oliveira, A. L., Andrade, W. L., Guerrero, D. D. S., & Melo, M. R. A. (2021, October 13–16). How do Bebras tasks explore algorithmic thinking contest? IEEE Frontiers in Education Conference (pp. 1–7), Lincoln, NE, USA. [Google Scholar] [CrossRef]
- Tang, X., Yin, Y., Lin, Q., Hadad, R., & Zhai, X. (2020). Assessing computational thinking: A systematic review of empirical studies. Computers and Education, 148, 103798. [Google Scholar] [CrossRef]
- Weintrop, D., & Wilensky, U. (2015, August 9–13). Using commutative assessments. Proceedings of the Eleventh Annual International Conference on International Computing Education Research, ICER ’15 (pp. 101–110), Omaha, NE, USA. [Google Scholar] [CrossRef]
- Werner, L., Denner, J., Campe, S., & Kawamoto, D. C. (2012, March 9–12). The fairy performance assessment. Proceedings of the 43rd ACM Technical Symposium on CS Education (pp. 215–220), Dallas, TX, USA. [Google Scholar] [CrossRef]
- Wiebe, E., London, J., Aksit, O., Mott, B. W., Boyer, K. E., & Lester, J. C. (2019, February 27–March 2). Development of a lean computational thinking abilities assessment for middle grades students. Proceedings of the 50th ACM Technical Symposium on Computer Science Education (pp. 456–461), Minneapolis, MN, USA. [Google Scholar] [CrossRef]
- Wing, J. M. (2006). Computational thinking. Communications of the ACM, 49(3), 33–35. [Google Scholar] [CrossRef]
- Wing, J. M. (2008). Computational thinking and thinking about computing. Philosophical Transactions of the Royal Society A, 366(1881), 3717–3725. [Google Scholar] [CrossRef]
- Yadav, S., & Chakraborty, P. (2023). Introducing schoolchildren to computational thinking using smartphone apps: A way to encourage enrolment in engineering education. Computer Applications in Engineering Education, 31, 831. [Google Scholar] [CrossRef]
- Zapata-Cáceres, M., Martín-Barroso, E., & Román-González, M. (2020, April 27–30). Computational thinking test for beginners. 2020 IEEE Global Engineering Education Conference (EDUCON) (pp. 1905–1914), Porto, Portugal. [Google Scholar]
- Zeng, Y., Yang, W., & Bautista, A. (2023). Computational thinking in early childhood education: Reviewing the literature and redeveloping the three-dimensional framework. Educational Research Review, 39, 100520. [Google Scholar] [CrossRef]
- Zhang, L., & Nouri, J. (2019). A systematic review of learning computational thinking through Scratch in K-9. Computers and Education, 141, 103607. [Google Scholar] [CrossRef]
Disclaimer/Publisher’s Note: The statements, opinions and data contained in all publications are solely those of the individual author(s) and contributor(s) and not of MDPI and/or the editor(s). MDPI and/or the editor(s) disclaim responsibility for any injury to people or property resulting from any ideas, methods, instructions or products referred to in the content. |
© 2025 by the authors. Licensee MDPI, Basel, Switzerland. This article is an open access article distributed under the terms and conditions of the Creative Commons Attribution (CC BY) license (https://creativecommons.org/licenses/by/4.0/).