Abstract
The assessment of mathematical competence, particularly in real-world problem-solving contexts, has become increasingly crucial in high school educational evaluation. While traditional methods have shifted towards emphasizing problem-solving skills, they remain predominantly outcome-oriented, often failing to adequately capture the nuanced cognitive processes underlying students’ problem-solving behaviors. To address this gap, this study introduces a process-oriented assessment method leveraging eye-tracking technology. Fifty-three university students (primarily first- and second-year undergraduates) in China were recruited to solve six context-based mathematical problems of varying difficulty levels while wearing portable eye-tracking glasses, allowing for natural problem-solving behaviors in a paper-and-pencil test format. The study established a multidimensional model of eye movement features to evaluate problem-solving processes. Using China’s National College Entrance Examination (CNCEE) mathematics scores as the dependent variable, a Partial Least Squares Regression (PLSR) analysis achieved its best predictive performance (prediction R2 of 0.271) based on multidimensional eye movement features when solving the most difficult problem. The first visual intake duration on problem-reading areas and key information regions emerged as significant contributors of the students’ CNCEE scores. These findings substantiate the potential of eye-tracking technology as a valuable tool for educational assessment, offering insights into the assessment of students’ mathematical competence and supporting the development of more comprehensive learning diagnosis and intervention strategies.
1. Introduction
The assessment of mathematical problem-solving competence has gained increasing prominence in high school education, reflecting a paradigm shift from rote memorization to the development of higher-order thinking skills (Amalia et al., 2024; Maamin et al., 2021). This transition aligns with the growing recognition that problem-solving competence serves as an indicator of mathematical literacy and a crucial contributor to academic and professional success, particularly in the context of high-stakes assessments like China’s National College Entrance Examination (CNCEE). However, despite this conceptual advancement, traditional assessment methods in high school mathematics remain predominantly outcome-oriented, often failing to capture the dynamic processes underlying students’ problem-solving behaviors (Black et al., 2012). For instance, two high school students may arrive at the same incorrect answer through fundamentally different approaches: one demonstrating coherent cognitive strategies with minor computational errors, while the other exhibiting disorganized thought processes and fundamental misunderstandings. This critical distinction, which holds significant implications for targeted instructional interventions in high school mathematics education, remains obscured in conventional assessment frameworks.
Eye-tracking technology presents a promising solution to this methodological gap in high school mathematics assessment by providing objective, real-time insights into students’ processes during problem-solving (Feng et al., 2007; Van der Schoot et al., 2009; Wen et al., 2024). Unlike traditional methods that focus solely on final answers, eye tracking enables the examination of how high school students approach problems, allocate attention, and integrate information (X. Chen, 2011; da Silva Soares et al., 2023). Specific eye movement patterns, such as fixation, saccade, and revisit, have been shown to differentiate problem-solving proficiency levels and reveal individual differences in cognitive processing strategies (Andrá et al., 2015; Epelboim & Suppes, 2001; Muldner & Burleston, 2015).
This study aims to advance high school mathematical competence assessment through two key contributions. First, we develop a process-oriented assessment method specifically tailored for high school mathematics, integrating eye movement features to capture the dynamic nature of mathematical problem-solving (J. Chen et al., 2011; M. Huang et al., 2023; Tong et al., 2024). Second, we employ portable eye-tracking glasses in conjunction with high school-level context-based problems and paper-and-pencil tests to enhance ecological validity and better approximate real-world problem-solving scenarios encountered in high school mathematics (Amalia et al., 2024; Van Harpen & Sriraman, 2013). By establishing a multidimensional model of eye movement features, this research provides a novel methodology for evaluating high school students’ mathematical problem-solving competence, offering both theoretical insights into cognitive processes and practical tools for high school educational assessment.
2. Literature Review
2.1. Understanding Mathematical Competence in High School Education
Mathematical competence, as a multifaceted construct, encompasses not only procedural fluency and conceptual understanding but also the ability to apply mathematical knowledge in diverse contexts (Raju & Madhusudan, 2021). This comprehensive view of mathematical competence has gained increasing recognition in educational research, particularly in the context of secondary education (Büchele & Feudel, 2023; Sinay & Nahornick, 2016). For high school students, mathematical competence extends beyond algorithmic proficiency to include critical thinking, logical reasoning, and the ability to solve complex, real-world problems (National Council of Teachers of Mathematics, 2000; Palmér & Van Bommel, 2020). However, the ability to transfer learned knowledge to real-world applications remains a critical gap in high school students’ mathematical competence (ACT, 2006; Ofsted, 2008; Toner, 2011), highlighting the need to clearly define and measure this aspect.
The significance of problem-solving as a core component of mathematical competence is particularly pronounced in high school education. Mathematical problem-solving competence is crucial for success in various fields, such as science, technology, engineering, and mathematics (STEM) (Amalia et al., 2024), and is also a powerful contributor to academic success and career preparation (Hidayat & Sariningsih, 2018). In the high school context, this competence involves the ability to integrate mathematical concepts with real-world scenarios—a skill increasingly emphasized in modern curricula and high-stakes assessments (Amalia et al., 2024; Navianto, 2023; Van Harpen & Sriraman, 2013). For instance, the Programme for International Student Assessment (PISA) framework emphasizes mathematical literacy as the capacity to engage with mathematics in ways that are relevant to students’ lives, focusing on their ability to formulate, employ, and interpret mathematical concepts in real-world contexts (OECD, 2009). This approach highlights the importance of contextualized learning and practical application as key components of mathematical competence, preparing students for the challenges of the 21st century (Jones et al., 2015; Novita & Putra, 2016). This emphasis is further reflected in national assessments, such as China’s National College Entrance Examination (CNCEE), where context-based problems play a significant role in evaluating students’ ability to apply mathematical knowledge to practical situations (Ministry of Education of the People’s Republic of China, 2021).
Beyond its role in assessments, the development of problem-solving skills is crucial for bridging the gap between abstract mathematical concepts and their practical applications (Confederation of British Industry, 2006; National Council of Teachers of Mathematics, 2000; Ontario Ministry of Training, Colleges and Universities, 2005). This alignment with real-world scenarios not only enhances students’ engagement and motivation but also prepares them for the complex challenges they will face in higher education and professional settings (Parviainen et al., 2023; Vordermann et al., 2011; Walport et al., 2010). By fostering problem-solving abilities, high school mathematics education equips students with the cognitive tools necessary to navigate both academic and real-life challenges, underscoring its essential role in shaping future-ready learners.
2.2. Assessing Mathematical Problem-Solving in High School Education
The assessment of mathematical problem-solving has evolved significantly over the past decades, reflecting a global shift towards emphasizing higher-order thinking skills in education. In the 21st century, it is imperative to strengthen the evaluation of students’ competence in addressing real-world situations and problems (Amalia et al., 2024). Internationally, frameworks such as the Programme for International Student Assessment (PISA) have redefined the measurement of mathematical literacy by focusing on students’ ability to solve problems in diverse real-world contexts (OECD, 2009). Specifically, PISA assesses students’ capacity to formulate mathematical models, employ mathematical tools, and interpret results within practical scenarios, thereby evaluating their ability to apply mathematical knowledge in meaningful ways (Binkley et al., 2012; Jones et al., 2015). This perspective underscores the importance of problem-solving as a core component of mathematical competence, particularly in preparing students for the complex challenges of the 21st century (Amalia et al., 2024; Binkley et al., 2012; Navianto, 2023).
In line with this global trend, national educational policies have increasingly prioritized the assessment of problem-solving skills. For instance, China’s National Compulsory Education Quality Monitoring Program (2021 Revision) explicitly emphasizes the importance of evaluating high school students’ mastery of mathematical foundational knowledge, thinking methods, computational skills, and problem-solving abilities. This policy recognizes the critical role of problem-solving in fostering students’ mathematical literacy and preparing them for future academic and professional challenges (Ministry of Education of the People’s Republic of China, 2021). Similarly, other countries have integrated context-based problems into their national assessments, reflecting a broader educational goal of developing students’ capacity to transfer mathematical knowledge to novel, complex situations (Van Harpen & Sriraman, 2013; Novita & Putra, 2016).
Despite these advancements, traditional assessment methods in high school mathematics, primarily examination-based approaches, such as expert evaluation, retrospective self-reports, and learning outcomes (Hofer, 2000; Neumann et al., 2002), have predominantly focused on outcome measures (Ofsted, 2012). While these methods provide efficient means of evaluating procedural knowledge and computational accuracy, they often fail to capture the dynamic processes involved in problem-solving (J. Chen et al., 2023; Susac et al., 2014; Toner, 2011). Traditional assessment methods often fail to capture the processes underlying students’ problem-solving behaviors, as they focus solely on final answers (Black et al., 2012). This limitation is particularly evident when students arrive at the same incorrect answer through fundamentally different approaches, a distinction that remains obscured in conventional assessment frameworks. Such critical distinctions, which hold significant implications for targeted instructional interventions, remain obscured in conventional assessment frameworks.
The assessment of mathematical problem-solving abilities in high school education has evolved significantly since Polya’s (1982/2007) seminal four-stage problem-solving theory, which delineates the processes of understanding the problem, devising a plan, executing the plan, and reflecting on the solution (Polya, 1982/2007). This theoretical foundation has profoundly influenced contemporary approaches to assessing high school students’ mathematical competence, particularly in recognizing the importance of the assessment of processes beyond final answers (Hegarty et al., 1992). The need for more nuanced, process-oriented assessment tools has become increasingly apparent, particularly in light of the growing emphasis on 21st-century skills in high school mathematics education (Ukobizaba et al., 2021). This gap in assessment methodology has spurred interest in innovative approaches that can provide deeper insights into students’ processes during problem-solving, setting the stage for the application of eye-tracking technology in mathematical assessment (Feng et al., 2007; Hyönä et al., 2002).
2.3. Eye-Tracking Technology in Mathematical Competence Assessment
Eye-tracking technology has emerged as a powerful tool for investigating mathematical problem-solving processes (Van Gog & Jarodzka, 2013), grounded in the “eye-mind hypothesis” (Just & Carpenter, 1980) that posits a direct link between visual attention and cognitive engagement (Lu et al., 2021). By recording fixation durations, saccades, and regressions, this technology provides objective, real-time features to quantify information processing behaviors (Tang & Pienta, 2012; Türkoğlu & Yalçınalp, 2024) and examine how learners interact with the visual contents (X. Chen, 2011; da Silva Soares et al., 2023). Portable eye trackers further enable naturalistic observation of problem-solving strategies, capturing the dynamic interplay between visual attention and reasoning (Andrá et al., 2015; Epelboim & Suppes, 2001) that traditional outcome-based assessments often overlook (Susac et al., 2014; Tang & Pienta, 2012).
Eye-tracking features, including fixation duration, saccades, and regressions, serve as indicators of the diverse processes that individuals experience during decision-making and problem-solving (Ting & Gluth, 2024). Empirical studies demonstrate their correlations with cognitive load and strategy use (X. Wang et al., 2022; Wen et al., 2024), offering educators nuanced insights into students’ problem-solving approaches.
Eye-tracking technology is widely used in mathematical problem-solving studies (Lin, 2024; Sharaev et al., 2021). Previous studies utilizing eye-tracking technology have predominantly focused on isolated mathematical tasks, such as algorithmic computations (Kamekona-Mendoza, 2018), equation solving (Sangwin & Kocher, 2016), choice-based formats (Vessonen et al., 2024; Zhao et al., 2021), and brief arithmetic word problems (Feng et al., 2007; H. Wang et al., 2024; J. Zhang et al., 2006). While these studies have successfully identified basic eye movement features associated with task performance, their reductionist approach presents limitations. Specifically, Feng et al. (2007) revealed distinct eye movement patterns between successful and unsuccessful problem solvers where high performers showed longer fixations on key information areas, yet such findings are constrained to isolated procedural steps rather than holistic problem-solving processes. Similarly, J. Zhang et al. (2006) demonstrated that effective problem solvers exhibited faster information localization and more efficient transitions, but their analysis was limited to surface-level lexical processing (e.g., relational words like “more than”), failing to capture higher-order cognitive strategies required for complex problem interpretation and integration. These studies collectively highlight how eye movement features (fixation duration, saccade patterns) can serve as reliable indicators of cognitive engagement in mathematical operations. However, this predominant focus on decontextualized tasks limits the generalizability of findings to real-world problem-solving scenarios that high school students frequently encounter (Van Harpen & Sriraman, 2013) and overlooks the key processes like information encoding, integration, and solution execution. Crucially, they overlook the temporal and phase-specific cognitive demands (e.g., initial comprehension vs. solution verification) inherent in authentic, multi-step mathematical reasoning.
Recent advancements have begun to address this limitation by applying eye tracking to more complex, context-based problems (M. Huang et al., 2023; Tong et al., 2024). Key eye movement features, including fixation, saccade, and revisit, have shown particular promise in revealing individual differences in problem-solving approaches (Andrá et al., 2015; Epelboim & Suppes, 2001; Ting & Gluth, 2024). For instance, longer fixation duration on critical information areas and more efficient saccadic patterns have been associated with higher problem-solving proficiency among high school students (Zhao et al., 2021). These features, when analyzed through advanced techniques such as Areas of Interest (AOI) analysis and sequence pattern recognition, provide valuable insights into students’ processes during mathematical problem-solving (J. Chen et al., 2011; Türkoğlu & Yalçınalp, 2024). For example, AOI-based transition analysis can quantify how frequently students cross-reference key information during solution attempts—a behavior strongly predictive of conceptual understanding (M. Huang et al., 2023). By capturing the dynamic interplay between different cognitive stages, eye-tracking technology can provide a process-oriented assessment that goes beyond traditional outcome-based measures, offering a more comprehensive understanding of students’ problem-solving competence.
Despite these advancements, significant gaps remain in applying eye-tracking technology to assess high school students’ mathematical problem-solving competence in authentic, complex scenarios (Strohmaier et al., 2020). Most existing studies have utilized desktop-based eye trackers in controlled laboratory settings, which may not fully capture the natural problem-solving behaviors of high school students (Duchowski, 2002). Moreover, the integration of multiple eye movement features to comprehensively assess mathematical competence remains underexplored (Yang et al., 2020), particularly in the context of high school education where the cognitive demands of problem-solving tasks are particularly pronounced (J. Chen et al., 2011). The mathematical problem-solving requires multi-stage coordination. Prior eye-tracking studies often overlooked the synergistic effects of multidimensional features, thereby providing fragmented insights into cognitive processes. Recent evidence demonstrates that multivariate models incorporating diverse eye-tracking features (e.g., M. Huang et al., 2023; Tong et al., 2024) significantly outperform single-feature approaches in classification accuracy and process interpretation. Specifically, Tong et al. (2024) found that multivariate feature integration enhanced model precision compared to isolated metrics, underscoring the necessity of this approach for capturing the dynamic nature of mathematical cognition.
The development of portable eye-tracking devices presents new opportunities to bridge these gaps (Duchowski, 2002). By allowing students to engage with problems in more naturalistic settings, these devices can provide richer data on high school students’ problem-solving processes while maintaining the ecological validity of the assessment (Van der Schoot et al., 2009). This technological advancement, combined with the analysis of multiple eye movement features, holds significant potential for developing more comprehensive assessment tools that align with the complex cognitive demands of high school mathematics education (M. Huang et al., 2023; Tong et al., 2024).
3. Research Questions and Hypotheses
Building on the theoretical foundations and methodological gaps identified in previous research, the present investigation employs a process-oriented methodological approach that combines portable eye-tracking technology with authentic, context-based high-school mathematical problems in a paper-and-pencil format. This design aims to maximize ecological validity while maintaining the precision of eye-tracking measurements, addressing a critical limitation of previous laboratory-based studies (Duchowski, 2002; Van Harpen & Sriraman, 2013). Specifically, this study addresses two core questions regarding the assessment of high school students’ mathematical problem-solving competence using a multidimensional eye movement feature model: (1) How does the predictive validity of eye movement features vary across mathematical problems of different difficulty levels in high school mathematics? (2) Which specific eye movement features are most predictive of mathematical problem-solving proficiency in high school students, particularly in complex, context-rich problems?
We hypothesized that a multidimensional model integrating multiple eye movement features is expected to demonstrate superior predictive validity, particularly for complex problem-solving tasks (J. Chen et al., 2011; M. Huang et al., 2023; Tong et al., 2024). This hypothesis is based on the premise that mathematical problem-solving involves multiple interacting processes that are best captured through comprehensive eye movement features. Correspondingly, the study is guided by the two following key hypotheses: (1) The predictive power of eye movement features is expected increase with problem complexity, with the model demonstrating optimal performance for the most challenging context-based problems (X. Wang et al., 2022; Zhao et al., 2021). This expectation is grounded in the observation that complex problems elicit more distinctive processing patterns that are more readily captured by eye movement features. (2) Initial fixation patterns, particularly first visual intake duration on key information areas, are expected to be significant contributors to problem-solving proficiency (Rayner, 2009; H. Wang et al., 2024). This prediction is based on existing evidence suggesting that efficient early information processing is crucial for successful problem-solving.
To test these hypotheses, the study employed a multi-step analytical framework (Figure 1). Firstly, in order to validate the validity of the multidimensional eye movement features model in assessing mathematical problem-solving competence and its differences across various difficulty levels, the study extracted eye movement features of the Areas of Interest (AOIs) based on the problem-solving process, such as fixation, saccade, and revisit, to characterize the cognitive processes during problem-solving. Secondly, a Partial Least Squares Regression (PLSR) model was constructed, with regression residuals of the multidimensional eye movement features (the regression residuals of eye movement features on problem-solving duration) as independent variables to characterize the dynamic processes involved in solving problems of different difficulty levels, and China’s National College Entrance Examination (CNCEE) mathematics scores as the dependent variable to represent the participants’ mathematical problem-solving competence. By calculating the regression residuals of eye movement features on the problem-solving duration, this study effectively removed the influence of the duration factor on the eye movement features, retaining those pure eye movement features that are not related to the problem-solving duration but may reflect the differences in the individual problem-solving process. Combined with the Leave-One-participant-Out Cross-Validation (LOOCV), the correlation between PLSR-predicted scores and true CNCEE mathematics scores, as well as the prediction R2 under different difficulty levels, was calculated. Then, in order to verify the predictive role and contribution of each eye movement feature to mathematical problem-solving competence, a linear inverse mapping regression analysis and a Variable Importance in Projection (VIP) analysis were conducted between CNCEE mathematics scores and eye movement features to identify the most significant eye movement features for predicting problem-solving competence and their prediction directions.
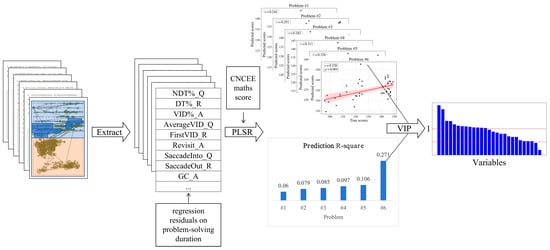
Figure 1.
Multi-step analytical framework: Extract and screen eye movement features (with the regression residuals on problem-solving duration as independent variables) from the students’ problem-solving process of six mathematics context-based problems according to AOIs, with the CNCEE mathematics scores as the dependent variable, and model with PLSR; use the correlation coefficient and significance level of predicted values and true values and the prediction R2 to evaluate the predictive validity of the model under different difficulty levels of problems; use VIP analysis to study the importance of each independent variable to the model.
4. Materials and Methods
4.1. Participants
A total of 53 university students (29 females) were recruited in this study, predominantly consisting of first-year (23) and second-year (25) students, with a smaller number of upperclassmen (5). The selection of primarily lowerclassmen was intended to approximate the mathematical problem-solving proficiency level of high school students. Furthermore, all participants had taken China’s National College Entrance Examination (CNCEE) and were familiar with the mathematical concepts and problem types used in the study. All participants exhibited normal vision (or corrected-to-normal vision).
Due to technical issues with the eye-tracking glasses, data from 7 participants were excluded from the final analysis, resulting in a final sample of 46 participants. The study protocol was approved by the local Institutional Review Board of Tsinghua University (Protocol No. THU202312), and all participants signed written informed consent forms before participating in the experiment. Participants received monetary compensation for their time and effort.
4.2. The Materials: Context-Based Mathematical Problems
The experimental materials consisted of six context-based mathematical problems with varying levels of difficulty, selected from recent high school mathematics mock examinations in China (Figure 2a). These problems covered key topics in high school mathematics, including probability, geometry, and algebra. The problems were chosen by an expert panel of five high-achieving students (scoring 140–150 out of 150 on the mathematics section of the CNCEE) from an initial pool of 33 problems, taking into account factors such as problem complexity, cognitive demands, and real-world relevance. The expert panel, based on the criteria of the context and comprehension complexity of the problems, the requirements of mathematical knowledge and skills, the complexity of calculation, the ability of abstract thinking and modeling, and the openness and depth of thinking, ranked the selected six problems from low to high difficulty levels (Problem #1 to Problem #6) to ensure a balanced representation of difficulty levels in the experiment. To mitigate the potential influence of difficulty order on the experimental results, all participants completed the problems in the same randomized sequence. Specifically, the problem order was pre-shuffled (e.g., Problems#2, #5, #1, #4, #3, #6 correspond to the problem numbers in Figure 2 and Figure A1: Q1, Q2, Q3, Q4, Q5, Q6), and all participants followed this fixed sequence. Each problem required students to provide a solution, including both the process and the final answer, based on the provided textual and graphical information (as shown in the text and images in Figure 2a) within the designated answer area (as shown in the box below Figure 2a. Figures for the other five problems are provided in Figure A1 in Appendix A).
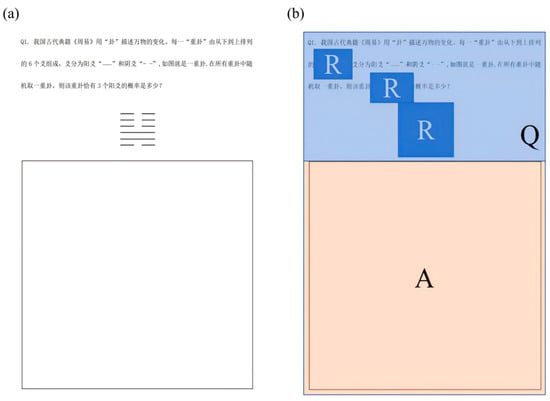
Figure 2.
(a) Example An example of a context-based mathematical problem (Problem #3, Q1, probability of hexagrams, algebra problem). Textual translation of the problem: The ancient Chinese classic I Ching describes the changes in all things using hexagrams. Each hexagram consists of six lines arranged from bottom to top, with lines being either “——” or “— —”. The figure shows a hexagram. What is the probability that a randomly chosen hexagram has exactly three “——” lines? (b) Division of Areas of Interest (AOIs) for eye-tracking analysis. Q represents the problem-reading area, A denotes the problem-solving area, and R indicates the key information area within the problem-reading section.
4.3. Eye-Tracking Apparatus
The experiment utilized the wearable SMI eye-tracking glasses (SMI-ETG) produced by SensoMotoric Instruments (SMI), Germany. The device features a lightweight design (75 g), allowing participants to perform natural head and body movements during paper-and-pencil tasks, ensuring ecological validity (Mele & Federici, 2012). With a sampling rate of 120 Hz and binocular tracking, the device captures eye movement characteristics such as fixation positions, fixation duration, and saccades on paper-based materials. A one-point calibration procedure was employed for convenience, which has been demonstrated to provide sufficient accuracy for similar experimental setups (Duchowski, 2002; Holmqvist et al., 2011). Data collection and preliminary processing were conducted using the SMI BeGaze 3.7.40 software, whose semi-automated Area of Interest (AOI) analysis module facilitates the segmentation and analysis of eye movement patterns across different regions of the test materials. The tracking rate for all participants exceeded 95%, meeting the reliability standards for eye-tracking research (Duchowski, 2002).
4.4. Procedure
4.4.1. Preparation Phase
Prior to the experiment, participants completed an online demographic questionnaire, which collected information such as gender, grade level, and their mathematics scores in the CNCEE. Upon arriving at the laboratory, participants signed the informed consent form and, with the assistance of the experimenter, wore the SMI eye-tracking glasses and carried out a one-point calibration.
4.4.2. Problem-Solving Phase
Participants then sequentially solved six context-based mathematical problems. To simulate real-world problem-solving scenarios, participants solved these problems using a traditional paper-and-pencil format while wearing eye-tracking glasses. They were allowed to solve the problems at their own pace, with no time constraints, and the experimenter ensured that participants were not interrupted during the task to ensure their problem-solving behaviors were as natural and thorough as possible.
After completing the problem-solving tasks, the duration each participant spent on solving each problem was recorded. Additionally, the process and results of each participant’s solutions were scored, with each problem coded as either 0 or 1. A score of 1 was awarded only when both the problem-solving process and the final result were correct; otherwise, a score of 0 was given. To ensure scoring consistency, two students who scored above 140 on the mathematics section of the CNCEE independently evaluated each solution, and the average of their scores was used as the final score. This scoring data were employed to validate the effectiveness of the predefined incremental difficulty levels in the study.
4.5. Data Analysis
All data processing, analyses, and visualizations were conducted using SPSS 25.0 and Python 3.10.
4.5.1. Data Preparation
- (1).
- Division of Areas of Interest (AOIs)
The foundational framework for the process of mathematical problem-solving was outlined in one of the earliest and most influential books on problem-solving, “How to Solve It” by Polya (1982/2007), which comprises four key steps. Guided by this framework, our expert panel (mentioned in Section 4.2) systematically divided each problem, using the SMI BeGaze 3.7.40 software (Bednarik, 2012; L. J. Chen & Zheng, 2014; P. S. Huang, 2017), into three AOIs that map to these cognitive stages: (1) Problem-reading area (Q): corresponding to the comprehension phase, Q encompassed the complete problem text to preserve natural reading patterns (Rayner, 2009). Features like first fixation duration (FirstVID_Q) captured initial information encoding efficiency. (2) Key information area (R): supporting the strategy formulation phase, R contained expert-annotated critical conditions (e.g., numerical constraints, relational terms). Dwell time and revisits to R reflected conceptual mapping and strategy development. (3) Problem-solving area (A): representing the integrated execution–verification phases, a recorded solution-writing process. Eye movements between A and R indicated strategy implementation (Epelboim & Suppes, 2001), while A to Q/Q to A transitions revealed self-monitoring behaviors during verification (Van der Schoot et al., 2009) (Figure 2b).
- (2).
- Extraction of eye movement features
From each AOI, commonly used eye movement features were extracted based on previous research (X. Wang et al., 2022; Zhao et al., 2021), including: Net Dwell Time, Dwell Time, Diversion Duration, Glance Duration, Visual Intake Duration, Visual Intake Count, Percentage of Net Dwell Time, Percentage of Dwell Time, Percentage of Visual Intake Duration, Average Visual Intake Duration, First Visual Intake Duration, Revisit Count, Saccade time entering the AOI, Saccade time leaving the AOI, Glance Count.
- (3).
- Controlling for problem-solving duration
To ensure that the assessment of problem-solving competence based on eye movement features was not confounded by problem-solving duration, Pearson correlation analysis was conducted between each eye movement feature within each AOI and the corresponding problem-solving duration. Since some of the remaining features still exhibited moderate correlations with problem-solving duration (0.4 < r < 0.7), regression analyses were performed to more rigorously control for the influence of problem-solving duration. Specifically, nine eye movement features from each AOI were treated as dependent variables, with the corresponding problem-solving duration as the independent variable. The residuals from these regressions referred to the differences between the actual observed values of eye movement features and the predicted values by the regression model (expressed by the formula, residual e = y − ŷ, where y is the observed value and ŷ is the regression prediction value). It represented the portion of the eye movement feature variation that cannot be explained by the problem-solving duration. In other words, these residuals reflect the pure eye movement features after excluding the influence of the problem-solving duration. Choosing the regression residuals as the independent variable is based on the following considerations: In the actual problem-solving process, although students with different competence have differences in the problem-solving duration, the problem-solving duration as a single overall indicator cannot fully reflect the fine differences in the process. These residual features can better reflect the essential differences in the problem-solving process among students with different competence levels. This study regards this part as independent variables for subsequent analyses to help separate out the effects of the eye movement features that the research truly cares about.
4.5.2. Partial Least Squares Regression Analysis
As the Pearson correlation analyses conducted among the eye movement features used as independent variables revealed high collinearity (see Section 5), the Partial Least Squares Regression (PLSR) analysis was employed to explore the relationship between eye movement features and mathematical problem-solving competence. PLSR is particularly suitable for high-dimensional data with multicollinearity. It overcomes the limitations of traditional multiple regression by extracting a set of new latent components that are mutually uncorrelated. These latent components can maximize the representation of the variation in the independent variables system while maintaining the maximum covariance with the dependent variable. The independent variables are multidimensional eye movement features (with the regression residuals of eye movement features on problem-solving duration as independent variables), and the dependent variable is the CNCEE mathematics score.
Based on Leave-One-participant-Out Cross-Validation (LOOCV), the study determined the optimal number of components by comparing the prediction Mean Squared Error (MSE) corresponding to different component numbers. Specifically, the optimal number of components refers to the one where the PLSR model can achieve the minimum LOOCV MSE. This indicates that the model maintains the best prediction performance while avoiding overfitting. When adding more components, if the MSE no longer significantly decreases, then a smaller number of components is selected to ensure the simplicity of the model. The explanatory power of each component for the dependent variable was calculated, that is, the square of the correlation coefficient between the component and the dependent variable. To further evaluate the model’s predictive validity, the Pearson correlation coefficient (r) and its significance level (p) between PLSR-predicted scores and true CNCEE mathematics scores under the optimal number of components for each problem were calculated. Meanwhile, the prediction R2 corresponding to the optimal number of components for PLSR was used to evaluate the model’s predictive power, calculated according to Formula (1), as shown below (Chicco et al., 2021; Hang et al., 2024; Scheinost et al., 2019).
Formula (1): represents the i-th observation of the target variable, represents the predicted value of the target variable, and represents the mean of observed values of the target variable.
To further explore the predictive roles of eye movement features in the multidimensional model on the CNCEE mathematics scores, based on the PLSR modeling with the optimal number of components, the regression equations of the CNCEE mathematics scores on the eye movement features were further derived using the linear inverse mapping method. The bootstrap method with 3000 repetitions was employed for empirical estimation to compute the statistics (regression coefficients, standard errors, t-values, and p-values). Although the signs of the coefficients for most eye movement features in the PLSR regression results were consistent, some features did not pass the significance level test (see Section 5). However, the lack of statistical significance for certain variables does not necessarily imply that these variables are unimportant to the dependent variable (Yan, 2022).
Therefore, the Variable Importance in the Projection (VIP) values were utilized to assess the importance of eye movement features in the PLSR. This auxiliary analysis technique of the PLSR algorithm can overcome the issue of potentially overlooking explanatory information from variables that do not pass the significance level test, which may still be crucial to the dependent variable. It ensures a comprehensive reflection of the overall profile of the explained variable (Yan, 2022). A higher VIP value for an independent variable indicates a stronger explanatory power for the dependent variable, reflecting the greater importance of that variable. Generally, a VIP value ≥ 1 suggests that the independent variable has a significant impact on the dependent variable.
Formula (2): represents the value of the j-th independent variable; p represents number of independent variables; represents the m-th extracted component; represents the explanatory power (explained variance) of the component for the dependent variable Y, calculated by Formula (3), where is the score of the m-th component and q_m is the Y-load of the m-th component; represents the weight of the j-th independent variable in the component , obtained from the PLSR model for each component; and M represents the number of extracted components (H. Zhang & Chen, 2018).
5. Results
To validate scoring consistency, Pearson correlation analyses were performed between the two independent raters’ evaluations across all six problems. The results indicated high inter-rater consistency, with correlation coefficients ranging from r = 0.785 to r = 1.000 (ps < 0.001), confirming high scoring reliability.
To validate the effectiveness of the incremental difficulty design of problems, participants’ scores and problem-solving durations across the six problems were analyzed. The results revealed that the average problem-solving scores progressively decreased from Problem #1 to #6 (Figure 3a), while the average problem-solving durations exhibited a gradually increasing trend (Figure 3c). These findings indicate that the difficulty of the problems increased gradually, confirming the validity of the designed difficulty gradient.
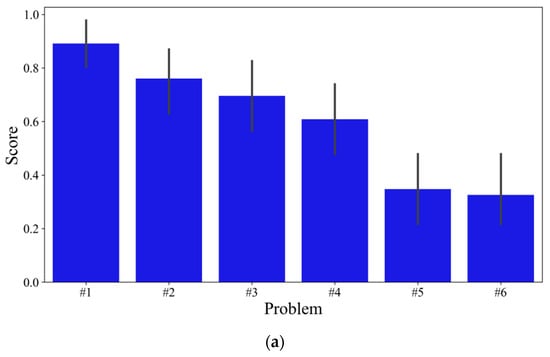
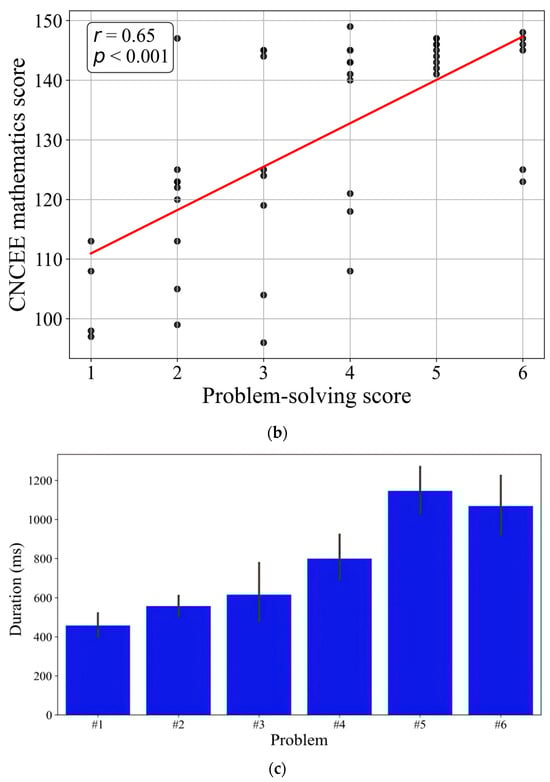
Figure 3.
(a) Average scores of all participants obtained when solving each of the six problems. Problems #1~#6 correspond to the increasing designed difficulty of the six problems. Error bars indicate a standard deviation (SD). (b) A scatter plot of the correlation between the problem-solving score (total score for six problems) and the CNCEE mathematics score. (c) The average duration (ms) of solving each of the six problems. Problems #1~#6 correspond to the increasing design difficulty of the six problems. Error bars indicate a standard deviation (SD).
The scores obtained from solving the six problems are significantly positively correlated with the students’ CNCEE mathematics scores (r = 0.654, p < 0.001) (Figure 3b).
To ensure that the assessment of problem-solving competence based on eye movement features was not confounded by problem-solving duration, Pearson correlation analyses were conducted between each eye movement feature within each AOI and the corresponding problem-solving duration. The Net Dwell Time (NDT), Dwell Time (DT), Diversion Duration (DD), Glance Duration (GD), Visual Intake Duration (VID), and Visual Intake Count (VIC) of eye movement features in each AOI exhibited high correlations with problem-solving duration (|r|s > 0.700, ps < 0.05). For example, in Problem #3 and Problem #4, the Net Dwell Time within the problem-reading area exhibited significant and high correlations with problem-solving duration (r#3 = 0.766, r#4 = 0.841, ps < 0.001. The complete results are provided in Table A1 in Appendix A). Such eye-tracking features were excluded from subsequent analyses. The remaining features were used to construct a multidimensional eye movement feature model (with the regression residuals of eye movement features on problem-solving duration as independent variables), which can be categorized into three types: fixations, revisits, and saccades (Table 1).

Table 1.
The eye movement features used in constructing the multidimensional eye movement feature model.
To examine collinearity among the eye movement features, Pearson correlation analyses were conducted. The six problems exhibited similar results (Figure 4 illustrates Problem #6 as an example, while Problems #1~#5 are presented in Figure A2 in Appendix A), revealing numerous high correlations among the eye movement features within each AOI. This was particularly common among fixation-related features (NDT%, DT%, VID%), revisit- and saccade-related features (Revisit, SaccadeInto, SaccadeOut, GC), and between some fixation-related features and revisit- or saccade-related features. Specifically, fixation-related features between Q and R areas mostly exhibited significant positive correlations (ps < 0.05), while fixation-related features between the A area and these two areas (Q and R) mostly demonstrated significant negative correlations (ps < 0.05). In contrast, certain features associated with revisit and saccades among the three areas predominantly showed significant positive correlations (ps < 0.05). These results indicate the presence of high collinearity among the eye movement features. This kind of multicollinearity can lead to problems such as unstable coefficient estimation and decreased model explanatory power in traditional regression analysis methods (such as ordinary least squares). The Partial Least Squares Regression (PLSR) method, by means of data dimension reduction and latent variable extraction, can effectively solve this problem. Therefore, PLSR was employed to construct the multidimensional eye movement feature model.
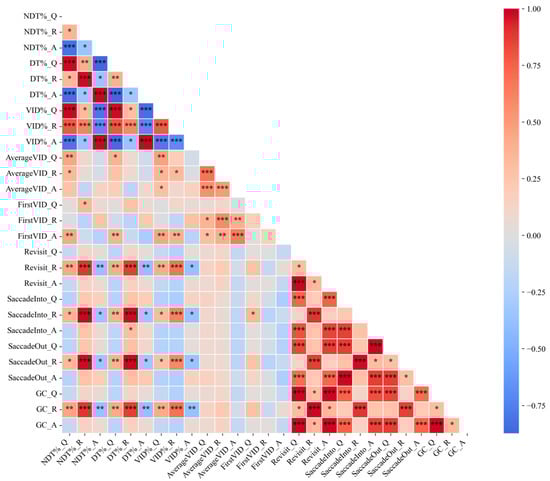
Figure 4.
Correlation coefficients and significance levels among eye movement features (Problem #6). The significance levels are denoted as follows: * p < 0.05, ** p < 0.01, *** p < 0.001.
To investigate the predictive power of multidimensional eye movement features on CNCEE mathematics scores, a PLSR model was constructed. Using the Leave-One-participant-Out Cross-Validation (LOOCV) for evaluating the prediction errors of different component numbers, it was found that for Problems #5 and #6, when the PLSR model contained two components, the minimum MSE was achieved; while for Problems #1 to #4, one component was sufficient to minimize the MSE. Therefore, the study finally determined the model configuration for Problems #5 and #6 to use two components (the explanatory power of each component for the dependent variable: Problem #5: Component 1, 0.174; Component 2, 0.097. Problem #6: Component 1, 0.081; Component 2, 0.025. Table 2), and for Problems #1 to #4 to use one component. LOOCV results indicated that the optimal number of PLSR components was two for Problems #5 and #6 and one for Problems #1~#4. The correlations between the predicted scores of PLSR under the optimal number of components and the true CNCEE mathematics scores were significant for Problems #4~#6 (ps < 0.05) and marginally significant for Problems #1~#3 (ps < 0.1; Table 2). Notably, Problem #6 achieved the highest correlation among all problems (r = 0.520, p < 0.001, Figure 5; Problems #1~#5 shown in Figure A3 in Appendix A). Additionally, Problem #6 demonstrated the highest prediction R2 value (prediction R2 = 0.271), significantly outperforming the other problems. Overall, the multidimensional eye movement features exhibited predictive power for CNCEE mathematics scores, with a stronger ability to predict performance on more difficult problems.
Table 2.
The PLSR analysis of the multidimensional eye movement feature model under various difficulty levels.
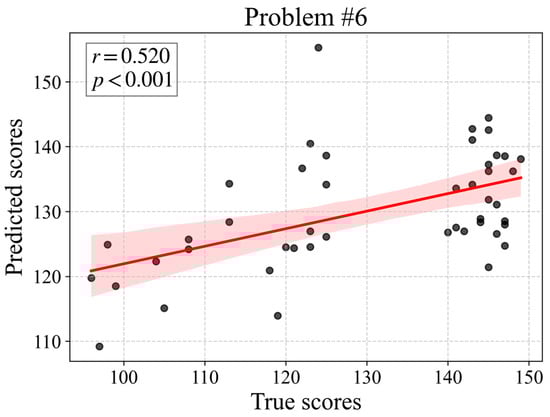
Figure 5.
A scatterplot for the correlation between PLSR-predicted scores and true CNCEE mathematics scores (Problem #6). Each dot represents the score from one participant (N = 46). The predicted score for each dot was obtained using a Lave-One-participant-Out Cross-Validation approach.
To further explore the predictive roles of eye movement features in the multidimensional model in the CNCEE mathematics scores, regression equations of the CNCEE mathematics scores on the eye movement features were derived using the linear inverse mapping method under the optimal number of PLSR components. Taking Problem #6 as an example, the results (Table 3) show that the coefficients of most eye movement features passed the significance test, such as FirstVID, Revisit, and GC in the R area. However, SaccadeInto, GC, and Revisit in the Q area, VID% in the R area, and AverageVID and FirstVID in the A area did not pass the significance level test. To avoid overlooking potentially crucial explanatory information in these features, the importance of each eye-tracking feature was additionally validated using Variable Importance in the Projection (VIP) scores (Yan, 2022).
Table 3.
A multidimensional eye movement feature regression model for CNCEE mathematics scores (Problem #6).
The VIP score results (Table 4) revealed that, basically across all six problems, the FirstVID in each AOI was the most important contributor to the CNCEE mathematics scores. Specifically, the FirstVID in the R area of Problems #4~#6, and the FirstVID in the Q area of Problems #2~#3, were the most significant contributors. The FirstVID_R in Problems #6 positively predicted the CNCEE mathematics scores (Problem #6: estimate = 2.572, t = 11.458, p < 0.001) and in Problems #4~#5 negatively predicted the CNCEE mathematics scores (Problem #4: estimate = −0.728, t = −9.575, p < 0.001; Problem #5: estimate = −2.313, t = −6.988, p < 0.001), while the FirstVID_Q in Problems #2~#3 negatively predicted the scores (Problem #2: estimate = −0.811, t = −7.570, p < 0.001; Problem #2: estimate = −0.627, t = −6.066, p < 0.001) (Table 3 for Problem #6 and Table A2 in Appendix A for other problems). Additionally, in the comprehensive problems of geometry and algebra, Problem #6, the fixation, saccade, and revisit features all made significant contributions. For examples, NDT%_R, SaccadeInto_R, SaccadeOut_A and Revisit_R positively predicted the scores (Estimates > 0, ps < 0.001). In Problems #2 and #5 (geometry), the contribution of the fixation features was relatively important. For example, NDT%_R and VID%_R negatively predicted the scores (estimates < 0, ps < 0.001), while AverageVID_A positively predicted the scores (Estimate > 0, ps < 0.001). In Problems #1, #3, and #4 (algebra), the contribution of the saccade and revisit features was relatively important. For example, SaccadeInto_R, SaccadeOut_A, and Revisit_R positively predicted the scores (estimate > 0, ps < 0.001). Notably, the VIP scores highlighted the importance of eye movement features that were not statistically significant in the regression results (VIPs ≥ 1). For instance, in Problem #6, SaccadeInto_Q, VID%_R, AverageVID_A, and FirstVID_A did not show significant predictive effects on the regression results but demonstrated importance in the PLSR model through VIP scores. This underscores the value of VIP analysis in uncovering explanatory information critical to the dependent variable.
Table 4.
VIP values (≥1) of each eye movement feature for Problems #1~#6.
6. Discussion
This study established a process-oriented assessment framework for high school students’ mathematical problem-solving competence using multidimensional eye movement features. By applying portable eye-tracking technology to context-based mathematical problem-solving tasks in a simulated naturalistic setting, the study achieved high ecological validity while capturing the dynamic processes underlying problem-solving. The results demonstrated the effectiveness of this assessment approach, particularly for higher-difficulty problems. Furthermore, eye movement features such as first visual intake duration, revisit, and saccade to key information were found to play significant predictive roles, providing insights into the cognitive mechanisms underlying problem-solving competence. In the following sections, we discuss the assessment capability of the multidimensional model, its performance across different problem difficulty levels, and the contributions of specific eye movement features to problem-solving competence.
6.1. The Assessment Capability of the Multidimensional Eye Movement Feature Model
The multidimensional eye movement feature model, integrating fixation, saccade, and revisit features (with the regression residuals of eye movement features on problem-solving duration as independent variables), provides a comprehensive view of the problem-solving process. This approach captures the dynamic interplay between different cognitive stages, such as initial encoding, information integration, and solution execution, offering a more holistic assessment of mathematical problem-solving competence than single-feature models (J. Chen et al., 2011; M. Huang et al., 2023).
In constructing the multidimensional model, we observed significant correlations among different eye movement features, particularly between fixation-related features (e.g., NDT%, DT%, VID%) and revisit- or saccade-related features (e.g., Revisit, SaccadeInto, SaccadeOut, GC). This aligns with the integrative cognitive load theory by J. Chen et al. (2011), which posits that mathematical problem-solving requires dynamic coordination of attentional maintenance (fixations) and information search (saccades). For instance, fixation-related features between the problem-reading area (Q) and the key information area (R) mostly exhibited significant positive correlations, reflecting the “coherent integration” mechanism described by Andrá et al. (2015), where successful problem solvers systematically cross-reference key information. Conversely, negative correlations between the problem-solving area (A) and these two areas (Q and R) mirror the attentional shift patterns identified in P. S. Huang’s (2017) AOI transition analysis, suggesting cognitive resource competition during solution execution. These correlations suggest that students’ attention allocation across different cognitive stages (e.g., initial encoding, information integration, and solution execution) is interrelated, supporting the phase-based problem-solving framework by Epelboim and Suppes (2001). By integrating these highly correlated features, the multidimensional model captures the dynamic cognitive strategies employed by students during problem-solving, offering a more accurate assessment than single-feature models.
The PLSR model, which incorporates fixation, saccade, and revisit features, achieved its highest predictive performance for the most difficult problem (Problem #6), with an R2 of 0.271. This result underscores the model’s ability to capture the complex processes involved in solving challenging mathematical problems, which single-feature models may overlook. By combining multiple eye movement features, the PLSR model provides a more comprehensive assessment of problem-solving competence, particularly for complex tasks that require higher-order cognitive skills. Previous research has predominantly focused on single eye movement features, such as fixation duration or saccade patterns, to assess problem-solving competence (Feng et al., 2007; J. Zhang et al., 2006). While these studies provided valuable insights, they were limited by their reliance on decontextualized tasks and isolated features. Our findings regarding first visual intake duration in key information areas extend prior work on attention allocation in mathematical problem-solving, while revealing important methodological distinctions. J. Zhang et al. (2006) established that fixation duration on relational words (e.g., “more than”) predicts success in arithmetic word problems. In contrast, our multidimensional approach reveals that the timing of initial fixation (first visual intake duration) on conceptually critical areas, rather than just cumulative duration, provides more nuanced insights into solution strategies. Similarly, while Feng et al. (2007) identified associations between overall fixation duration and accuracy, our model reveals how dynamic interactions between different eye movement features (e.g., saccades between AOIs coupled with revisits) collectively characterize successful problem-solving approaches. Crucially, these prior studies focused on isolated features in simplified tasks, whereas our findings highlight that the coordination of multiple eye movement components, particularly in context-rich problems, better captures the hierarchical nature of mathematical reasoning (Van Harpen & Sriraman, 2013).
6.2. Performance of the PLSR Model in Higher-Difficulty Problem-Solving Tasks
The PLSR model demonstrated varying predictive validity across problems of different difficulty levels, with its strongest performance observed for the most complex tasks. The model achieved its highest explanatory power for the most difficult problem (Problem #6, R2 = 0.271), suggesting that it is particularly well suited for assessing higher-order cognitive processes, such as strategic planning and contextual interpretation, which are essential for solving real-world mathematical problems (Zhao et al., 2021; X. Wang et al., 2022). The improved performance of the PLSR model with increasing problem difficulty can be attributed to the fact that complex problems elicit more distinctive cognitive processing patterns, which are more readily captured by eye movement features (Hegarty et al., 1992; Zhao et al., 2021). Complex problems often require students to integrate multiple pieces of information, plan solution steps, and interpret contextual cues, all of which are reflected in their eye movement patterns (J. Chen et al., 2011; X. Wang et al., 2022). The multidimensional eye movement feature model, which incorporates fixation, saccade, and revisit features, is particularly effective at capturing these higher-order cognitive processes (X. Wang et al., 2022). This aligns with the observation that complex problems demand more sophisticated cognitive strategies, and the model’s ability to assess these strategies is a key strength (Zhao et al., 2021).
It is important to note that in the context of eye-tracking research, prediction models often yield R2 values ranging from 0.10 to 0.30, depending on the complexity of the task and the number of features included (Yang et al., 2020; Y. Wang et al., 2021). For instance, Yang et al. (2020) reported an R2 of 0.25 for a model predicting problem-solving performance based on fixation and saccade features in a controlled laboratory setting. Similarly, Y. Wang et al. (2021) achieved an R2 of 0.18 using a combination of EEG and eye-tracking data to predict cognitive load during problem-solving. The model’s R2 of 0.271 for the most difficult problem (Problem #6) falls within the upper range of these studies, indicating that the present approach is promising for an application that has practical utility for assessing complex problem-solving tasks. The ability of the model to predict performance in complex problems has significant implications for real-world educational assessment. Modern mathematics education increasingly emphasizes the development of higher-order cognitive skills, such as strategic planning and contextual interpretation, which are essential for solving complex, context-rich problems (Zhao et al., 2021; X. Wang et al., 2022). The strong performance of the model on difficult problems highlights its potential for assessing these skills, preparing students for real-world challenges. Additionally, the use of portable eye-tracking technology in naturalistic settings enhances ecological validity, offering a methodological advancement over traditional laboratory-based studies.
6.3. The Contributions of Various Eye Movement Features to the Assessment of Mathematical Problem-Solving Competence
The VIP and regression analyses collectively revealed a hierarchical pattern of eye movement feature contributions, with first visual intake duration (FirstVID) emerging as the most influential predictor across problem types (Rayner, 2009; H. Wang et al., 2024). Previous research has emphasized the role of early visual attention in problem-solving, particularly in tasks requiring rapid information processing (Epelboim & Suppes, 2001; Van Gog & Jarodzka, 2013). However, these studies often focused on isolated tasks or simplified problem scenarios, limiting their generalizability to real-world contexts. For instance, J. Zhang et al. (2006) found that fixation duration on relational words (e.g., “more than” or “less than”) predicted problem-solving success, but their study was limited to single-feature analyses. In contrast, the present study extends these findings by demonstrating that the first visual intake duration in key information areas (R) is a contributor to problem-solving competence in context-based mathematical problems.
Notably, its predictive power and direction varied substantially by AOI and task complexity. For the most challenging integrated problem (#6), prolonged FirstVID in key information areas (FirstVID_R) showed the strongest positive association with performance, suggesting that high achievers engage in deeper initial encoding of critical conditions when facing complex, multi-concept tasks. This aligns with expert problem-solving models emphasizing strategic information extraction (Van Gog et al., 2009). Conversely, in simpler algebra problems (#4~#5), extended FirstVID in both problem-reading and key information areas negatively predicted scores, potentially indicating less proficient students’ tendency to over-process information regardless of relevance (Strohmaier et al., 2020). This highlights how optimal attention allocation adapts to task demands, deliberately encoding benefits of complex reasoning, but becomes inefficient for routine procedures.
Beyond FirstVID, the importance of other eye movement features systematically varied by problem type, reflecting distinct cognitive demands. For the comprehensive geometry–algebra problem (#6), all three feature categories proved significant: fixation metrics like percentage of Net Dwell Time in key areas (NDT%_R, VIP = 1.037) indicated sustained analysis, while saccadic transitions into these areas (SaccadeInto_R, VIP = 1.045) and revisits (Revisit_R, VIP = 1.049) reflected iterative strategy refinement. Such holistic engagement mirrors the dual visuospatial and symbolic processing required for integrated tasks (Hegarty & Kozhevnikov, 1999). Pure geometry problems (#2, #5) predominantly relied on fixation features (NDT%_R, VIP = 1.550; VID%_R, VIP = 1.593), consistent with the continuous diagram inspection essential for spatial reasoning. In contrast, algebra problems (#1, #3, #4) prioritized saccade and revisit behaviors (SaccadeInto_R, VIP: 1.213~2.075; Revisit_R, VIP: 1.350~1.380), underscoring the need for frequent condition-checking during symbolic manipulation (Rellensmann et al., 2017).
These findings carry important instructional implications. The problem-type-specific patterns suggest geometry instruction should emphasize diagram-based strategy training (e.g., guided visual analysis), whereas algebra teaching might focus on conditional reasoning drills that promote efficient information cross-referencing. The consistent predictive power of FirstVID across tasks further supports targeted interventions for optimizing students’ initial attention allocation based on problem complexity.
Methodologically, our VIP analysis provided critical insights beyond conventional regression results. While features like SaccadeInto_Q (VIP = 1.073) and VID%_R (VIP = 1.593 in Problem #5) showed high importance, some (e.g., SaccadeInto_Q in Problem #6, p = 0.094) lacked statistical significance in regression models. This divergence confirms that multidimensional assessments require complementary analytical approaches. VIP scores capture features’ systemic contributions that p-values might miss, particularly in complex cognitive tasks where predictors interact nonlinearly.
The distinct roles of eye movement features across different areas further validate the effectiveness of AOI partitioning. The differential feature patterns across Q (problem-reading), R (key information), and A (problem-solving) areas align precisely with Polya’s (1982/2007) problem-solving stages. FirstVID in key areas (R) captures early selective attention to critical information (Rayner, 2009), while prolonged FirstVID in noncritical areas (Q) may indicate inefficient filtering (Van Gog et al., 2009). Frequent revisits between R and A areas (R to A transitions) reflect strategic verification behaviors, as high performers systematically cross-reference problem conditions and solutions (P. S. Huang, 2017; Schindler & Lilienthal, 2019). The timing of saccadic movements (SaccadeInto/Out_R) reveals automated information retrieval skills, particularly the ability to quickly locate graphical conditions in geometry problems, which correlates with mathematical fluency (Zhao et al., 2021).
6.4. Theoretical Insights and Practical Applications
This study establishes a critical link between eye movement patterns and mathematical problem-solving processes, providing two key implications for theory and practice. For theoretical advancement, the identified relationships between specific oculomotor behaviors (e.g., first visual intake duration) and cognitive strategies offer a new mechanistic framework for understanding real-world problem-solving. For practical implementation, the portable eye-tracking methodology could potentially enable authentic assessment of complex reasoning processes that traditional testing cannot capture.
For educators, these findings offer actionable insights: (1) For the attention guidance, the strong predictive role of first visual intake duration (FirstVID) suggests teachers can train students to strategically allocate initial attention to key information areas (e.g., highlighting critical problem conditions) while avoiding over-focusing on redundant text. (2) For the differentiated instruction, the variation in feature importance across problem types (e.g., fixation dominance in geometry vs. saccade patterns in algebra) supports tailoring instructional methods, such as diagram-intensive guidance for geometry versus iterative condition-checking drills for algebra.
Nevertheless, it should be noted that while eye-tracking offers insights into typical problem-solving processes, its utility as an assessment tool may be limited for neurodivergent learners. For instance, students with dyslexia or autism spectrum traits could show substantially different eye movement patterns despite strong mathematical reasoning (Cilia et al., 2021). The proposed method is inaccessible to blind students as well, who might utilize a distinct way to solve mathematical problems (Xu et al., 2021). Hereby, there is a need for multimodal assessment frameworks (e.g., recordings of brain activities) for a comprehensive evaluation across diverse learners (Pinheiro et al., 2024).
Looking forward, while the current CNCEE-based validation presents inherent limitations, this work opens the following research directions: (1) developing Eye Movement Modeling Examples (EMME) to train optimal problem-solving strategies through gaze pattern emulation (Wright et al., 2022; Soares et al., 2024); (2) creating adaptive interventions based on individual attention profiles; (3) validating with authentic high school populations to investigate the generalizability of the present university-student-based findings (Samo & Kartasasmita, 2018); (4) examining affective and cognitive correlates, including how mathematical problem-solving competence interacts with emotional states (e.g., anxiety, motivation) (Passolunghi et al., 2019) and cognitive functions (e.g., working memory, executive control) (Li et al., 2023; Trezise & Reeve, 2014), to inform the development of holistic learning support frameworks; (5) exploring how the variations in problem presentation, such as visual layout, wording complexity, etc., might interact with eye movement patterns to provide practical insights for optimizing the assessment design (Hoogland et al., 2018; Vessonen et al., 2024); (6) further diversifying problem-solving paradigms from other educational systems for cross-cultural generalizability beyond the Chinese education system (Borchers et al., 2023).
7. Conclusions
This study developed a multidimensional eye movement feature model to evaluate high school students’ problem-solving competence in real-world mathematical scenarios from a process perspective. The model demonstrated strong predictive power, effectively capturing dynamic processes during problem-solving, particularly for complex tasks, with the highest performance on the most difficult problem. The first visual intake duration emerged as the most influential predictor. Other features, such as fixations on key information, revisits from problem-solving to key information areas (A to R transitions), and saccades to key information, also played important roles in predicting problem-solving proficiency, particularly in geometry and algebra tasks, respectively. Notably, the model’s predictive validity increased with problem complexity, highlighting its ability to capture distinctive cognitive patterns in challenging tasks. These findings advance the understanding of the processes in mathematical problem-solving and provide a practical framework for process-oriented educational assessment. The use of portable eye-tracking technology enhances ecological validity, supporting the development of targeted interventions and personalized learning tools.
Author Contributions
Conceptualization, S.H. and H.P.; methodology, S.H.; formal analysis, H.P.; investigation, S.H.; resources, D.Z.; data curation, H.P.; writing—original draft preparation, S.H. and H.P.; writing—review and editing, D.Z., S.H. and H.P.; visualization, H.P.; supervision, D.Z.; project administration, D.Z. and S.H.; funding acquisition, D.Z. All authors have read and agreed to the published version of the manuscript.
Funding
This work was supported by the National Natural Science Foundation of China (T2341003, 61977041, 62061136001), the Graduate Education Innovation Grants, Tsinghua University (202504Z005), and the Education Innovation Grants of Tsinghua University (DX02_20).
Institutional Review Board Statement
The study was approved by the Ethics Committee of Tsinghua University (Protocol No. THU202312, date of approval: July 2023).
Informed Consent Statement
Informed consent was obtained from all subjects involved in the study.
Data Availability Statement
The raw data supporting the conclusions of this article will be made available by the authors on request.
Acknowledgments
We would like to thank Liang Yiming, Qiu Shi, Wang Sirui, Zhang Xuelei, and Wang Shixuan for their help in collecting data.
Conflicts of Interest
The authors declare no conflicts of interest.
Abbreviations
The following abbreviations are used in this manuscript:
| CNCEE | China’s College Entrance Examination |
| VIP | Variable Importance in the Projection |
| PLSR | Partial Least Squares Regression |
| LOOCV | Leave-One-participant-Out Cross-Validation |
| AOIs | Areas of Interest |
| Q | Problem-Reading Area |
| R | Key Information Area |
| A | Problem-Solving Area |
Appendix A
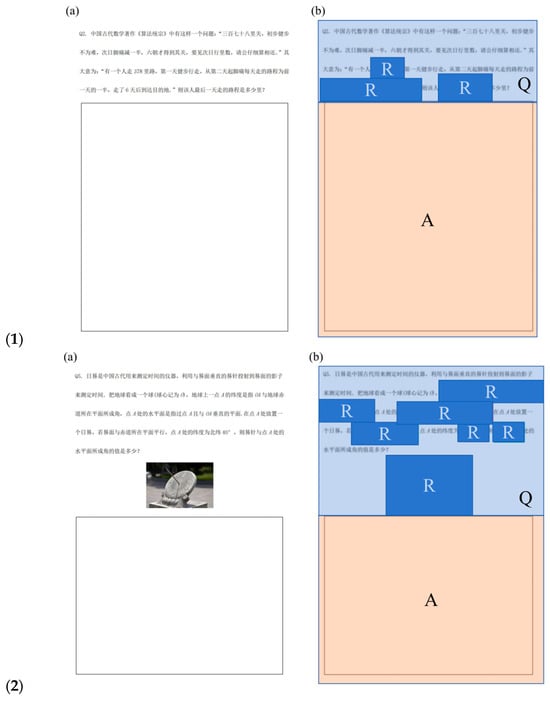
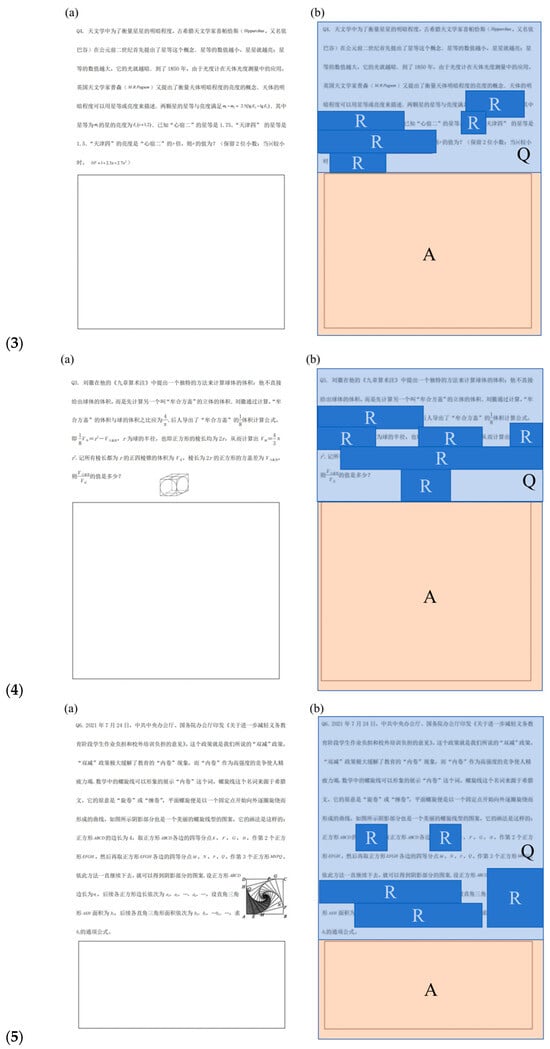
Figure A1.
Problems #1, #2, #4, #5, #6 (a) and their Areas of Interest (AOIs) (b). (1) Problem #1 (Q2), distance-related problem, algebra problem. Textual translation of the problem: In the ancient Chinese mathematical work Algorithm Compendium, there is such a problem: There are 378 miles to the destination. On the first day, one walks briskly without difficulty. From the second day on, due to foot pain, the distance walked each day is half of the previous day. After six days, one reaches the destination. Please calculate and tell me the distance walked on the last day. The gist of this problem is: There is a person who walks 378 miles. On the first day, he walks briskly without difficulty. From the second day on, due to foot pain, the distance walked each day is half of the previous day. After six days, he reaches the destination. Then, how many miles did he walk on the last day? (2) Problem #2 (Q5), combined volume calculation, geometry problem. Textual translation of the problem: The sundial is an ancient Chinese instrument used for measuring time. It determines the time by the shadow cast by the gnomon perpendicular to the sundial surface. Imagine the Earth as a sphere (with the center marked as 0), and the latitude of a point A on the Earth is defined as the angle between OA and the plane of the Earth’s equator. The horizontal plane at point A is the plane passing through point A and perpendicular to OA. If a sundial is placed at point A and the sundial surface is parallel to the plane of the equator, and the latitude of point A is 40° north, what is the value of the angle formed by the gnomon and the horizontal plane at point A? (3) Problem #4 (Q4), magnitude and brightness, algebra problem. Textual translation of the problem: In astronomy, to measure the brightness of stars, the ancient Greek astronomer Mipparchus (also known as Hipparchus) first proposed the concept of magnitude in the 2nd century BC. The smaller the magnitude value of a star, the brighter it is; the larger the magnitude value, the dimmer its light is. By 1850, due to the application of photometers in the measurement of celestial luminosity, British astronomer M. R. Pogsow proposed the concept of luminance to measure the brightness of celestial bodies. The brightness of celestial bodies can be described by magnitude or luminance. The magnitude and luminance of two stars satisfy m1 − m2 = 25(1gE1 − lgE2). Here, the magnitude of star m has a luminance of Ei(i = 1, 2). It is known that the magnitude of Altair is 1.75. The magnitude of Tianjin IV is 1.5. The luminance of Tianjin IV is r times that of Altair. Then, what is the value of r? (Keep two decimal places; when |x| is relatively small, 10x = 1 + 2.3x + 2.7x2). (4) Problem #5 (Q3), sundial angle, geometry problem. Textual translation of the problem: Liu Hui proposed a unique method in his Commentary on the Nine Chapters on the Mathematical Art to calculate the volume of a sphere. Instead of directly giving the volume of the sphere, he first calculated the volume of another solid. Through his calculation, the ratio of the volume of the solid to that of the sphere should be 4/π. Later generations derived the calculation formula for 1/8 of the volume of the solid, that is, 1/8V(solid) = r3 − V(different), where r is the radius of the sphere, that is, the side length of the square is 2r. Thus, the volume of the sphere V(sphere) = 4/3π·r3. Let V(regular tetrahedron) be the volume of a regular tetrahedron with all edges of length r, and V(different) be the difference of the square, where the edge length is 2r. Then what is the value of V(different)/V(regular tetrahedron)? (5) Problem #6 (Q6), spiral pattern, comprehensive problem of algebra and geometry. Textual translation of the problem: On 24 July 2021, the General Office of the Central Committee of the Communist Party of China and the General Office of the State Council issued the Opinions on Further Reducing the Homework Burden and Extracurricular Training Burden of Students in the Compulsory Education Stage. The policy has greatly alleviated the internal competition phenomenon in education, and internal competition is a high-intensity competition that exhausts people. The helix curve in mathematics can vividly illustrate the concept of internal competition. The term helix originates from Greek, and its original meaning is twist or coil. A planar helix is a curve formed by starting from a fixed point and spiraling outward in each turn. As shown in the figure, the shaded part is also a beautiful spiral pattern. Its drawing method is as follows: The side length of square ABCD is 4. Take the four equal division points E, F, G, H of the sides of square ABCD to draw the second square EFGH. Then, take the four equal division points M, N, P, Q of the sides of square EFGH to draw the third square MNPQ. Continue this method, and you can obtain the pattern of the shaded part. Let the side length of square ABCD be a1, and the side length of subsequent squares be a2, a3, …, an, …, where the area of right triangle AEH is b1, and the areas of subsequent right triangles are b1, b2, … bn, … Find the general term formula for bn.
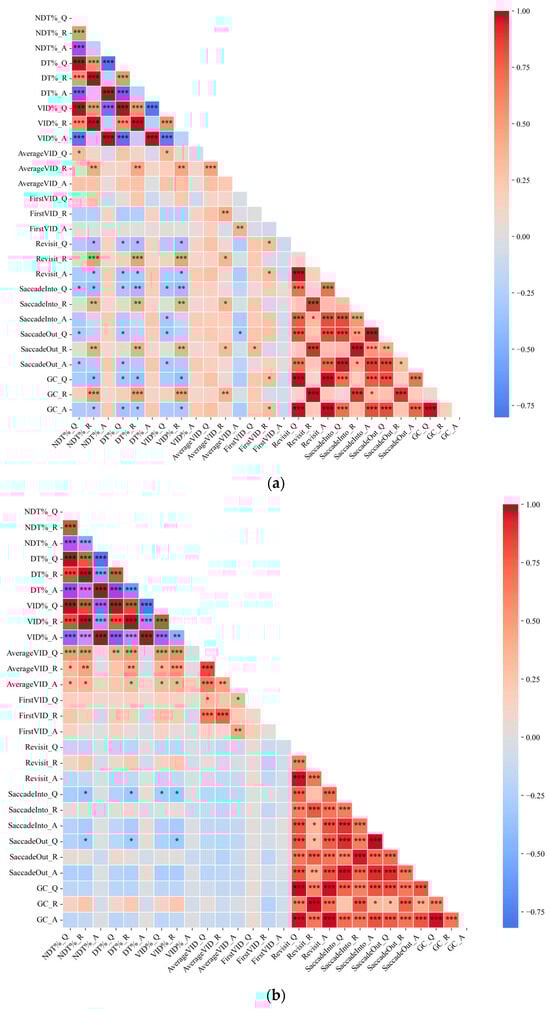
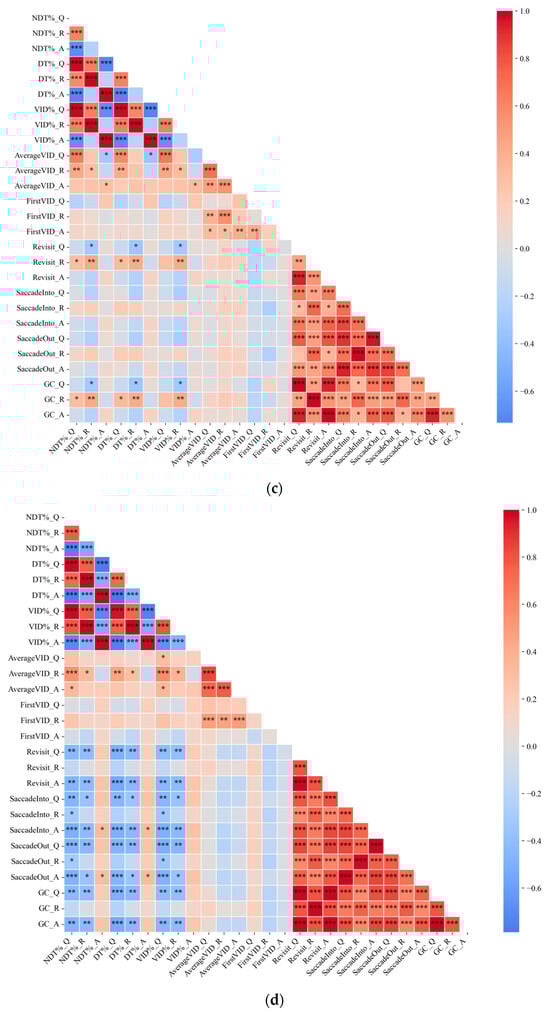
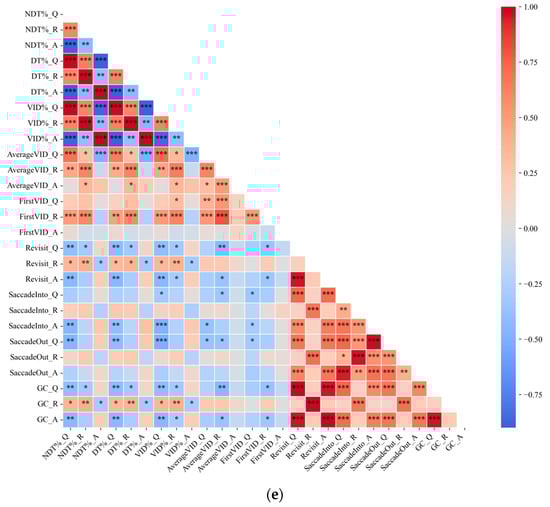
Figure A2.
Correlation coefficients and significance levels of eye movement features for Problems #1~#5. (1) (a) for Problem #1, (b) for Problem #2, (c) for Problem #3, (d) for Problem #4, (e) for Problem #5. (2) The significance levels are denoted as follows: * p < 0.05, ** p < 0.01, *** p < 0.001.
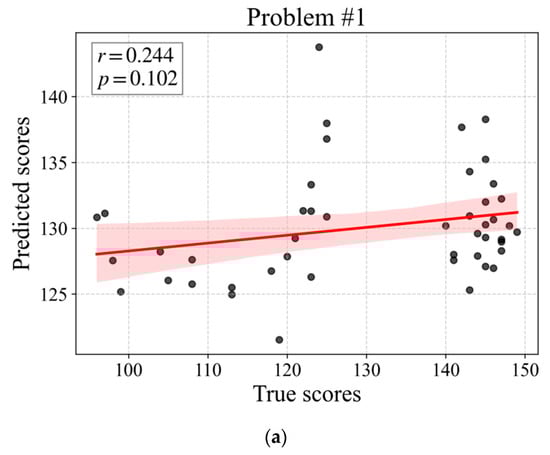
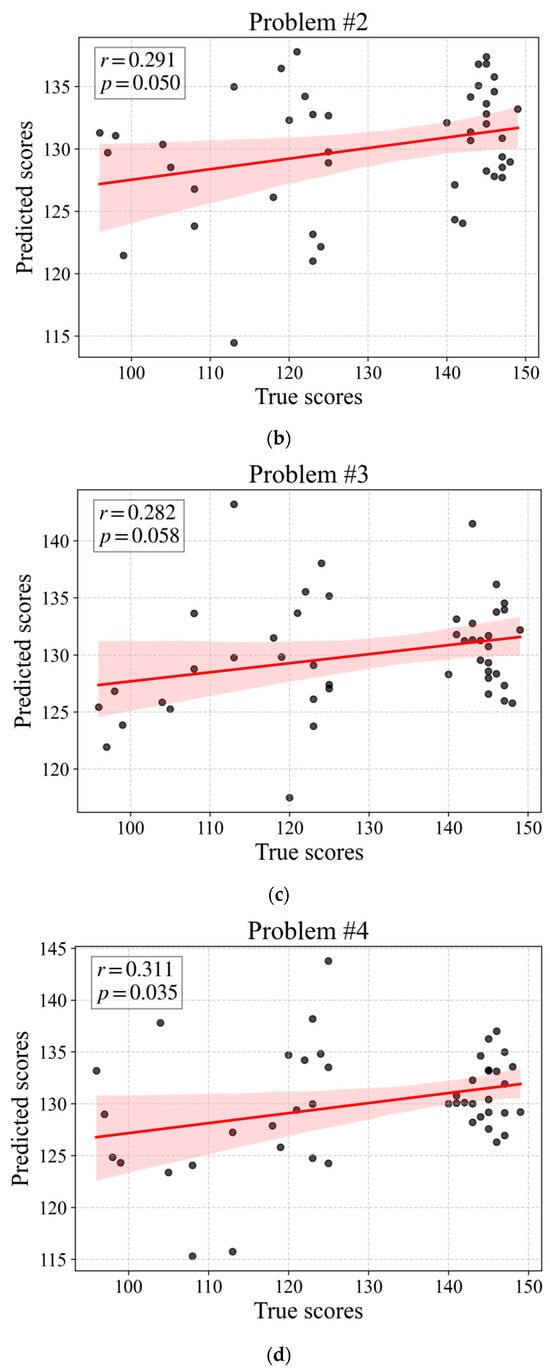
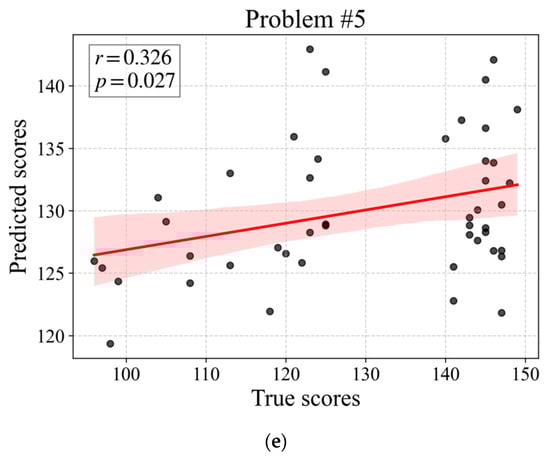
Figure A3.
The correlation between PLSR-predicted scores and true CNCEE mathematics scores for Problems #1~#5. (a) for Problem #1, (b) for Problem #2, (c) for Problem #3, (d) for Problem #4, (e) for Problem #5.
Table A1.
Correlations between eye movement features and problem-solving duration (Problem #1~#6).
Table A1.
Correlations between eye movement features and problem-solving duration (Problem #1~#6).
| Eye Movement Features | Problem #1 | Problem #2 | Problem #3 | Problem #4 | Problem #5 | Problem #6 |
|---|---|---|---|---|---|---|
| NDT_Q | 0.404 ** | 0.551 ** | 0.766 ** | 0.841 ** | 0.615 ** | 0.774 ** |
| NDT_R | 0.331 * | 0.515 ** | 0.469 ** | 0.777 ** | 0.587 ** | 0.530 ** |
| NDT_A | 0.868 ** | 0.525 ** | 0.857 ** | 0.919 ** | 0.689 ** | 0.722 ** |
| DT_Q | 0.423 ** | 0.567 ** | 0.781 ** | 0.852 ** | 0.637 ** | 0.768 ** |
| DT_R | 0.329 * | 0.519 ** | 0.476 ** | 0.767 ** | 0.587 ** | 0.526 ** |
| DT_A | 0.877 ** | 0.536 ** | 0.861 ** | 0.914 ** | 0.695 ** | 0.721 ** |
| DD_Q | 0.447 ** | 0.575 ** | 0.784 ** | 0.864 ** | 0.643 ** | 0.774 ** |
| DD_R | 0.402 ** | 0.549 ** | 0.509 ** | 0.786 ** | 0.602 ** | 0.533 ** |
| DD_A | 0.880 ** | 0.535 ** | 0.862 ** | 0.915 ** | 0.697 ** | 0.725 ** |
| GD_Q | 0.435 ** | 0.569 ** | 0.783 ** | 0.858 ** | 0.638 ** | 0.770 ** |
| GD_R | 0.370 * | 0.536 ** | 0.495 ** | 0.780 ** | 0.599 ** | 0.530 ** |
| GD_A | 0.879 ** | 0.536 ** | 0.862 ** | 0.914 ** | 0.697 ** | 0.724 ** |
| VID_Q | 0.400 ** | 0.545 ** | 0.766 ** | 0.822 ** | 0.607 ** | 0.774 ** |
| VID_R | 0.326 * | 0.503 ** | 0.471 ** | 0.766 ** | 0.575 ** | 0.530 ** |
| VID_A | 0.865 ** | 0.523 ** | 0.854 ** | 0.919 ** | 0.688 ** | 0.715 ** |
| VIC_Q | 0.555 ** | 0.698 ** | 0.808 ** | 0.874 ** | 0.744 ** | 0.812 ** |
| VIC_R | 0.532 ** | 0.645 ** | 0.550 ** | 0.813 ** | 0.634 ** | 0.574 ** |
| VIC_A | 0.935 ** | 0.609 ** | 0.881 ** | 0.938 ** | 0.745 ** | 0.795 ** |
| NDT%_Q | −0.475 ** | −0.059 | −0.233 | −0.438 ** | −0.031 | −0.030 |
| NDT%_R | −0.418 ** | −0.152 | −0.202 | −0.343 * | −0.059 | 0.545 ** |
| NDT%_A | 0.373 * | −0.003 | 0.356 * | 0.426 ** | 0.167 | 0.086 |
| DT%_Q | −0.491 ** | −0.082 | −0.237 | −0.507 ** | −0.045 | −0.082 |
| DT%_R | −0.425 ** | −0.147 | −0.200 | −0.352 * | −0.052 | 0.525 ** |
| DT%_A | 0.412 ** | 0.014 | 0.372 * | 0.403 ** | 0.165 | 0.082 |
| VID%_Q | −0.466 ** | −0.052 | −0.230 | −0.413 ** | −0.033 | −0.035 |
| VID%_R | −0.406 ** | −0.145 | −0.207 | −0.330 * | −0.064 | 0.061 |
| VID%_A | 0.362 * | −0.007 | 0.351 * | 0.422 ** | 0.163 | 0.084 |
| AverageVID_Q | −0.204 | 0.074 | 0.164 | 0.152 | 0.073 | 0.221 |
| AverageVID_R | −0.225 | −0.109 | 0.162 | −0.012 | 0.072 | 0.154 |
| AverageVID_A | −0.302 * | −0.213 | −0.229 | 0.006 | −0.028 | −0.157 |
| FirstVID_Q | −0.155 | −0.065 | 0.145 | 0.280 | −0.079 | 0.235 |
| FirstVID_R | −0.160 | −0.092 | 0.129 | −0.192 | −0.063 | −0.016 |
| FirstVID_A | −0.181 | 0.029 | −0.073 | −0.024 | −0.033 | −0.240 |
| Revisit_Q | 0.594 ** | 0.298 * | 0.532 ** | 0.800 ** | 0.631 ** | 0.625 ** |
| Revisit_R | 0.583 ** | 0.623 ** | 0.570 ** | 0.854 ** | 0.638 ** | 0.670 ** |
| Revisit_A | 0.580 ** | 0.348 * | 0.544 ** | 0.807 ** | 0.615 ** | 0.639 ** |
| SaccadeInto_Q | 0.470 ** | 0.068 | 0.348 * | 0.610 ** | 0.315 * | 0.467 ** |
| SaccadeInto_R | 0.480 ** | 0.426 ** | 0.549 ** | 0.607 ** | 0.444 ** | 0.548 ** |
| SaccadeInto_A | 0.433 ** | 0.246 | 0.436 ** | 0.613 ** | 0.410 ** | 0.484 ** |
| SaccadeOut_Q | 0.438 ** | 0.245 | 0.435 ** | 0.612 ** | 0.477 ** | 0.491 ** |
| SaccadeOut_R | 0.470 ** | 0.458 ** | 0.549 ** | 0.634 ** | 0.448 ** | 0.528 ** |
| SaccadeOut_A | 0.494 ** | 0.073 | 0.362 * | 0.563 ** | 0.240 | 0.473 ** |
| GC_Q | 0.594 ** | 0.298 * | 0.532 ** | 0.800 ** | 0.631 ** | 0.625 ** |
| GC_R | 0.585 ** | 0.619 ** | 0.570 ** | 0.854 ** | 0.638 ** | 0.672 ** |
| GC_A | 0.580 ** | 0.348 * | 0.544 ** | 0.807 ** | 0.615 ** | 0.639 ** |
Notes: (1) NDT: Net Dwell Time, DT: Dwell Time, DD: Diversion Duration, GD: Glance Duration, VID: Visual Intake Duration, VIC: Visual Intake Count. (2) The full terms corresponding to the remaining abbreviations of the eye movement features are provided in Table 1. (2) ** represents p-value < 0.01 and * represents p-value < 0.05.
Table A2.
PLSR model output for Problems #1~#5. (a) for Problem #1, (b) for Problem #2, (c) for Problem #3, (d) for Problem #4, and (e) for Problem #5.
Table A2.
PLSR model output for Problems #1~#5. (a) for Problem #1, (b) for Problem #2, (c) for Problem #3, (d) for Problem #4, and (e) for Problem #5.
| (a) Problem #1. | ||||
|---|---|---|---|---|
| Variable | Equation: CNCEE Mathematics Score~NDT%_Q + NDT%_R + … + GC_A | |||
| Eye Movement Features | Estimate | td. Error | t-Value | p-Value |
| NDT%_Q | −0.139 | 0.388 | −2.430 | 0.019 * |
| NDT%_R | 0.013 | 0.444 | 0.200 | 0.843 |
| NDT%_A | 0.076 | 0.453 | 1.134 | 0.263 |
| DT%_Q | −0.094 | 0.391 | −1.638 | 0.109 |
| DT%_R | 0.017 | 0.448 | 0.260 | 0.796 |
| DT%_A | 0.101 | 0.456 | 1.497 | 0.142 |
| VID%_Q | −0.140 | 0.393 | −2.407 | 0.020 * |
| VID%_R | 0.002 | 0.447 | 0.024 | 0.981 |
| VID%_A | 0.062 | 0.452 | 0.925 | 0.360 |
| AverageVID_Q | −0.090 | 0.468 | −1.297 | 0.202 |
| AverageVID_R | −0.121 | 0.514 | −1.594 | 0.118 |
| AverageVID_A | 0.026 | 0.444 | 0.390 | 0.698 |
| FirstVID_Q | 0.165 | 0.392 | 2.859 | 0.006 ** |
| FirstVID_R | 0.030 | 0.388 | 0.520 | 0.605 |
| FirstVID_A | 0.247 | 0.436 | 3.845 | <0.001 *** |
| Revisit_Q | 0.452 | 0.365 | 8.402 | <0.001 *** |
| Revisit_R | 0.075 | 0.402 | 1.264 | 0.213 |
| Revisit_A | 0.539 | 0.337 | 10.835 | <0.001 *** |
| SaccadeInto_Q | 0.576 | 0.346 | 11.289 | <0.001 *** |
| SaccadeInto_R | 0.436 | 0.396 | 7.471 | <0.001 *** |
| SaccadeInto_A | 0.728 | 0.337 | 14.653 | <0.001 *** |
| SaccadeOut_Q | 0.719 | 0.330 | 14.753 | <0.001 *** |
| SaccadeOut_R | 0.482 | 0.337 | 9.695 | <0.001 *** |
| SaccadeOut_A | 0.583 | 0.320 | 12.361 | <0.001 *** |
| GC_Q | 0.452 | 0.365 | 8.402 | <0.001 *** |
| GC_R | 0.072 | 0.403 | 1.211 | 0.232 |
| GC_A | 0.539 | 0.337 | 10.835 | <0.001 *** |
| (b) Problem #2. | ||||
| NDT%_Q | −0.566 | 0.375 | −10.215 | <0.001 *** |
| NDT%_R | −0.386 | 0.408 | −6.404 | <0.001 *** |
| NDT%_A | 0.516 | 0.454 | 7.707 | <0.001 *** |
| DT%_Q | −0.516 | 0.385 | −9.087 | <0.001 *** |
| DT%_R | −0.364 | 0.419 | −5.896 | <0.001 *** |
| DT%_A | 0.517 | 0.452 | 7.768 | <0.001 *** |
| VID%_Q | −0.577 | 0.376 | −10.408 | <0.001 *** |
| VID%_R | −0.420 | 0.403 | −7.074 | <0.001 *** |
| VID%_A | 0.701 | 0.644 | 7.379 | <0.001 *** |
| AverageVID_Q | −0.243 | 0.523 | −3.153 | 0.003 ** |
| AverageVID_R | −0.061 | 0.571 | −0.718 | 0.476 |
| AverageVID_A | 0.701 | 0.644 | 7.379 | <0.001 *** |
| FirstVID_Q | −0.811 | 0.727 | −7.570 | <0.001 *** |
| FirstVID_R | −0.585 | 0.597 | −6.647 | <0.001 *** |
| FirstVID_A | 0.278 | 0.680 | 2.777 | 0.008 ** |
| Revisit_Q | −0.503 | 0.709 | −4.812 | <0.001 *** |
| Revisit_R | 0.050 | 0.638 | 0.530 | 0.599 |
| Revisit_A | −0.386 | 0.654 | −3.998 | <0.001 *** |
| SaccadeInto_Q | −0.081 | 0.535 | −1.030 | 0.309 |
| SaccadeInto_R | 0.523 | 0.662 | 5.363 | <0.001 *** |
| SaccadeInto_A | 0.117 | 0.536 | 1.478 | 0.147 |
| SaccadeOut_Q | 0.025 | 0.531 | 0.322 | 0.749 |
| SaccadeOut_R | 0.491 | 0.672 | 4.962 | <0.001 *** |
| SaccadeOut_A | −0.018 | 0.522 | −0.229 | 0.820 |
| GC_Q | −0.503 | 0.709 | −4.812 | <0.001 *** |
| GC_R | 0.067 | 0.643 | 0.707 | 0.483 |
| GC_A | −0.386 | 0.654 | −3.998 | <0.001 *** |
| (c) Problem #3. | ||||
| NDT%_Q | 0.128 | 0.582 | 1.488 | 0.144 |
| NDT%_R | 0.268 | 0.460 | 3.943 | <0.001 *** |
| NDT%_A | −0.126 | 0.605 | −1.410 | 0.166 |
| DT%_Q | 0.169 | 0.553 | 2.077 | 0.044 * |
| DT%_R | 0.235 | 0.464 | 3.441 | 0.001 ** |
| DT%_A | −0.117 | 0.601 | −1.321 | 0.193 |
| VID%_Q | 0.090 | 0.593 | 1.029 | 0.309 |
| VID%_R | 0.244 | 0.465 | 3.564 | 0.001 ** |
| VID%_A | −0.156 | 0.609 | −1.737 | 0.089 |
| AverageVID_Q | −0.478 | 0.738 | −4.387 | <0.001 *** |
| AverageVID_R | −0.055 | 0.650 | −0.577 | 0.567 |
| AverageVID_A | −0.402 | 0.663 | −4.109 | <0.001 *** |
| FirstVID_Q | −1.050 | 0.982 | −7.254 | <0.001 *** |
| FirstVID_R | −0.627 | 0.701 | −6.066 | <0.001 *** |
| FirstVID_A | 0.133 | 0.750 | 1.204 | 0.235 |
| Revisit_Q | −0.186 | 0.624 | −2.024 | 0.049 * |
| Revisit_R | 0.370 | 0.520 | 4.823 | <0.001 *** |
| Revisit_A | 0.077 | 0.612 | 0.850 | 0.400 |
| SaccadeInto_Q | 0.231 | 0.522 | 2.996 | 0.004 ** |
| SaccadeInto_R | 0.794 | 0.610 | 8.838 | <0.001 *** |
| SaccadeInto_A | 0.369 | 0.511 | 4.895 | <0.001 *** |
| SaccadeOut_Q | 0.122 | 0.529 | 1.563 | 0.125 |
| SaccadeOut_R | 0.309 | 0.617 | 3.398 | 0.001 ** |
| SaccadeOut_A | 0.671 | 0.594 | 7.651 | <0.001 *** |
| GC_Q | −0.186 | 0.624 | −2.024 | 0.049 * |
| GC_R | 0.366 | 0.518 | 4.783 | <0.001 *** |
| GC_A | 0.077 | 0.612 | 0.850 | 0.400 |
| (d) Problem #4. | ||||
| NDT%_Q | −0.047 | 0.426 | −0.745 | 0.460 |
| NDT%_R | −0.176 | 0.431 | −2.771 | 0.008 ** |
| NDT%_A | −0.445 | 0.422 | −7.155 | <0.001 *** |
| DT%_Q | −0.029 | 0.419 | −0.465 | 0.644 |
| DT%_R | −0.181 | 0.437 | −2.801 | 0.008 ** |
| DT%_A | −0.423 | 0.443 | −6.480 | <0.001 *** |
| VID%_Q | −0.066 | 0.427 | −1.055 | 0.297 |
| VID%_R | −0.190 | 0.422 | −3.051 | 0.004 ** |
| VID%_A | −0.473 | 0.419 | −7.658 | <0.001 *** |
| AverageVID_Q | −0.274 | 0.469 | −3.962 | <0.001 *** |
| AverageVID_R | −0.306 | 0.471 | −4.406 | <0.001 *** |
| AverageVID_A | −0.208 | 0.389 | −3.627 | 0.001 ** |
| FirstVID_Q | −0.351 | 0.522 | −4.559 | <0.001 *** |
| FirstVID_R | −0.728 | 0.516 | −9.575 | <0.001 *** |
| FirstVID_A | 0.802 | 0.497 | 10.950 | <0.001 *** |
| Revisit_Q | 0.502 | 0.398 | 8.557 | <0.001 *** |
| Revisit_R | 0.650 | 0.413 | 10.682 | <0.001 *** |
| Revisit_A | 0.566 | 0.363 | 10.564 | <0.001 *** |
| SaccadeInto_Q | 0.393 | 0.502 | 5.306 | <0.001 *** |
| SaccadeInto_R | 0.496 | 0.474 | 7.091 | <0.001 *** |
| SaccadeInto_A | 0.278 | 0.447 | 4.218 | <0.001 *** |
| SaccadeOut_Q | 0.262 | 0.451 | 3.952 | <0.001 *** |
| SaccadeOut_R | 0.440 | 0.496 | 6.019 | <0.001 *** |
| SaccadeOut_A | 0.406 | 0.491 | 5.608 | <0.001 *** |
| GC_Q | 0.502 | 0.398 | 8.557 | <0.001 *** |
| GC_R | 0.650 | 0.413 | 10.682 | <0.001 *** |
| GC_A | 0.566 | 0.363 | 10.564 | <0.001 *** |
| (e) Problem #5. | ||||
| NDT%_Q | 0.433 | 0.634 | 4.638 | <0.001 *** |
| NDT%_R | −1.266 | 0.968 | −8.869 | <0.001 *** |
| NDT%_A | −0.813 | 0.776 | −7.098 | <0.001 *** |
| DT%_Q | 0.653 | 0.637 | 6.950 | <0.001 *** |
| DT%_R | −1.293 | 1.045 | −8.392 | <0.001 *** |
| DT%_A | −0.758 | 0.767 | −6.700 | <0.001 *** |
| VID%_Q | 0.281 | 0.631 | 3.019 | 0.004 ** |
| VID%_R | −1.324 | 0.961 | −9.346 | <0.001 *** |
| VID%_A | −0.882 | 0.783 | −7.638 | <0.001 *** |
| AverageVID_Q | −0.031 | 1.278 | −0.163 | 0.871 |
| AverageVID_R | −0.238 | 1.432 | −1.128 | 0.266 |
| AverageVID_A | 1.046 | 1.435 | 4.941 | <0.001 *** |
| FirstVID_Q | 1.301 | 1.631 | 5.411 | <0.001 *** |
| FirstVID_R | −2.313 | 2.245 | −6.988 | <0.001 *** |
| FirstVID_A | −0.472 | 1.464 | −2.187 | 0.034 * |
| Revisit_Q | 0.058 | 0.811 | 0.485 | 0.630 |
| Revisit_R | −0.458 | 1.056 | −2.940 | 0.005 ** |
| Revisit_A | −0.459 | 0.863 | −3.610 | 0.001 ** |
| SaccadeInto_Q | 0.180 | 0.746 | 1.636 | 0.109 |
| SaccadeInto_R | 0.768 | 0.982 | 5.304 | <0.001 *** |
| SaccadeInto_A | −0.419 | 0.836 | −3.396 | 0.001 ** |
| SaccadeOut_Q | −0.102 | 0.721 | −0.961 | 0.342 |
| SaccadeOut_R | 0.448 | 1.014 | 2.996 | 0.005 ** |
| SaccadeOut_A | −0.648 | 0.819 | −5.368 | <0.001 *** |
| GC_Q | 0.058 | 0.811 | 0.485 | 0.630 |
| GC_R | −0.446 | 1.057 | −2.863 | 0.006 ** |
| GC_A | −0.459 | 0.863 | −3.610 | 0.001 ** |
Notes: (1) (a) for Problem #1, (b) for Problem #2, (c) for Problem #3, (d) for Problem #4, (e) for Problem #5. (2) The bootstrap method with 3000 repetitions was employed for empirical estimation to compute the statistics (Yan, 2022). (3) The bold font indicates eye movement features with VIP values ≥ 1 (Table 4). (4) The full terms corresponding to the abbreviations of the eye movement features are provided in Table 1. (5) *** represents p-value < 0.001, ** represents p-value < 0.01 and * represents p-value < 0.05.
References
- ACT, Inc. (2006). Ready for college and ready for work: Same or different? American College Tests, Inc. [Google Scholar]
- Amalia, L., Makmuri, M., & Hakim, L. E. (2024). Learning design: To improve mathematical problem-solving skills using a contextual approach. JIIP—Jurnal Ilmiah Ilmu Pendidikan, 7(3), 2353–2366. [Google Scholar] [CrossRef]
- Andrá, C., Lindström, P., Arzarello, F., Holmqvist, K., Robutti, O., & Sabena, C. (2015). Reading mathematics representations: An eye-tracking study. International Journal of Science and Mathematics Education, 13(2), 237–259. [Google Scholar] [CrossRef]
- Bednarik, R. (2012). Expertise-dependent visual attention strategies develop over time during debugging with multiple code representations. International Journal of Human-Computer Studies, 70(2), 143–155. [Google Scholar] [CrossRef]
- Binkley, M., Erstad, O., Herman, J., Raizen, S., Ripley, M., Miller-Ricci, M., & Rumble, M. (2012). Defining twenty-first century skills. In E. Care, P. Griffin, & M. Wilson (Eds.), Assessment and teaching of 21st century skills (pp. 17–66). Springer. [Google Scholar]
- Black, P., Burkhardt, H., Daro, P., Jones, I., Lappan, G., Pead, D., & Stephens, M. (2012). High-stakes examinations to support policy. Educational Designer, 2(5), 1–31. [Google Scholar]
- Borchers, C., Carvalho, P. F., Xia, M., Liu, P., Koedinger, K. R., & Aleven, V. (2023). What makes problem-solving practice effective? Comparing paper and AI tutoring. In European conference on technology enhanced learning (pp. 44–59). Springer Nature Switzerland. [Google Scholar]
- Büchele, S., & Feudel, F. (2023). Changes in students’ mathematical competencies at the beginning of higher education within the last decade at a German university. International Journal of Science and Mathematics Education, 21(8), 2325–2347. [Google Scholar] [CrossRef]
- Chen, J., Qian, P., Gao, X., Li, B., Zhang, Y., & Zhang, D. (2023). Inter-brain coupling reflects disciplinary differences in real-world classroom learning. npj Science Learnning, 8, 11. [Google Scholar] [CrossRef] [PubMed]
- Chen, J., Yan, H., & Xiang, J. (2011). Study of decoding mental state based on eye tracks using SVM. Computer Engineering and Applications, 47(11), 39–42. [Google Scholar]
- Chen, L. J., & Zheng, X. (2014). An eye-movement study on problem finding process of undergraduates. Acta Psychologica Sinica, 46(3), 367–384. [Google Scholar] [CrossRef]
- Chen, X. (2011). Visuelle analyse von eye-tracking-daten [Visual analysis of eye-tracking data] [Master’s thesis, Universität Stuttgart]. [Google Scholar]
- Chicco, D., Warrens, M. J., & Jurman, G. (2021). The coefficient of determination R-squared is more informative than SMAPE, MAE, MAPE, MSE and RMSE in regression analysis evaluation. PeerJ Computer Science, 7, e623. [Google Scholar] [CrossRef]
- Cilia, F., Carette, R., Elbattah, M., Dequen, G., Guérin, J. L., Bosche, J., Vandromme, L., & Le Driant, B. (2021). Computer-aided screening of autism spectrum disorder: Eye-tracking study using data visualization and deep learning. JMIR Human Factors, 8(4), e27706. [Google Scholar] [CrossRef] [PubMed]
- Confederation of British Industry (CBI). (2006). Working with the three rs: Employers’ priorities for functional skills in mathematics and English. DfES. [Google Scholar]
- da Silva Soares, R., Jr., Barreto, C., & Sato, J. (2023). Perspectives in eye-tracking technology for applications in education. South African Journal of Childhood Education, 13(1), 1–8. [Google Scholar] [CrossRef]
- Duchowski, A. T. (2002). A breadth-first survey of eye tracking applications. Behavior Research Methods, Instruments, & Computers, 34(4), 455–470. [Google Scholar]
- Epelboim, J., & Suppes, P. (2001). A model of eye movements and visual working memory during problem solving in geometry. Vision Research, 41(12), 1561–1574. [Google Scholar] [CrossRef] [PubMed]
- Feng, H., Yin, G., & An, R. (2007). A study on eye movement in solving comparison problems. Journal of Psychological Science, 30(1), 37–40. [Google Scholar]
- Hang, Y., Unenbat, B., Tang, S., Wang, F., Lin, B., & Zhang, D. (2024). Exploring the neural correlates of flow experience with multifaceted tasks and a single-channel prefrontal EEG recording. Sensors, 24(6), 1894. [Google Scholar] [CrossRef]
- Hegarty, M., & Kozhevnikov, M. (1999). Types of visual-spatial representations and mathematical problem solving. Journal of Educational Psychology, 91(4), 684. [Google Scholar] [CrossRef]
- Hegarty, M., Mayer, R. E., & Green, C. E. (1992). Comprehension of arithmetic word problems: Evidence from students’ eye fixations. Journal of Educational Psychology, 84(1), 76–84. [Google Scholar] [CrossRef]
- Hidayat, W., & Sariningsih, R. (2018). Kemampuan pemecahan masalah matematis dan adversity quotient siswa SMP melalui pembelajaran open ended. Jurnal Nasional Pendidikan Matematika, 2(1), 109–118. [Google Scholar] [CrossRef]
- Hofer, B. K. (2000). Dimensionality and disciplinary differences in personal epistemology. Contemporary Educational Psychology, 25(4), 378–405. [Google Scholar] [CrossRef]
- Holmqvist, K., Nyström, M., Andersson, R., Dewhurst, R., Jarodzka, H., & Van de Weijer, J. (2011). Eye tracking: A comprehensive guide to methods and measures. Oxford University Press. [Google Scholar]
- Hoogland, K., Pepin, B., de Koning, J., Bakker, A., & Gravemeijer, K. (2018). Word problems versus image-rich problems: An analysis of effects of task characteristics on students’ performance on contextual mathematics problems. Research in Mathematics Education, 20(1), 37–52. [Google Scholar] [CrossRef]
- Huang, M., Wang, D., Song, G., Liang, Y., Su, R., Chen, Y., Wang, L., & Yan, N. (2023). Autism spectrum disorder prediction model based on gaze trajectory of natural emotional perception. Journal of Integration Technology, 12(4), 64–76. [Google Scholar]
- Huang, P. S. (2017). An exploratory study on remote associates problem solving: Evidence of eye movement indicators. Thinking Skills and Creativity, 24, 63–72. [Google Scholar] [CrossRef]
- Hyönä, J., Lorch, R. F., Jr., & Kaakinen, J. K. (2002). Individual differences in reading to summarize expository text: Evidence from eye fixation patterns. Journal of Educational Psychology, 94(1), 44. [Google Scholar] [CrossRef]
- Jones, I., Swan, M., & Pollitt, A. (2015). Assessing mathematical problem solving using comparative judgement. International Journal of Science and Mathematics Education, 13(1), 151–177. [Google Scholar] [CrossRef]
- Just, M. A., & Carpenter, P. A. (1980). A theory of reading: From eye fixations to comprehension. Psychological Review, 87(4), 329. [Google Scholar] [CrossRef]
- Kamekona-Mendoza, K. (2018). Novice versus expert algebraic problem-solving strategies: An eye tracking approach [Master’s thesis, University of Nevada]. [Google Scholar]
- Li, T., Sun, G., Zhou, X., & Wang, T. (2023). Controlled attention, but not temporal storage of working memory correlates to math problem solving. Educational Psychology, 43(8), 895–913. [Google Scholar] [CrossRef]
- Lin, J. J. H. (2024). AI-assisted evaluation of problem-solving performance using eye movement and handwriting. Journal of Research on Technology in Education, 1–25. [Google Scholar] [CrossRef]
- Lu, R., Zhang, X., & Shi, J. (2021). The application of eye-movement technique in the study of individual cognitive differences. The Journal of Psychological Science, 44, 552–558. [Google Scholar]
- Maamin, M., Maat, S. M., & Iksan, Z. H. (2021). The influence of student engagement on mathematical achievement among secondary school students. Mathematics, 10(1), 41. [Google Scholar] [CrossRef]
- Mele, M. L., & Federici, S. (2012). Gaze and eye-tracking solutions for psychological research. Cognitive Processing, 13, 261–265. [Google Scholar] [CrossRef] [PubMed]
- Ministry of Education of the People’s Republic of China. (2021). The ministry of education issues the national compulsory education quality monitoring plan notice of the 2021 revised edition. Available online: http://www.moe.gov.cn/srcsite/A11/moe_1789/202109/t20210926_567095.html (accessed on 24 September 2021).
- Muldner, K., & Burleston, W. (2015). Utilizing sensor data to model students’ creativity in a digital environment. Computers in Human Behavior, 42, 127–137. [Google Scholar] [CrossRef]
- National Council of Teachers of Mathematics (NCTM). (2000). Principles and standards for school mathematics. National Council of Teachers of Mathematics. [Google Scholar]
- Navianto, A. (2023). Improving mathematics learning through contextual teaching and learning models using the math city map app. In Proceedings of the 7th international symposium on mathematics education and innovation (ISMEI 2022) (pp. 141–151). Atlantis Press. [Google Scholar]
- Neumann, R., Parry, S., & Becher, T. (2002). Teaching and learning in their disciplinary contexts: A conceptual analysis. Studies in Higher Education, 27(4), 405–417. [Google Scholar] [CrossRef]
- Novita, R., & Putra, M. (2016). Using task like PISA’s problem to support student’s creativity in mathematics. Journal on Mathematics Education, 7(1), 31–42. [Google Scholar] [CrossRef]
- OECD. (2009). PISA 2009 assessment framework: Key competencies in reading, mathematics and science. OECD. [Google Scholar]
- Ofsted. (2008). Mathematics: Understanding the score. Office for Standards in Education. [Google Scholar]
- Ofsted. (2012). School inspection handbook. Ofsted. [Google Scholar]
- Ontario Ministry of Training, Colleges and Universities. (2005). Ontario: A leader in learning. Ontario Ministry of Training, Colleges and Universities. Available online: https://ucarecdn.com/826771e2-3c0d-47d6-857f-33224d47e1b2/ (accessed on 8 May 2025).
- Palmér, H., & Van Bommel, J. (2020). Young students posing problem-solving tasks: What does posing a similar task imply to students? ZDM Mathematics Education, 52(4), 743–752. [Google Scholar] [CrossRef]
- Parviainen, P., Eklund, K., Koivula, M., Liinamaa, T., & Rutanen, N. (2023). Teaching early mathematical skills to 3- to 7-year-old children differences related to mathematical skill category, children’s age group and teachers’ characteristics. International Journal of Science and Mathematics Education, 21(7), 1961–1983. [Google Scholar] [CrossRef]
- Passolunghi, M. C., Cargnelutti, E., & Pellizzoni, S. (2019). The relation between cognitive and emotional factors and arithmetic problem-solving. Educational Studies in Mathematics, 100, 271–290. [Google Scholar] [CrossRef]
- Pinheiro, E. D., Sato, J. R., Soares Junior, R. S., Barreto, C., & Oku, A. Y. A. (2024). Eye-tracker and fNIRS: Using neuroscientific tools to assess the learning experience during children’s educational robotics activities. Trends in Neuroscience and Education, 36, 100234. [Google Scholar] [CrossRef]
- Polya, G. (2007). How to solve it: A new aspect of mathematical method (H. Tu, & C. Feng, Trans.). Science Press/Shanghai Scientific & Educational Publishing House. (Original work published 1982). [Google Scholar]
- Raju, G., & Madhusudan, J. (2021). Exploring the role of mathematics in shaping society. Journal of Nonlinear Analysis and Optimization, 12(2), 306–311. [Google Scholar]
- Rayner, K. (2009). The 35th Sir Frederick Bartlett Lecture: Eye trackings and attention in reading, scene perception, and visual search. Quarterly Journal of Experimental Psychology, 62(8), 1457–1506. [Google Scholar] [CrossRef]
- Rellensmann, J., Schukajlow, S., & Leopold, C. (2017). Make a drawing. Effects of strategic knowledge, drawing accuracy, and type of drawing on students’ mathematical modelling performance. Educational Studies in Mathematics, 95, 53–78. [Google Scholar] [CrossRef]
- Samo, D. D., & Kartasasmita, B. G. (2018). Culture-based contextual learning to increase problem-solving ability of first year university student. Journal on Mathematics Education, 9(1), 81–94. [Google Scholar] [CrossRef]
- Sangwin, C., & Kocher, N. (2016). Automation of mathematics examinations. Computers & Education, 94, 215–227. [Google Scholar]
- Scheinost, D., Noble, S., Horien, C., Greene, A. S., Lake, E. M., Salehi, M., Gao, S., Shen, X., O’Connor, D., Barron, D. S., Yip, S. W., Rosenberg, M. D., & Constable, R. T. (2019). Ten simple rules for predictive modeling of individual differences in neuroimaging. NeuroImage, 193, 35–45. [Google Scholar] [CrossRef] [PubMed]
- Schindler, M., & Lilienthal, A. J. (2019). Domain-specific interpretation of eye tracking data: Towards a refined use of the eye-mind hypothesis for the field of geometry. Educational Studies in Mathematics, 101, 123–139. [Google Scholar] [CrossRef]
- Sharaev, M., Sushchinskaya, S., Bachurina, V., Taranov, G., Burnaev, E., & Arsalidou, M. (2021). Machine learning, eye movements and mathematical problem solving. Journal of Vision, 21(9), 2397. [Google Scholar] [CrossRef]
- Sinay, E., & Nahornick, A. (2016). Teaching and learning mathematics research series I: Effective instructional strategies. Toronto District School Board, 16, 8. [Google Scholar]
- Soares, R. d. S., Jr., Pinheiro, E. D., Oku, A. Y. A., Rizzo, M. B., Vieira, C. d. N., & Sato, J. R. (2024). Integrating students’ real-time gaze in teacher–student interactions: Case studies on the benefits and challenges of eye tracking in primary education. Applied Sciences, 14(23), 11007. [Google Scholar] [CrossRef]
- Strohmaier, A. R., MacKay, K. J., Obersteiner, A., & Reiss, K. M. (2020). Eye tracking methodology in mathematics education research: A systematic literature review. Educational Studies in Mathematics, 104(2), 147–200. [Google Scholar] [CrossRef]
- Susac, A. N., Bubic, A., Kaponja, J., Planinic, M., & Palmovic, M. (2014). Eye trackings reveal students’ strategies in simple equation solving. International Journal of Science and Mathematics Education, 12, 555–577. [Google Scholar] [CrossRef]
- Tang, H., & Pienta, N. (2012). Eye-tracking study of complexity in gas law problems. Journal of Chemical Education, 89(8), 988–994. [Google Scholar] [CrossRef]
- Ting, C. C., & Gluth, S. (2024). Unraveling information processes of decision-making with eye-tracking data. Frontiers in Behavioral Economics, 3, 1384713. [Google Scholar] [CrossRef]
- Toner, P. (2011). Workforce skills and innovation (OECD Education Working Papers). OECD. [Google Scholar]
- Tong, L., Li, B., Yan, B., Zhang, C., Gao, H., Chen, P., & Liu, T. (2024). Eye movement-based image interpretation cognitive ability assessment method and system (China Patent , No. CN117481593A). [Google Scholar]
- Trezise, K., & Reeve, R. A. (2014). Cognition-emotion interactions: Patterns of change and implications for math problem solving. Frontiers in Psychology, 5, 840. [Google Scholar] [CrossRef] [PubMed]
- Türkoğlu, H., & Yalçınalp, S. (2024). Investigating problem-solving behaviours of university students through an eye-tracking system using GeoGebra in geometry: A case study. Education and Information Technologies, 29(12), 15761–15791. [Google Scholar] [CrossRef]
- Ukobizaba, F., Nizeyimana, G., & Mukuka, A. (2021). Assessment strategies for enhancing students’ mathematical problem-solving skills: A review of literature. Eurasia Journal of Mathematics, Science and Technology Education, 17(3), em1945. [Google Scholar] [CrossRef]
- Van der Schoot, M., Arkema, A. H. B., Horsley, T. M., & van Lieshout, E. C. (2009). The consistency effect depends on markedness in less successful but not successful problem solvers: An eye tracking study in primary school children. Contemporary Educational Psychology, 34(1), 58–66. [Google Scholar] [CrossRef]
- Van Gog, T., & Jarodzka, H. (2013). Eye tracking as a tool to study and enhance cognitive and metacognitive processes in computer-based learning environments. In International handbook of metacognition and learning technologies (pp. 143–156). Springer New York. [Google Scholar]
- Van Gog, T., Jarodzka, H., Scheiter, K., Gerjets, P., & Paas, F. (2009). Attention guidance during example study via the model’s eye movements. Computers in Human Behavior, 25(3), 785–791. [Google Scholar] [CrossRef]
- Van Harpen, X. Y., & Sriraman, B. (2013). Creativity and mathematical problem posing: An analysis of high school students’ mathematical problem posing in China and the USA. Educational Studies in Mathematics, 82, 201–221. [Google Scholar] [CrossRef]
- Vessonen, T., Dahlberg, M., Hellstrand, H., Widlund, A., Korhonen, J., Aunio, P., & Laine, A. (2024). Task characteristics associated with mathematical word problem-solving performance among elementary school-aged children: A systematic review and meta-analysis. Educational Psychology Review, 36(4), 117. [Google Scholar] [CrossRef]
- Vordermann, C., Porkess, R., Budd, C., Dunne, R., & Rahman-Hart, P. (2011). A world-class mathematics education for all our young people. The Conservative Party. [Google Scholar]
- Walport, M., Goodfellow, J., McLoughlin, F., Post, M., Sjøvoll, J., Taylor, M., & Waboso, D. (2010). Science and mathematics secondary education for the 21st century: Report of the science and learning expert group. Department for Business, Industry and Skills. [Google Scholar]
- Wang, H., Yang, J., Hu, M., Tang, J., & Yu, W. (2024). A comparative analysis for eye tracking characteristics between professional and non-professional players in FIFA eSports game. Displays, 81, 102599. [Google Scholar] [CrossRef]
- Wang, X., Kang, W., Huang, L., & Li, L. (2022). The impact of illustrations on solving mathematical word problems for Chinese primary school students: Evidence for a split attention effect on eye-movement research. ZDM–Mathematics Education, 54(3), 555–567. [Google Scholar] [CrossRef]
- Wang, Y., Wei, X., Li, J., Zhang, L., & Chen, H. (2021). A human-computer interaction intent recognition method combining EEG and eye movement signals. IEEE Transactions on Neural Systems and Rehabilitation Engineering, 29, 1234–1243. [Google Scholar]
- Wen, P., Lu, F., & Mohamad Ali, A. Z. (2024). Using attentional guidance methods in virtual reality laboratories reduces students’ cognitive load and improves their academic performance. Virtual Reality, 28(2), 110. [Google Scholar] [CrossRef]
- Wright, A. M., Salas, J. A., Carter, K. E., & Levin, D. T. (2022). Eye movement modeling examples guide viewer eye movements but do not improve learning. Learning and Instruction, 79, 101601. [Google Scholar] [CrossRef]
- Xu, H., Xuan, X., Zhang, L., Zhang, W., Zhu, M., & Zhao, X. (2021). New approach to intelligence screening for children with global development delay using eye-tracking technology: A pilot study. Frontiers in Neurology, 12, 723526. [Google Scholar] [CrossRef] [PubMed]
- Yan, Z. (2022). An empirical study of the factors affecting the profitability of commercial banks—Based on partial least squares regression (PLSR) algorithm. The Theory and Practice of Finance and Economics, 4, 10–17. [Google Scholar]
- Yang, X., Li, J., & Cheng, Y. (2020). Cognitive strategy detection in complex problem solving: A multimodal approach using eye tracking and machine learning. Journal of Educational Psychology, 112(8), 1563–1581. [Google Scholar]
- Zhang, H., & Chen, Q. (2018). Study on influencing factors of academic journal influence based on the PLSR model. Information Science, 36(2), 53–57. [Google Scholar]
- Zhang, J., Shen, D., & Zang, C. (2006). Representation of arithmetic word problems: Evidence from undergraduates’ eye fixations. Studies of Psychology and Behavior, 4(3), 188–193. [Google Scholar]
- Zhao, X., Qi, L., Li, L., & Li, Y. (2021). The role of learning strategies in mathematics problem-solving of high school students: A study based on eye-tracking technique. Journal of Qinghai Normal University (Natural Science Edition), 37(1), 75–81. [Google Scholar]
Disclaimer/Publisher’s Note: The statements, opinions and data contained in all publications are solely those of the individual author(s) and contributor(s) and not of MDPI and/or the editor(s). MDPI and/or the editor(s) disclaim responsibility for any injury to people or property resulting from any ideas, methods, instructions or products referred to in the content. |
© 2025 by the authors. Licensee MDPI, Basel, Switzerland. This article is an open access article distributed under the terms and conditions of the Creative Commons Attribution (CC BY) license (https://creativecommons.org/licenses/by/4.0/).