
Buffer or Boost? The Role of Job Resources in Predicting Teacher Work Engagement and Emotional Exhaustion in Different School Types


Abstract
1. Introduction
1.1. State of Research
1.1.1. School Types and Job Demands
1.1.2. Job Resources in Teaching (Social Support and Resilience)
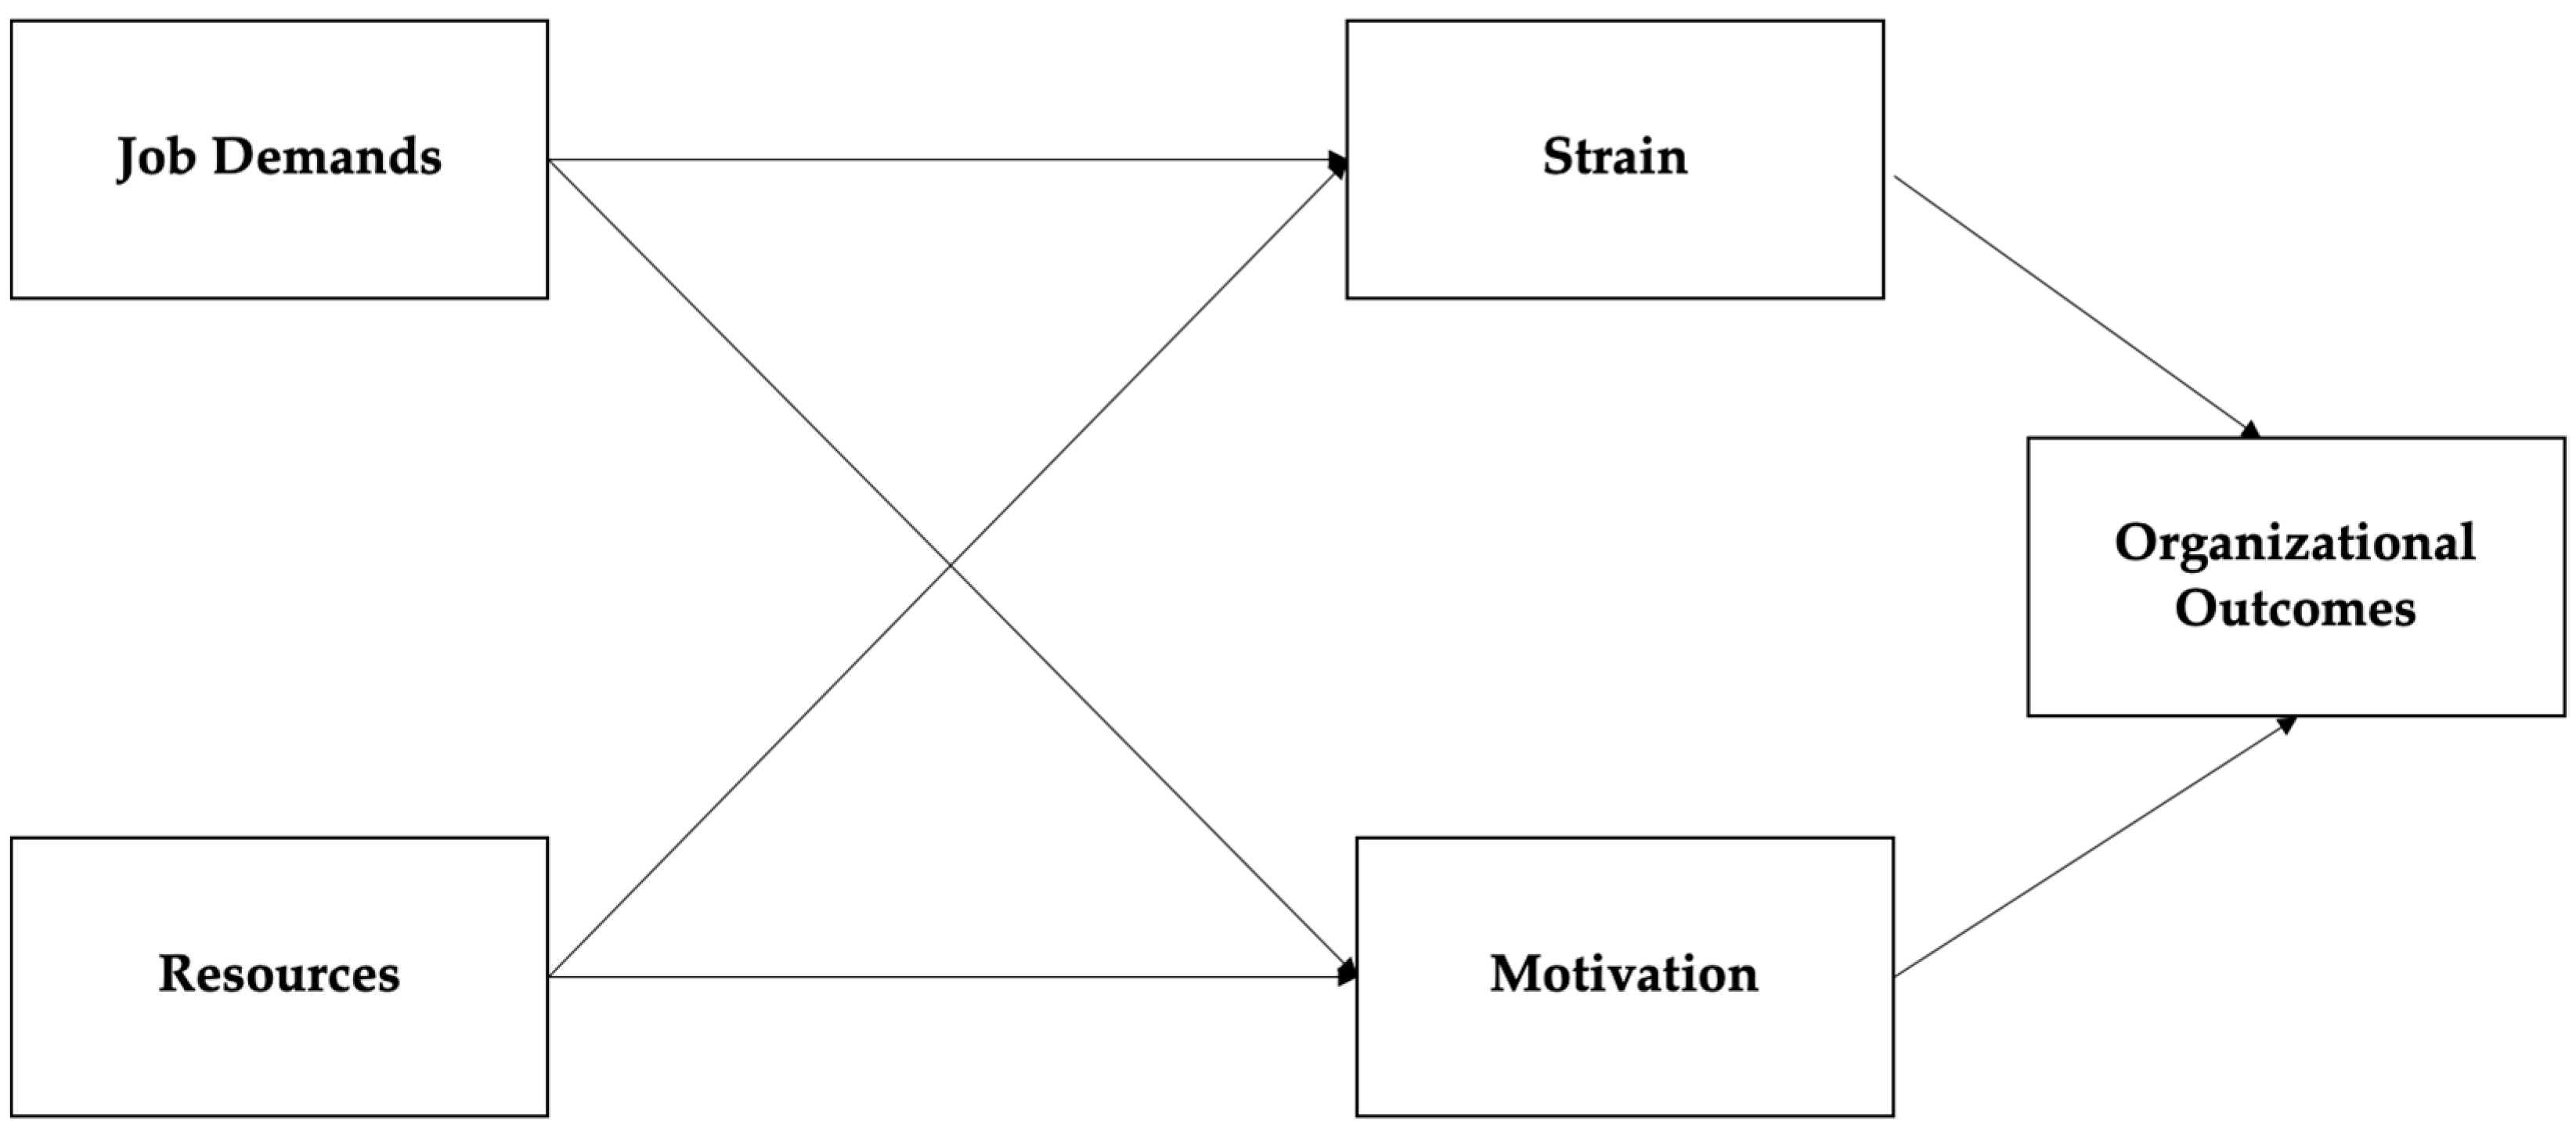
1.1.3. The Job Demands-Resources (JD-R) Theory
1.2. Research Questions
- How strongly are school types, job resources (collegial and school management support), and individual resources (resilience) correlated with work engagement and emotional exhaustion? (See Figure 2.)
- Are job resources moderating the relationship between school types and work engagement/emotional exhaustion? (See Figure 3.)
- 2.1
- Do teachers from schools with higher demands profit more from job resources in regard to work engagement and emotional exhaustion? (Buffering effect.)
- 2.2
- Do teachers from schools with lower demands profit more from job resources in regard to work engagement and emotional exhaustion? (Boost effect.)
2. Data and Methods
2.1. Data
2.2. Methods
2.3. Measures
- Dependent Variables
- Independent Variables
- Control Variables
3. Results
3.1. Work Engagement
3.2. Emotional Exhaustion
4. Discussion
4.1. Discussion of Research Questions
4.2. Implications for Practice and Policy
- Leadership development programs that emphasize relational competencies (Besa et al., 2022);
- Policy frameworks that integrate well-being into school quality standards (Thönes et al., 2024);
- Targeted resource allocation to structurally disadvantaged school types to unlock the full potential of job resources (Cann et al., 2023).
4.3. Limitations and Future Directions
5. Conclusions
Author Contributions
Funding
Institutional Review Board Statement
Informed Consent Statement
Data Availability Statement
Conflicts of Interest
Appendix A

| Model 1 | Model 2 | Model 3 | |
|---|---|---|---|
| Resources | |||
| Collegial support | 0.124 *** | 0.177 *** | |
| (0.011) | (0.016) | ||
| School management support | 0.243 *** | 0.235 *** | |
| (0.009) | (0.013) | ||
| Resilience | 0.376 *** | 0.388 *** | 0.388 *** |
| (0.016) | (0.016) | (0.016) | |
| School Type | |||
| Primary school (Ref.) | |||
| Secondary school | −0.036 ** | −0.100 * | −0.114 ** |
| (0.038) | (0.148) | (0.109) | |
| Grammar school | −0.002 | −0.155 ** | −0.069 |
| 0.037 | 0.146 | 0.105 | |
| Comprehensive school | −0.009 | −0.247 *** | −0.172 *** |
| (0.034) | (0.142) | (0.097) | |
| Vocational school | 0.035 ** | −0.185 *** | −0.122 *** |
| (0.047) | (0.166) | (0.130) | |
| Special needs school | 0.029 * | −0.195 ** | −0.051 |
| (0.036) | (0.173) | (0.118) | |
| Interaction Terms | |||
| School Type x Collegial Support | |||
| Primary school (Ref.) | |||
| Secondary school | 0.0398 | ||
| (0.029) | |||
| Grammar school | 0.122 * | ||
| (0.0283) | |||
| Comprehensive school | 0.204 *** | ||
| (0.027) | |||
| Vocational school | 0.203 *** | ||
| (0.033) | |||
| Special needs school | 0.227 *** | ||
| (0.032) | |||
| School Type x School Management Support | |||
| Primary school (Ref.) | |||
| Secondary school | 0.066 | ||
| (0.025) | |||
| Grammar school | 0.057 | ||
| (0.025) | |||
| Comprehensive school | 0.169 *** | ||
| (0.022) | |||
| Vocational school | 0.154 *** | ||
| (0.031) | |||
| Special needs school | 0.088 * | ||
| (0.025) | |||
| Controls | |||
| Sex (Ref. = male) | 0.041 ** | 0.029 * | 0.046 *** |
| (0.029) | (0.030) | (0.030) | |
| Age | 0.018 | 0.021 | 0.014 |
| (0.001) | (0.001) | (0.001) | |
| Relationship Status (Ref. = Yes) | |||
| Not in a relationship | 0.004 | 0.0019 | 0.005 |
| (0.034) | (0.034) | (0.034) | |
| No response | −0.007 | (−0.010) | (−0.009) |
| (0.064) | (0.065) | (0.064) | |
| Child in Household < 18 (Ref. = No) | |||
| Yes | 0.015 | 0.0149 | 0.018 |
| 0.032 | (0.033) | (0.033) | |
| No response | −0.037 * | −0.033 * | −0.036 * |
| 0.033 | (0.033) | (0.033) | |
| Lessons in school (Ref. < 25 h) | 0.023 | 0.019 | 0.023 |
| 0.025 | (0.025) | (0.025) | |
| Observations | 5582 | 5615 | 5586 |
| R2 | 0.304 | 0.270 | 0.298 |
| Contrast | Std. Err. | t | p > |t| | |
|---|---|---|---|---|
| Secondary school vs.primary school | 0.245 | 0.291 | 0.84 | 1.000 |
| Grammar school vs. primary school | 0.070 | 0.284 | 2.45 | 0.214 |
| Comprehensive school vs. primary school | 0.100 | 0.027 | 3.69 | 0.003 |
| Vocational school vs. primary school | 0.157 | 0.033 | 4.72 | 0.000 |
| Special needs school vs. primary school | 0.121 | 0.032 | 3.79 | 0.002 |
| Grammar school vs. secondary school | 0.045 | 0.034 | 1.33 | 1.000 |
| Comprehensive school vs. secondary school | 0.075 | 0.033 | 2.29 | 0.327 |
| Vocational school vs. secondary school | 0.132 | 0.038 | 3.48 | 0.008 |
| Special needs school vs. secondary school | 0.096 | 0.037 | 2.61 | 0.136 |
| Comprehensive school vs. grammar school | 0.030 | 0.032 | 0.94 | 1.000 |
| Vocational school vs. grammar school | 0.087 | 0.037 | 2.32 | 0.303 |
| Special needs school vs. grammar school | 0.051 | 0.036 | 1.41 | 1.000 |
| Vocational school vs. comprehensive school | 0.057 | 0.036 | 1.56 | 1.000 |
| Special needs school vs. comprehensive school | 0.021 | 0.035 | 0.60 | 1.000 |
| Special needs school vs. vocational school | −0.036 | 0.040 | −0.89 | 1.000 |
| Contrast | Std. Err. | t | p > |t| | |
|---|---|---|---|---|
| Secondary school vs. primary school | 0.048 | 0.025 | 1.91 | 0.833 |
| Grammar school vs. primary school | 0.040 | 0.025 | 1.62 | 1.000 |
| Comprehensive school vs. primary school | 0.105 | 0.022 | 4.68 | 0.000 |
| Vocational school vs. primary school | 0.141 | 0.031 | 4.60 | 0.000 |
| Special needs school vs. primary school | 0.054 | 0.025 | 2.16 | 0.459 |
| Grammar school vs. secondary school | −0.008 | 0.030 | −0.26 | 1.000 |
| Comprehensive school vs. secondary school | 0.057 | 0.028 | 2.03 | 0.633 |
| Vocational school vs. secondary school | 0.093 | 0.035 | 2.67 | 0.113 |
| Special needs school vs. secondary school | 0.006 | 0.030 | 0.21 | 1.000 |
| Comprehensive school vs. grammar school | 0.064 | 0.027 | 2.34 | 0.288 |
| Vocational school vs. grammar school | 0.101 | 0.035 | 2.92 | 0.052 |
| Special needs school vs. grammar school | 0.014 | 0.030 | 0.47 | 1.000 |
| Vocational school vs. comprehensive school | 0.037 | 0.033 | 1.12 | 1.000 |
| Special needs school vs. comprehensive school | −0.050 | 0.028 | −1.81 | 1.000 |
| Special needs school vs. vocational school | −0.087 | 0.035 | −2.50 | 0.188 |
| Model 1 | Model 2 | Model 3 | |
|---|---|---|---|
| Resources | |||
| Collegial support | −0.082 *** | −0.188 *** | |
| (0.012) | (0.018) | ||
| School management support | −0.251 *** | −0.275 *** | |
| (0.010) | (0.015) | ||
| Resilience | −0.311 *** | −0.324 *** | −0.318 *** |
| (0.017) | (0.018) | (0.017) | |
| School Type | |||
| Primary school (Ref.) | |||
| Secondary school | −0.016 | 0.011 | 0.004 |
| (0.043) | (0.165) | (0.121) | |
| Grammar school | −0.080 *** | −0.031 | −0.111 ** |
| (0.041) | (0.162) | (0.116) | |
| Comprehensive school | −0.015 | 0.110 | 0.060 |
| (0.037) | (0.159) | (0.107) | |
| Vocational school | −0.104 *** | 0.074 | 0.006 |
| (0.052) | (0.186) | (0.144) | |
| Special needs school | −0.063 *** | −0.092 | −0.074 |
| 0.040 | 0.193 | (0.131) | |
| Interaction Terms | |||
| School Type x Collegial Support | |||
| Primary school (Ref.) | |||
| Secondary school | −0.009) | ||
| (0.032) | |||
| Grammar school | −0.017 | ||
| (0.031) | |||
| Comprehensive school | −0.088 | ||
| (0.030) | |||
| Vocational school | −0.164 *** | ||
| (0.037) | |||
| Special needs school | 0.033 | ||
| (0.036) | |||
| School Type x School Management Support | |||
| Primary school (Ref.) | |||
| Secondary school | −0.014 | ||
| (0.028) | |||
| Grammar school | 0.040 | ||
| (0.027) | |||
| Comprehensive school | −0.080 * | ||
| (0.025) | |||
| Vocational school | −0.111 ** | ||
| 0.034 | |||
| Special needs school | 0.010 | ||
| (0.028) | |||
| Controls | |||
| Sex (Ref. = male) | 0.081 *** | 0.093 *** | 0.079 *** |
| (0.033) | (0.034) | (0.033) | |
| Age | −0.127 *** | −0.129 *** | −0.123 *** |
| (0.001) | (0.001) | (0.001) | |
| Relationship Status (Ref. = Yes) | |||
| Not in a relationship | −0.008) | −0.005 | −0.008 |
| (0.037) | (0.038) | (0.037) | |
| No response | −0.011 | −0.008 | −0.009 |
| (0.071) | (0.073) | (0.071) | |
| Child in Household < 18 (Ref. = No) | |||
| Yes | −0.028) | −0.027 | −0.029 |
| (0.036) | (0.037) | (0.036) | |
| No response | 0.029 | 0.026 | 0.029 |
| (0.036) | (0.037) | (0.036) | |
| Lessons in school (Ref. < 25 h) | 0.009 | 0.013 | 0.009 |
| (0.027) | (0.028) | (0.027) | |
| Observations | 5583 | 5616 | 5587 |
| R2 | 0.256 | 0.216 | 0.254 |
| Contrast | Std. Err. | t | p > |t| | |
|---|---|---|---|---|
| Secondary school vs. primary school | −0.006 | 0.325 | −0.18 | 1.000 |
| Grammar school vs. primary school | −0.010 | 0.032 | −0.33 | 1.000 |
| Comprehensive school vs. primary school | −0.046 | 0.030 | −1.54 | 0.003 |
| Vocational school vs. primary school | −0.136 | 0.037 | −3.69 | 1.000 |
| Special needs school vs. primary school | 0.019 | 0.036 | 0.54 | 1.000 |
| Grammar school vs. secondary school | −0.004 | 0.038 | −0.12 | 1.000 |
| Comprehensive school vs. secondary school | −0.040 | 0.036 | −1.11 | 1.000 |
| Vocational school vs. secondary school | −0.130 | 0.042 | −3.08 | 0.031 |
| Special needs school vs. secondary school | 0.025 | 0.041 | 0.61 | 1.000 |
| Comprehensive school vs. grammar school | −0.036 | 0.036 | −1.01 | 1.000 |
| Vocational school vs. grammar school | −0.126 | 0.042 | −3.02 | 0.038 |
| Special needs school vs. grammar school | 0.030 | 0.040 | 0.73 | 1.000 |
| Vocational school vs. comprehensive school | −0.090 | 0.041 | −2.22 | 0.398 |
| Special needs school vs. comprehensive school | 0.066 | 0.039 | 1.67 | 1.000 |
| Special needs school vs. vocational school | 0.156 | 0.045 | 3.47 | 0.008 |
| Contrast | Std. Err. | t | p > |t| | |
|---|---|---|---|---|
| Secondary school vs. primary school | −0.011 | 0.028 | −0.39 | 1.000 |
| Grammar school vs. primary school | 0.031 | 0.027 | 1.12 | 1.000 |
| Comprehensive school vs. primary school | −0.053 | 0.025 | −2.15 | 0.476 |
| Vocational school vs. primary school | −0.110 | 0.034 | −3.22 | 0.019 |
| Special needs school vs. primary school | 0.006 | 0.028 | 0.23 | 1.000 |
| Grammar school vs. secondary school | 0.041 | 0.033 | 1.25 | 1.000 |
| Comprehensive school vs. secondary school | −0.042 | 0.031 | −1.38 | 1.000 |
| Vocational school vs. secondary school | −0.099 | 0.039 | −2.56 | 0.158 |
| Special needs school vs. secondary school | 0.017 | 0.033 | 0.52 | 1.000 |
| Comprehensive school vs. grammar school | −0.084 | 0.030 | −2.75 | 0.090 |
| Vocational school vs. grammar school | −0.140 | 0.038 | −3.66 | 0.004 |
| Special needs school vs. grammar school | −0.024 | 0.033 | −0.73 | 1.000 |
| Vocational school vs. comprehensive school | −0.057 | 0.037 | −1.55 | 1.000 |
| Special needs school vs. comprehensive school | 0.060 | 0.031 | 1.94 | 0.795 |
| Special needs school vs. vocational school | 0.116 | 0.039 | 3.01 | 0.040 |
References
- Bakker, A. B., & Demerouti, E. (2007). The job demands-resources model: State of the art. Journal of Managerial Psychology, 22(3), 309–328. [Google Scholar] [CrossRef]
- Bakker, A. B., & Demerouti, E. (2024). Job demands–resources theory: Frequently asked questions. Journal of Occupational Health Psychology, 29(3), 188–200. [Google Scholar] [CrossRef] [PubMed]
- Bakker, A. B., Demerouti, E., & Sanz-Vergel, A. (2023). Job demands–resources theory: Ten years later. Annual Review of Organizational Psychology and Organizational Behavior, 10(1), 25–53. [Google Scholar] [CrossRef]
- Besa, K.-S., Gesang, J., Kruse, C., & Rothland, M. (2022). Schulleitungshandeln und Kooperationsklima als Prädiktoren von Arbeitszufriedenheit und Mitarbeiterbindung an Schulen. Zeitschrift für Pädagogik, 68(6), 869–880. [Google Scholar] [CrossRef]
- Cann, R., Sinnema, C., Rodway, J., & Daly, A. J. (2023). What do we know about interventions to improve educator wellbeing? A systematic literature review. Journal of Educational Change, 25, 231–270. [Google Scholar] [CrossRef]
- Craney, T. A., & Surles, J. G. (2002). Model-dependent variance inflation factor cutoff values. Quality Engineering, 14(3), 391–403. [Google Scholar] [CrossRef]
- Dicke, T., Stebner, F., Linninger, C., Kunter, M., & Leutner, D. (2017). A longitudinal study of teachers’ occupational well-being: Applying the job demands–resources model. Journal of Occupational Health Psychology, 22(2), 262–277. [Google Scholar] [CrossRef] [PubMed]
- Dreer, B. (2023). On the outcomes of teacher wellbeing: A systematic review of research. Frontiers in Psychology, 14, 1205179. [Google Scholar] [CrossRef] [PubMed]
- Fey, C. F., Hu, T., & Delios, A. (2023). The measurement and communication of effect sizes in management research. Management and Organization Review, 19(1), 176–197. [Google Scholar] [CrossRef]
- Hascher, T., Beltman, S., & Mansfield, C. (2021). Teacher wellbeing and resilience: Towards an integrative model. Educational Research, 63, 416–439. [Google Scholar] [CrossRef]
- Hascher, T., & Waber, J. (2021). Teacher well-being: A systematic review of the research literature from the year 2000–2019. Educational Research Review, 34, 100411. [Google Scholar] [CrossRef]
- Kassis, W., Vasiou, A., Govaris, C., Favre, C., Aksoy, D., & Graf, U. (2024). Social and individual factors predicting students’ resilience: A multigroup structural equation model. Education Sciences, 14(1), 15. [Google Scholar] [CrossRef]
- Mansfield, C. F. (2021). Promoting teacher resilience in challenging educational settings. Educational Practice and Theory, 43(1), 23–37. [Google Scholar]
- Maslach, C., Jackson, S. E., & Leiter, M. (1996). Maslach burnout inventory—Educators survey—Manual (3rd ed.). Consulting Psychologists Press. [Google Scholar]
- MSB NRW. (2024). Das Schulwesen in Nordrhein-Westfalen aus quantitativer Sicht 2023/2024. Statistische Übersicht Nr. 425. MSB NRW. [Google Scholar]
- Nieminen, P. (2022). Application of standardized regression coefficient in meta-analysis. BioMedInformatics, 2(3), 434–458. [Google Scholar] [CrossRef]
- Reintjes, C., Bellenberg, G., Kaiser, T., & Winter, I. (2025). Frühjahrsreport 2025: Psychische gesundheit an schulen in nordrhein-westfalen. GEW NRW. [Google Scholar]
- Robert Bosch Stiftung. (2022). Das deutsche Schulbarometer: Aktuelle Herausforderungen der Schulen aus Sicht der Lehrkräfte. Ergebnisse einer Befragung von Lehrkräften allgemeinbildender und berufsbildender Schulen durchgeführt von forsa gesellschaft für sozialforschung und statistische analysen mbH. Robert Bosch Stiftung. [Google Scholar]
- Schaarschmidt, U., & Kieschke, U. (2013). Beanspruchungsmuster im lehrerberuf ergebnisse und schlussfolgerungen aus der potsdamer lehrerstudie. In M. Rothland (Ed.), Belastung und beanspruchung im lehrerberuf. Springer VS. [Google Scholar]
- Schaufeli, W., & Bakker, A. (2003). Utrecht work engagement scale: Preliminary manual. Occupational Health Psychology Unit, Utrecht University. [Google Scholar]
- Schulze-Hagenest, T., Carstensen, B., Weber, K., Jansen, T., Meyer, J., Köller, O., & Klusmann, U. (2023). Teachers’ emotional exhaustion and job satisfaction: How much does the school context matter? Teaching and Teacher Education, 136, 1–12. [Google Scholar] [CrossRef]
- Schumacher, J., Leppert, K., Gunzelmann, T., Strauß, B., & Brähler, E. (2005). Die resilienzskala—Ein fragebogen zur erfassung der psychischen widerstandsfähigkeit als personmerkmal. Zeitschrift für Klinische Psychologie und Psychotherapie, 53(1), 16–39. [Google Scholar]
- Solga, H. (2008). Wie das deutsche Schulsystem Bildungsungleichheiten verursacht, WZBrief Bildung, No. 01. Wissenschaftszentrum Berlin für Sozialforschung (WZB). [Google Scholar]
- Thönes, K. V., Reintjes, C., & Bellenberg, G. (2024). Wohlbefinden als gegenstand von eignungsreflexion und professionalisierung. In J. Holle, P. Gollub, & W. Böttcher (Eds.), Eignungsabklärung und -reflexion im Lehramt (pp. 292–304). Waxmann. [Google Scholar]
- Wartenberg, G., Aldrup, K., Grund, S., & Klusmann, U. (2023). Satisfied and high performing? A meta-analysis and systematic review of the correlates of teachers’ job satisfaction. Educational Psychology Review, 35, 114. [Google Scholar] [CrossRef]


Disclaimer/Publisher’s Note: The statements, opinions and data contained in all publications are solely those of the individual author(s) and contributor(s) and not of MDPI and/or the editor(s). MDPI and/or the editor(s) disclaim responsibility for any injury to people or property resulting from any ideas, methods, instructions or products referred to in the content. |
© 2025 by the authors. Licensee MDPI, Basel, Switzerland. This article is an open access article distributed under the terms and conditions of the Creative Commons Attribution (CC BY) license (https://creativecommons.org/licenses/by/4.0/).
Share and Cite
Reintjes, C.; Kaiser, T.; Winter, I.; Bellenberg, G. Buffer or Boost? The Role of Job Resources in Predicting Teacher Work Engagement and Emotional Exhaustion in Different School Types. Educ. Sci. 2025, 15, 708. https://doi.org/10.3390/educsci15060708
Reintjes C, Kaiser T, Winter I, Bellenberg G. Buffer or Boost? The Role of Job Resources in Predicting Teacher Work Engagement and Emotional Exhaustion in Different School Types. Education Sciences. 2025; 15(6):708. https://doi.org/10.3390/educsci15060708
Chicago/Turabian StyleReintjes, Christian, Till Kaiser, Isabelle Winter, and Gabriele Bellenberg. 2025. "Buffer or Boost? The Role of Job Resources in Predicting Teacher Work Engagement and Emotional Exhaustion in Different School Types" Education Sciences 15, no. 6: 708. https://doi.org/10.3390/educsci15060708
APA StyleReintjes, C., Kaiser, T., Winter, I., & Bellenberg, G. (2025). Buffer or Boost? The Role of Job Resources in Predicting Teacher Work Engagement and Emotional Exhaustion in Different School Types. Education Sciences, 15(6), 708. https://doi.org/10.3390/educsci15060708