Article

The Development and Validation of a K-12 STEM Engagement Participant Outcome Instrument

1
Community Schools, College of Community and Public Affairs, SUNY—Binghamton University, Binghamton, NY 13902, USA
2
Science, Technology, Engineering, and Mathematics Education, College of Education, North Carolina State University, Raleigh, NC 27695, USA
*
Author to whom correspondence should be addressed.
Educ. Sci. 2025, 15(3), 377; https://doi.org/10.3390/educsci15030377
Submission received: 24 January 2025 / Revised: 13 March 2025 / Accepted: 14 March 2025 / Published: 18 March 2025
(This article belongs to the Section STEM Education)

Abstract

:
The U.S. Federal STEM Strategic Plan released in 2018 charged federal agencies to operate with transparency and accountability regarding the impact of STEM programming on participant outcomes. This study’s purpose is to share a robust and iterative design-based research validation study for a middle school (U.S. grades 6–8; ages 11–14 years old) Student STEM Outcomes Survey. Our team partnered with NASA to develop an instrument to study the impact of participation in NASA Office of STEM Education’s (OSTEM) engagement programming on middle school student affective outcomes. Overall, this study produced strong validity evidence for each construct (STEM Identity, STEM Self-Efficacy, STEM Interest, 21st century skills) of the Student STEM Outcomes Survey. Qualitative field testing results from subject matter experts and middle grade students related to content, response processes, and consequences of testing validity evidence provided support for data-informed item wording modifications. Rasch psychometric results assisted in meaningfully paring back items to ultimately result in parsimonious and psychometrically sound survey sections based on internal structure and response processes findings. Suggestions for using the newly developed and validated Student STEM Outcomes Survey are provided.

1. Introduction

For more than a decade, there has been increased focus on making access to high-quality science, technology, engineering, and mathematics (STEM) education a reality for K-12 students. In more recent years, this effort has been prioritized by federal policy in the United States (U.S.) through funding allocations and a strategic plan for STEM education (e.g., National Science and Technology Council Committee on STEM Education [NSTC], 2018). Largely, this initiative has been in response to prominent federal reports, including Rising Above the Gathering Storm (National Academies of Sciences, National Academy of Engineering, and Medicine [NASEM], 2007), which emphasized projected gaps in the nation’s STEM talent supply. Continual low performance for middle school students’ national assessment scores in mathematics (e.g., National Assessment for Educational Progress [NAEP], 2013, 2020, 2023) and no significant gains for eighth graders in science scores (e.g., National Assessment for Educational Progress [NAEP], 2015; National Center for Education Statistics [NCES], 2019) exacerbate the situation. Internationally, U.S. 15-year-old students’ performance on the 2018 Program for International Student Assessment (PISA) mathematics section was below the overall average score and lower than 24 of the 36 Organization for Economic Co-operation and Development (OECD) countries. These performance data showed no statistical gains compared to U.S. students’ performance in 2003 (National Center for Education Statistics [NCES], 2019).
The reality for U.S. students in K-12 schools is that many do not have access to effective STEM instruction (National Science Foundation, 2022; National Academies of Sciences, National Academy of Engineering, and Medicine [NASEM], 2021) or out-of-school experiences that engage them in authentic, real-world explorations of STEM concepts and challenges (National Research Council [NRC], 2015). As a result, U.S. federal agencies such as the National Aeronautics and Space Administration (NASA), Department of Defense (DOD), and others have responded with investments in STEM programs, internships, apprenticeships, competitions, and additional opportunities for K-12 and post-secondary students. Along with developing and deploying new programs, U.S. federal agencies are now charged with the responsibility to operate with transparency and accountability by the Federal STEM Strategic Plan (National Science and Technology Council Committee on STEM Education [NSTC], 2018). As such, these entities must gather evidence regarding the impact of their programming on participant outcomes. NASA’s Office of STEM Engagement (OSTEM) Performance Assessment and Evaluation staff found that existing and available instruments designed to assess student STEM self-perceptions did not align well with their program focus and desired outcomes or were not succinct enough. Recent calls have been made to publish STEM education instrument validation studies to advance the field (Sondergeld, 2020; Krupa et al., 2019). Accordingly, the purpose of this study is to share a rigorous development and validation process our team engaged in for the Student STEM Outcomes Survey (S-STEM-OS), which was designed to examine the influence of NASA’s STEM engagement programs.
For educational instruments to be deemed high quality, implementing an iterative design-based research (DBR) process (Scott et al., 2020) that collects and evaluates multiple sources of validity evidence (AERA et al., 2014) has proven to be effective (May et al., 2023; Sondergeld & Johnson, 2019). With this study, our team employed a rigorous DBR approach to design and validate a survey specifically for middle school students (U.S. grades 6–8; ages 11–14 years old). One research question guided this study: To what extent did validity evidence (content, response processes, consequences of testing, and internal structure) support the use of the S-STEM-OS in evaluating middle school students’ perceptions of their STEM interest, STEM identity, STEM self-efficacy, and 21st century skills?

1.1. Importance of STEM Out-of-School Time Programming in Middle School

Out-of-school time (OST) STEM engagement activities include “afterschool programs, summer and weekend classes, and apprenticeship opportunities” (p. 5) that are conducted outside of normal school hours, led by adults, and targeted toward youth with the goal of enhancing STEM learning or STEM literacy (National Research Council [NRC], 2015). OST enrichment programs typically target youth in grades K–12; occur after school, on weekends, or during the summer; and can be academically oriented or focus on special interests such as arts or sports (McCombs et al., 2017). These types of activities can play a critical role in the development of middle school students’ STEM interest, knowledge, and skills, as high quality STEM OST opportunities engage youth across intellectual, emotional, and social domains; are often culturally responsive and consider youth’s interests and experiences; and connect STEM learning across settings (i.e., school, home, OST, and other settings) (National Research Council [NRC], 2015).
Numerous U.S. government agencies, such as the DOD, the Environmental Protection Agency (EPA), NASA, and the National Security Agency (NSA), have created STEM outreach and engagement programs that include STEM competitions, internships, teacher resources, and K-12 student STEM programs, which can be enacted in OST settings. Science museums at both the state and local levels, as well as national institutions, also have STEM outreach programs. In particular, the Smithsonian offers a summer academy, curricula, and after-school programs, such as the ATLAS program aimed specifically at middle school students (Smithsonian Science Education Center, 2023). The Natural History Museum offers field trips and teacher resources (American Museum of Natural History, n.d.). Various non-profit organizations provide STEM outreach programs as well. For example, the Scouts have an award for STEM projects (Boy Scouts of America, n.d.); the Search for Extraterrestrial Intelligence (SETI) Institute has developed STEM curricula for middle and high school, a STEM podcast, and several local space programs for students (SETI Institute, 2023); and Science Club for Girls provides virtual and in-person afterschool programs for girls interested in STEM (Science Club for Girls, 2022). Other non-profit organizations, such as the Society for Science, provide support for teachers and schools in the form of teacher training conferences and learning resources for schools (Society for Science, 2023).
For NASA specifically, its mission for STEM engagement is to “immerse students in NASA’s work, enhance STEM literacy, and inspire the next generation to explore” (NASA, 2020, p. 3). Strategic goals for NASA’s STEM engagement include: (1) creating unique opportunities for a diverse set of students to contribute to NASA’s work in exploration and discovery; (2) building a diverse future STEM workforce by engaging students in authentic learning experiences with NASA’s people, content, and facilities; and (3) attracting diverse groups of students to STEM through learning opportunities that spark interest and provide connections to NASA’s mission and work (NASA, 2020).

1.2. Examining Student STEM Outcomes

There are distinct challenges associated with researching and evaluating OST STEM programs since these programs may take a wide variety of formats, have program-specific goals, and are delivered in informal learning settings. Authentic STEM engagement programs predominantly delivered by entities outside of K-12 schooling face substantial inherent challenges when attempting to assess their impact on student outcomes. Such programs typically do not completely cover academic content standards during activities, and most are delivered in an integrated manner in which projects or activities touch upon multiple disciplines. Additionally, depending on the focus of the program, students may work with STEM professionals who possess specialized content knowledge, a situation that can result in the experience and content varying even for students participating in the same program. These real-world OST programs have the benefit of engaging students in more extensive opportunities to investigate and explore than they may have within the K-12 classroom due to the broad curriculum that must be covered (Allen & Peterman, 2019). However, this contributes to challenges in evaluating student learning as a result of the programming. For these reasons, the assessment of disciplinary content knowledge across groups of students is not a viable strategy for most STEM engagement programs.
Both the significant potential of OST STEM programming in building students’ STEM interests and skills (National Research Council [NRC], 2015) and the federal government mandate for transparency and accountability (National Science and Technology Council Committee on STEM Education [NSTC], 2018) indicate that it is critical for agencies and organizations to possess the capacity to meaningfully evaluate the impact of their STEM engagement programming on participant outcomes. Although difficulties in measuring students’ content knowledge acquisition in OST STEM programs are substantial, programs have the opportunity to assess student outcomes in terms of their self-perceptions regarding STEM interest, identity, self-efficacy, and 21st century skill acquisition. Research has revealed that effective STEM engagement programs can play a key role in providing the setting and opportunity for students to grow their interest in STEM (Maiorca et al., 2021), help students view themselves as individuals who do STEM (e.g., Singer et al., 2020), boost students’ confidence in STEM capabilities (e.g., Han et al., 2021; Luo et al., 2021), and develop their skills to do STEM (e.g., Ok & Kaya, 2021).

2. Conceptual Framework

The conceptual framework for this study is grounded in the research base on student STEM interest, STEM identity, STEM self-efficacy, and 21st century skills. This is because these outcomes of K-12 STEM experiences have been linked to future participation, educational and career pathways, and success for individuals. Additionally, how these constructs are most commonly measured is discussed throughout the corresponding sections of the conceptual framework.

2.1. STEM Interest

STEM interest refers to a person’s interest in STEM disciplines overall and is critical to their motivation to learn (Grimmon et al., 2020). Furthermore, STEM interest has been shown to be a predictor of the likelihood of individuals pursuing STEM careers (e.g., Blotnicky et al., 2018). Key components of STEM interest include not only a “spark” but also the process of sustained engagement with STEM over time (Habig & Gupta, 2021). Evidence suggests that, for many students, an initial interest in STEM fails to develop into sustained individual interest, as by the time students enroll in postsecondary studies, only a small percentage pursue STEM degrees (Ok & Kaya, 2021). These findings imply that understanding and implementing effective strategies and interventions may help support and grow students’ STEM interests. Therefore, evaluating the extent to which OST programs can impact STEM interest at the middle grade level is important.
Most commonly, STEM interest in middle grade students has been measured with a survey but varies based on researchers’ operational definitions of the construct. Some researchers have operationally defined STEM interest in terms of liking STEM content or activities (e.g., Köller et al., 2001). Others have investigated value and feelings toward STEM (Krapp & Lewalter, 2001), while some have measured STEM interest in terms of stored knowledge and value or frequency of engagement (Renninger et al., 2002). For example, Su et al. (2009) used the STEM Career Interest Survey (STEM-CIS), based on social cognitive theory, to identify gender differences in middle school students by people-oriented versus object-oriented careers. The STEM-CIS reports middle school students’ STEM interests by subscale for each disciplinary area (Su et al., 2009). Hava and Koyunlu Ünlü (2021) utilized a computational thinking scale and a scale of attitude toward inquiry to assess linkages between middle-schoolers’ STEM interest and computational thinking. The Aspire questionnaire has also been employed to measure middle school students’ STEM interest in the four separate disciplines (Staus et al., 2020). Behavioral measures, such as online experience sampling (Ainley et al., 2002) and participant observations (Pressick-Kilborn & Walker, 2002), have been implemented to assess STEM interest. Well-developed, highly personalized interest forms have been used as a measure of STEM interest based on participation in extracurricular programs (Barron, 2006) or formal STEM group membership (Master et al., 2017). To date, however, a validated measure of integrated STEM interest (not broken down by domain) for middle school students has not been published for public use.

2.2. STEM Identity

For the purpose of this study, Godwin et al.’s (2020) definition of STEM identity is used. In this context, STEM identity is defined as an individual’s perception of themselves as a STEM-capable person and their perceived potential to succeed in STEM educational pursuits and careers. STEM identity is a complex interaction of identities, actions, aspirations, positions, and attributes (Mitsopoulou & Pavlatou, 2021). Early informal learning experiences and use of the discourse have been linked to the development of STEM identity (Dou et al., 2019). Students’ transitions to middle grade are characterized by a shift towards external and environmental motivations and fewer feelings of utility for school subjects (Carlone et al., 2014). Girls face more challenges to their participation and inclusion in STEM, which also affects the development of STEM identity (Kim et al., 2018). Middle grade students also experience dissatisfaction not with STEM fields but with STEM classes, which seem to them like a “safe” kind of science, as opposed to “dangerous” science that is practiced in the real world (Archer et al., 2010, p. 12). A longitudinal study of STEM learners in grades 4 to 7 found that female and non-white students have increasing difficulty constructing identities that include STEM in middle grade (Archer et al., 2013). Both girls and minoritized students reported being influenced by negative teacher interactions, especially regarding sexism and racism (Carlone et al., 2014). Research indicates that STEM identity influences how students at all grade levels engage in school subjects, their comfort in STEM spaces, and their persistence in STEM fields over time (Carlone & Johnson, 2007). Thus, studying the extent to which OST programs can impact STEM identity at the middle grade level is important.
Validated STEM identity surveys exist at the college undergraduate and elementary levels. Model I+ (Dou & Cian, 2022) investigates an expanded notion of STEM identity that accounts for gender and other salient factors such as parental education and home science support and was validated using undergraduates enrolled in introductory STEM courses. Also at the college level, a single-item measure for STEM identity overlap was developed in which students are asked to choose among Venn-style diagrams that best describe their identity and its overlap with a STEM identity (McDonald et al., 2019). For elementary students, the Role Identity Surveys in STEM (RIS-STEM) were created to assess a broader conception of identity and investigate students’ career area or role identification (Paul et al., 2020). Considering the gap in integrated STEM identity measurement at the middle grade level, the development of a new survey is warranted.

2.3. STEM Self-Efficacy

Self-efficacy refers to an individual’s belief in their own capabilities to achieve certain outcomes (Bandura, 1977). It has been shown to predict student academic performance in K-12 more accurately than prior performance, socio-economic status, or test scores (Bandura, 1977; Bandura & Locke, 2003). Self-efficacy is an important predictor of students’ college majors, career choices, and career aspirations (Blotnicky et al., 2018; Maiorca et al., 2021). One quarter of the variance in students’ secondary and post-secondary academic performance is predicted by measures of self-efficacy (Komarraju & Nadler, 2013). When considering STEM self-efficacy specifically, a relationship exists between self-efficacy and an individual’s motivation to learn (Luo et al., 2021), the likelihood of choosing a STEM major in college (e.g., Robinson et al., 2019; Wang, 2013), potential for success (Wu et al., 2020), and the decision to choose STEM career paths (e.g., Blotnicky et al., 2018). Although the recognition that STEM self-efficacy has important implications for STEM workforce diversity has led to investments in STEM education (Alfred et al., 2019), there is a persistent gap in STEM self-efficacy by gender and race (Sakellariou & Fang, 2021). White male students tend to have substantially higher self-efficacy than other learners (Alfred et al., 2019), pointing to the importance of understanding this phenomenon and identifying interventions to support early STEM self-efficacy development in all students. Due to these factors, it is necessary to evaluate the extent to which OST programs can impact STEM self-efficacy at the middle grade.
Because self-efficacy and its components are subjective and influenced by complex social and economic interactions, this construct has been considered difficult to measure (Blackmore et al., 2021). One example of a survey designed to measure self-efficacy in middle school STEM content areas individually is a section on the STEM-Career Interest Survey (STEM-CIS). While some surveys have been developed to measure integrated STEM self-efficacy in students, most were not designed for students in middle school (e.g., Milner et al., 2014; Nugent et al., 2010; van Aalderen-Smeets et al., 2018). Or if the instrument was designed and validated with middle school-aged students, its items were not validated with an English-speaking sample (Luo et al., 2021). Collectively, these issues justify the design and validation of a new integrated STEM self-efficacy measure for middle grade students.

2.4. 21st Century Skills

A set of critical 21st century skills—competencies essential for engaging in STEM learning and careers—were identified by the Partnership for 21st century skills in 2002 (Battelle for Kids, 2019; Lavi et al., 2021; van Laar et al., 2017). These competencies include mastery of content knowledge in a range of disciplinary areas, including science and mathematics, and an understanding of subject matter content in the broader contexts of interdisciplinary themes such as global awareness and civic literacy (Boss, 2019). Twenty-first-century skills include collaboration, creativity, problem-solving, critical thinking, communication, technological literacy, innovation, leadership, productivity, adaptability, and accountability (e.g., Battelle for Kids, 2019). This broad set of competencies was incorporated into a Framework for 21st Century Learning that encompasses four intertwined domains: Life and Career Skills; Learning and Innovation Skills; Information, Media, and Technology Skills; and 21st Century Themes associated with Key Subjects (Battelle for Kids, 2019). The literature base for OST STEM supports the connection between these domains and desired K-12 STEM outcomes (e.g., Krishnamurthi et al., 2013).
Although the broad set of competencies encompassed by the 21st century skills domains creates substantial challenges for research and measurement (Voot et al., 2013), several instruments have been created in recent years to measure students’ development of 21st century skills. Most of these instruments measure a single domain or subset of skills rather than the entire set of 21st century skills. For example, Boyacı and Atalay (2016) developed a survey for use with students in fourth grade to assess the learning and innovation skills dimension of 21st century learning. Kang et al. (2019) established a scale to measure middle and high school students on twelve skills associated with cognitive, affective, and sociocultural domains. Likewise, Kelley et al. (2019) produced an instrument to measure high school students’ communication, collaboration, critical thinking, and creativity within project-based learning activities. Sondergeld and Johnson (2019) designed a more comprehensive global assessment by identifying six research-based domains that encompass 24 discrete skills measured by teachers or mentors to assess students’ 21st century skills on a pre- and post-observation basis. Thus, the need for a comprehensive 21st century skills survey at the middle grade level has been established.

3. Methodological Frameworks

Developing and validating educational tools (e.g., surveys, assessments, etc.) is time-intensive and requires iterative qualitative and quantitative field testing (Sondergeld & Johnson, 2019). Implementing design-based research (DBR) methods through a cyclical process of designing, testing, evaluating, and reflecting (Scott et al., 2020) to develop educational tools for specific purposes has proven to be effective (May et al., 2023; Sondergeld & Johnson, 2019). Conducting such research can be expressed in four phases: Phase (1) Planning, literature review, expert discussions, and development of constructs and operational definitions; Phase (2) Developing, creating and revising survey based on field testing findings; Phase (3) Qualitative field testing, which involves expert feedback and typical participant interviews about survey items, scales, and directions; and Phase (4) Quantitative field testing, which involves psychometric and statistical evaluation of survey items and scales. It is important to note that there is no set number of iterations that this process should entail. Instead, the DBR educational survey development process is complete once the instrument requires no further modifications and sufficient validity evidence has been collected to consider the instrument suitable for use for its designated purpose with its desired population.
To address inherent concerns about social science instrumentation rigor, the Standards for Educational and Psychological Testing (Standards) were collaboratively developed by the American Educational Research Association (AERA), American Psychological Association (APA), and National Council on Measurement in Education (NCME) in 2014. The Standards discuss the need to collect, evaluate, and document multiple forms of validity evidence for the results and interpretations of quantitative instruments to be judged suitable for specified intents. Stronger inferences may be drawn regarding instrumentation soundness when more validity evidence is gathered (AERA et al., 2014). The Standards encourage developers of educational and psychological assessments to evaluate five validity evidence types: Content (item alignment with theory), Response Process (participant understanding of items as developers intended), Consequences of Testing (the potential negative impact on participants from completing the survey or bias), Internal Structure (unidimensional and reliable constructs formed), and Relationship to Other Variables (survey outcomes related to hypothesized variables).
As is common in initial instrument development and validation studies, we do not address relationships to other variables in this piece because the measures first need to be finalized before investigating this form of validity evidence. If relationships to other variables are evaluated for validity evidence, it is often in later outcome studies. Figure 1 details how we integrated the methodological frameworks of DBR and the Standards in our validation study of the S-STEM-OS. It is important to note that validity evidence is not necessarily collected in each phase, and some types of validity evidence are gathered and invested in multiple phases.

4. Methods

4.1. Instrumentation

This study included the development and validation of a survey (S-STEM-OS) for assessing students’ perceptions of the impact on affective outcomes of participation in NASA engagement programs. After a thorough review of the literature, four constructs (STEM identity, STEM self-efficacy, STEM interest, and 21st century skills) were identified to form a survey consisting of 36 items (9 items per construct) rated on a 5-point scale (Strongly Disagree, Disagree, Not Sure, Agree, Strongly Agree). Operational definitions of each construct are provided in Table 1. Survey refinement based on evidence from one round of qualitative field testing and two sets of quantitative field testing resulted in the final survey consisting of 23 items (STEM identity [5 items], STEM self-efficacy [6 items], STEM interest [5 items], and 21st century skills [7 items]) on a 4-point scale (Strongly Disagree, Disagree, Agree, Strongly Agree) after removing the “Not Sure” category.

4.2. Data Collection and Analysis

Procedures for data collection with aligned analyses are presented by validity evidence type within each of the DBR phases. This study was submitted by NASA and approved by the Office of Management and Budget (control number 2700-0159) through a methodological testing clearance. The NASA IRB determined this study was exempt. Furthermore, the study was classified as not human subjects research by the NASA Institutional Review Board (Study eIRB 00000482). A summary of instrumentation, samples, and analytic techniques is provided in Table 2 with a full description following.

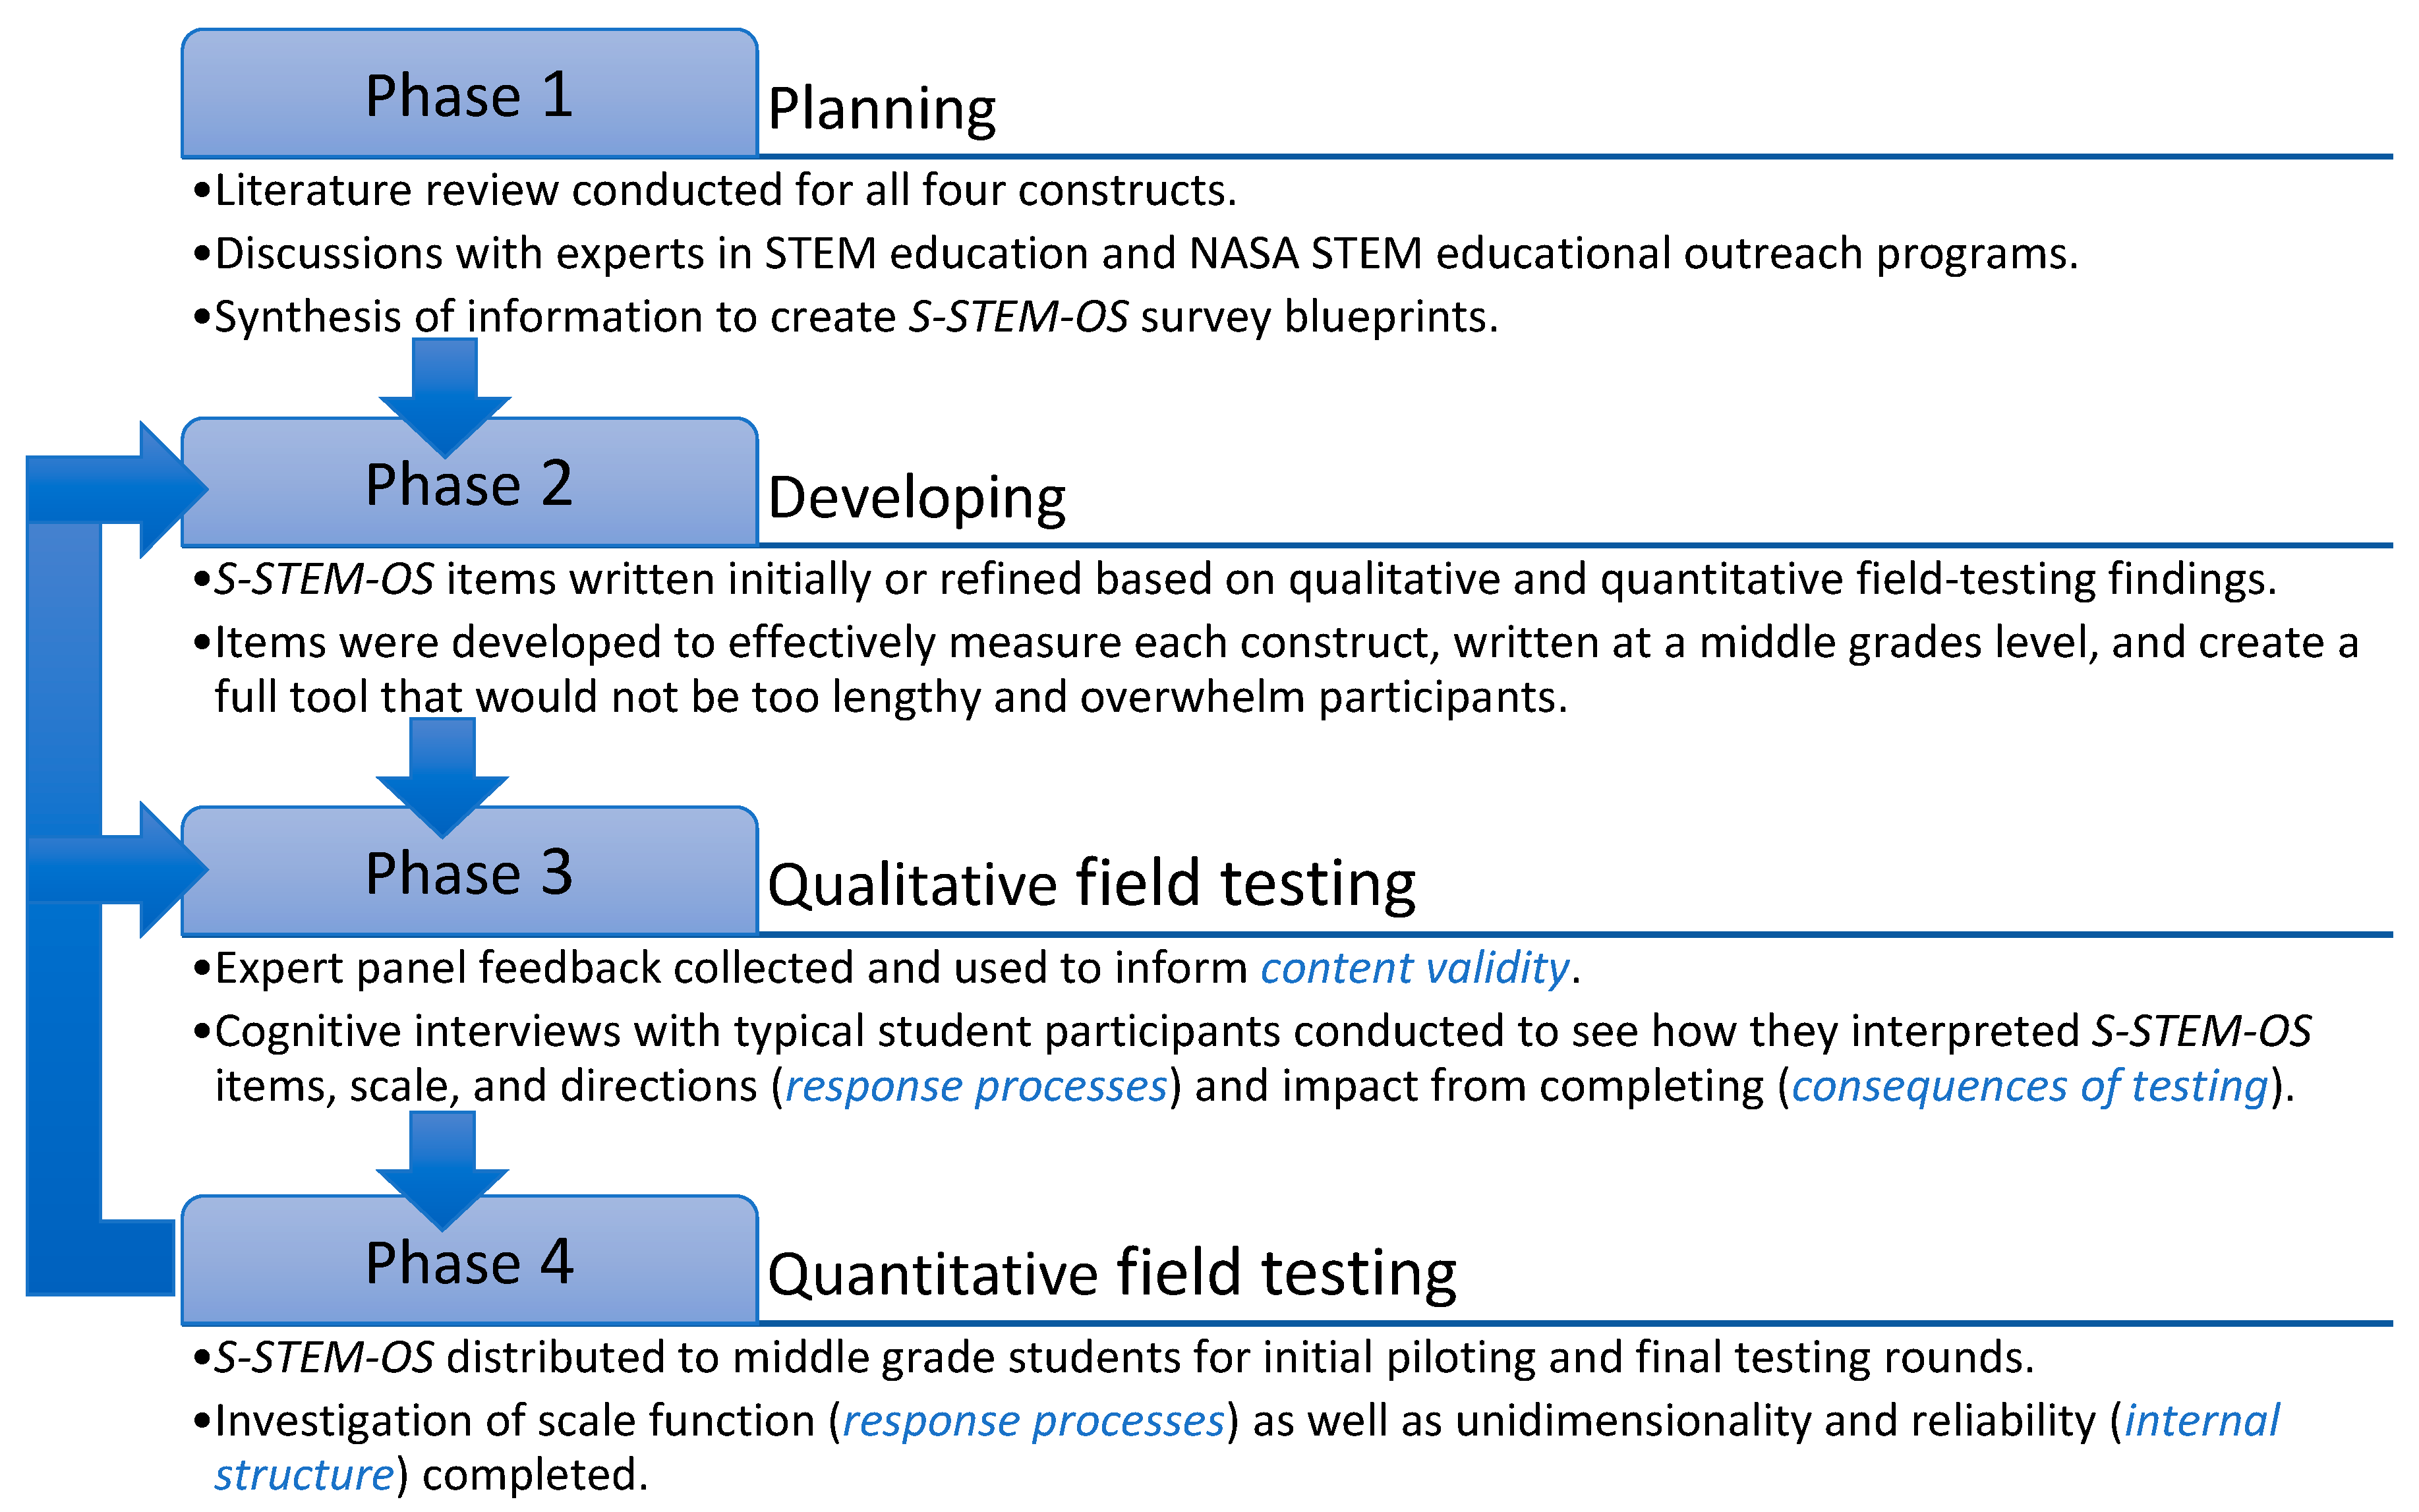
4.2.1. Phase 1: Planning for Survey Development

Planning consisted of a thorough literature review of K-12 student STEM identity, STEM self-efficacy, STEM interest, and 21st century skills. Discussions with numerous experts in the field of STEM education were conducted. Information was synthesized and used to inform the development of the S-STEM-OS in Phase 2.

4.2.2. Phase 2: Developing Survey Items

The goal in Phase 2 was to develop a survey with items at age-appropriate reading levels. To do this, a base set of items was generated. Items were tested for readability using a Flesch Kincaid Calculator (https://goodcalculators.com/flesch-kincaid-calculator/, accessed on 1 January 2020) that indicates (a) Reading Grade Level, (b) Reading Ease Score (0–100 with 0–30 = College graduate level and 90–100 = 5th-grade level), and (c) Reading Difficulty Description (ranging from Very Easy to Read to Very Difficult to Read). Each item was adjusted to maintain content meaning while achieving appropriate readability levels for students in grades 6–8.

4.2.3. Phase 3: Qualitative Field Testing

Various stakeholders (SMEs and middle grade students) provided feedback on the S-STEM-OS items, directions, and scale to inform three types of validity evidence in this phase: content, response processes, and consequences of testing.

Content Validity Evidence

A panel of four experts in relevant domains (STEM education and research) provided feedback on initial S-STEM-OS items. The expert panel members were tasked with reviewing items to (1) indicate item-to-survey construct alignment and (2) describe any specific issues they found with items based on their expert lens. To evaluate item-to-construct alignment, a tally of expert panel member agreement responses was completed first. Specific item feedback shared by expert panel members was analyzed through content analysis (Merriam, 2009). This inductive approach to data analysis involved reading feedback thoroughly, taking notes, and identifying themes that emerged through commonalities in text. After the initial reading, data were re-read, searching for themes across survey items. Then a master outline of themes was established. Item adjustments were made based on these findings, and content validity evidence was evaluated before collecting response processes validity evidence from students.

Response Processes Validity Evidence

Revised survey items were used in a series of cognitive interviews conducted with typical survey participants to determine the readability and clarity of the items. Seven students from two schools (one in Texas and one in Pennsylvania) participated in individual cognitive interviews conducted via Microsoft Teams. Cognitive interviews were conducted to ensure each survey question met its researcher-designed intended purpose (Willis & Artino, 2013). Interview participants were recruited by NASA OSTEM staff in collaboration with K-12 teachers and after-school program leaders. Each interview lasted approximately 20 min. Interviewers first oriented students to the cognitive interview process by explaining that they would be asked to read survey items about STEM aloud, select or provide answers, and explain their responses. Next, interviewers had students complete a sample think-aloud task. When students fully understood the process, they were asked to begin the think-aloud task with survey items. Interviewers also asked students whether they had trouble reading any words in the set or found any items difficult to understand.
Each interview was recorded and transcribed. Interviewers also took notes during interviews. After the interviews were completed, interviewers reviewed their notes and read the transcripts to identify items and/or words that students had difficulty reading or understanding, as well as items where students’ explanations of responses did not align with the construct and intent of the item. Memos about problematic items or wording were entered into a table. Researchers met to review memos and categorized possible issues. Responses from students underwent content analysis (Merriam, 2009) in tandem with the interviewer notes and the transcript, and reviewers reached a consensus on a course of action for each item. Possible item actions were as follows: (a) no revision, (b) revise wording, (c) revise response choices, (d) split into multiple items, (e) collapse multiple items into fewer items, or (f) eliminate the item. All students’ suggestions were considered when assessing for response processes validity evidence and making further item revisions before quantitative field testing. The validity evidence for response processes was also examined quantitatively, and these specific methods are described in the quantitative field testing section.

Consequences of Testing Validity Evidence

Following cognitive interviews, students were asked a series of three questions to inform consequences of testing validity evidence: (1) Did any item or part of the survey make you feel uncomfortable? (2) Did you feel like you wanted to stop at any point while completing the survey? (3) Did completing this survey make you feel differently or similarly to when completing other surveys you have taken in the past? Findings from these items were used to determine if any items or directions needed to be modified based on potential participants’ negative perceptions. Again, student responses were analyzed using content analysis (Merriam, 2009) to identify themes.

4.2.4. Phase 4: Quantitative Field Testing

Once item revisions were made based on qualitative field testing findings, a revised survey was piloted with middle school students for the Initial Pilot (n = 51) and Final field testing (n = 158). Quantitative field testing survey sample sizes met the minimum requirement of 30 participants for producing 95% confidence in measures within ±1 logit when employing the Rasch (1980) measurement model (Linacre, 1994). Student-level demographic data were not collected for either trial. Participants were registered in NASA summer programs for middle school students from across the U.S. Response processes and internal structure validity evidence were evaluated quantitatively using Rasch measurement. Specifically, the Rasch rating scale model (Andrich, 1978) for polychotomous responses with Winsteps (Linacre, 2022) was employed. Rasch measurement is known for its value in science education survey development, refinement, and validation studies (see Boone et al., 2010; Liu, 2010; Sondergeld & Johnson, 2014).

Response Processes Validity Evidence

Linacre (2002a) has provided guidelines for optimizing rating scales to help determine if survey participants are using each category as researchers intended. In this study, we focus on four key guidelines to evaluate response process validity evidence quantitatively.
  • A minimum of 10 observations per category for stable rating scale structure estimates.
  • Average category measures advance monotonically suggesting that students choosing higher rating scale categories possess higher amounts of the latent trait being studied.
  • An outfit mean-square (MNSQ) < 2.00 for rating scale categories signifies the level of randomness in data is not excessive, nor does it threaten the measurement system.
  • Appropriate advancements in step calibrations between categories imply that participants are using each rating scale category uniquely and that each category is needed. The criteria are as follows: steps advance by at least 1.00 logit for a 5-point scale or 1.40 logits for a 4-point scale, and by less than 5.00 logits regardless of scale.

Internal Structure Validity Evidence

While survey construct unidimensionality is required, its evaluation is neither an either-or decision nor is it based on specific criteria (Smith, 2002). Rather, survey construct dimensionality is judged with varying psychometric indices on a continuum of less to more unidimensional. In this study, four categories of Rasch psychometric indices were evaluated: item fit, item measure redundancy, measure consistency, and Rasch Principal Components Analysis (RPCA).
Rasch Item Fit Statistics. An item’s infit, outfit, and point-biserial indices provide information related to unexpected response patterns. Guidelines have been established by Linacre (2002b) for Rasch item fit statistics. Item infit and outfit MNSQ statistics between 0.50 and 1.50 logits are considered productive for measurement. Values below 0.50 or between 1.51 and 1.99 indicate items are less productive but not degrading to the measure. If an item MNSQ is greater than 2.00, the item is thought to distort the measurement system and should be reviewed for removal. Point-biserial correlations for each item should be positive to demonstrate they offer measurement support, while negative point-biserial correlations suggest an item should be removed because it contributes in opposition to a measure’s meaning (Wright, 1992).
Item Measure Redundancy. Survey fatigue can occur due to participant burden in terms of time and effort when completing a survey task (Sharp & Frankel, 1983). Longer surveys have been shown to result in lower response rates when compared to shorter surveys (Porter et al., 2004). Thus, survey item parsimony is desirable, and the use of Rasch item measures with their standard error (SEM) guided the process of removing unnecessary items. Items were deemed redundant if they had a statistically similar measure as another item (item means within ±2 SEM) and held comparable conceptual meaning to other items. If the removal of an item maintained or improved other psychometric indices, the item was removed from the survey to reduce participant burden while upholding internal structural integrity.
Measure Consistency. Item and person Rasch reliability and separation statistics were investigated. Rasch reliability evaluates internal consistency, and separation specifies the number of different item or person groups a measure can determine. Duncan et al. (2003) have provided guidelines related to Rasch reliability and separation. The criteria for Rasch reliability are as follows: excellent at 0.90, good at 0.80, acceptable at 0.70, and unacceptable at 0.69 and below. Meanwhile, Rasch separation of 3.00+ is excellent, 2.00–2.99 is good, 1.50–1.99 is acceptable, and below 1.50 is unacceptable.
Rasch Principal Components Analysis (RPCA). Information from RPCA indicates the extent to which data are explained by the construct and the degree to which the unexplained part of the data (residuals) is explained by random noise or another dimension (Linacre, 2022). The criteria for RPCA are not firm, as there are varying factors that must be considered and could impact the interpretation of findings. However, RPCA results above 50% are generally considered good (Linacre, 2022).

5. Results

5.1. Qualitative Field Testing

Findings from each type of validity evidence examined through qualitative methods are described in separate sections that follow.

5.1.1. Content Validity Evidence

SMEs reported all items (100%) aligned well with each construct. Specific item-level feedback resulted in modifications to 12 items to improve clarity. Modifications were made to two STEM interest items, one STEM self-efficacy item, three STEM identity items, and six 21st century skills items. For example, an original STEM interest item read: I am always thinking of STEM things to try out. Feedback offered from one SME about this item was: “STEM ‘things’ is acceptable for elementary but being more specific for older children is important. In addition, ‘always’ is hard for people to agree with.” The item was therefore revised to read: I often think of STEM activities to try out. Another example from the 21st century skills construct was the original item of: When something doesn’t go as planned, I can think of other ways to do it and I don’t get discouraged. SME feedback for this item was: “Streamline. Too many aspects being discussed in one item.” Thus, the item was revised to: When a STEM project or task does not go as planned, I can think of other ways to accomplish it. All SME feedback was taken into consideration and the revised survey items were used in subsequent qualitative field testing with students.

5.1.2. Response Processes Validity Evidence

Each of the seven middle school students (100%) participating in cognitive interviews responded that they were able to read all survey items easily, and none reported difficulties in understanding the words used. Three item-issue themes were identified from student responses: (a) wording clarity needed (2 items); (b) multiple components in item (1 item); and (c) confusion interferes with ability to answer (1 item). Resultantly, data-informed revisions were made to four survey items. An exemplar of each type of item issue and corresponding item revisions are summarized in Table 3. A revised survey was used for quantitative field testing.

5.1.3. Consequences of Testing Validity Evidence

None of the middle school students reported feeling uncomfortable with any part of the survey. Students’ responses to whether the survey made them feel the same or differently than when completing other surveys varied. Some students who responded that it made them feel differently noted that they enjoyed the survey more than previous surveys because they were “interested in the topic”. Or they reported feeling differently because they were “explaining [their] answers aloud” in contrast to other surveys where they had not explained their responses. As such, it was determined that completing this survey did not negatively impact middle school students, and no item or direction revisions were deemed necessary from these findings.

5.2. Quantitative Field Testing

To psychometrically evaluate response processes and internal structure validity evidence of the S-STEM-OS revised from qualitative field testing, multiple data-informed runs were conducted using a varying number of scale categories and items. Findings from the Initial Pilot (31 items, 5-point scale) and Final field testing (23 items, 5-point scale) psychometric runs are presented by survey construct and validity evidence type.

5.2.1. Response Processes Validity Evidence

While qualitative field testing results suggested middle school students understood and could use the original 5-point Likert-type scale categories in a unique manner, quantitative field testing findings differed. Table 4 shows that across STEM constructs, there was at least one rating scale guideline (Linacre, 2002a) not met when using the 5-point scale during Initial Piloting. Among other issues, one common finding for STEM identity, STEM interest, and 21st century skills on a 5-point scale during Initial Piloting was step calibrations between the “Disagree” and “Not Sure” categories were not large enough (at least 1 logit). This suggests students were actually using these two categories similarly. Based on this common occurrence on three of the four constructs, it was decided to collapse these categories and move forward in the Final field testing with a 4-point scale where “Not Sure” was removed. As depicted in Table 4, the Final field testing run produced results that met all rating scale guidelines being evaluated (Linacre, 2002a; 2002b), suggesting that this scale was effective across constructs for measuring middle school students’ perceptions. While there were fewer than 10 observations in the “Strongly Disagree” category during the Initial Pilot on three of the four constructs, the research team anticipated that this would be resolved with a reduced number of scale options and the addition of a larger sample size. This assumption was confirmed as the same issue was not present in the Final field testing data run.

5.2.2. Internal Structure Validity Evidence

Numerous psychometric indices were used to evaluate construct unidimensionality, reliability, and parsimony, which all contribute to internal structure validity evidence. Table 5 presents psychometric results by construct for Initial Pilot and Final field testing runs. Reliability and separation for items ranged from “Good” to “Excellent” (reliability range = 0.87 to 0.95; separation range = 2.54 to 4.44) across constructs in the Initial Pilot and further increased for all constructs in the Final field testing run classifying all as “Excellent” (reliability range = 0.96 to 0.99; separation range = 5.03 to 9.58). Similarly, person reliability and separation increased substantially from Initial Pilot ranges of “Poor” to “Acceptable” (reliability range = 0.59 to 0.78; separation range = 1.20 to 1.88), to all classified as “Good” (reliability range = 0.81 to 0.83; separation range = 2.09 to 2.21) during the Final field testing trial. RPCA findings showed dramatic improvements with each construct measuring more, and appropriate levels, of its latent trait in Final field testing (RPCA range = 50.8% to 64.5%) compared to the Initial Pilot run (RPCA range = 47.4% to 54.9%).
Regardless of the quantitative field testing run and construct, no items had a negative point-biserial, suggesting all items were working to measure their respective constructs. In the Initial Pilot, however, there were two items (one from STEM interest and one from STEM self-efficacy) with fit statistics that degraded their measures (MNSQ > 2.00). This information, along with item measures, standard deviations, and conceptual meaning, were considered together to inform choices about removing items from the Initial Pilot round. Table 6 details item reduction decisions. An example of how items were selected for potential removal from the STEM interest construct in the Initial Pilot is as follows: Item 9 (I have done a STEM camp, club, or competition) had an Infit and Outfit statistic over 2.00, which suggested it should be removed because students were struggling to interpret the item in the same manner. Multiple items had measure overlap. However, this alone did not mean items should be removed. Instead, when item measure redundancy was identified, the construct was investigated for items with similar content to determine if any items could be removed to make a more parsimonious construct and reduce participant burden while maintaining internal structure integrity. One example, again from the STEM interest construct, was Item 8 (I enjoy solving STEM problems), Item 2 (I enjoy figuring out how things work), and Item 5 (I enjoy the challenge of doing STEM activities), which were all statistically similar in terms of item measure and also considered conceptually comparable (intended to assess STEM problem-solving). Therefore, Items 2 and 5 were removed for the Final field testing trial in an effort to maintain the more general problem-solving item. In all instances where items were removed, internal structure psychometric indices were improved or maintained from Initial Pilot to Final field testing which suggests parsimonious constructs were more appropriate over longer forms.
Table 7 presents all Final field testing items by construct in order of difficulty measure (most challenging to endorse at the top and easiest to endorse at the bottom) with corresponding item statistics. While data sharing is not available for this study as it was conducted as part of the larger NASA program annual evaluation, and NASA does not allow for sharing individual participant data outside of the research team, Table 7 provides final validated survey items available for use by others.

6. Discussion

Currently, the tools that have been developed to measure K-12 students’ perceptions of their STEM affective and cognitive/skills areas are growing (e.g., Dou & Cian, 2022; Su et al., 2009). Most instruments, however, are designed to examine one area (e.g., STEM interest) and do not specifically target middle school students (e.g., Dou & Cian, 2022; McDonald et al., 2019; Milner et al., 2014; Nugent et al., 2010; van Aalderen-Smeets et al., 2018). Additionally, many of these tools are not readily accessible for use without an associated fee or cost (Nelson et al., 2019; Teasdale, 2022). It is vital for federal organizations and other community-based entities to have free access to high quality efficient tools for use in gathering important K-12 student data to determine evidence of program effectiveness and student affective outcomes (Allen & Peterman, 2019; National Research Council [NRC], 2010). NASA OSTEM found themselves in a predicament where a comprehensive set of tools for evaluating middle school students’ STEM self-perceptions in their specific programs were not available. Thus, the creation and rigorous validation of the S-STEM-OS, which includes sections for STEM interest, STEM self-efficacy, STEM identity, and 21st century skills, fills not only a practical gap for NASA OSTEM, but also a gap in the larger literature for researchers and those running other similar OST STEM programs. Further, providing multiple sources of robust validity evidence (content, response processes, consequences of testing, internal structure) through both quantitative and qualitative data sources advances the field of study (AERA et al., 2014; Krupa et al., 2019; Sondergeld, 2020) for NASA and those who may choose to use this free survey or any of its parsimonious sections.

6.1. Using the S-STEM-OS

Findings from this study support use of the S-STEM-OS with students in grades 6–8 across the United States. The final more streamlined and validated S-STEM-OS is comprised of 23 total items from four constructs (STEM identity = 5 items; STEM interest = 6 items; STEM self-efficacy = 5 items; 21st century skills = 7 items) rated on a 4-point agreement scale. Internal structure validity evidence supported four distinct unidimensional constructs for middle school student STEM affect as all items fit well, item and person reliability and separation were good/excellent, and RPCA results were strong for each independent scale. As such, computing total composite scores for each section of the S-STEM-OS is appropriate. However, computing a single summed score across constructs should not be performed as findings from this study do not support the combination of scales. Further, it would be acceptable to select and use any of the survey scales as needed for a study or program evaluation since they are not dependent on one another. Response processes validity evidence from Rasch rating scale analysis indicated a 4-point agreement scale was most suitable for middle school students because this rating scale met optimization guidelines (Linacre, 2002a). Therefore, future users of the full S-STEM-OS or individual survey sections should implement the 4-point scale, labeling scale points as “Strongly Disagree”, “Disagree”, “Agree”, and “Strongly Agree”. Item wording should remain consistent with what is detailed in Table 6 as content, response processes, and consequences of testing validity evidence provided by expert and middle school student feedback supported final word choice.

6.2. Limitations and Future Research

While this validation study of the S-STEM-OS demonstrated its effectiveness for filling multiple gaps in middle school students’ self-reported STEM affect in various domains, this study is not without limitations. Student-level demographic data were not available to evaluate an important type of validity evidence—relationship to other variables. To further investigate this form of validity evidence, a study of S-STEM-OS construct section results related to student demographics that have been shown to produce differential impact in STEM education, such as gender or race/ethnicity (Pearson et al., 2022; Stewart et al., 2020), should be examined.
Another key limitation to consider is generalizability. The S-STEM-OS was developed specifically for NASA program evaluation and was initially tested with participants from NASA STEM programs. While this restricted sample may impact the broader applicability of these survey scales in non-NASA STEM contexts, it is important to highlight that each scale was designed based on established educational research and literature rather than NASA-specific learning objectives. This indicates that the scales are likely suitable for use in other program evaluation and research settings focused on advancing middle school students’ STEM-related attitudes. However, further testing in non-NASA STEM educational environments is necessary to assess validity evidence in additional contexts.
Finally, the S-STEM-OS was administered at a single point in time for this validation study. In practice, it may be beneficial to distribute the survey using a traditional or retrospective pre-post approach to assess for changes in students’ STEM affect resulting from program participation. Therefore, the final S-STEM-OS should undergo test-retest reliability studies by administering it to the same students at multiple time points or as a retrospective pre-post survey to strengthen evidence for its use in evaluating program impact over time.

7. Conclusions

The present study demonstrated a robust and iterative process for examining multiple sources of validity evidence by thoughtfully integrating two rigorous methodological frameworks: DBR (Scott et al., 2020) and the Standards (AERA et al., 2014). Using both qualitative and quantitative data sources produced more holistic findings in this STEM educational survey validation study, which thereby allows for the S-STEM-OS to be viewed as scientifically developed by broader audiences (AERA et al., 2014; Sondergeld, 2020). It is important to note that educational instrument development and validation work requires the employment of teams with varying backgrounds (e.g., subject matter experts, psychometricians, qualitative researchers) collaborating over extended periods of time (Severino et al., 2018; Sondergeld, 2020)—approximately a year for the current study. And in doing so, the generation of STEM educational measures that produce meaningful results can be rendered.
Findings from high-quality measures, such as the S-STEM-OS, can serve as a strong foundation for shaping evidence-based STEM education policies and curriculum development. Further, states and other organizations may use these validated instruments as tools to engage in their own internal and also external evaluation. By leveraging results from validated affective constructs—STEM interest, identity, self-efficacy, and 21st century skills—policymakers can direct funding toward programs that effectively enhance student engagement and increase the likelihood of long-term STEM participation. Curriculum developers can use the S-STEM-OS to assess the impact of instructional materials and programming on the development of students’ STEM-related attitudes. Beyond measuring learning growth, evaluating how curricula influence interest, identity, and self-efficacy can inform strategic revisions and expansions, ensuring sustained student motivation and success in STEM fields.

Author Contributions

Conceptualization, T.A.M., C.C.J. and J.B.W.; methodology, T.A.M. and C.C.J., validation, T.A.M., and C.C.J.; formal analysis, T.A.M. and C.C.J., data curation, T.A.M.; writing—original draft preparation, T.A.M., C.C.J., S.H. and J.B.W.; writing—review and editing, T.A.M., C.C.J., S.H. and J.B.W.; supervision, T.A.M. and C.C.J. All authors have read and agreed to the published version of the manuscript.

Funding

This research received no external funding.

Institutional Review Board Statement

The study was conducted in accordance with the Declaration of Helsinki and reviewed by the NASA Institutional Review Board (IRB) with the disposition of as “not human subjects research” on 21 April 2022.

Data Availability Statement

Due to privacy and ethical restrictions, the raw data for this study are not available for distribution.

Acknowledgments

The authors would like to acknowledge the NASA Office of STEM Education (OSTEM) Performance Assessment and Evaluation for their collaboration on this research.

Conflicts of Interest

The authors declare no conflicts of interest.

References

  1. Ainley, M., Hidi, S., & Berndorff, D. (2002). Interest, learning, and the psychological processes that mediate their relationship. Journal of Educational Psychology, 94(3), 545. [Google Scholar] [CrossRef]
  2. Alfred, M. V., Ray, S. M., & Johnson, M. A. (2019). Advancing women of color in STEM: An imperative for U.S. global competitiveness. Advances in Developing Human Resources, 21(1), 114–132. [Google Scholar] [CrossRef]
  3. Allen, S., & Peterman, K. (2019). Evaluating informal STEM education: Issues and challenges in context. New Directions for Evaluation, 2019(161), 17–33. [Google Scholar] [CrossRef]
  4. American Educational Research Association (AERA), American Psychological Association (APA) & National Council on Measurement in Education (NCME). (2014). Standards for educational and psychological testing. American Educational Research Association. [Google Scholar]
  5. American Museum of Natural History. (n.d.). Learn and teach. Available online: https://www.amnh.org/learn-teach (accessed on 22 October 2023).
  6. Andrich, D. (1978). A rating formulation for ordered response categories. Psychometrika, 43, 561–573. [Google Scholar] [CrossRef]
  7. Archer, L., DeWitt, J., Osborne, J., Dillon, J., Willis, B., & Wong, B. (2010). “Doing” science versus “being” a scientist: Examining 10/11-year-old schoolchildren’s constructions of science through the lens of identity. Science Education, 94(4), 617–639. [Google Scholar] [CrossRef]
  8. Archer, L., DeWitt, J., Osborne, J., Dillon, J., Willis, B., & Wong, B. (2013). ‘Not girly, not sexy, not glamorous’: Primary school girls’ and parents’ constructions of science aspirations. Pedagogy, Culture & Society, 21(1), 171–194. [Google Scholar] [CrossRef]
  9. Bandura, A. (1977). Self-efficacy: Toward a unifying theory of behavioral change. Psychological Review, 84(2), 191–215. [Google Scholar] [CrossRef]
  10. Bandura, A., & Locke, E. A. (2003). Negative self-efficacy and goal effects revisited. Journal of Applied Psychology, 88(1), 87–99. [Google Scholar] [CrossRef]
  11. Barron, B. (2006). Interest and self-sustained learning as catalysts of development: A learning ecology perspective. Human Development, 49(4), 193–224. [Google Scholar] [CrossRef]
  12. Battelle for Kids. (2019). Battelle for Kids Framework for 21st century learning. Available online: https://www.battelleforkids.org/networks/p21/frameworks-resources (accessed on 22 October 2023).
  13. Blackmore, C., Vitali, J., Ainscough, L., Langfield, T., & Colthorpe, K. (2021). A review of self-regulated learning and self-efficacy: The key to tertiary transition in science, technology, engineering and mathematics (STEM). International Journal of Higher Education, 10(3), 169. [Google Scholar] [CrossRef]
  14. Blotnicky, K. A., Franz-Odendaal, T., French, F., & Joy, P. (2018). A study of the correlation between STEM career knowledge, mathematics self-efficacy, career interests, and career activities on the likelihood of pursuing a STEM career among middle school students. International Journal of STEM Education, 5(1), 22. [Google Scholar] [CrossRef] [PubMed]
  15. Boone, W. J., Townsend, J. S., & Staver, J. (2010). Using Rasch theory to guide the practice of survey development and survey data analysis in science education and to inform science reform efforts: An exemplar utilizing STEBI self-efficacy data. Science Education, 95(2), 258–280. [Google Scholar] [CrossRef]
  16. Boss, S. (2019). It’s 2019. So why do 21st-century skills still matter? Ed Surge. Available online: https://www.edsurge.com/news/2019-01-22-its-2019-so-why-do-21st-century-skills-still-matter (accessed on 22 October 2023).
  17. Boy Scouts of America. (n.d.). STEM merit badges. Available online: https://www.scouting.org/merit-badge-tips-guide/stem-merit-badges/ (accessed on 22 October 2023).
  18. Boyacı, Ş. D. B., & Atalay, N. (2016). A scale development for 21st century skills of primary school students: A validity and reliability study. International Journal of Instruction, 9(1), 133–148. [Google Scholar] [CrossRef]
  19. Carlone, H. B., & Johnson, A. (2007). Understanding the science experiences of successful women of color: Science identity as an analytic lens. Journal of Research in Science Teaching, 44(8), 1187–1218. [Google Scholar] [CrossRef]
  20. Carlone, H. B., Scott, C. M., & Lowder, C. (2014). Becoming (less) scientific: A longitudinal study of students’ identity work from elementary to middle school science: Becoming (less) scientific. Journal of Research in Science Teaching, 51(7), 836–869. [Google Scholar] [CrossRef]
  21. Dou, R., & Cian, H. (2022). Constructing STEM identity: An expanded structural model for STEM identity research. Journal of Research in Science Teaching, 59(3), 458–490. [Google Scholar] [CrossRef]
  22. Dou, R., Hazari, Z., Dabney, K., Sonnert, G., & Sadler, P. (2019). Early informal STEM experiences and STEM identity: The importance of talking science. Science Education, 103, 623–637. [Google Scholar] [CrossRef]
  23. Duncan, P. W., Bode, R. K., Lai, S. M., & Perera, S. (2003). Rasch analysis of a new stroke-specific outcome scale: The stroke impact scale. Archives in Physical Medicine Rehab, 84, 950–963. [Google Scholar] [CrossRef]
  24. Godwin, A., Cribbs, J., & Kayumova, S. (2020). Perspectives of identity as an analytic framework in STEM education. In C. C. Johnson, M. Mohr-Schroeder, T. Moore, & L. English (Eds.), Handbook of research on STEM education (pp. 267–277). Routledge. [Google Scholar]
  25. Grimmon, A. S., Cramer, J., Yazilitas, D., Smeets, I., & De Bruyckere, P. (2020). Interest in STEM among children with a low socio-economic status: Further support for the STEM-CIS-instrument through the adapted Dutch STEM-LIT measuring instrument. Cogent Education, 7(1), 1745541. [Google Scholar] [CrossRef]
  26. Habig, B., & Gupta, P. (2021). Authentic STEM research, practices of science, and interest development in an informal science education program. International Journal of STEM Education, 8(1), 1–18. [Google Scholar] [CrossRef]
  27. Han, J., Kelley, T., & Knowles, J. G. (2021). Factors influencing student STEM learning: Self-efficacy and outcome expectancy, 21st century skills, and career awareness. Journal for STEM Education Research, 4(2), 117–137. [Google Scholar] [CrossRef]
  28. Hava, K., & Koyunlu Ünlü, Z. (2021). Investigation of the relationship between middle school sudents’ computational thinking skills and their STEM career interest and attitudes toward inquiry. Journal of Science Education and Technology, 30(4), 484–495. [Google Scholar] [CrossRef]
  29. Kang, H., Calabrese Barton, A., Tan, E., Simpkins, S., Rhee, H., & Turner, C. (2019). How do middle school girls of color develop STEM identities? Middle school girls’ participation in science activities and identification with STEM careers. Science Education, 103(2), 418–439. [Google Scholar] [CrossRef]
  30. Kelley, T., Knowles, J. G., Han, J., & Sung, E. (2019). Creating a 21st century skills survey instrument for high school students. American Journal of Educational Research, 7(8), 583–590. [Google Scholar] [CrossRef]
  31. Kim, A. Y., Sinatra, G. M., & Seyranian, V. (2018). Developing a STEM identity among young women: A social identity perspective. Review of Educational Research, 88(4), 589–625. [Google Scholar] [CrossRef]
  32. Komarraju, M., & Nadler, D. (2013). Self-efficacy and academic achievement: Why do implicit beliefs, goals, and effort regulation matter? Learning and Individual Differences, 25, 67–72. [Google Scholar] [CrossRef]
  33. Köller, O., Baumert, J., & Schnabel, K. (2001). Does interest matter? The relationship between academic interest and achievement in mathematics. Journal for Research in Mathematics Education, 32(5), 448–470. [Google Scholar] [CrossRef]
  34. Krapp, A., & Lewalter, D. (2001). Development of interests and interest-based motivational orientations: A longitudinal study in school and work settings. In S. Volet, & S. Järvelä (Eds.), Motivation in learning contexts: Theoretical advances and methodological implications (pp. 201–232). Elsevier. [Google Scholar]
  35. Krishnamurthi, A., Bevan, B., Rinehart, J., & Coulon, V. R. (2013). What afterschool STEM does best. Afterschool Matters, 18, 42–49. Available online: https://files.eric.ed.gov/fulltext/EJ1016823.pdf (accessed on 22 October 2023).
  36. Krupa, E. E., Bostic, J. D., & Shih, J. C. (2019). Validation in mathematics education: An introduction to quantitative measures of mathematical knowledge: Researching instruments and perspectives. In J. Bostic, E. Krupa, & J. Shih (Eds.), Quantitative measures of mathematical knowledge. Routledge. [Google Scholar]
  37. Lavi, R., Tal, M., & Dori, Y. D. (2021). Perceptions of STEM alumni and students on developing 21st century skills through methods of teaching and learning. Studies of Educational Evaluation, 70, 101002. [Google Scholar] [CrossRef]
  38. Linacre, J. M. (1994). Sample size and item calibration stability. Rasch Measurement Transactions, 7(4), 328. [Google Scholar]
  39. Linacre, J. M. (2002a). Optimizing rating scale category effectiveness. Journal of Applied Measurement, 3(1), 85–106. [Google Scholar] [PubMed]
  40. Linacre, J. M. (2002b). What do infit and outfit, mean-square and standardized mean? Rasch Measurement Transactions, 16(2), 878. [Google Scholar]
  41. Linacre, J. M. (2022). Dimensionality: PCAR contrasts and variances. Available online: https://www.winsteps.com/winman/principalcomponents.htm (accessed on 22 October 2023).
  42. Liu, X. (2010). Using and developing measurement instruments in science education: A Rasch modeling approach. Information Age. [Google Scholar]
  43. Luo, T., So, W. W. M., Wan, Z. H., & Li, W. C. (2021). STEM stereotypes predict students’ STEM career interest via self-efficacy and outcome expectations. International Journal of STEM Education, 8(1), 36. [Google Scholar] [CrossRef]
  44. Maiorca, C., Roberts, T., Jackson, C., Bush, S., Delaney, A., Mohr-Schroeder, M. J., & Soledad, S. Y. (2021). Informal learning environments and impact on interest in STEM careers. International Journal of Science and Mathematics Education, 19(1), 45–64. [Google Scholar] [CrossRef]
  45. Master, A., Cheryan, S., & Meltzoff, A. N. (2017). Social group membership increases STEM engagement among preschoolers. Developmental Psychology, 53(2), 201. [Google Scholar] [CrossRef]
  46. May, T. A., Bright, D., Fan, Y., Fornaro, C., Koskey, K. L., & Heverin, T. (2023). Development of a college student validation survey: A design-based research approach. Journal of College Student Development, 64(3), 370–377. [Google Scholar] [CrossRef]
  47. McCombs, J., Whitaker, A., & Yoon, P. (2017). The value of out-of-school time programs. Rand Corporation report PE-267-WF. Rand Corporation. [Google Scholar] [CrossRef]
  48. McDonald, M. M., Zeigler-Hill, V., Vrabel, J. K., & Escobar, M. (2019). A single-item measure for assessing STEM identity. Frontiers in Education, 4, 78. [Google Scholar] [CrossRef]
  49. Merriam, S. B. (2009). Qualitative research: A guide to design and implementation. Jossey-Bass. [Google Scholar]
  50. Milner, D. I., Horan, J. J., & Tracey, T. J. (2014). Development and evaluation of STEM interest and self-efficacy tests. Journal of Career Assessment, 22(4), 642–653. [Google Scholar] [CrossRef]
  51. Mitsopoulou, A. G., & Pavlatou, E. A. (2021). Factors associated with the eevelopment of secondary school students’ interest towards STEM studies. Education Sciences, 11(11), 746. [Google Scholar] [CrossRef]
  52. NASA. (2020). NASA strategy for STEM engagement. Available online: https://www.nasa.gov/sites/default/files/atoms/files/nasa-strategy-for-stem-2020-23-508.pdf (accessed on 22 October 2023).
  53. National Academies of Sciences, National Academy of Engineering, and Medicine [NASEM]. (2007). Rising above the gathering storm: Energizing and employing America for a brighter economic future. The National Academies Press. [Google Scholar]
  54. National Academies of Sciences, National Academy of Engineering, and Medicine [NASEM]. (2021). Call to action for science education: Building opportunity for the future. The National Academies Press. [Google Scholar]
  55. National Assessment for Educational Progress [NAEP]. (2013). Trends in academic progress: Reading 1971–2012, mathematics 1973–2012. Available online: https://nces.ed.gov/nationsreportcard/subject/publications/main2012/pdf/2013456.pdf (accessed on 22 October 2023).
  56. National Assessment for Educational Progress [NAEP]. (2015). 2015 mathematics & reading assessments; The Nation’s Report Card. Available online: https://www.nationsreportcard.gov/reading_math_2015/#?grade=4 (accessed on 22 October 2023).
  57. National Assessment for Educational Progress [NAEP]. (2020). NAEP long-term trend assessment results: Reading and mathematics; The Nation’s Report Card. Available online: https://www.nationsreportcard.gov/ltt/?age=9 (accessed on 22 October 2023).
  58. National Assessment for Educational Progress [NAEP]. (2023). NAEP long-term trend assessment results: Reading and mathematics; The Nation’s Report Card. Available online: https://www.nationsreportcard.gov/highlights/ltt/2023/ (accessed on 22 October 2023).
  59. National Center for Education Statistics [NCES]. (2019). 2019 NAEP mathematics and reading assessments: Highlighted results at grades 4 and 8 for the nation, states, and districts. Available online: https://nces.ed.gov/pubsearch/pubsinfo.asp?pubid=2020012 (accessed on 22 October 2023).
  60. National Research Council (NRC). (2010). Assessing 21st century skills. (D. H. Hill Jr. Library). National Academies Press. Available online: https://catalog.lib.ncsu.edu/catalog/NCSU2499658 (accessed on 22 October 2023).
  61. National Research Council (NRC). (2015). Identifying and supporting productive STEM programs in out-of-school settings. The National Academies Press. [Google Scholar] [CrossRef]
  62. National Science and Technology Council Committee on STEM Education [NSTC]. (2018). Charting a course for success: America’s strategy for STEM education; National Science and Technology Council. Available online: https://trumpwhitehouse.archives.gov/wp-content/uploads/2018/12/STEM-Education-Strategic-Plan-2018.pdf (accessed on 22 October 2023).
  63. National Science Foundation. (2022). The state of US science and engineering 2022. Available online: https://ncses.nsf.gov/pubs/nsb20221/u-s-and-global-stem-education-and-labor-force (accessed on 22 October 2023).
  64. Nelson, A. G., Goeke, M., Auster, R., Peterman, K., & Lussenhop, A. (2019). Shared Measures for evaluating common outcomes of informal STEM education experiences. New Directions for Evaluation, 161, 59–86. [Google Scholar] [CrossRef]
  65. Nugent, G., Barker, B., Grandgenett, N., & Adamchuk, V. I. (2010). Impact of robotics and geospatial technology interventions on youth STEM learning and attitudes. Journal of Research on Technology in Education, 42(4), 391–408. [Google Scholar] [CrossRef]
  66. Ok, G., & Kaya, D. (2021). The relationship between middle school students’ levels of 21st century learning skills and their interest in STEM career. Acta Didactica Napocensia, 14(2), 333–345. [Google Scholar] [CrossRef]
  67. Paul, K. M., Maltese, A. V., & Svetina Valdivia, D. (2020). Development and validation of the role identity surveys in engineering (RIS-E) and STEM (RIS-STEM) for elementary students. International Journal of STEM Education, 7, 1–17. [Google Scholar] [CrossRef]
  68. Pearson, J., Giacumo, L. A., Farid, A., & Sadegh, M. (2022). A systematic multiple studies review of low-income, first-generation, and underrepresented, STEM-degree support programs: Emerging evidence-based models and recommendations. Education Sciences, 12(5), 333. [Google Scholar] [CrossRef]
  69. Porter, S. R., Whitcomb, M. E., & Weitzer, W. H. (2004). Multiple surveys of students and survey fatigue. New Directions for Institutional Research, 121, 63–73. [Google Scholar] [CrossRef]
  70. Pressick-Kilborn, K., & Walker, R. (2002). The social construction of interest in a learning community. Research on Sociocultural Influences on Motivation and Learning, 2, 153–182. [Google Scholar]
  71. Rasch, G. (1980). Probabilistic models for some intelligence and attainment tests. (Copenhagen, Danish Institute for Educational Research), with foreward and afterword by B.D. Wright. The University of Chicago Press. [Google Scholar]
  72. Renninger, K. A., Ewen, L., & Lasher, A. K. (2002). Individual interest as context in expository text and mathematical word problems. Learning and Instruction, 12(4), 467–490. [Google Scholar] [CrossRef]
  73. Robinson, K. A., Lee, Y.-K., Bovee, E. A., Perez, T., Walton, S. P., Briedis, D., & Linnenbrink-Garcia, L. (2019). Motivation in transition: Development and roles of expectancy, task values, and costs in early college engineering. Journal of Educational Psychology, 111(6), 1081–1102. [Google Scholar] [CrossRef]
  74. Sakellariou, C., & Fang, Z. (2021). Self-efficacy and interest in STEM subjects as predictors of the STEM gender gap in the US: The role of unobserved heterogeneity. International Journal of Educational Research, 109, 101821. [Google Scholar] [CrossRef]
  75. Science Club for Girls. (2022). Transforming the face of STEM. Available online: https://www.scienceclubforgirls.org/ (accessed on 22 October 2023).
  76. Scott, E. E., Wenderoth, M. P., & Doherty, J. H. (2020). Design-based research: A methodology to extend and enrich biology education research. Life Sciences Education, 19(3), 1–12. [Google Scholar] [CrossRef]
  77. SETI Institute. (2023). Education and outreach. Available online: https://www.seti.org/seti-educators (accessed on 22 October 2023).
  78. Severino, L., DeCarlo, M. J., Sondergeld, T. A., Ammar, A., & Izzetoglu, M. (2018). A validation study of an eighth grade reading comprehension assessment. Research in Middle Level Education, 41(10), 1–16. [Google Scholar]
  79. Sharp, L. M., & Frankel, J. (1983). Respondent burden: A test of some common assumptions. Public Opinion Quarterly, 47(1), 36–53. [Google Scholar] [CrossRef]
  80. Singer, A., Montgomery, G., & Schmoll, S. (2020). How to foster the formation of STEM identity: Studying diversity in an authentic learning environment. International Journal of STEM Education, 7(1), 1–12. [Google Scholar] [CrossRef]
  81. Smith, E. V. (2002). Understanding Rasch measurement: Detecting and evaluating the impact of multidimensionality using item fit statistics and principal components analysis of residuals. Journal of Applied Measurement, 3, 205–231. [Google Scholar]
  82. Smithsonian Science Education Center. (2023). Transforming K-12 education through science in collaboration with communities across the globe. Available online: https://ssec.si.edu/ (accessed on 22 October 2023).
  83. Society for Science. (2023). Creating access and opportunities for students and teachers. Available online: https://www.societyforscience.org/ (accessed on 22 October 2023).
  84. Sondergeld, T. A. (2020). Shifting sights on STEM education instrumentation development: The importance of moving validity evidence to the forefront rather than a footnote. School Science and Mathematics Journal, 120(5), 259–261. [Google Scholar] [CrossRef]
  85. Sondergeld, T. A., & Johnson, C. C. (2014). Using Rasch measurement for the development and use of affective assessments in science education research. Science Education, 98(4), 581–613. [Google Scholar] [CrossRef]
  86. Sondergeld, T. A., & Johnson, C. C. (2019). Development and validation of a 21st Century Skills assessment: Using an iterative multi-method approach. School Science and Mathematics Journal, 119(6), 312–326. [Google Scholar] [CrossRef]
  87. Staus, N. L., Lesseig, K., Lamb, R., Falk, J., & Dierking, L. (2020). Validation of a measure of STEM interest for adolescents. International Journal of Science and Mathematics Education, 18(2), 279–293. [Google Scholar] [CrossRef]
  88. Stewart, J., Henderson, R., Michaluk, L., Deshler, J., Fuller, E., & Rambo-Hernandez, K. (2020). Using the social cognitive theory framework to chart gender differences in the developmental trajectory of STEM self-efficacy in science and engineering students. Journal of Science Education and Technology, 29(6), 758–773. [Google Scholar] [CrossRef]
  89. Su, R., Rounds, J., & Armstrong, P. I. (2009). Men and things, women and people: A meta-analysis of sex differences in interests. Psychological Bulletin, 135(6), 859–884. [Google Scholar] [CrossRef]
  90. Teasdale, R. M. (2022). How do you define success? Evaluative criteria for informal STEM education. Visitor Studies, 25(2), 163–184. [Google Scholar] [CrossRef]
  91. van Aalderen-Smeets, S. I., Walma van der Molen, J. H., & Xenidou-Dervou, I. (2018). Implicit STEM ability beliefs predict secondary school students’ STEM self-efficacy beliefs and their intention to opt for a STEM field career. Journal of Research in Science Teaching, 56(4), 465–485. [Google Scholar] [CrossRef]
  92. van Laar, E., van Deursen, A. J. A. M., van Dijk, J. A. G. M., & de Haan, J. (2017). The relation between 21st Century skills and digital skills: A systematic literature review. Computers in Human Behavior, 72, 577–588. [Google Scholar] [CrossRef]
  93. Voot, J., Erstad, O., Dede, C., & Mishra, P. (2013). Challenges to learning and schooling in the digital networked world of the 21st Century. Journal of Computer Assisted Learning, 29, 403–413. [Google Scholar] [CrossRef]
  94. Wang, X. (2013). Why students choose STEM majors: Motivation, high school learning, and postsecondary context of support. American Educational Research Journal, 50(5), 1081–1121. [Google Scholar] [CrossRef]
  95. Willis, G. B., & Artino, A. R., Jr. (2013). What do our respondents think we’re asking? Using cognitive interviewing to improve medical education surveys. Journal of Graduate Medical Education, 5(3), 353–356. [Google Scholar] [CrossRef]
  96. Wright, B. D. (1992). Point-biserial correlations and item fits. Rasch Measurement Transactions, 5(4), 174. [Google Scholar]
  97. Wu, F., Fan, W., Arbona, C., & de la Rosa-Pohl, D. (2020). Self-efficacy and subjective task values in relation to choice, effort, persistence, and continuation in engineering: An expectancy-value theory perspective. European Journal of Engineering Education, 45(1), 151–163. [Google Scholar] [CrossRef]
Figure 1. Integrating DBR and the Standards in a Cyclical Process for S-STEM-OS Development and Validation.
Education 15 00377 g001
Table 1. STEM Survey Constructs with Operational Definitions.
ConstructOperational Definition
STEM IdentityAn individual’s perception of themselves as a STEM-capable person and their perception of their potential in STEM educational pursuits and STEM careers (Godwin et al., 2020). In other words, how individuals “see” themselves (or not) as a person in STEM.
STEM Self-EfficacyAn individual’s belief in their own capabilities to achieve certain outcomes (Bandura, 1977) and when considering STEM self-efficacy specifically, a relationship exists between the level of self-efficacy and an individual’s motivation to learn (Luo et al., 2021, likelihood to choose a STEM major in college (e.g., Wang, 2013), and decision to choose a STEM career path (e.g., Blotnicky et al., 2018). In other words, self-efficacy is related to the confidence a person has in their ability to do STEM.
STEM InterestA person’s interest in STEM discipline(s) overall is key to their motivation to learn, as well as a predictor of the likelihood of individuals pursuing STEM careers (e.g., Blotnicky et al., 2018). Key components of STEM interest include not only the “spark” but also the process of sustained engagement with STEM over time.
21st Century SkillsEssential skills for engaging in STEM learning and careers. Examples of these skills include collaboration, creativity, problem-solving, critical thinking, communication, technological literacy, innovation, leadership, productivity, adaptability, and accountability.
Table 2. DBR Phases Aligned with Validity Evidence and Data Collection Methods.
Phase
 Validity EvidenceInstrumentationSampleAnalysis
Phase 1: Planning
 No Validity EvidenceNANANA
Phase 2: Developing
 No Validity EvidenceNANANA
Phase 3: Qualitative Field Testing
 Content—Do survey items align with the construct (theoretical trait)?Expert Panel Review Open-Ended Survey4 ExpertsContent Analysis
 Response Processes—Do participants interpret the survey as intended?Cognitive Interview Protocols7 Middle School StudentsContent Analysis
 Consequences of Testing—How are participants impacted by completing the survey?
Phase 4: Quantitative Field Testing
 Response Processes—Do participants interpret the survey as intended?S-STEM-OS51 Initial Pilot158 Final TestingRasch Polytomous Rating Scale Analysis
 Internal Structure—Are measures unidimensional? Do the measures produce replicable outcomes?S-STEM-OS51 Initial Pilot158 Final TestingRasch Psychometric Analysis
Table 3. Exemplar Item Issue Themes with Sample Original Items, Student Feedback, and Revised Items.
Type of IssueConstructOriginal Item Summary of Student Feedback and Researcher ActionsRevised Item(s)
Wording Clarity NeededSTEM Self-EfficacyI am confident to try out new ideas on my own in STEM.Students struggled with independence in this item. The notion of doing STEM alone was confusing as they suggested most STEM activities were led or supervised by a teacher or other adult. The item was revised.I am confident about trying out new STEM ideas.
Multiple Components in ItemSTEM InterestI like to read or watch videos about STEM when I am not in school.Students noted a distinct difference between reading and watching STEM content. Thus, this double-barreled item was broken into two distinct items.I like to read about STEM when I am not in school.
I like to watch videos about STEM when I am not in school.
Confusion Interferes with Ability to AnswerSTEM IdentityOther students in my class think I do well in STEM.Students were adamant that they did not know what other students thought about them in terms of their STEM abilities. As such, this item was removed.NA—Item Eliminated
Table 4. Rating Scale Guideline Results by Construct and Quantitative Field Testing Time.
ConstructRun (# Items)
 Scale Used
Rating Scale Guidelines
10+ Observations per CategoryMeasures AdvanceOutfit MNSQ < 2.0Step Calibrations Acceptable
STEM IdentityInitial Pilot (5 items)
 5-point (SD, D, N, A, SA)
No
(SD = 9)
MetMetNo (D→N = 0.17)
Final Field Testing (5 items)
 4-point (SD, D, A, SA)
MetMetMetMet
STEM Self-EfficacyInitial Pilot (8 items)
 5-point (SD, D, N, A, SA)
No
(SD = 7)
MetMetMet
Final Field Testing (5 items)
 4-point (SD, D, A, SA)
MetMetMetMet
STEM InterestInitial Pilot (10 items)
 5-point (SD, D, N, A, SA)
MetMetMetNo
(D→N = 0.86)
(N→A = 0.39)
(A→SA = 0.56)
Final Field Testing (6 items)
 4-point (SD, D, A, SA)
MetMetMetMet
21st Century SkillsInitial Pilot (8 items)
 5-point (SD, D, N, A, SA)
No
(SD = 7)
MetMetNo
 (D→N = 0.86)
Final Field Testing (7 items)
 4-point (SD, D, A, SA)
MetMetMetMet
Table 5. Summary of Quantitative Field Testing Psychometric Findings by S-STEM-OS Construct.
S-STEM-OS Construct
Psychometric Indices (Guidelines)STEM IdentitySTEM InterestSTEM Self-Efficacy21st Century Skills
Reliability (<0.70 = Poor; 0.70 = Acceptable; 0.80 = Good; 0.90 = Excellent)
  Person
   Initial Pilot0.590.780.750.76
   Final Field Testing0.820.830.810.82
  Item
   Initial Pilot0.950.920.950.87
   Final Field Testing0.990.990.990.96
Separation (<1.50 = Poor; 1.50 = Acceptable; 2.00 = Good; 3.00 = Excellent)
  Person
   Initial Pilot1.201.881.741.77
   Final Field Testing2.122.212.092.15
  Item
   Initial Pilot4.443.404.212.54
   Final Field Testing9.549.239.585.03
Item Point-Biserial (Negative value = Unacceptable; Positive value = Acceptable)
   Initial PilotAll PositiveAll PositiveAll PositiveAll Positive
   Final Field TestingAll PositiveAll PositiveAll PositiveAll Positive
Item Fit (MNSQ >2.00 = Degrades measure; <0.50 or >1.50 = Less productive, not degrading; 0.50 to 1.50 = Productive for measure)
   Initial PilotAll ProductiveItem 9 (Infit = 2.56, Outfit = 2.13)Item 4 (Outfit = 2.22)All Productive
   Final Field TestingAll ProductiveItem 2 (Infit = 1.51)All ProductiveAll Productive
Unidimensionality (RPCA <50% = Examine further; ≥50% = Good)
   Initial Pilot54.9%52.0%53.9%47.4%
   Final Field Testing61.4%62.5%64.5%50.8%
Table 6. Quantitative Field Testing: Initial Pilot Item Measures and Standard Error by Construct with Item Removal Decisions Described.
Construct
  Item Number and Stem
Measure in Logits (SE)Measure OverlapKeep/Remove DecisionItem Removal Explanations
STEM Identity (5 items)
 4. I see myself working in a STEM job someday. 1.35 (0.16) KeepWhile some items overlapped in measure, all items were deemed different enough in conceptual meaning to maintain all in this construct.
 3. My friends think I do well in STEM. 0.36 (0.17) Keep
 5. I think I will do well in high school STEM classes. 0.23 (0.18) Keep
 2. My teachers think I do well in STEM. −0.38 (0.21) Keep
 1. My parents think I do well in STEM. −1.56 (0.30) Keep
STEM Interest (10 items)
 4. I like to watch videos about STEM when I am not in school. 0.88 (0.12) KeepItem 9 was removed due to misfit and student confusion reported in cognitive interviews. Items 3 and 4 focused on engagement with STEM media and were statistically similar in measure. Thus, item 3 was removed because more students from the cognitive interviews suggested “reading” about STEM outside of school seemed abnormal to them. Three items related to “STEM problem-solving” were statistically similar in measure (2, 5, 8). Only the more general item (8) was maintained for a more parsimonious construct.
 3. I like to read about STEM when I am not in school. 0.70 (0.12) Remove
 7. I discuss STEM with friends and/or family. 0.51 (0.13) Keep
 10. I often think of STEM activities to try out. 0.41 (0.13) Keep
 9. I have done a STEM camp, club, or competition. 0.00 (0.14) Remove
 8. I enjoy solving STEM problems. −0.23 (0.16) Keep
 6. I want to increase my STEM knowledge as much as possible. −0.39 (0.17) Keep
 2. I enjoy figuring out how things work. −0.45 (0.17) Remove
 5. I enjoy the challenge of doing STEM activities.−0.61 (0.19) Remove
 1. I enjoy learning about STEM.−0.81 (0.21) Keep
STEM Self-Efficacy (8 items)
 5. Other students ask me for help with STEM activities. 2.22 (0.21) KeepItems 1, 6, 7, and 8 were all considered to address similar content of student perception of their “STEM ability”, and all of these items overlapped in terms of item measure. Thus, items 1, 6, and 8 were removed to produce a more parsimonious construct. Item 7 was maintained to keep a more general ability item focused on “school”.
 3. I am confident about trying out new STEM ideas. 0.12 (0.19) Keep
 4. I understand how STEM is used in jobs. 0.11 (0.19) Keep
 6. I receive good grades on STEM activities in school. −0.29 (0.20) Remove
 7. I understand STEM concepts we discuss in school. −0.33 (0.20) Keep
 2. I get excited about doing STEM projects. −0.46 (0.21) Keep
 1. I am good at STEM.−0.64 (0.22) Remove
 8. I do well in school STEM activities.−0.73 (0.22) Remove
21st Century Skills (8 items)
 7. When a STEM project or task does not go as planned, I can think of other ways to accomplish it. 0.56 (0.22) KeepWhile many items in this construct were statistically similar in measure, as shown by overlap, only one item was removed (2). This item focused on “problem-solving”, a component of 21st century skills, but also addressed in other constructs of the survey.
 1. I can think of creative STEM ideas.0.51 (0.22) Keep
 3. I am able to talk about my STEM ideas.0.51 (0.22) Keep
 2. I am able to solve STEM problems.0.31 (0.23) Remove
 8. I am able to be the leader of a team working on a STEM activity. 0.25 (0.23) Keep
 6. I am able to complete a STEM project or task by its due date. 0.20 (0.24) Keep
 5. I am a good team member when I work on STEM activities in a group.−1.08 (0.31) Keep
 4. I can use the internet to get the information I need for a STEM project.−1.28 (0.33) Keep
Table 7. Final Items by Construct in Order of Difficulty Measure with SE and Item Statistics.
Item Statistics
Construct
  Item Number and Stem
Measure in Logits (SE)Infit (MNSQ)Outfit (MNSQ)Point- Biserial
STEM Identity (5 items)
  4. I see myself working in a STEM job someday. 2.92 (0.17)1.131.010.75
  5. I think I will do well in high school STEM classes. −0.12 (0.15)1.061.050.71
  3. My friends think I do well in STEM. −0.46 (0.15)1.131.120.69
  2. My teachers think I do well in STEM. −0.89 (0.16)0.830.810.73
  1. My parents think I do well in STEM. −1.44 (0.16)0.880.840.70
STEM Interest (6 items)
  2. I like to watch videos about STEM when I am not in school. 1.87 (0.14)1.511.370.55
  4. I discuss STEM with friends and/or family. 1.12 (0.13)1.231.210.66
  6. I often think of STEM activities to try out. 0.15 (0.12)1.001.060.72
  5. I enjoy solving STEM problems. −0.46 (0.13)0.730.690.82
  3. I want to increase my STEM knowledge as much as possible. −0.99 (0.13)0.850.820.80
  1. I enjoy learning about STEM. −1.69 (0.14)0.770.750.81
STEM Self-Efficacy (5 items)
  4. Other students ask me for help with STEM activities. 3.13 (0.18)1.391.230.65
  3. I understand how STEM is used in jobs. −0.35 (0.16)1.081.040.71
  2. I am confident about trying out new ideas on my own in STEM. −0.54 (0.16)0.910.940.73
  5. I understand STEM concepts we discuss in school. −0.82 (0.16)0.680.660.76
  1. I get excited about doing STEM projects. −1.41 (0.17)1.041.000.66
21st Century Skills (7 items)
  2. I am able to talk about my STEM ideas. 1.04 (0.13)1.141.140.64
  1. I can think of creative STEM ideas. 0.37 (0.13)0.930.920.68
  5. I am able to complete a STEM project or task by its due date. 0.30 (0.13)1.011.010.70
  7. I am able to be the leader of a team working on a STEM activity. 0.30 (0.13)1.141.120.71
  6. When a STEM project or task does not go as planned, I can think of other ways to accomplish it. −0.20 (0.14)0.940.890.67
  4. I am a good team member when I work on STEM activities in a group. −0.47 (0.14)0.900.850.72
  3. I can use the internet to get the information I need for a STEM project. −1.36 (0.16)0.890.830.58
Disclaimer/Publisher’s Note: The statements, opinions and data contained in all publications are solely those of the individual author(s) and contributor(s) and not of MDPI and/or the editor(s). MDPI and/or the editor(s) disclaim responsibility for any injury to people or property resulting from any ideas, methods, instructions or products referred to in the content.

