Article

Data Quality of Different Modes of Supervision in Classroom Surveys

Faculty of Social Science, Ruhr University Bochum, 44801 Bochum, Germany
Educ. Sci. 2024, 14(3), 299; https://doi.org/10.3390/educsci14030299
Submission received: 23 January 2024 / Revised: 6 March 2024 / Accepted: 7 March 2024 / Published: 12 March 2024
(This article belongs to the Section Curriculum and Instruction)

Abstract

:
Conducting quantitative research involving adolescents demands a thoughtful approach to the question of supervision, given that each option comes with its distinct set of implications. This study reviews these implications and empirically tests whether differences in data quality can be found among three modes of standardized survey research with medium-sized groups of adolescents (12–17 years). The data basis is a quasi-experimental survey study testing different forms of digital, hybrid, or in-person supervision that took place in 2021 in secondary schools in Germany (N = 923). The aim of this study is to test how aspects of data quality—item nonresponse, interview duration, drop-out rate, and response patterns—differ between these forms of supervision. Results could help researchers surveying young people to decide (1) whether they allow confidants or other adults to be present during interviews, (2) if they can rely on teachers alone when surveying classrooms, and (3) if it is cost-efficient to send out external supervisors for classroom sessions. While drop-out rates do not differ, item non-response, interview duration, and response patterns differ significantly; students supervised at home by external interviewers answered more questions, took more time to answer, and were less likely to give potentially meaningless answers in grid questions. The implications drawn from the findings question the common approach of solely relying on teachers for survey administration without the support of external supervisors or adequate training. Recruiting respondents via schools and surveying them online in their homes during school hours has been shown to be a robust method with regard to the analyzed indicators.

1. Introduction

Across various scientific disciplines, a common approach to surveying adolescents is conducting standardized surveys in classrooms, with teachers or external supervisors ensuring the consistency of the process [1,2,3,4,5], which is convenient for several reasons. Surveys conducted in schools are considered more valid compared to surveys taking place at home [6,7,8]. Working with schools saves time because researchers can interview whole classes at once and do not have to visit homes [9] or wait for postal answers. Recruitment via public schools is an efficient strategy for reaching representative populations [10]. The implications of leveraging schools as dynamic settings for survey research have been notably scrutinized empirically through the lenses of criminology [9,10,11,12] and mental health [13,14]. Additionally, a wealth of practical guidance for effective survey studies is offered by professionals in public health [5,15], medical research [4,16], or psychology [3]. Although there is extensive research dealing with mode effects, additional research with controlled designs is necessary to find effective methods and strategies that ensure satisfactory response rates and data quality among adolescents in mental health surveys [14] and to find out how different settings might affect response behavior [12].
Teachers can be pivotal for a survey’s success: parents trust them (parental consent, unit nonresponse), students rely on their expertise (item nonresponse, validity), and are expected to respect their authority (unit and item nonresponse, validity). However, relying on them to convey a scientific survey might bias results because of their (possibly even unnoticed) influence on the students’ response behavior [15,17,18]. Many questionnaires contain questions that are prone to social desirability bias. The presence of external supervisors may reduce the risk of bias, as suggested by [14]; they might emphasize the significance of maintaining neutrality among the adults present, either through verbal communication or simply by being physically present. Their presence is an additional and often quite substantial expense, however [9]. Two questions arise: is teacher supervision a threat to data quality, and is investment in external supervision necessary?
This article endeavors to interconnect the diverse perspectives presented above, contributing original empirical findings that shed light on the role of teachers and external supervisors in the data collection process and their consequential impact on the quality of obtained data. It utilizes a dataset resulting from a quasi-experimental study design. The survey study under investigation is based in Germany’s largest metropolitan area, testing different forms of digital, hybrid, and in-person supervision. UWE (“Umwelt, Wohlbefinden und Entwicklung” = “Environment, Well-Being and Development”) is a classroom-based, repeated cross-sectional study. It serves multiple purposes, among them sociological research of adolescent life, but more importantly, it aims to empower youths to have their voices heard by school and municipality officials. The aim of this publication is to test how item nonresponse, interview duration, drop-out rate, and response patterns differ between groups, depending on their supervision. The results could help researchers surveying youths and adolescents decide whether they allow confidants or other adults to be present during (group-) interviews, if they can rely on teachers alone when surveying classrooms, and if it is cost-efficient to send out external supervisors for classroom sessions.

2. Previous Research

Researchers surveying young people during the pandemic have faced similar challenges all over the world [19,20] and have found similar workarounds, although most of them had to start from scratch. Until very recently, there has not been much published research on the effects of lockdown workarounds on survey data quality. As the term “workaround” suggests, much of the conducted research during that time, the present study included, used ad hoc methods fitting individual needs and available infrastructure. Assuming that researchers in the field had a profound knowledge of survey methodology and put it to good use when developing workarounds, scholars can now benefit from the resulting pioneering work.
The following section will present previous research on third-party effects, the effects of external supervision, and relevant literature on survey research in general, which is relevant when surveying youths and adolescents with standardized questionnaires in classrooms, using different modes of supervision.

2.1. Supervision during Self-Administered Surveys

In theory, a well-designed questionnaire should not require any supervision at all, but evidence on data quality is not unambiguous. For instance, Felderer et al. [21] found that web surveys tend to have higher nonresponse rates than surveys led by interviewers. Their results contradict the findings of Mühlböck et al. [22], who investigated self-completion surveys among young adults and found no significant differences in response behavior between web surveys without supervision and modes with interviewers present—although completion rates were higher in the latter group. However, self-administration has been shown to be less prone to response bias [21]. Atkeson et al. [23] argue that the presence of an interviewer can alter response patterns on questions that pertain to an individual’s personal beliefs, attitudes, or experiences. Bidonde et al. [14] found that response rates of adolescents in studies of mental health can indeed vary with survey mode, consent type, and incentives used. Overall, it seemed that when there was any kind of supervision involved, response rates were at least slightly higher. The results of Cops et al. [8] suggest that the mode of administration can impact response behavior on different levels. Survey mode influence extends to both individuals’ likelihood to participate in the study, eliciting selection bias, and the potential for differential tendencies to report criminal behavior among participating individuals, prompting measurement bias. Thus, variations in the prevalence estimates of criminal behavior between studies arise from differences in the participating population, as well as potential effects related to the setting or anonymity. Since young people are considered less likely to participate in surveys compared to older people, a closer look into potentially enhancing methods is worthwhile.

2.2. Effects of Teachers’ Presence

Recruiting and surveying respondents in schools is a rather inexpensive and efficient way to achieve high response rates [3,4,5,18] and representative samples [10]. An important prerequisite for successful research involving schools and school personnel is to tailor survey research designs to schools’ needs [16]. However, the study presented by Rasberry et al. [15] shows how difficult survey research in schools can be. Their study was prepared and conducted carefully, and every pitfall seemed to be anticipated, but in the field, they still struggled with teachers failing to monitor the survey or unprecedented issues with post-survey logistics.
When surveys take place in schools, it is common practice to work with teachers as “assistant supervisors”, as they are already figures of authority in the target groups and can usually handle group dynamics and disruptions. Although their ability to do so may vary [5], this should increase data quality in terms of validity and completion rates [14].
A typical notion in the literature is that teachers are important or at least very helpful in setting up the survey infrastructure [17,18]. They can help keep respondents’ motivation up and help retrieve basic information, such as zip codes. These data are typically used to obtain small-scale data necessary for localizing neighborhoods that require municipal attention. Retrospective data might be more accurate when a confidant can help remember things. Teachers can provide valuable information and insights about academic abilities and behavior. All of the above is also noted in the protocols of the UWE survey. In conclusion, arguments speak in favor of teachers facilitating the survey process:
Hypothesis 1a: 
When conducting standardized survey research in classrooms, the presence of teachers increases data quality.
When conducting or assisting with a survey in their classroom, teachers may find themselves in a unique position where they need to balance two roles. They act as supervisors but are third parties at the same time. Yet, none of these attributions fits perfectly, and they are also ambiguous in their potential effects. In their role as supervisors, they hand out questionnaires or online survey links and are the primary source of information on comprehension questions. In many cases, they also read an introduction. From the researcher’s perspective, however, they are considered third parties, primarily because they have a personal relationship with the respondents, jeopardizing their neutrality. In addition, they usually do not know the questionnaire at all. In Demkowicz et al. [13], students reported that their teachers were not very helpful when asked comprehension questions. Before the survey took place in their classroom, teachers were not trained as interviewers in most cases, although Hatch et al. [16] highly recommend it. Depending on their seniority, they may or may not have been part of research in school [5]. Hence, it cannot be assumed that they are aware of how their assistance can affect the accuracy of responses. Rasberry et al. [15] even report teachers filling out the survey themselves, discussing survey questions, or reading sensitive questions out loud, potentially preventing students from answering truthfully.
The literature recognizes further sources of potential influence teachers or other adults can have on young people’s response behavior. An obvious one is social desirability bias. Social desirability bias is the tendency of respondents to provide answers that are socially acceptable rather than their true opinions or behaviors, which is more likely to occur in interviewer-administered surveys [23]. Adolescents may be particularly prone to social desirability bias because they are often highly influenced by their peers and social norms [24]. Cops et al. [8] found that self-reported delinquency was significantly lower when youths were supervised by adults close to them, which implies that third parties should be avoided, and surveys with sensitive questions should not take place at home. As Tourangeau and Smith [25] found in an early review of studies using the computer-assisted personal interview (CAPI) approach, social desirability bias can be reduced by using self-administered questionnaires or computer-assisted self-interviewing, which can increase anonymity and decrease social pressure to conform.
In contrast, the mere presence of teachers might increase the latter, since they are authority figures [26]. They establish the typical classroom atmosphere, and thus, respondents likely find themselves in their social role as students. When asked how they feel in this role, the presence of involved teaching personnel likely influences their response behavior. The relationship between students and teachers could also increase item nonresponse: ref. [17] reported that students were hesitant when asked about personal information by their teachers.
Duncan and Magnuson [27] discussed potential biases arising from the presence of adults during surveys in school settings due to differences in socioeconomic status. This may be especially relevant in this particular case: teachers in Germany are highly qualified personnel and thus have high socioeconomic status. The survey analyzed in this study was conducted in two of the poorest cities in Germany, so there is a high proportion of youths from materially deprived households.
The difference between a survey and an exam can be difficult to internalize for both students and teachers. A frequent observation from the protocols of UWE is that teachers tend to rush things. Of course, we want respondents to take their time; teachers, however, are used to tight schedules and like to get things done in time. This may partly stem from the practical necessity for schools to efficiently manage their staff resources, given that they are frequently understaffed, leading them to be cautious about allocating excessive time for survey projects [5]. Moreover, surveys are often perceived as additional work by teachers, which is not wrong (ibid.). Alibali and Nathan [3], as well as Hatch [16], strongly recommended being prepared for this and being patient with schools and teaching staff, as their time is limited.
The problem is recognized and not easily surmountable, so we need to assess whether it has adverse consequences. Strange et al. [17] showed that when strict time limits are established, those with literacy problems showed higher drop-out rates, and consequently, students from lower social classes were less likely to complete their surveys. Gummer and Roßmann [28] found that longer interview durations are related to higher motivation among respondents—strict time limits might dampen this motivation or at least eradicate its positive impact on data quality (e.g., item nonresponse). Following these arguments against teachers’ presence, a counterhypothesis challenging the first one could be:
Hypothesis 1b: 
When conducting standardized survey research in classrooms, the presence of teachers reduces data quality.

2.3. Effects of External Supervision

The obvious solution to this dilemma would be to educate teachers on the science of survey research, like [16] demonstrated. Unfortunately, this can be very difficult to pull off for various reasons, with time being the most pressing one. A potential remedy is the presence of a third, neutral party that is familiar with the pitfalls of conducting surveys. Trained interviewers can intervene when teachers unintentionally bias responses and help with comprehension questions. Communication among members of the research team can also help teachers and respondents understand the purpose of the study, resulting in higher motivation among all parties involved [5].
Demkowicz et al. [13] reported that respondents were motivated to complete their questionnaire because they were aware that their participation might be helpful to others in the future. Reflecting on their own lives and well-being has been seen to be helpful to children and young people as well, again increasing their motivation to complete the questionnaire. Those who are actively engaged in the projects associated with the survey (e.g., researchers acting as supervisors or even hired, but trained staff) are more likely to effectively convey to respondents the significant impact their participation can have on the project’s success and its subsequent benefits for youths and adolescents.
Hypothesis 2a: 
When conducting standardized survey research in classrooms, the presence of external supervisors increases data quality.
According to Epstein [29], adults who work in a school environment can be perceived as “another teacher” by both students and teachers. This can have an impact on the objectivity of interviewers and may also influence how young people respond. If it does not, sending in supervisors might not even be worth the effort, which cannot be underestimated [4,5,9]. Strange et al. [17] found that when surveys were administered to students either by a teacher or a researcher, there was no significant difference in the likelihood of students completing the questionnaire. Walser and Killias [9] and Kivivuori et al. [11] dealt with highly sensitive questionnaires and also found little significant differences in the response behavior of juveniles supervised by teachers versus external supervisors. The opposing hypothesis must therefore be:
Hypothesis 2b: 
When conducting standardized survey research in classrooms, the presence of external supervisors does not increase data quality.
Demkowicz et al. [13] discussed the role of non-teaching staff in creating an environment that deviates from the typical classroom atmosphere and empowers respondents with autonomy regarding their participation. Ethically, it is highly preferable for respondents to be aware that survey participation is voluntary. Moreover, informed consent can significantly enhance completion rates [13]. However, participation rates can also benefit from what Demkowicz et al. referred to as a ‘fait accompli’ scenario [13]. This refers to situations where parents and teachers of the respondents have already agreed to the surveys, and the assigned schoolwork is generally compulsory. Gaining consent from schools and parents in the first place is a field of research in itself [3,4,16].

2.4. Effects of Using Video Conference Software

Cost efficiency has been the primary challenge associated with deploying external supervisors or trained interviewers for surveys, until recently. Professional interviewers are expensive, and survey projects usually run on a budget [9]. In 2020 and following years, another big problem superseded this issue: contact limitations and the closure of schools. With contact limitations and lockdowns in place, sending in external supervisors was impossible.
One solution for this problem was the increasingly common use of video conference software, which allows people to virtually communicate face-to-face without having to be in the same room. Some schools had already used it for distance learning, and like many others, UWE took advantage of their efforts. A complex coordination process generated a set of new survey modes.
Video conference software is already used quite regularly in qualitative social science [20,30,31,32]. Common sources of bias are along the same lines as those in face-to-face or telephone interviews [20,30,31,32]. An additional bias is representativeness, as not all social strata have equal access to and competence in using VCT.
For quantitative research and questionnaire-based surveys, it is uncommon to make use of VCT, because it may appear impractical or redundant. It may be impractical, because it takes effort to arrange and set up, despite being technically unnecessary. It may be redundant, because a good questionnaire speaks for itself and does not need an interviewer. As discussed above, when dealing with adolescents in larger groups, supervision is required. There tends to be disruptions and group dynamics that are unique for this age group, as anyone who has worked with teenagers before can imagine. Strange et al. [17] described them vividly. Simply put, we cannot assume independent observations in shared classrooms. Finally, if external supervision is needed, VCT offers a relatively inexpensive solution.

2.5. Web Surveys

The age group analyzed here comprises individuals born after 2004, considered as “digital natives”. It can be argued that their extensive experience with digital devices does not result in any significant differences in data quality when completing a questionnaire with a pen, a school PC, or a smartphone. Raat et al. [33] found negligible differences between adolescents answering a health-related survey either on paper in schools or via web survey in terms of feasibility, reliability, and validity of the scales. Hallfors et al. [1] reported that self-administered surveys decrease item nonresponse compared to paper forms.
Young respondents in this generation born after 2000 may even prefer digital delivery. In a study conducted by Demkowicz et al. [13], respondents expressed a preference for digital delivery, citing reasons such as increased efficiency, familiarity with surveys on digital devices, concerns about anonymity due to recognizable handwriting, and heightened security concerns associated with the potential loss of paper forms.
Gummer and Roßmann [28] argued convincingly that the device used does indeed matter. However, their main argument was that the questionnaire design must fit the device, because there may be differences in the visibility of the questionnaire or different download times when using mobile devices, affecting response latency. A few respondents in Demkowicz et al. [13] also stated that they struggled sometimes with visual formatting. The survey project analyzed here utilized software that is suitable for all devices (“Sosci-Survey” [34])) and tested the resulting questionnaire on all possible devices—there was satisfactory visibility of the questionnaire, and there were no reports of problems with downloading the questionnaire or uploading responses.

3. Materials and Methods

The hypotheses will be tested using regression analyses, based on data from the 2021 wave of the UWE survey study, which has been described briefly above (available via [35]). Data quality indicators will be predicted based on different supervision modes while controlling for respondent and interview characteristics.
UWE set out to ask every youth in grades seven and nine in two Ruhr Area municipalities about their well-being, everyday life, and social resources, every other year since 2019, using standardized questionnaires [36,37]. The analyses in this study utilize data resulting from the survey round in one municipality that enabled cooperation with local secondary schools in spring 2021. Within this wave, a cohort comprising 923 students from grades seven and nine, typically ranging from 12 to 15 years old, within a single municipality, has commenced the process of responding to the questionnaires. During this period, schools were closed or opened for a limited number of students, depending on the incidence rates of the COVID-19 pandemic. Due to these unique circumstances, different modes of supervision were used in the same schools, and even classrooms were surveyed in various setups.
The survey itself covers the multidimensional operationalization of subjective well-being, social resources, and contexts and enables a comprehensive picture of adolescent life from a socioecological perspective [38]. Initially, the data collection involved handing out questionnaires in classrooms with an external supervisor and a teacher present. Supervisors were responsible for explaining and answering questions, while teachers represented figures of trust and authority during these sessions. The supervisors mostly comprised researchers responsible for the survey itself and their student assistants, who had been trained as interviewers.
The study provided three modes of supervision for groups of respondents aged 12 to 15, including (A) only teachers present, (B) teachers and external supervisors present via video-conference technology (VCT), or (C) external supervisors present via VCT without teachers. Questionnaires were self-completed using school-owned devices, personal devices, or paper forms. This quasi-experimental study allows for the systematic evaluation of potential differences in data quality between these modes of supervision.

3.1. Data Quality Indicators and Analyses

Three factors of data quality can be indicated reliably using the datasets of UWE: drop-outs, item nonresponse, interview duration, and straight-lining. This section describes these indicators and discusses why they are used and how they are analyzed.
A response is defined as a drop-out when the survey ends before the last quarter of the questionnaire is answered. The drop-out threshold lies between two item batteries: more general questions about school life and a battery about bullying. Roughly 5% of all respondents answered less than 75% of the overall questionnaire; this is what is considered a premature drop-out. This indicator can be seen as the negative of completion rates, which is a common measure of data quality. Mühlbrock et al. [22] used drop-out rates to compare self-administered versus supervised surveys among young adults but found no significant differences in drop-out rates. Drop-out is a binary variable; hence, the use of logistic regression is adequate for predicting it [39,40]. Logistic regression assumes a linear relationship between the independent variables and the log odds of the dependent variable. It also assumes the absence of multicollinearity, meaning that independent variables are not highly correlated. Multicollinearity concerns have been effectively addressed, as evidenced by satisfactory Variance Inflation Factor (VIF) values within the regression model, affirming the absence of significant multicollinearity among the independent variables. Limitations include its sensitivity to outliers and the assumption of linearity, which may not always hold in complex relationships. Additionally, logistic regression assumes that the observations are independent, and violations of this assumption can affect the accuracy of parameter estimates [40]. The independence of observations assumption usually does not hold in classrooms, as all respondents in the same classroom are exposed to the same conditions, which can differ between classrooms. Therefore, clustered standard errors and controls for all available conditions are implemented in the logistic regression model.
As a second indicator, I analyzed item nonresponse. 210 items were presented to all respondents. The great number of items is one of the reasons why the absence of supervision was not considered in the field. Most respondents answered most of the questions, but there are also a lot of gaps in the data. While the nonresponse rate is a common indicator for survey data quality [41,42], its use as a proxy indicator for nonresponse bias has been questioned [43]. Wagner called researchers to use the fraction of missing information instead [43,44]. He concluded that although completion rates might not be a good indicator of nonresponse bias, they are adequate for a comparison of different data collection methods [44]. For the analyses in this study, item nonresponse is measured by simply counting the items with missing values in the dataset. Some questions were filtered and could not be answered by all respondents, such as follow-up questions about migration background. They are excluded from the count. Respondents who were defined as drop-outs have been excluded from this analysis because they are extreme outliers. The decision against using a share or missing information instead of the raw count is based on the argument that a count is easier to interpret than a share, and transforming it into a percentage adds no information. Since the resulting variable can be described as count data, a variation of Poisson regression is deemed adequate [45,46]. There is no reason to assume zero inflation because all zeros in the data are simply complete questionnaires. Therefore, a negative binomial model to predict the number of unanswered questions will be applied. This model, akin to the previously discussed logistic model, assumes independence of observations, which is addressed by using clustered standard errors. VIF values cannot be estimated in negative binomial regression models. As recommended by Türkan and Özel [47], the model utilizes jackknifed estimators to remedy potential effects of multicollinearity and reduce bias in the estimation process.
The duration of interviews conducted with digital questionnaire forms has been recorded, allowing examination for any indication of haste. Interview duration is an ambiguous indicator. We cannot simply claim that a longer duration indicates higher quality than a shorter one, just as we assume fewer drop-outs or nonresponses to be indicators of better quality. Questions can be answered too slowly or too quickly. The former might imply that respondents have trouble understanding the questions or are distracted. The latter could indicate speeding through the questionnaire or straight-lining and consequently not answering truthfully. A very fast completion of the questionnaire can be indicative of a careless or fake response; hence, Leiner [42] suggested using completion times to identify meaningless data. In terms of response time for single items, Revilla and Ochoa [48] mentioned that highly skilled respondents could answer very quickly, although extremely short response times rule out the possibility that respondents read the question at all. They seemed to lean towards the notion that short response time is generally related to lower quality responses. Their results support this claim convincingly and are in line with the findings of Gummer and Roßmann [28], who found longer duration in higher motivated respondents. Interview duration was recorded in seconds during the self-administered questionnaire procedure. To make my results more comprehensible, I recoded the interview durations into minutes. The analysis excludes drop-outs and respondents who filled out paper forms. The former is because their duration is irrelevant to this question; the latter because the required data could not be collected for this group. Since Tourangeau et al. [49] used Cox regression to model interview duration, the study follows their recommendation here. Critical assumptions and limitations of Cox regression are similar to the aforementioned and involve the linearity of effects and independence of observations [49,50]. To assess potential inaccuracies due to multicollinearity, Variance Inflation Factors have been calculated and are satisfactory for all covariates.
Whether a response is truthful or not is difficult to assess. Satisficing response behavior may lead respondents to anchor their answers on the first response option they find satisfactory, which easily minimizes the required effort for survey completion [41]. If they then align their subsequent responses with the initial choice, straight-lining occurs. The absence of straight-lining enhances the reliability of data by signaling genuine respondent engagement and truthful reporting [41,42]. UWE uses several item battery or grid questions suitable for a thorough examination of possible straight-lining patterns. Many grid questions only contain three or four items, which can be answered truthfully with the same option repeatedly. Hence, the analysis presented in this work seeks patterns in item batteries containing at least five items. The questionnaire contains six grids that are unlikely to be answered truthfully by repeatedly choosing the same option. All of the items are answered on a five-point scale. Another logistic regression model will predict how likely it is that at least one occurrence of straight-lining can be detected in each supervision mode. The same measures are applied as in the first logistic model, and all VIF values are satisfactory.

3.2. Explanatory Variables

All statistical models control for the same characteristics of the respondents and the interview setting. Respondent characteristics include age, gender, migration background, German literacy, grade, and school type. School type distinguishes three types: higher secondary track (Gymnasium), comprehensive secondary track (Sekundarschule and Gesamtschule), and practical secondary track (Realschule and Hauptschule). The main difference is that attainment of the first one qualifies graduates for tertiary education; in the second, this is optional, and the third one does not offer this option. Table 1 presents the descriptive statistics of the variables used in the analyses:
Girls are slightly overrepresented in the sample. The maximum age in the sample is 17, although the usual age in grades seven to nine is 12 to 15. A very small portion of the sample has literacy problems, indicated by the question “How easy is it for you to read German?”, to which they answered “hard” or “very hard”. 41% of the sample has a migration background, which was defined as being born in another country or having a parent born in a country other than Germany. This share is consistent with the overall population of that age in metropolitan Germany.
The interview setting is characterized by supervision (teacher present or not, supervisor present or not), survey location (school or at home), and the form in which the questionnaire was delivered (paper or online). There were 84 classroom sessions, and the models control potential heteroskedasticity by clustering the standard errors accordingly in all models. The supervision has three possible forms, and the assignment was completed according to schools’ equipment, teachers’ preferences, and official contact restrictions. An overview of the supervision modes used in each school can be found in Table 2. During the time the survey was conducted, some schools were practicing what was called “Wechselunterricht” or “alternate distance learning”. Classes were split up into two groups, which were taught at home or in school for one week; in the next week, they swapped places. This allowed the researchers to test different approaches in the same classroom; assignment to one of the two groups was usually random by surname.
(A) Teacher only: One share of classrooms was surveyed without external supervision involved. Teachers were given paper questionnaires or shortened online survey links. The links were available as QR codes as well. They had the option to present a video or explain the procedure themselves. For that option, they had an introduction and manual prepared by the institute to ensure that all respondents had the same information. Respondents could either use their personal devices or school-owned devices, depending on teachers’ perceptions of what would work best in their classrooms.
(B) Teacher and external supervisor: Another group of classrooms had teachers present and was more or less constantly connected to an external supervisor via video conference software. They introduced the survey and offered help with comprehension questions. They also observed the situation but could not effectively intervene, given their mere virtual presence. This mode was combined with online surveys conducted on school computers or respondents’ personal devices.
(C) Supervisor only: Some classes were not available for interviews in school. We used the distance-learning channel they were already used to at that time to establish the group survey (Microsoft Teams in most cases). They were all online in a video call and filled out an online survey on their own devices at home. No teachers were present in this mode.
Table 2 presents the distribution of supervision modes among the three school types and their response rates:

4. Results

In the following section, predicted values for the indicators of data quality and full regression outputs are presented by mode of supervision.

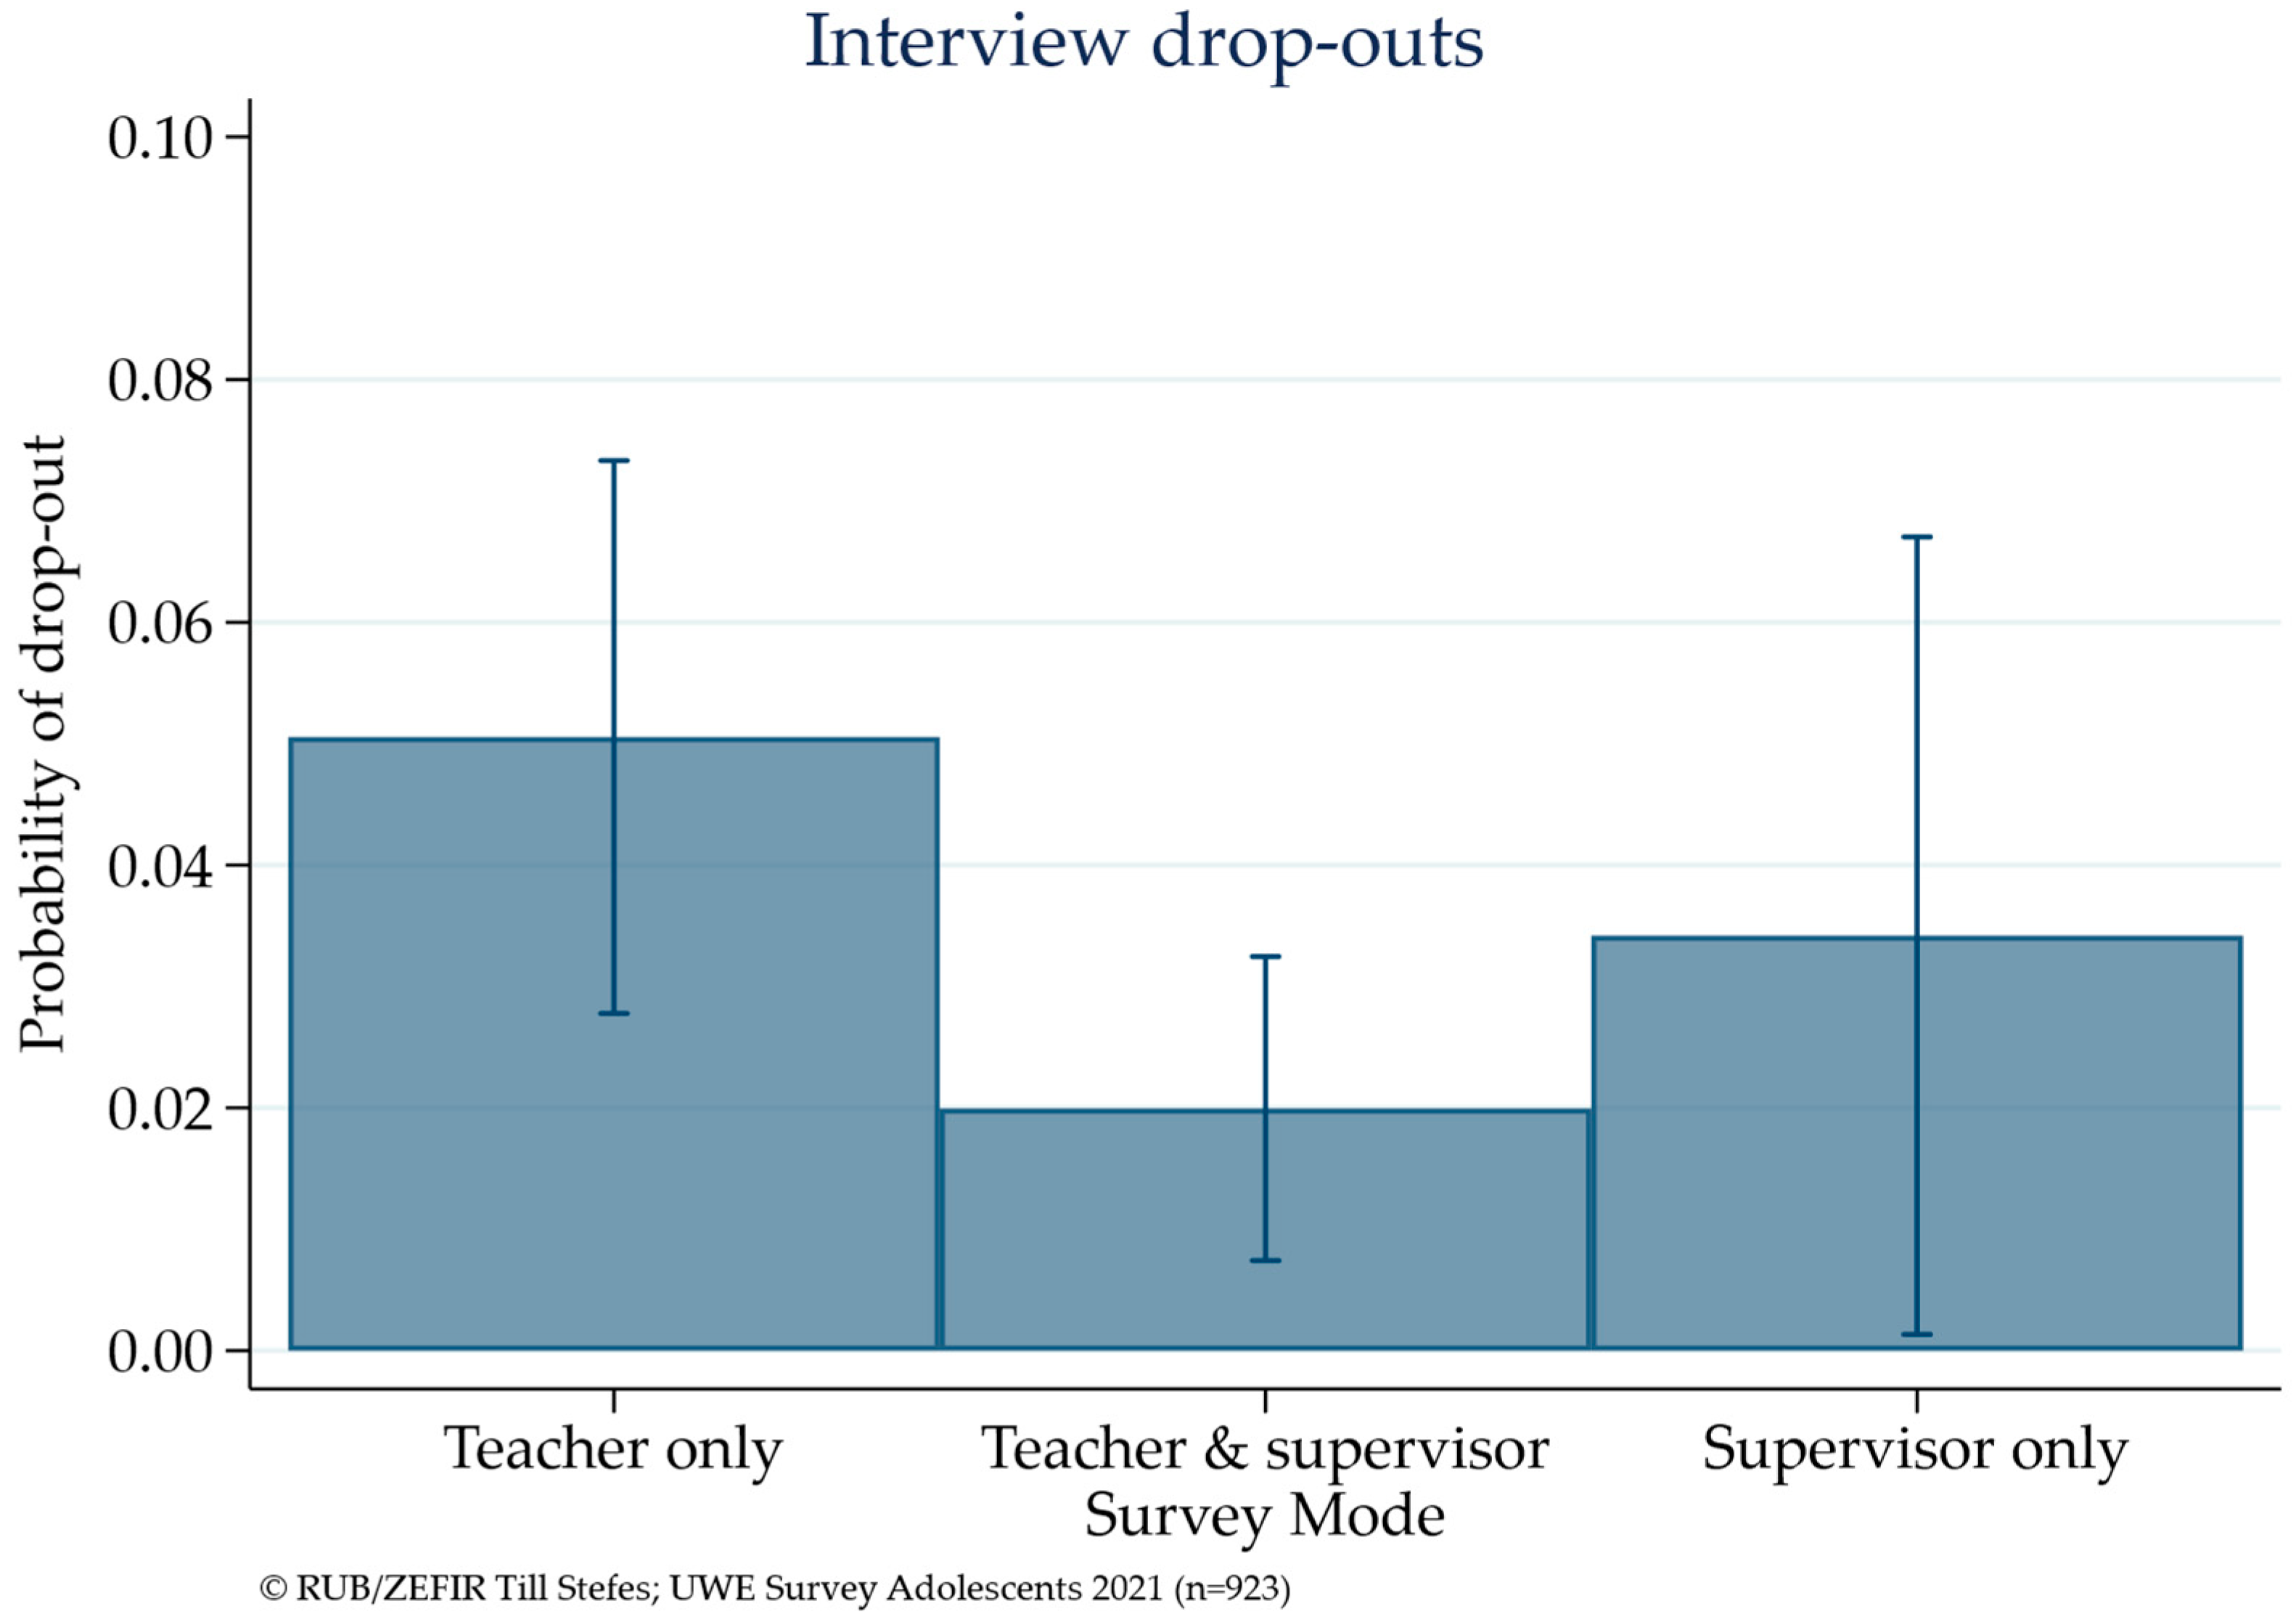
4.1. Interview Drop-Outs

Drop-outs can have several reasons. Participation is not mandatory. Questions are in part very personal and there are many of them. Presumably, respondents lost interest in the survey or felt that it was too personal. Another possible reason is that they could not finish in time. This affects item nonresponse and interview duration as well—the survey was conducted during school hours (45 min), which places a natural limit to interview duration. The protocols mention that teaching personnel often insisted on ending the interview sessions when the “bell rang” (in most German schools, an emulated bell ring indicates the end of the lesson). Figure 1 reports the predicted probability of early interview drop-out. Based on the logistic regression model (Table 3), the probabilities do not significantly differ and are below 0.8%—all three interview situations can offer an acceptable completion rate. There is no clear evidence regarding Hypotheses 1a and 1b. This may suggest that the advantages and disadvantages of teachers supervising a survey cancel each other out. Hypothesis 2b states that external supervisors do not impact data quality, and the result presented in Figure 1 hints at this general direction.
Table 3 presents the full model. A significantly higher likelihood of not finishing the survey was found among youths who have problems with reading in German. The coefficient indicates that falling into that category increases the log odds of dropping out by 1.89. The fact that the coefficient shows a negative effect of supervision by both teachers and external supervisors, while the marginal effect is not significant in Figure 1, is likely due to interaction effects that are not considered in the model. Respondents who did not use paper forms were more likely to leave before finishing the survey. Students on the practical secondary track were much less likely to drop out than students on the high secondary track. They were supervised more often by teachers; paper forms may be the driving force here. Bias due to multicollinearity can be mostly ruled out, as the VIF values of both variables are below 10.

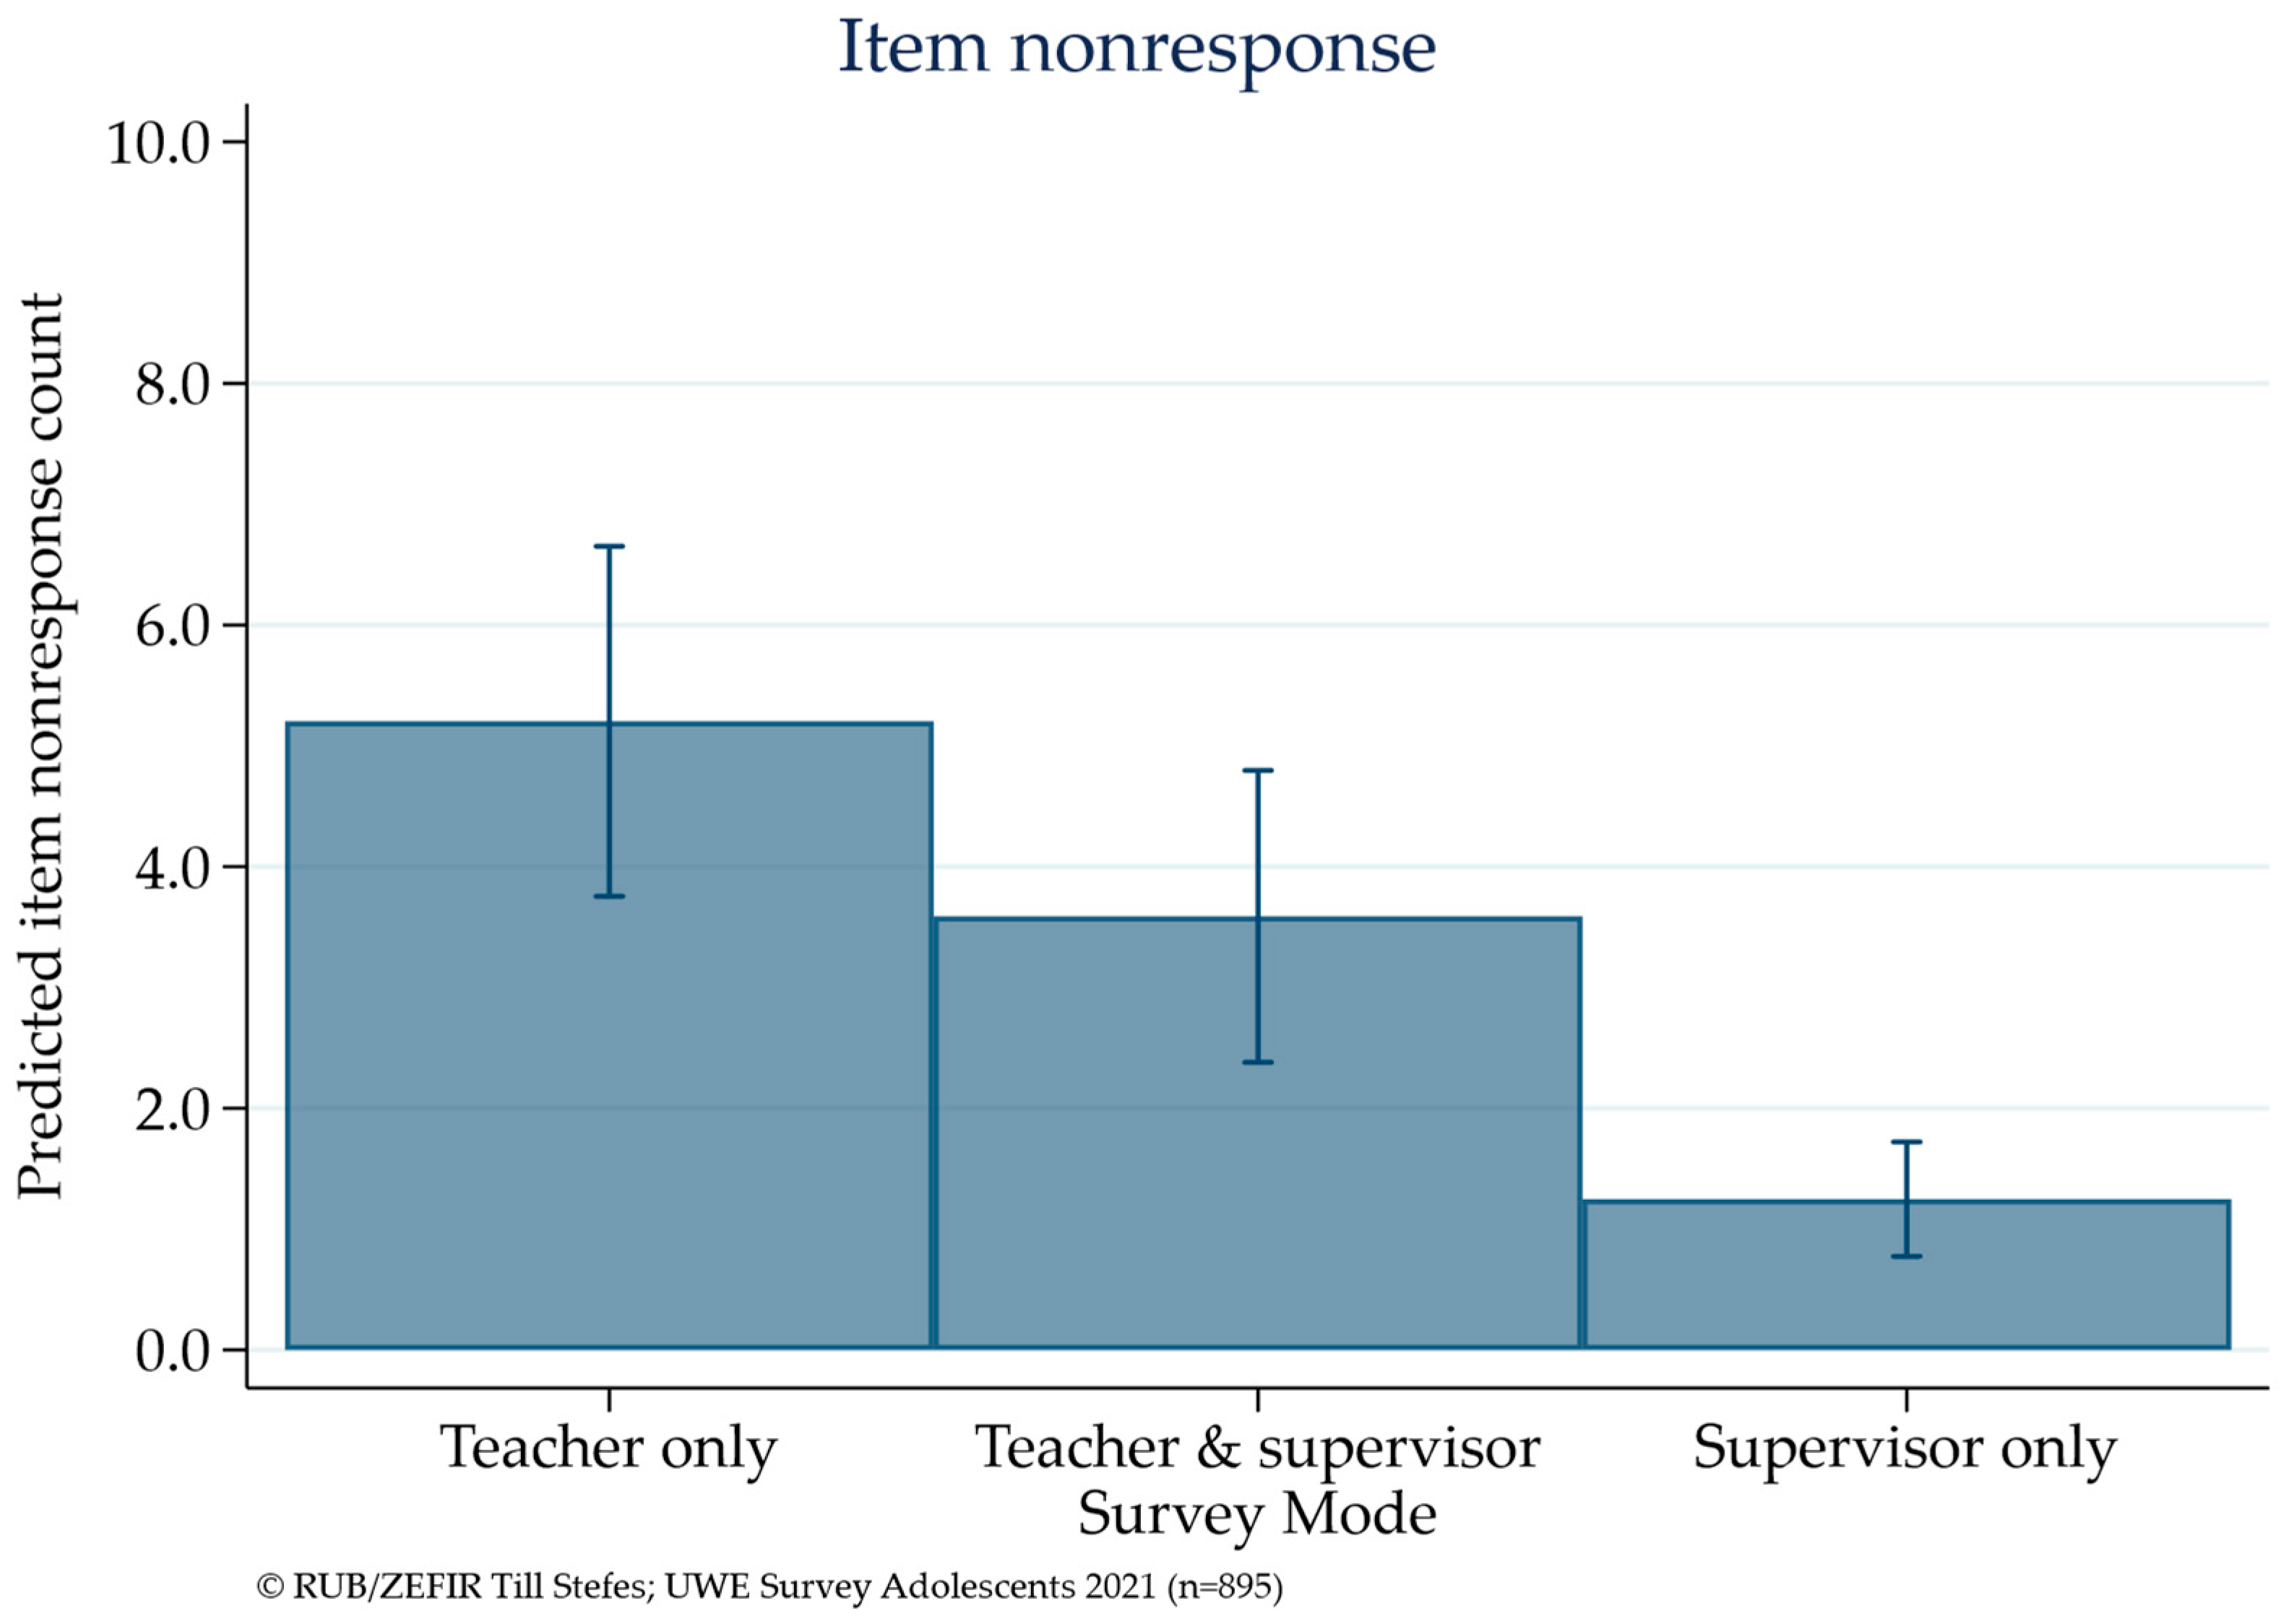
4.2. Item Nonresponse

Figure 2 shows the predicted item nonresponse across the three supervision scenarios based on a negative binomial regression model. The maximum value is 150. This is the highest possible number of unanswered questions for observations that are not considered to be drop-outs. While there is no significant difference between mode (B) and one of the others, the modes with only one adult present differ significantly in terms of item nonresponse. Students who were supervised by teachers only had an average item nonresponse of five, while it was less than two for students who were supervised by external supervisors only. This could be interpreted as evidence in favor of Hypotheses 1b and 2a, suggesting that teachers decrease data quality while external supervision is a clear benefit.
The coefficients presented in Table 4 indicate that with a one-unit change in the predictor variable, while holding other predictors constant, the logarithm of the expected counts of the response variable (number of unanswered questions) changes by the respective value. For instance, the estimator for the effect of web surveys versus paper questionnaires is −0.788. The exponential of that value yields 0.455, which means that the expected count of unanswered questions is approximately 45.5% lower for respondents using a web survey compared to those using a paper questionnaire, ceteris paribus. While this seems like a very large effect, accounting for other variables in the model and the constant is important to not overestimate the scale of the effect. School types also significantly differ; comprehensive and practical secondary schools have higher item nonresponse rates than high secondary schools.

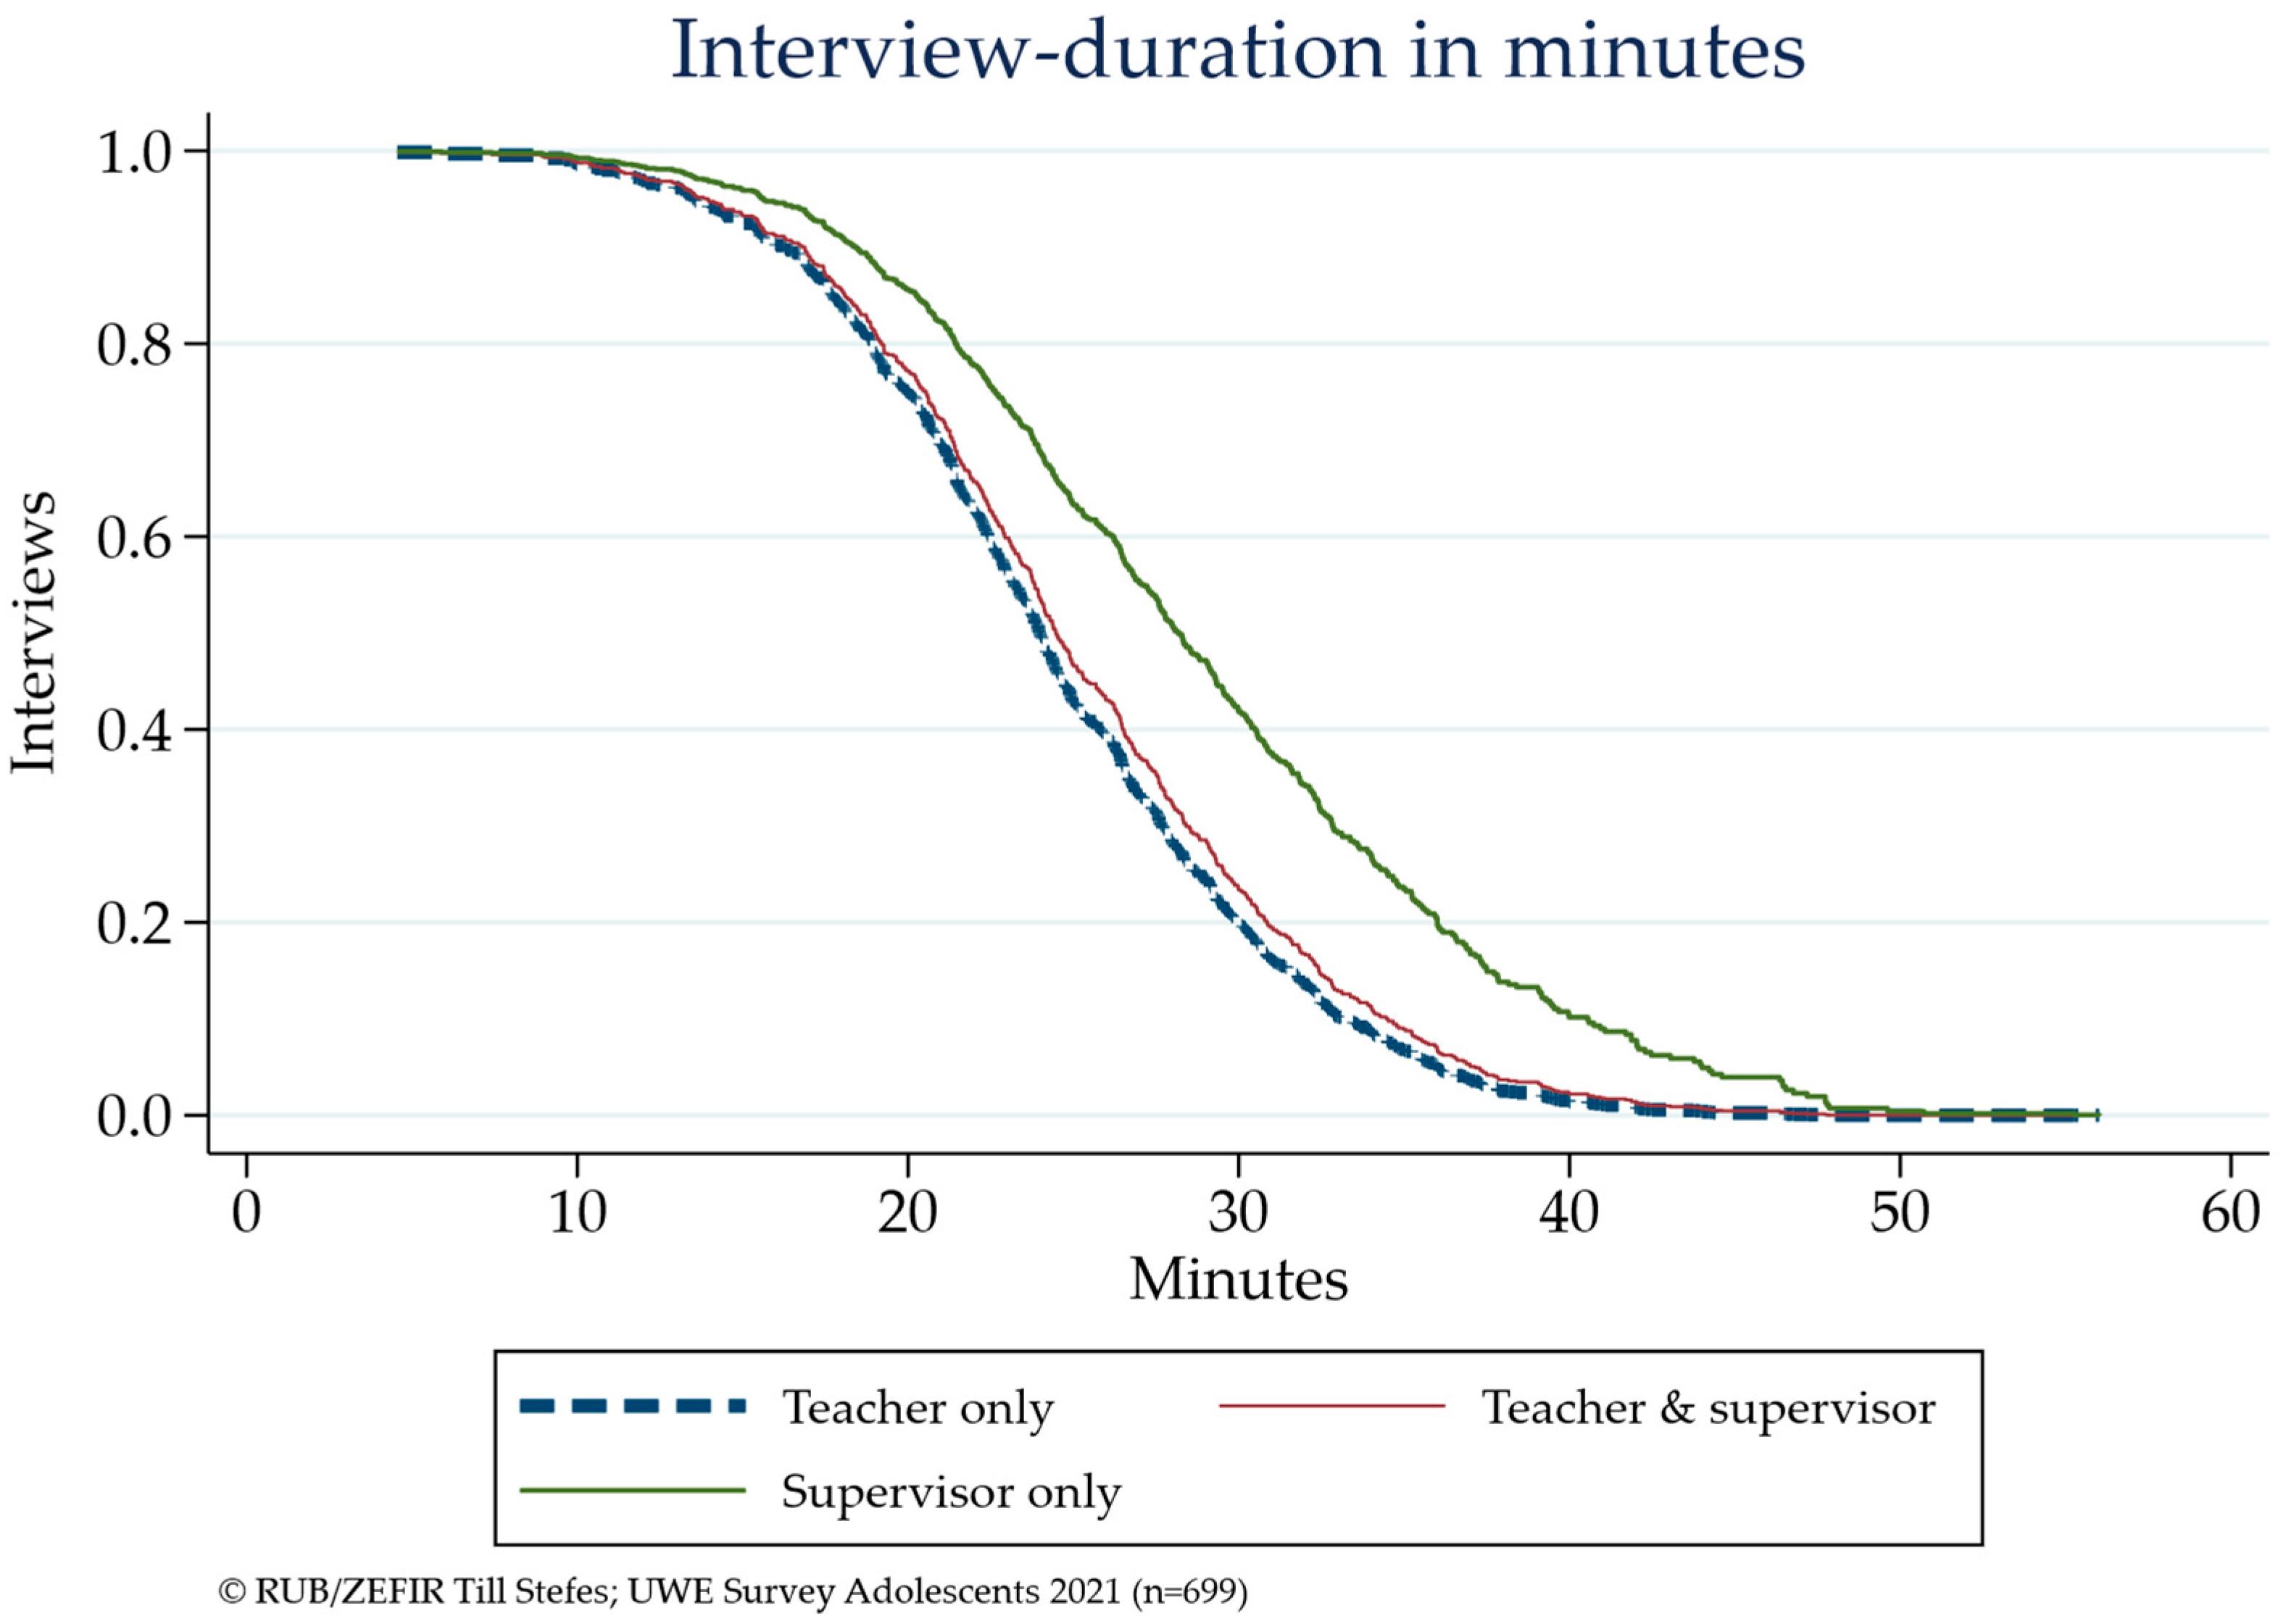
4.3. Interview Duration

The survival curves depicted in Figure 3 show the predicted share of online questionnaires that are still open at the time points indicated by the x-axis based on a Cox regression analysis. The dashed line represents interviews supervised by teachers only, while the thin red line stands for sessions with teachers and additional support by external supervisors. Both trajectories are hardly distinguishable. They differ from the third, thick green line. Students who took the survey at home, virtually supervised by external staff, took more time on average to complete the survey. After 30 min, around 80% of the former had finished, while in the latter group, less than 60% had finished.
If the hazard ratio for an exemplary predictor is 1.2, it means that, on average, the hazard (risk) of the event occurring is 20% higher for each one-unit increase in the predictor variable. Assuming linear effects of the explanatory variables, each year of age means an increase in the hazard of 20%, meaning that older students finished the survey faster. Interview duration is the only indicator that differs significantly by age. Conversely, if the hazard ratio was 0.56 (supervisor-only mode), it would suggest that, on average, the hazard of the event is 44% lower for each one-unit decrease in the predictor variable. Interestingly, literacy did not have an effect. School types differed, with high secondary schools hosting shorter sessions on average than the other two types.

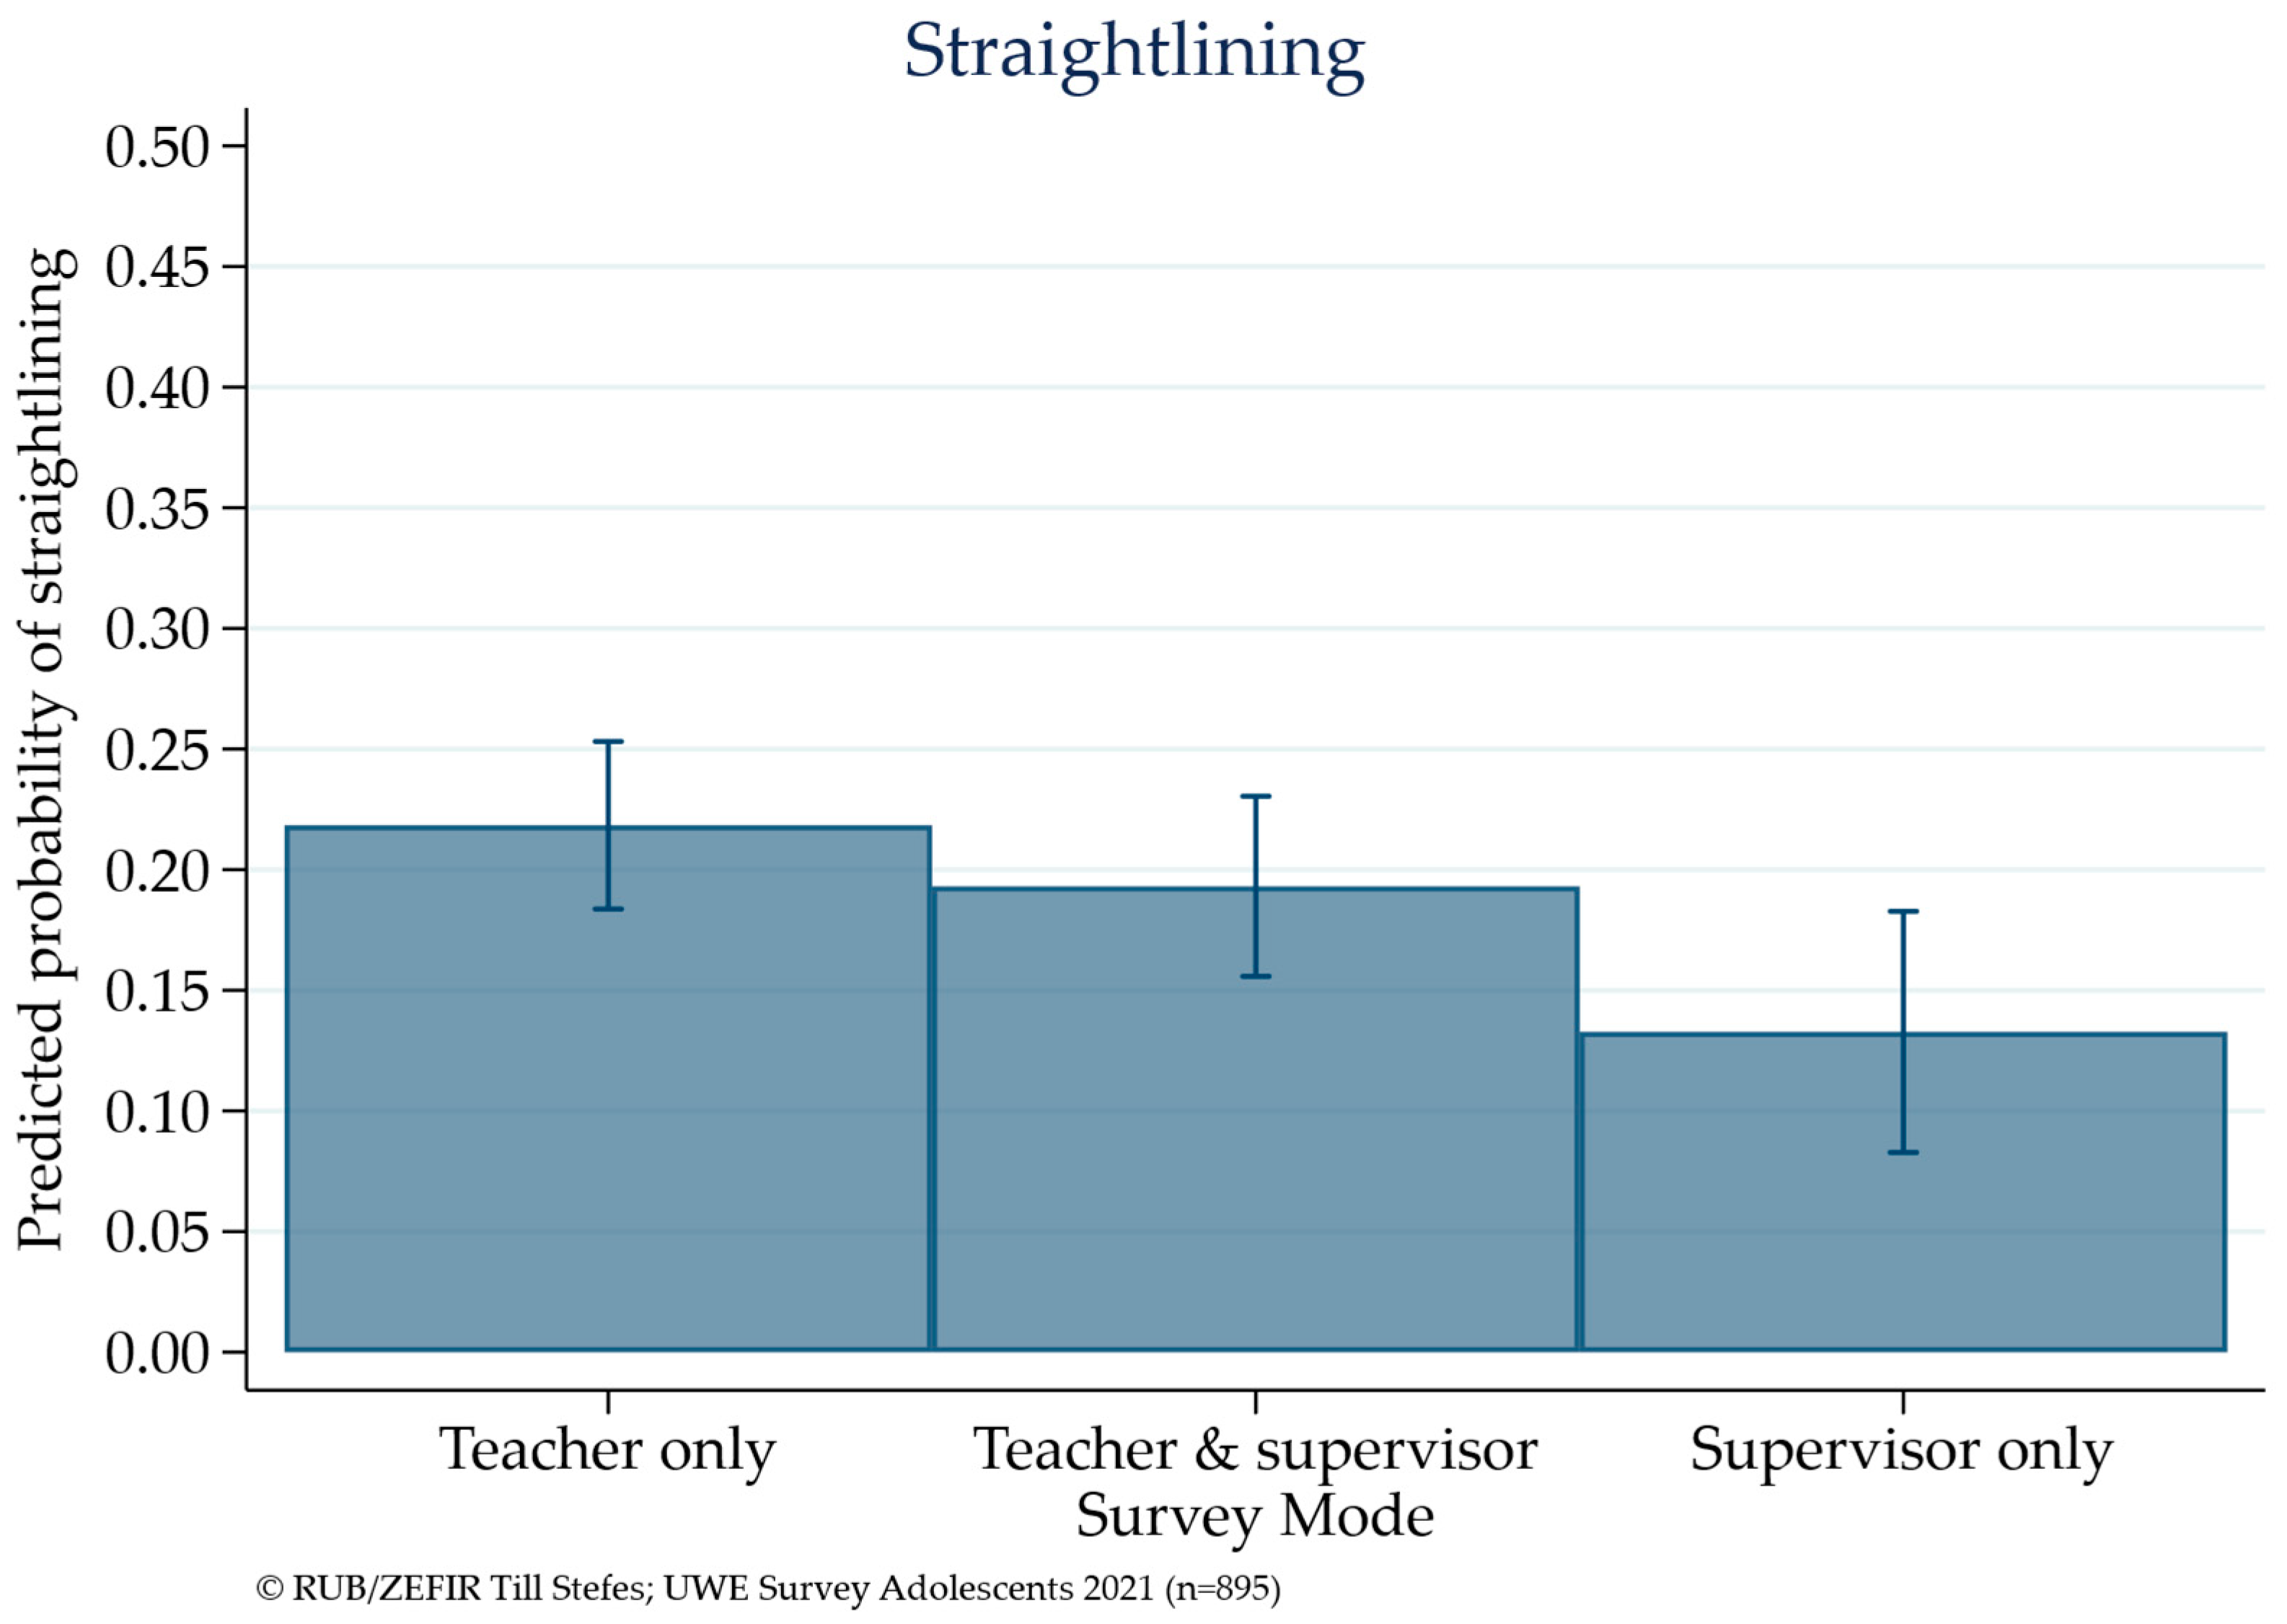
4.4. Straight-Lining

Figure 4 illustrates the predicted probability of manifesting suspected satisficing response behavior—discerned by the presence of a straight line in at least one out of six item batteries. On average, questionnaires completed in schools were more likely to contain straight lines in the grids. The difference is only significant between students solely supervised by teachers compared to students surveyed at home. The probabilities are relatively high for the former group, exceeding 20%.
The full figures of the analysis of straight-lining feature two significant effects. In addition to the mode of supervision, gender seems to make a difference in response behavior: girls were less likely to resort to straight-lining. In all other predictors, no effects can be reported.

5. Discussion

A successful recruitment process can be seen as a prerequisite for high data quality, and the previous literature shows that schools can be quite efficient partners in this endeavor [3,4,5,10,18]. This study does not question this notion but advises carefully assessing the potential effects of involving school staff when it comes to data collection. Hatch et al. [16] suggested working with school officials and personnel as as closely possible; a conclusion that was based on considerations about response rates. This claim is valid, as the loss of a single school during the process can threaten the representativeness of the whole sample [10,51]. The main message of this publication is that, apart from recruitment, the involvement of school staff in standardized survey research in classrooms should be limited to a minimum, based on the analyses of teacher supervision and attempts at external intervention.

5.1. Implications

Researchers cannot expect teachers or non-professional staff to deliver high-quality and unbiased survey data without further training. While there is a reasonable claim that any supervision can increase completion rates and the validity of survey data when surveying adolescents [5,14], supervision may not be unproblematic in any case. Two key factors speak against teachers supervising survey research: they can make lousy research assistants [5,13,15], and they can increase social desirability or related response bias unintentionally [8,17,23,26,27]. The results of the analyses in this article suggest the conclusion that data quality is lower when teachers are responsible for data collection, with regard to item nonresponse and the prevalence of satisficing patterns.
The finding that virtual external supervision is not successful in making a difference in data quality compared to teacher-only modes implies that this form of intervention is insufficient. In light of the potential compromise of data quality, the literature suggests that the introduction of external supervisors, acting as neutral parties well-versed in survey conduct, may serve as a valuable countermeasure. External supervisors have been shown to increase motivation [5,13] and contribute to a neutral atmosphere [13], potentially enhancing the data collection process. While teachers are usually present in schools anyway, (additional) external supervision is expensive [4,5,9]. Thus, the decision to involve them or not requires justification. This study tested two possible ways to ensure external supervision. Additional supervisors were present virtually in a video conference while teachers were present in the classroom. This mode, labeled “Mode B”, had a minimal effect on data quality. The efforts invested in establishing this mode were found to be disproportionately high in comparison to its impact on data quality. “Mode C” yielded considerably better results and did not involve teachers and classrooms in the first place. However, this study is limited in that it cannot determine whether the enhanced data quality in certain modes is a result of the supervisor or the setting.
The traditional paper questionnaire is still a valid choice in contemporary survey research, while digital solutions require a thorough examination of the necessary infrastructure, including internet connectivity and devices, to ensure a reliable research environment. The study contributes to the debate on whether web surveys or digital questionnaires work better in self-administered surveys as opposed to paper forms. In addition to the evident advantage of eliminating the need for transcribing digitally delivered questionnaires, early research, in particular, supports digital questionnaires for their favorable impact on anonymity, reducing item nonresponse associated with social desirability [1,25]. More recent studies indicate that the data quality of digital surveys is on par with traditional paper forms [2,21,33], given that all formats and devices function as intended [28]. Moreover, there is a notable inclination among younger respondents towards favoring digital delivery [13]. In contrast, the results presented here indicate a higher drop-out rate among respondents using the online questionnaire. There are two explanations for this, which are backed by the protocols of the UWE study. Firstly, intermittent disruptions in the connection between digital devices and the survey server occurred. This was primarily attributed to limited infrastructure in schools and respondents’ devices occasionally lacking sufficient charge. Secondly, a paper form does not go away when closed, posing a higher barrier to dropping out. However, when drop-outs were excluded from the analyses, item nonresponse and the prevalence of satisficing did not differ between the modes.

5.2. Limitations

Based on the data structure and the proceedings in the field, the results presented cannot distinguish whether the enhanced data quality of Mode C compared to the modes involving teachers was a result of the supervisor or the setting. Future research should ideally investigate the impact of external supervisors in classrooms in the absence of teachers and explore teachers’ supervision of web surveys conducted in students’ homes. Additionally, the data collection in UWE did not feature a completely unsupervised survey mode, which is a clear limitation. The “supervisor only” mode could be considered almost unsupervised, as there was no physical presence of any adult and no risk of responses being exposed to a third party. Mühlböck et al. [22] examined differences between web surveys with interviewers present and modes without supervision and found none in terms of response behavior, but higher completion rates were found in the supervised groups. Both findings are contradicted by this study, as drop-out rates did not differ significantly, but satisficing response patterns were more prevalent in physically supervised modes compared to virtual supervision and are in line with Tourangeau and Smith [25], who concluded that self-administration could yield better results indeed.
The quasi-experimental nature of this study could be considered a potential limitation, and it would be worthwhile to conduct further research using randomly assigned supervision modes. However, respondents did not self-select into supervision modes. The assignment was completely external and based on decisions of the school boards, depending on factors completely unrelated to respondents’ competencies or motivation to fill out a questionnaire. Hence, the differences in item nonresponse and response patterns are valid arguments for future research to not rely on teachers alone when conducting standardized survey research in classrooms.

6. Conclusions

In light of the analyses conducted in this study, several key conclusions emerge, shedding light on the crucial aspects of conducting standardized survey research in classroom settings. The central message resonating from this publication emphasizes the need to restrict the involvement of school staff, particularly teachers, to a minimum capacity beyond the recruitment phase.
Limitations of Teacher Involvement: The analyses of teacher supervision and attempts at external intervention underscore the challenges associated with relying on teachers or non-professional staff for survey data collection. It becomes evident that without specialized training, researchers cannot anticipate high-quality and unbiased survey data from untrained supervisors. The investigation reveals a clear correlation between the involvement of teachers in data collection and diminished data quality. Noteworthy differences surface concerning item nonresponse and the prevalence of satisficing patterns, emphasizing the necessity for cautious consideration when assigning responsibility for data collection.
Insufficiency of Virtual External Supervision: Contrary to expectations, the study highlights the inadequacy of virtual external supervision in enhancing data quality compared to teacher-only modes. This insight prompts a re-evaluation of the efficacy of such interventions, suggesting a need for more robust strategies or alternative approaches. Also, more research is necessary to gain potential differences in results when external supervisors are physically present.
Continued Viability of Traditional Paper Questionnaires: In the realm of contemporary survey research, paper questionnaires remain a viable and reliable choice. While digital delivery has been shown to be superior in terms of item nonresponse and satisficing patterns, the study emphasizes the necessity of conducting a thorough evaluation of digital infrastructure when considering digital survey solutions. The utilization of adolescents’ personal devices for survey participation introduces a potential challenge to data continuity, as variations in device quality, low battery levels, or other technical constraints may contribute to increased drop-out rates.
Contrasting Findings and Potential for Further Research: Variances in findings between this study and previous research, particularly regarding drop-out rates and satisficing response patterns, warrant further investigation. Since the quasi-experimental nature of this study limits the representativeness of the results, future research is called to utilize randomly assigned supervision modes to corroborate and expand upon these insights.
In conclusion, this study contributes insights into the nuanced dynamics of survey research in educational settings, emphasizing the need for meticulous planning, training, and consideration of alternative modes to enhance the reliability and quality of data collection.

Funding

This research received no external funding.

Institutional Review Board Statement

Ethical review and approval were waived for this study because no especially vulnerable research participants took part in the research. Respondents were informed that their participation was anonymous and voluntary. Written parental informed consent from the research participants was acquired, as is required in Germany by law. The original study was prospectively approved by the legal office and data protection officer of the Ruhr-University Bochum before the fieldwork started.

Informed Consent Statement

Informed consent was obtained from all subjects involved in the study.

Data Availability Statement

A scientific use-file for the research conducted in this paper is available and can be found in the CESSDA Data Catalogue under DOI 10.7802/2613. Some of the variables necessary for reproduction are excluded but available upon request.

Conflicts of Interest

The authors declare no conflicts of interest.

References

  1. Hallfors, D.; Khatapoush, S.; Kadushin, C.; Watson, K.; Saxe, L. A comparison of paper vs computer-assisted self-interview for school alcohol, tobacco, and other drug surveys. Eval. Program Plan. 2000, 23, 149–155. [Google Scholar] [CrossRef]
  2. Lucia, S.; Herrmann, L.; Killias, M. How important are interview methods and questionnaire designs in research on self-reported juvenile delinquency? An experimental comparison of Internet vs paper-and-pencil questionnaires and different definitions of the reference period. J. Exp. Criminol. 2007, 3, 39–64. [Google Scholar] [CrossRef]
  3. Alibali, M.W.; Nathan, M.J. Conducting Research in Schools: A Practical Guide. J. Cogn. Dev. 2010, 11, 397–407. [Google Scholar] [CrossRef]
  4. Bartlett, R.; Wright, T.; Olarinde, T.; Holmes, T.; Beamon, E.R.; Wallace, D. Schools as Sites for Recruiting Participants and Implementing Research. J. Community Health Nurs. 2017, 34, 80–88. [Google Scholar] [CrossRef] [PubMed]
  5. March, A.; Ashworth, E.; Mason, C.; Santos, J.; Mansfield, R.; Stapley, E.; Deighton, J.; Humphrey, N.; Tait, N.; Hayes, D. ‘Shall We Send a Panda?’ A Practical Guide to Engaging Schools in Research: Learning from Large-Scale Mental Health Intervention Trials. Int. J. Environ. Res. Public Health 2022, 19, 3367. [Google Scholar] [CrossRef]
  6. Kann, L.; Brener, N.; Warren, C.; Collins, J.; Giovino, G. An assessment of the effect of data collection setting on the prevalence of health risk behaviors among adolescents. J. Adolesc. Health 2002, 31, 327–335. [Google Scholar] [CrossRef]
  7. Brener, N.D.; Eaton, D.K.; Kann, L.; Grunbaum, J.A.; Gross, L.A.; Kyle, T.M.; Ross, J.G. The Association of Survey Setting and Mode with Self-Reported Health Risk Behaviors among High School Students. Public Opin. Q. 2006, 70, 354–374. [Google Scholar] [CrossRef]
  8. Cops, D.; De Boeck, A.; Pleysier, S. School vs. mail surveys: Disentangling selection and measurement effects in self-reported juvenile delinquency. Eur. J. Criminol. 2016, 13, 92–110. [Google Scholar] [CrossRef]
  9. Walser, S.; Killias, M. Who should supervise students during self-report interviews? A controlled experiment on response behavior in online questionnaires. J. Exp. Criminol. 2012, 8, 17–28. [Google Scholar] [CrossRef]
  10. Ellonen, N.; Pösö, T.; Mielityinen, L.; Paavilainen, E. Using self-report surveys in schools to study violence in alternative care: A methodological approach. Child Abus. Rev. 2023, 32, e2814. [Google Scholar] [CrossRef]
  11. Kivivuori, J.; Salmi, V.; Walser, S. Supervision mode effects in computerized delinquency surveys at school: Finnish replication of a Swiss experiment. J. Exp. Criminol. 2013, 9, 91–107. [Google Scholar] [CrossRef]
  12. Gomes, H.S.; Farrington, D.P.; Maia, Â.; Krohn, M.D. Measurement bias in self-reports of offending: A systematic review of experiments. J. Exp. Criminol. 2019, 15, 313–339. [Google Scholar] [CrossRef]
  13. Demkowicz, O.; Ashworth, E.; Mansfield, R.; Stapley, E.; Miles, H.; Hayes, D.; Burrell, K.; Moore, A.; Deighton, J. Children and young people’s experiences of completing mental health and wellbeing measures for research: Learning from two school-based pilot projects. Child Adolesc. Psychiatry Ment. Health 2020, 14, 35. [Google Scholar] [CrossRef]
  14. Bidonde, J.; Meneses-Echavez, J.F.; Hafstad, E.; Brunborg, G.S.; Bang, L. Methods, strategies, and incentives to increase response to mental health surveys among adolescents: A systematic review. BMC Med. Res. Methodol. 2023, 23, 270. [Google Scholar] [CrossRef]
  15. Rasberry, C.N.; Rose, I.; Kroupa, E.; Hebert, A.; Geller, A.; Morris, E.; Lesesne, C.A. Overcoming Challenges in School-Wide Survey Administration. Health Promot. Pract. 2018, 19, 110–118. [Google Scholar] [CrossRef]
  16. Hatch, L.M.; Widnall, E.C.; Albers, P.N.; Hopkins, G.L.; Kidger, J.; de Vocht, F.; Kaner, E.; van Sluijs, E.M.F.; Fairbrother, H.; Jago, R.; et al. Conducting school-based health surveys with secondary schools in England: Advice and recommendations from school staff, local authority professionals, and wider key stakeholders, a qualitative study. BMC Med. Res. Methodol. 2023, 23, 142. [Google Scholar] [CrossRef] [PubMed]
  17. Strange, V.; Forest, S.; Oakley, A.; Ripple Study Team. Using research questionnaires with young people in schools: The influence of the social context. Int. J. Soc. Res. Methodol. 2003, 6, 337–346. [Google Scholar] [CrossRef]
  18. Heath, S.; Brooks, R.; Cleaver, E.; Ireland, E. Researching Young People’s Lives; Sage: Atlanta, GA, USA, 2009. [Google Scholar]
  19. Gassman-Pines, A.; Ananat, E.O.; Fitz-Henley, J. COVID-19 and Parent-Child Psychological Well-being. Pediatrics 2020, 146, e2020007294. [Google Scholar] [CrossRef] [PubMed]
  20. Goh, E.C.L.; Rafie, N.H.B. Using whatsApp video call to reach large survey sample of low-income children during COVID-19: A mixed method post-hoc analysis. Int. J. Soc. Res. Methodol. 2023. [Google Scholar] [CrossRef]
  21. Felderer, B.; Kirchner, A.; Kreuter, F. The Effect of Survey Mode on Data Quality: Disentangling Nonresponse and Measurement Error Bias. J. Off. Stat. 2019, 35, 93–115. [Google Scholar] [CrossRef]
  22. Mühlböck, M.; Steiber, N.; Kittel, B. Less Supervision, More Satisficing? Comparing Completely Self-Administered Web-Surveys and Interviews Under Controlled Conditions. Stat. Politi. Policy 2017, 8, 13–28. [Google Scholar] [CrossRef]
  23. Atkeson, L.R.; Adams, A.N.; Alvarez, R.M. Nonresponse and Mode Effects in Self- and Interviewer-Administered Surveys. Politi. Anal. 2014, 22, 304–320. [Google Scholar] [CrossRef]
  24. Brown, B.; Larson, J. Peer relationships in adolescence. In Handbook of Adolescent Psychology; Lerner, R., Steinberg, L., Eds.; Wiley: Hoboken, NJ, USA, 2009; pp. 74–103. [Google Scholar]
  25. Tourangeau, R.; Smith, T.W. Asking Sensitive Questions: The Impact of Data Collection Mode, Question Format, and Question Context. Public Opin. Q. 1996, 60, 275–304. [Google Scholar] [CrossRef]
  26. Möhring, W.; Schlütz, D. Das Interview als soziale Situation. In Die Befragung in der Medien-und Kommunikationswissenschaft; Springer VS: Wiesbaden, Germany, 2019; pp. 41–67. [Google Scholar]
  27. Duncan, G.J.; Magnuson, K. Socioeconomic status and cognitive functioning: Moving from correlation to causation. WIREs Cogn. Sci. 2012, 3, 377–386. [Google Scholar] [CrossRef] [PubMed]
  28. Gummer, T.; Roßmann, J. Explaining Interview Duration in Web Surveys. Soc. Sci. Comput. Rev. 2015, 33, 217–234. [Google Scholar] [CrossRef]
  29. Epstein, D. “Are you a girl or are you a teacher?” The ‘least adult’ role in research about gender and sexuality in a primary school. In Doing Research about Education; Walford, G., Ed.; Falmer Press: London, UK, 1998. [Google Scholar]
  30. Deakin, H.; Wakefield, K. Skype interviewing: Reflections of two PhD researchers. Qual. Res. 2014, 14, 603–616. [Google Scholar] [CrossRef]
  31. Weller, S. Using internet video calls in qualitative (longitudinal) interviews: Some implications for rapport. Int. J. Soc. Res. Methodol. 2017, 20, 613–625. [Google Scholar] [CrossRef]
  32. Hennessey, A.; Demkowicz, O.; Pert, K.; Mason, C.; Bray, L.; Ashworth, E. Using Creative Approaches and Facilitating Remote Online Focus Groups with Children and Young People: Reflections, Recommendations and Practical Guidance. Int. J. Qual. Methods 2022, 21, 16094069221142454. [Google Scholar] [CrossRef]
  33. Raat, H.; Mangunkusumo, R.T.; Landgraf, J.M.; Kloek, G.; Brug, J. Feasibility, reliability, and validity of adolescent health status measurement by the Child Health Questionnaire Child Form (CHQ-CF): Internet administration compared with the standard paper version. Qual. Life Res. 2007, 16, 675–685. [Google Scholar] [CrossRef]
  34. Leiner, D.J. SoSci Survey, Version 3.2.24; Computer Software; 2021. Available online: https://www.soscisurvey.de (accessed on 9 March 2024).
  35. Stefes, T. Umwelt, Wohlbefinden und Entwicklung von Kindern und Jugendlichen (UWE) Befragung 2021; GESIS: Köln, Germany, 2023. [Google Scholar] [CrossRef]
  36. Schwabe, K.; Albrecht, M.; Stefes, T.; Petermann, S. Konzeption und Durchführung der UWE-Befragung 2019. In ZEFIR Materialien Band 17; Zentrum für Interdisziplinäre Regionalforschung (ZEFIR): Bochum, Germany, 2021. [Google Scholar]
  37. Stefes, T.; Lemke, A.; Gaffron, V.; Knüttel, K.; Schuchardt, J.; Petermann, S. Konzeption und Durchführung der UWE-Befragung 2021. In ZEFIR Materialien Band 22; Zentrum für Interdisziplinäre Regionalforschung (ZEFIR): Bochum, Germany, 2023. [Google Scholar]
  38. Knüttel, K.; Stefes, T.; Albrecht, M.; Schwabe, K.; Gaffron, V.; Petermann, S. Wie geht’s Dir? Ungleiche Voraussetzungen für das Subjektive Wohlbefinden von Kindern in Familie, Schule und Stadtteil; Bertelsmann Stiftung: Gütersloh, Germany, 2021. [Google Scholar] [CrossRef]
  39. Heeringa, S.G.; West, B.T.; Berglund, P.A. Applied Survey Data Analysis; CRC Press: Boca Raton, FL, USA, 2017. [Google Scholar]
  40. Niu, L. A review of the application of logistic regression in educational research: Common issues, implications, and suggestions. Educ. Rev. 2020, 72, 41–67. [Google Scholar] [CrossRef]
  41. Gummer, T.; Bach, R.L.; Daikeler, J.; Eckman, S. The relationship between response probabilities and data quality in grid questions. Surv. Res. Methods 2021, 15, 65–77. [Google Scholar]
  42. Leiner, D.J. Too Fast, too Straight, too Weird: Non-Reactive Indicators for Meaningless Data in Internet Surveys. Surv. Res. Methods 2019, 13, 229–248. [Google Scholar] [CrossRef]
  43. Wagner, J. The Fraction of Missing Information as a Tool for Monitoring the Quality of Survey Data. Public Opin. Q. 2010, 74, 223–243. [Google Scholar] [CrossRef]
  44. Wagner, J. A Comparison of Alternative Indicators for the Risk of Nonresponse Bias. Public Opin. Q. 2012, 76, 555–575. [Google Scholar] [CrossRef] [PubMed]
  45. Little, R.J. A test of missing completely at random for multivariate data with missing values. J. Am. Stat. Assoc. 1988, 83, 1198–1202. [Google Scholar] [CrossRef]
  46. Little, R.J. Regression with missing X’s: A review. J. Am. Stat. Assoc. 1992, 87, 1227–1237. [Google Scholar] [CrossRef]
  47. Türkan, S.; Özel, G. A Jackknifed estimators for the negative binomial regression model. Commun. Stat. Simul. Comput. 2018, 47, 1845–1865. [Google Scholar] [CrossRef]
  48. Revilla, M.; Ochoa, C. What are the Links in a Web Survey Among Response Time, Quality, and Auto-Evaluation of the Efforts Done? Soc. Sci. Comput. Rev. 2015, 33, 97–114. [Google Scholar] [CrossRef]
  49. Tourangeau, R.; Couper, M.P.; Conrad, F.G. The Science of Web Surveys; Oxford University Press: Oxford, UK, 2013. [Google Scholar]
  50. Braekers, R.; Veraverbeke, N. Cox’s regression model under partially informative censoring. Commun. Stat. Theory Methods 2005, 34, 1793–1811. [Google Scholar] [CrossRef]
  51. Newransky, C.; Kyriakakis, S.; Samaroo, K.D.; Owens, D.D.; Abu Hassan Shaari, A. Ethical and Methodological Challenges of Implementing Social Work Survey Research in Schools: A Perspective from the Suburban United States. Int. J. Sch. Soc. Work 2020, 5, 4. [Google Scholar] [CrossRef]
Figure 1. Predicted probability of drop-out by mode of supervision (logistic regression; full figures in Table 3).
Education 14 00299 g001
Figure 2. Predicted item nonresponse by mode of supervision (negative binomial regression; full figures in Table 4).
Education 14 00299 g002
Figure 3. Predicted interview duration in minutes by mode of supervision (Cox regression; full figures in Table 5).
Education 14 00299 g003
Figure 4. Predicted probability of having at least one occurrence of straight-lining by mode of supervision (logistic regression; full figures in Table 6).
Education 14 00299 g004
Table 1. Descriptive statistics.
VariableMeansdMinMaxN
Individual Characteristics
Age13.841.241217923
Gender: Female0.540.5001923
Literacy Problems: Yes0.020.1501923
Migration Background: Yes0.410.4901923
School: Comprehensive Secondary Track0.380.4901923
School: High secondary Track0.490.5001923
School: Practical Secondary Track0.260.4401923
Interview Characteristics
Delivery: Web survey0.220.4101923
Teacher only (A)0.490.5001923
Teacher and supervisor (B)0.380.4901923
Data Quality Indicators
Drop-out: Yes0.040.1901923
Item nonresponse count8.1224.060186923
Interview Duration (Minutes)21.0310.76256923
Occurrences of straight-lining0.280.6604923
Table 2. Supervision modes in surveyed schools.
School(A)
Teacher Only
(B)
Teacher & Supervisor
(C)
Supervisor Only
Response Rate
Comprehensive secondary track 1 XX11%
Comprehensive secondary track 2 X 38%
Comprehensive secondary track 3X 41%
High secondary track 1 XX49%
High secondary track 2XX 77%
High secondary track 3X 64%
Practical secondary track 1X 64%
Practical secondary track 2XX 53%
Practical secondary track 3X 37%
Table 3. Interview drop-outs—logistic regression results.
Coef.St. Err.z-Valuep-Value[95% ConfInterval]Sig
Respondent characteristics:
Gender: Female0.0690.3410.200.84−0.60.737
Age−0.0140.153−0.920.36−0.4390.16
Problems with reading German1.8290.7782.350.0190.3053.353**
Migration background0.5460.3391.610.108−0.1191.21
Interview characteristics:
Web survey14.2521.28811.07011.72816.776***
Teacher only (base)------
Teacher & supervisor−1.3310.487−2.730.006−2.286−0.376***
Supervisor only−0.5790.706−0.820.412−1.9630.804
School type:
High secondary (base)
------
Comprehensive secondary0.3060.5040.610.544−0.6821.295
Practical secondary−15.5661.205−12.920−17.928−13.204***
Constant−1.0722.152−0.500.618−5.2893.145
Mean dependent var0.037SD dependent var0.188
Pseudo r-squared0.097Number of obs923
Chi-square513.943Prob > chi20.000
Akaike crit. (AIC)283.499Bayesian crit. (BIC)331.840
*** p < 0.01, ** p < 0.05, * p < 0.1.
Table 4. Item nonresponse—negative binomial regression results.
Coef.St. Err.z-Valuep-Value[95% ConfInterval]Sig
Respondent characteristics:
Gender−0.1650.171−0.970.335−0.4990.17
Age0.020.0570.350.729−0.0920.132
Problems with reading German−0.0240.666−0.040.971−01.331.282
Migration background0.1540.1151.330.182−0.0720.38
Interview characteristics:
Web Survey−0.7880.378−2.080.037−1.529−0.047**
Teacher only (base)------
Teacher & supervisor0.1790.2230.800.422−0.2590.617
Supervisor only−0.420.241−1.740.081−0.8920.052*
School type:
High secondary (base)
- - - - - -
Comprehensive secondary0.8170.2423.380.0010.3431.292***
Practical secondary1.860.3884.7901.0992.62***
Constant0.410.8880.460.645−1.3312.15
lnalpha0.4750.101--0.2780.672
Mean dependent var4.068SD dependent var9.815
Pseudo r-squared0.042Number of obs895
Chi-square169.814Prob > chi20.000
Akaike crit. (AIC)4158.635Bayesian crit. (BIC)4211.400
*** p < 0.01, ** p < 0.05, * p < 0.1.
Table 5. Interview duration—Cox regression results.
Hazard RatioRobust St. Err.z-Valuep-Value[95% ConfInterval]Sig
Respondent characteristics:
Gender: Female0.990.075−0.140.8920.8531.149
Age1.2060.0494.600.0001.1141.307***
Problems with reading German0.8630.273−0.470.640.4641.603
Migration background0.9480.072−0.700.4840.8171.1
Interview characteristics:
Teacher only (base)------
Teacher & supervisor0.9210.123−0.610.540.7091.198
Supervisor only0.5610.125−2.600.0090.3620.867***
School type:
High secondary (base)
- - - - - -
Comprehensive secondary0.6540.091−3.060.0020.4980.858***
Practical secondary0.230.073−4.620.0000.1230.429***
Mean dependent var25.654SD dependent var7.935
Pseudo r-squared0.013Number of obs699
Chi-square62.718Prob > chi20.000
Akaike crit. (AIC)7683.672 Bayesian crit. (BIC)7720.069
*** p < 0.01, ** p < 0.05, * p < 0.1.
Table 6. Straight-lining—logistic regression results.
Coef.St. Err.z-Valuep-Value[95% ConfInterval]Sig
Respondent characteristics:
Gender: Female−0.7450.186−4.010.000−1.109−0.381***
Age−0.0840.066−1.260.208−0.2140.046
Problems with reading German0.2610.4560.570.568−0.6331.154
Migration background−0.1130.16−0.710.478−0.4270.2
Interview characteristics:
Web survey−0.2340.292−0.800.424−0.8060.339
Teacher only (base)------
Teacher & supervisor−0.2830.209−1.350.176−0.6930.127
Supervisor only−0.6030.301−2.010.045−1.192−0.014**
School type:
High secondary (base)
- - - - - -
Comprehensive secondary0.1070.240.450.656−0.3630.577
Practical secondary−0.030.287−0.100.917−0.5940.533
Constant0.3560.9470.380.707−1.52.211
Mean dependent var0.198SD dependent var0.399
Pseudo r-squared0.031Number of obs895
Chi-square31.717Prob > chi20.000
Akaike crit. (AIC)882.369Bayesian crit. (BIC)930.337
*** p < 0.01, ** p < 0.05, * p < 0.1.
Disclaimer/Publisher’s Note: The statements, opinions and data contained in all publications are solely those of the individual author(s) and contributor(s) and not of MDPI and/or the editor(s). MDPI and/or the editor(s) disclaim responsibility for any injury to people or property resulting from any ideas, methods, instructions or products referred to in the content.

