


How to Evaluate Augmented Reality Embedded in Lesson Planning in Teacher Education

 , , ,
, , ,  and
and 
Abstract
1. Introduction
- Which categorizations, according to Czok et al. [32], can be found in augmented reality embedded in teaching scenarios created by pre-service teacher students in a master’s seminar for teacher education?
- How can the quality of the embedding of augmented reality in teaching be evaluated?
- To what extent can the deductively derived structuring of the categorizations be mapped to reliable subscales?
- To what extent does the quality of an AR learning environment determine the overall quality of the lesson planning integrating this AR learning environment?
2. Methods and Materials
2.1. Sample
2.2. Instrument
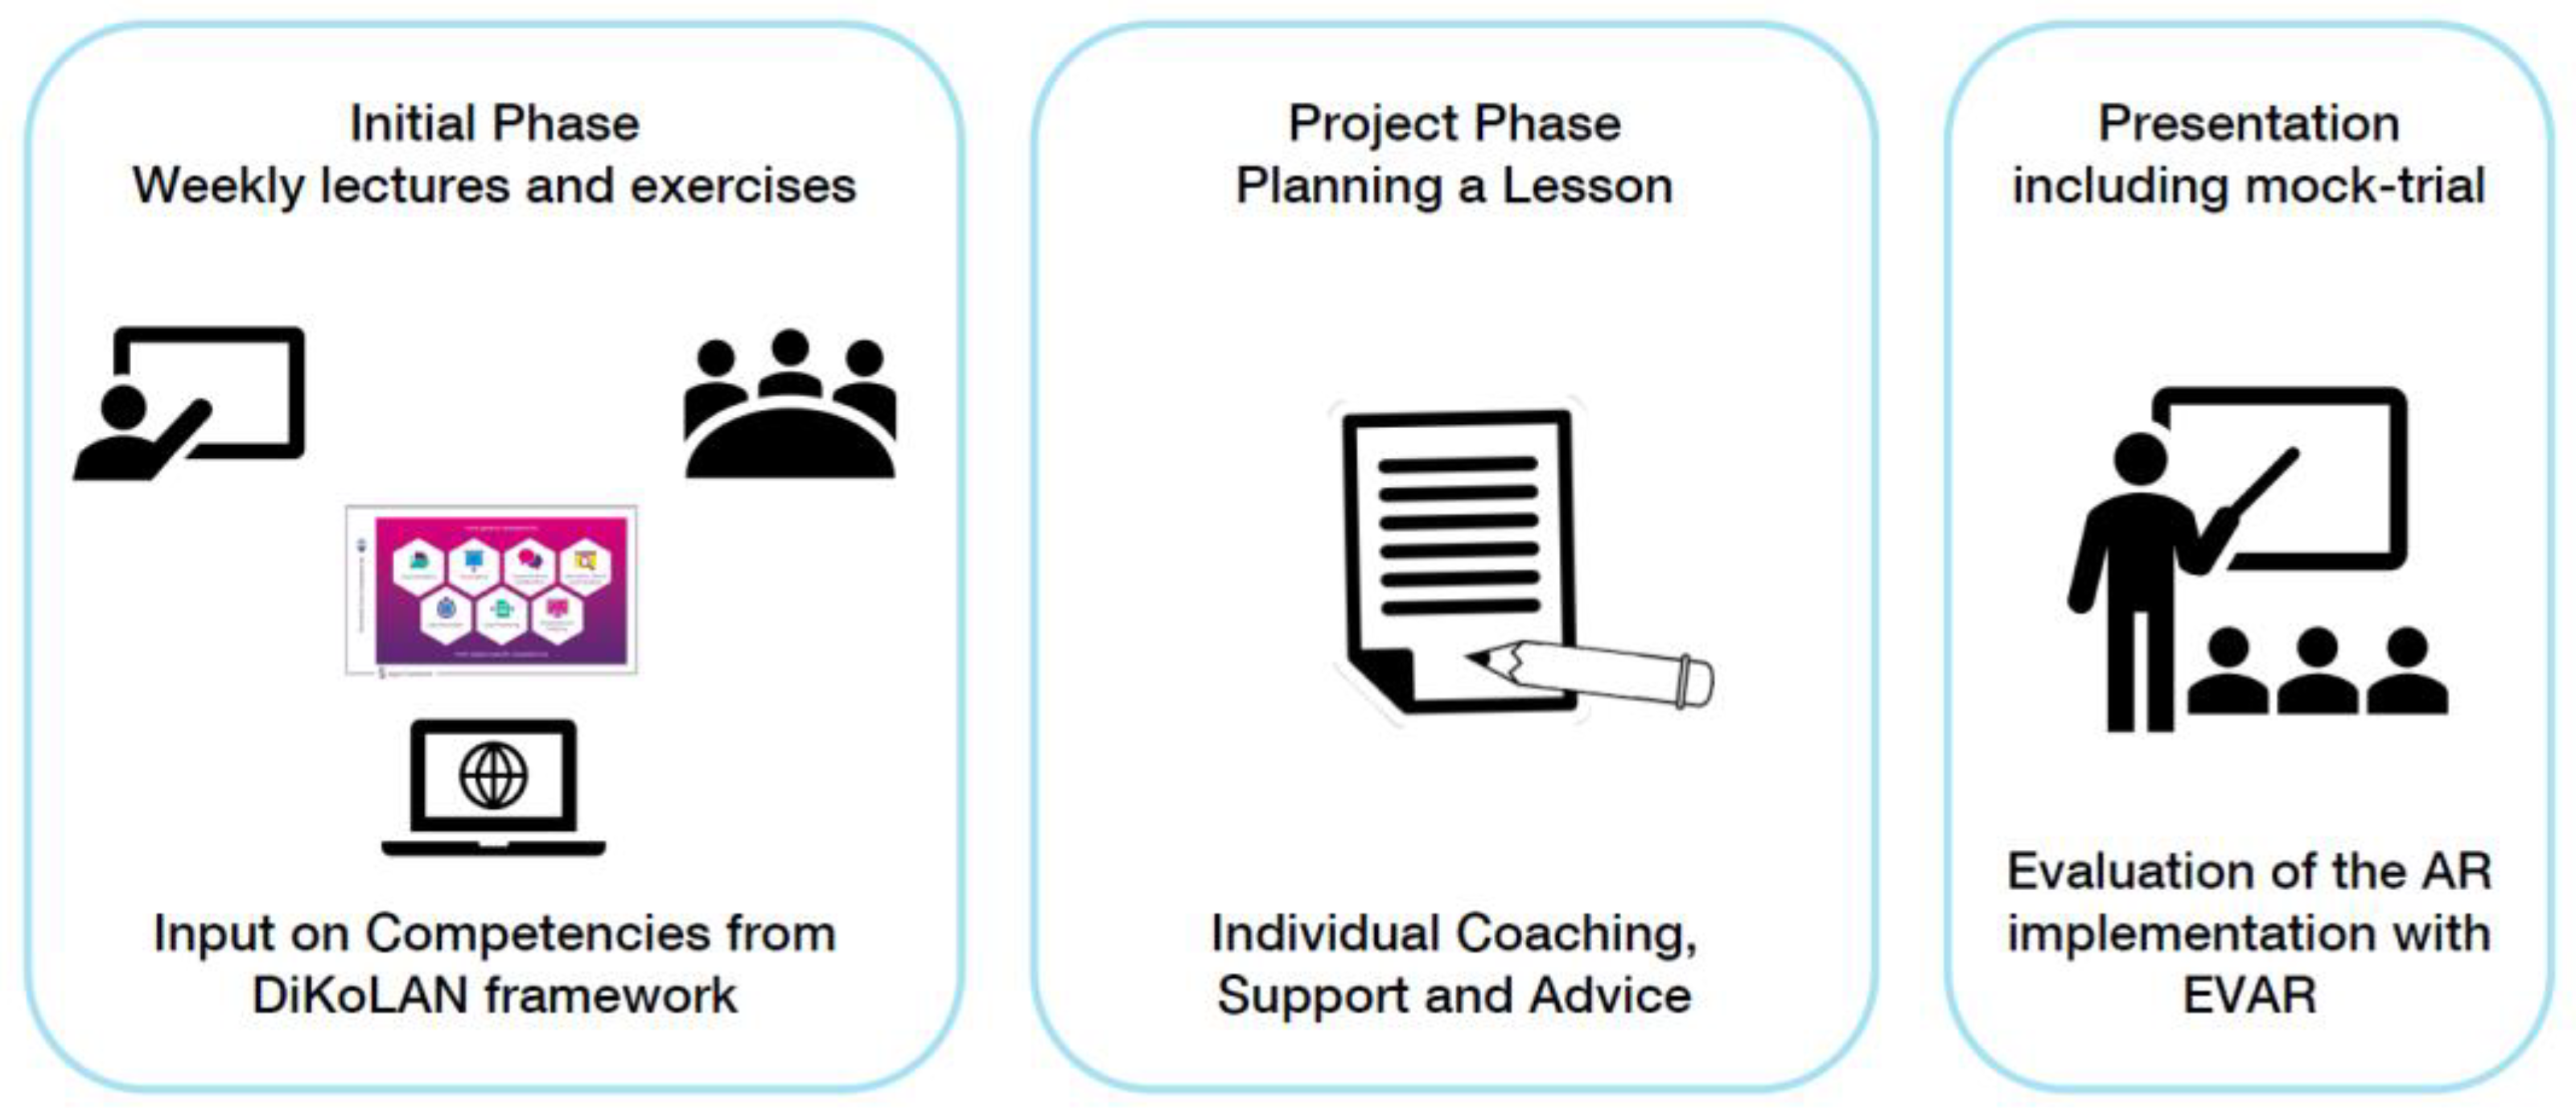
2.3. Study Design
2.4. Context
2.5. Statistical Analysis
3. Results
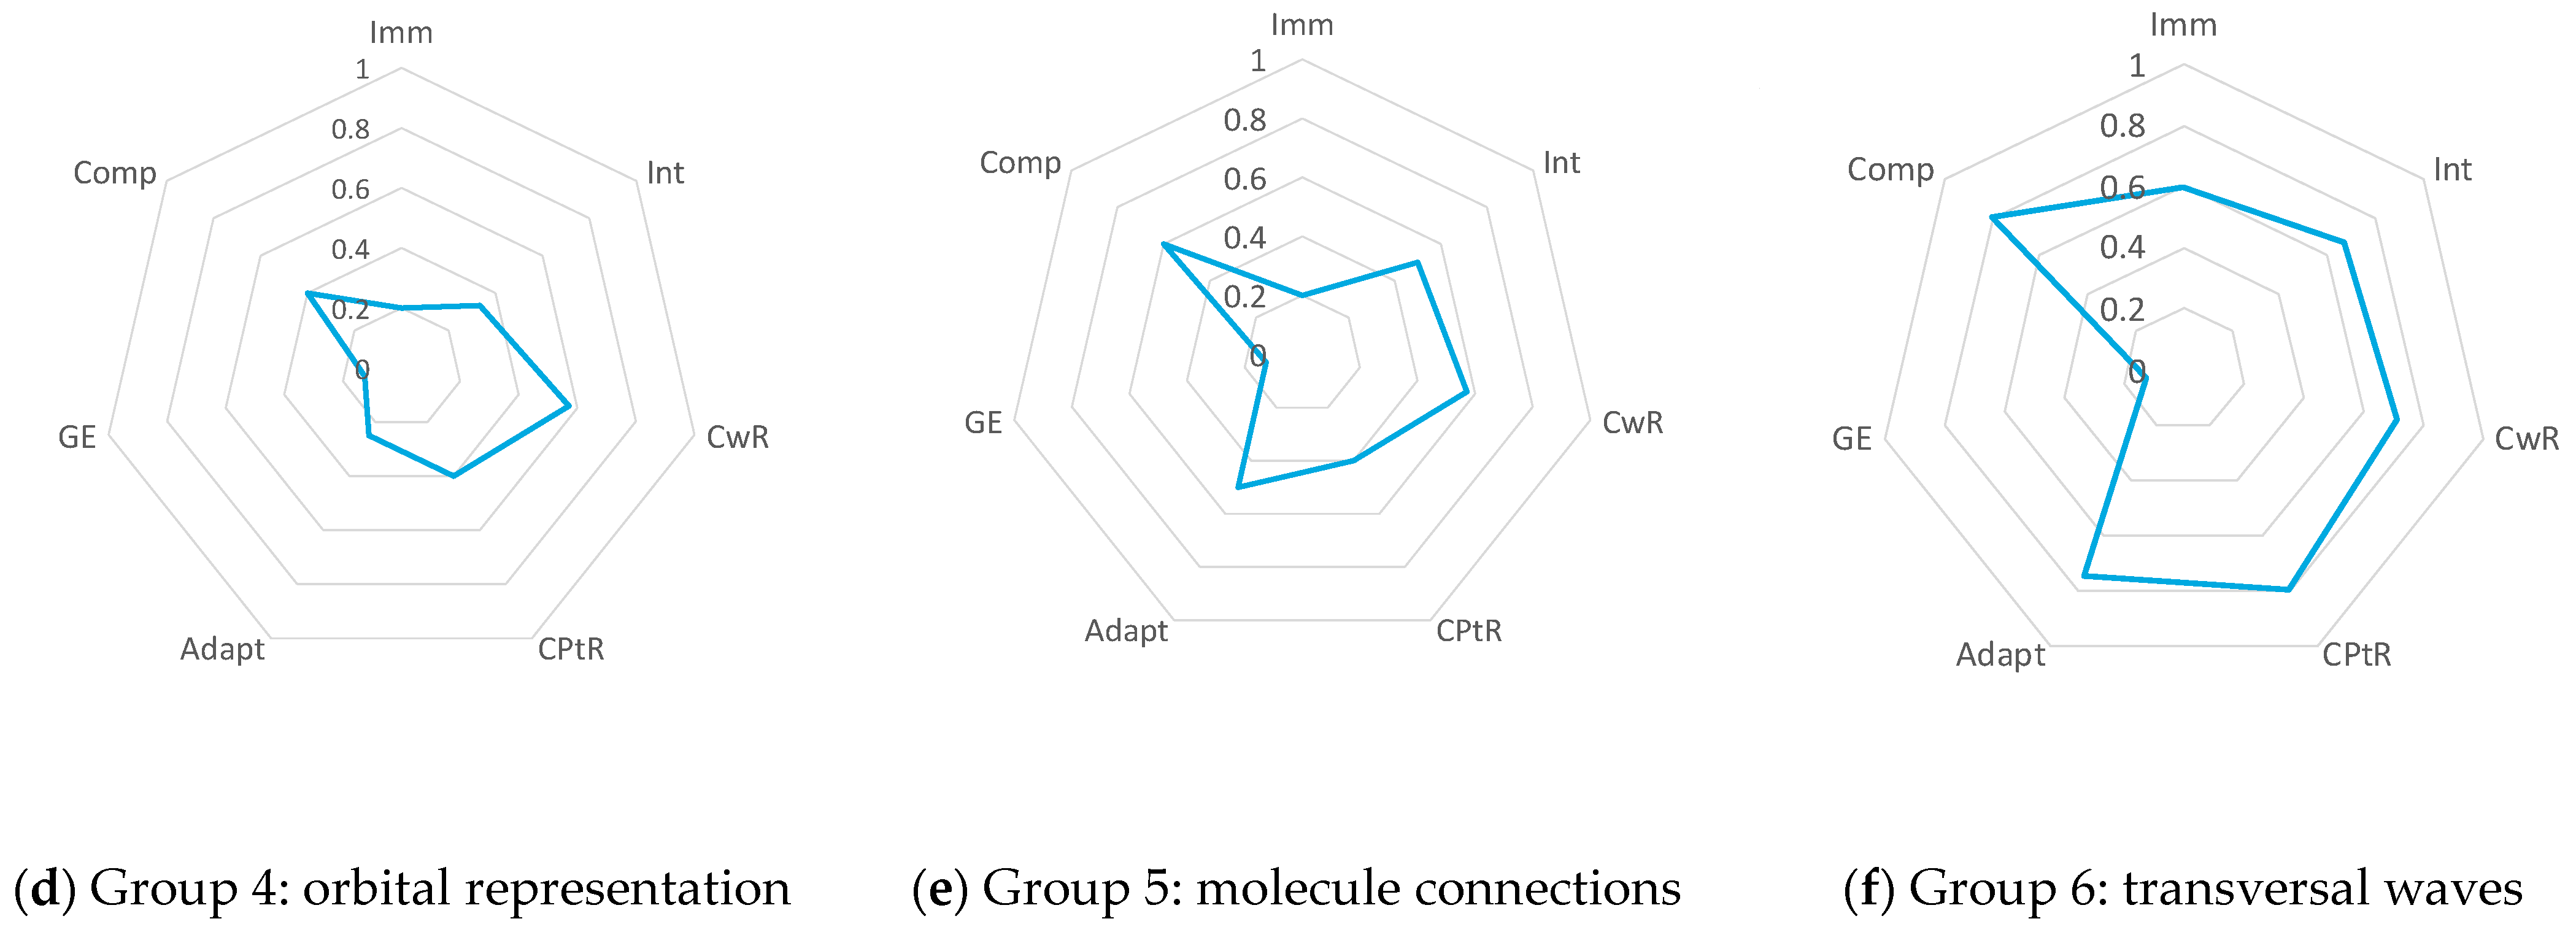
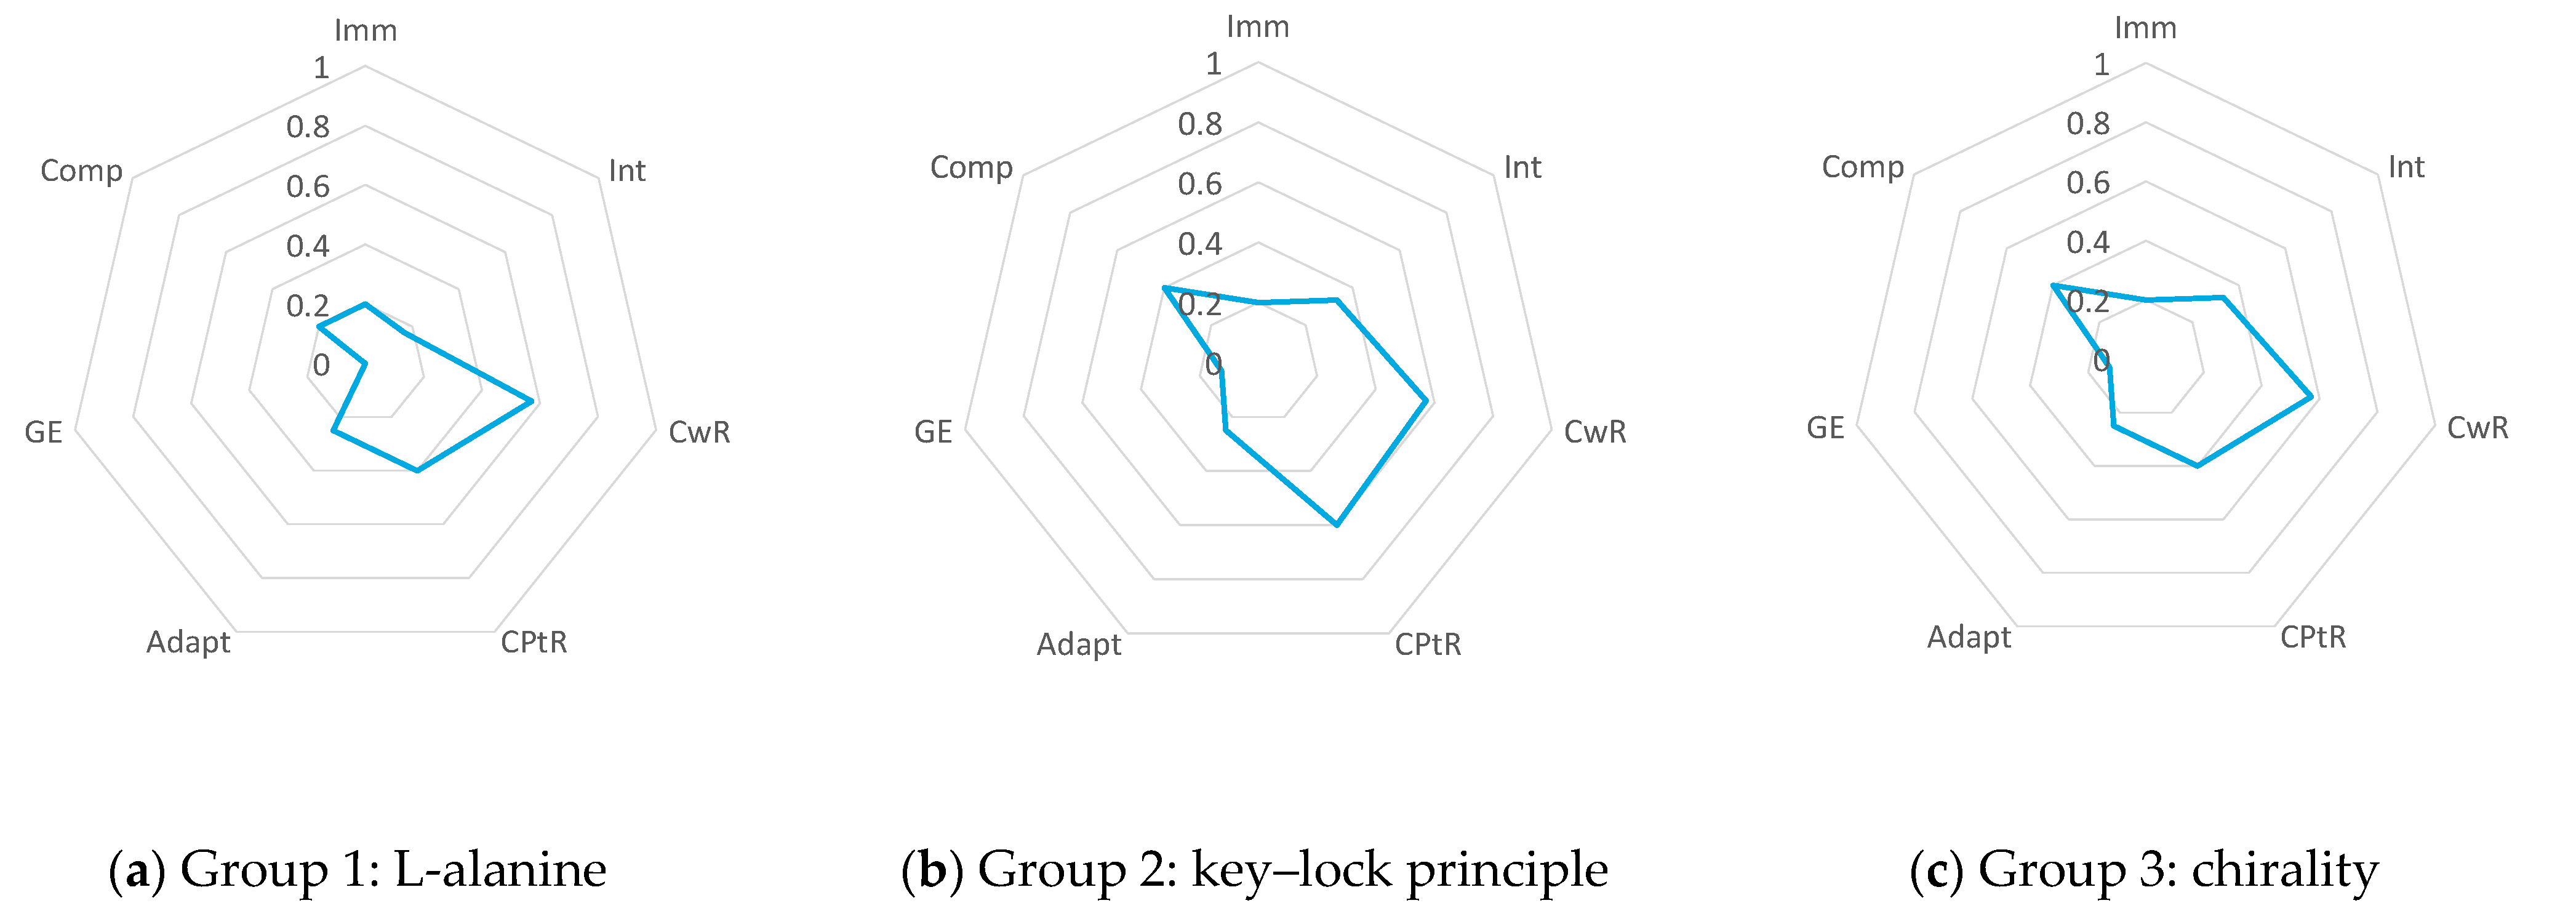
3.1. Characteristics of the AR Used
3.2. Evaluation of the Teaching Scenarios including AR
3.3. Reliability of the Rubric and Its Theoretically Derived Subscales
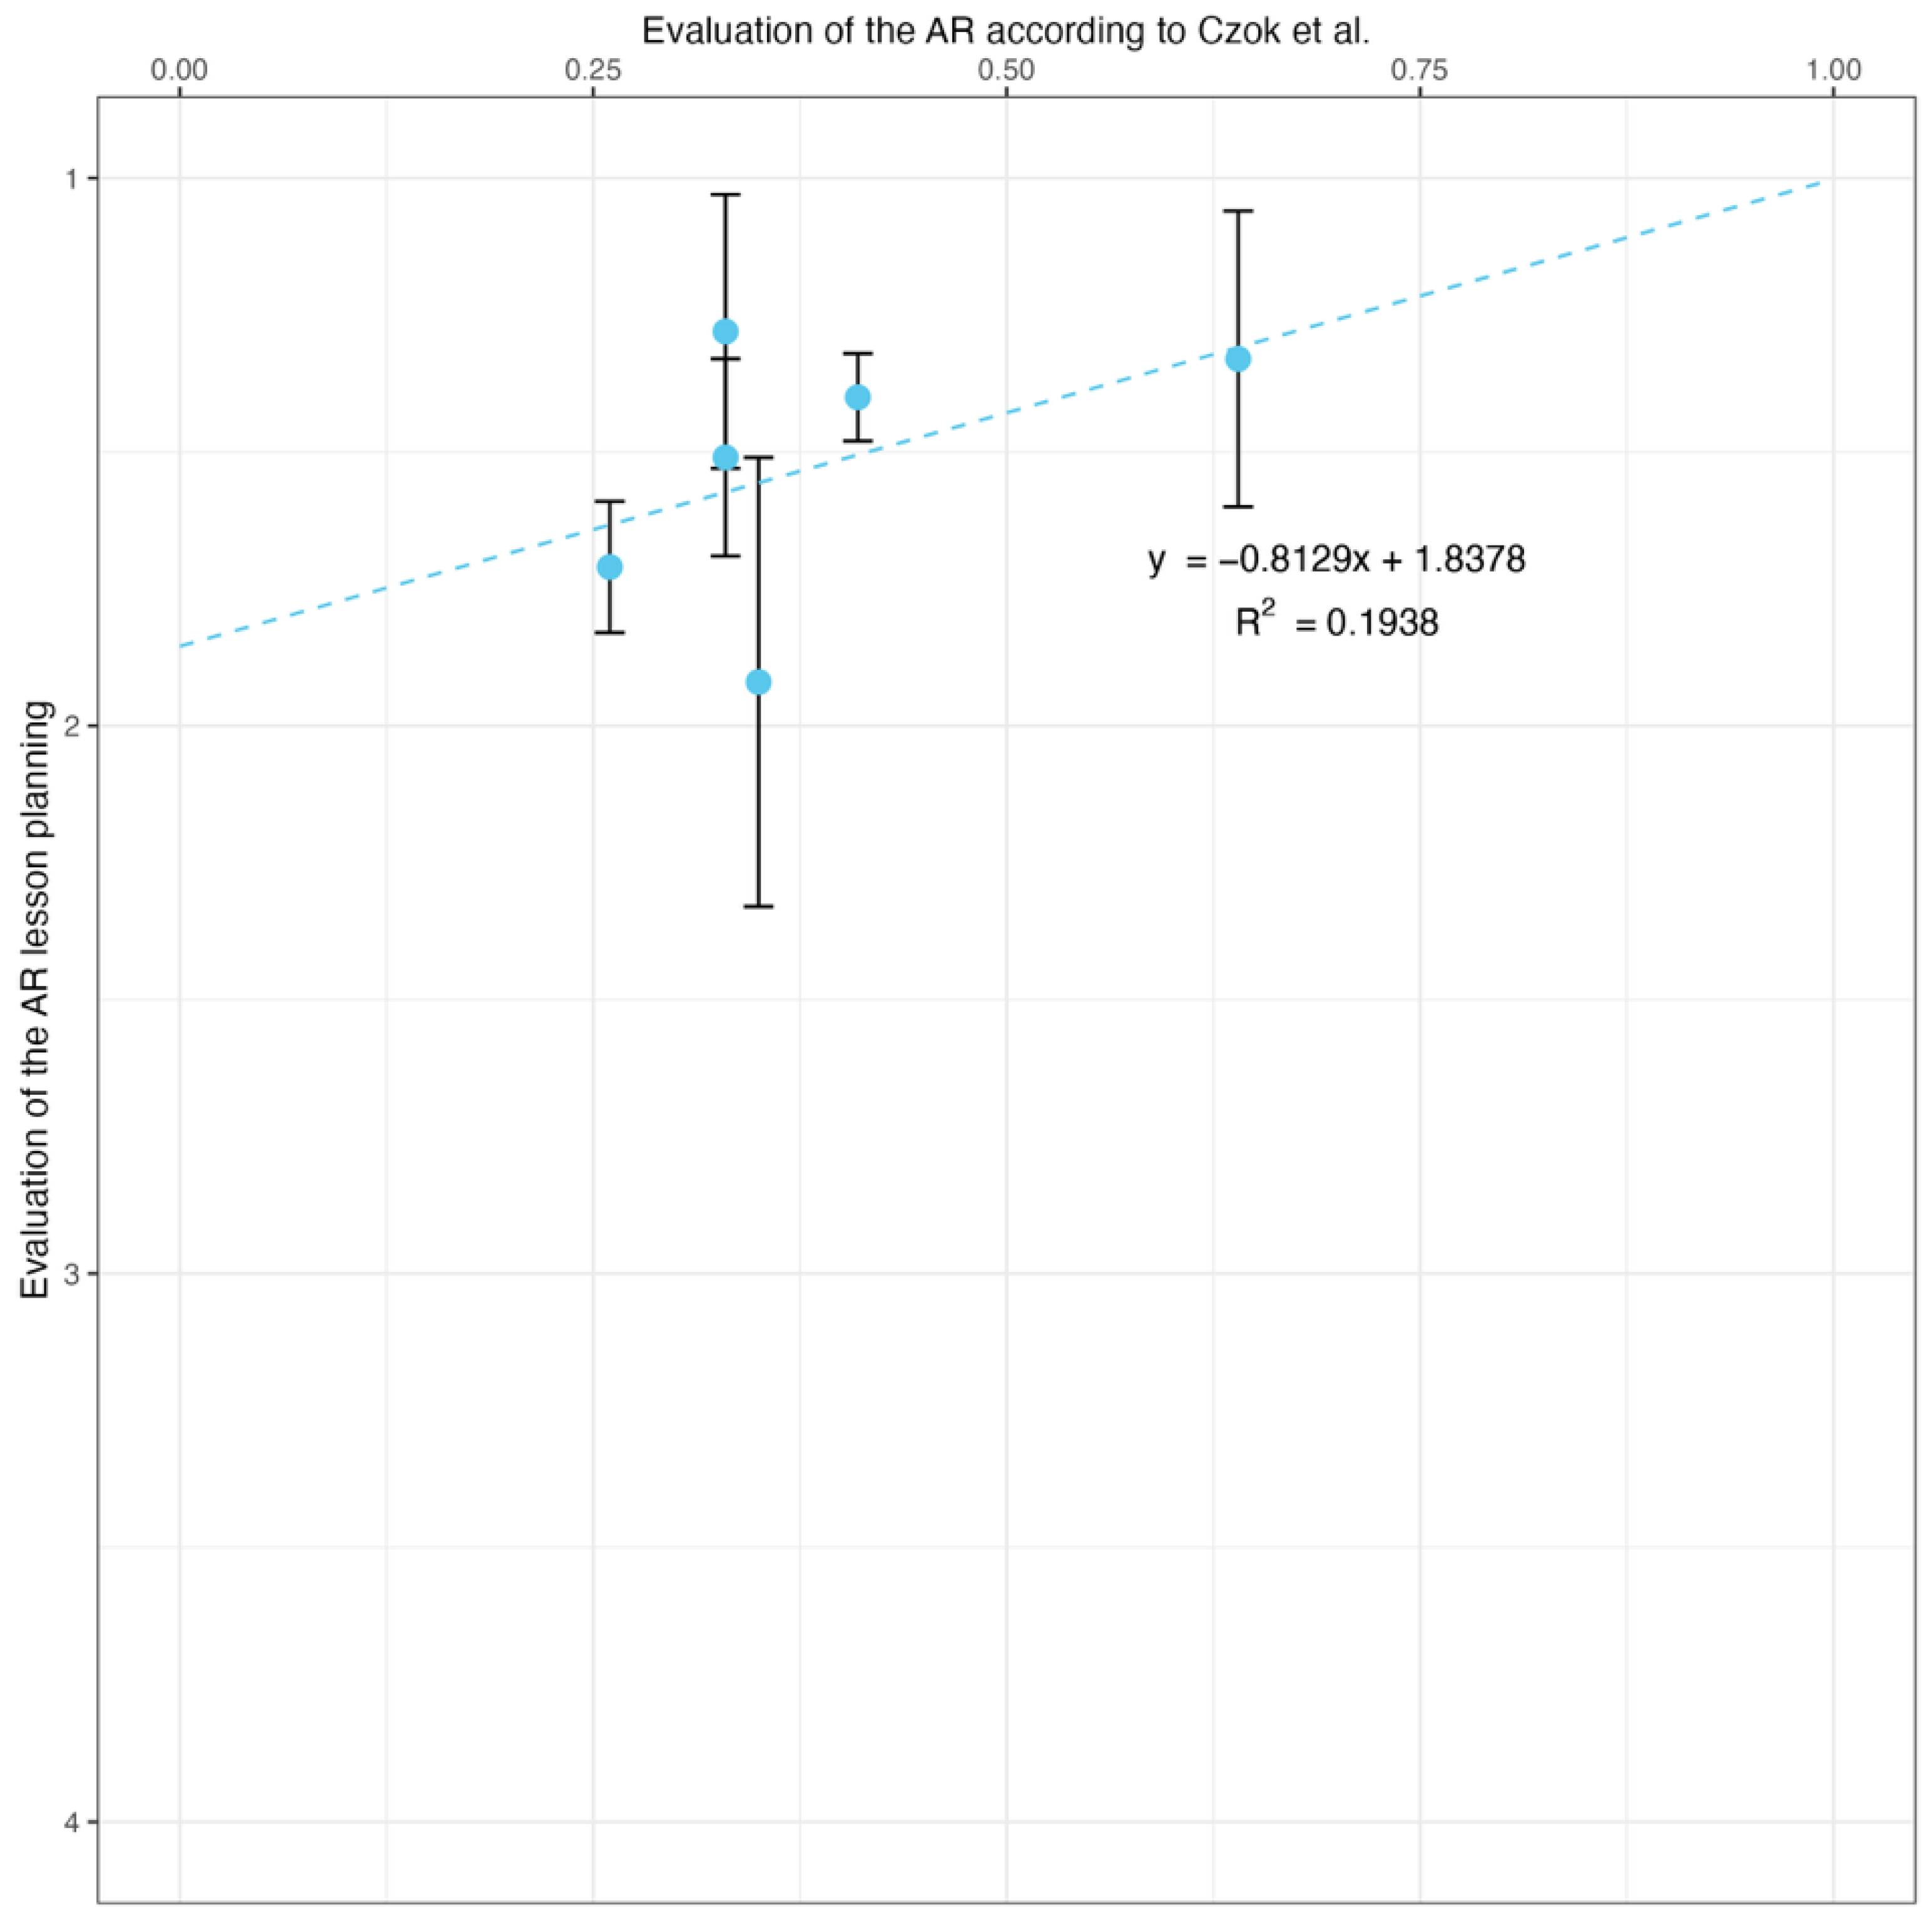
3.4. Relevance of the Quality of an AR Learning Environment for the Overall Quality of the Lesson Planning
4. Discussion
4.1. Characteristics of the AR Used
4.2. Evaluation of the Teaching Scenarios including AR
4.3. Reliability of the Rubric and Its Theoretically Derived Subscales
4.4. Relevance of the Quality of an AR Learning Environment for the Overall Quality of the Lesson Planning
4.5. Limitations
5. Conclusions
6. Declaration of AI and AI-Assisted Technologies in the Writing Process
Supplementary Materials
Author Contributions
Funding
Institutional Review Board Statement
Informed Consent Statement
Data Availability Statement
Acknowledgments
Conflicts of Interest
References
- Cao, J.; Lam, K.-Y.; Lee, L.-H.; Liu, X.; Hui, P.; Su, X. Mobile Augmented Reality: User Interfaces, Frameworks, and Intelligence. ACM Comput. Surv. 2023, 55, 1–36. [Google Scholar] [CrossRef]
- Gomollón-Bel, F. IUPAC Top Ten Emerging Technologies in Chemistry 2022. Chem. Int. 2022, 44, 4–13. [Google Scholar] [CrossRef]
- Milgram, P.; Takemura, H.; Utsumi, A.; Kishino, F. Augmented reality: A class of displays on the reality-virtuality continuum. In Proceedings of the Photonics for Industrial Applications; SPIE: Bellingham, WA, USA, 1995; pp. 282–292. [Google Scholar]
- Azuma, R.T. A survey of augmented reality. Presence-Virtual Augment. Real. 1997, 6, 355–385. [Google Scholar] [CrossRef]
- Cai, S.; Chiang, F.-K.; Sun, Y.; Lin, C.; Lee, J.J. Applications of augmented reality-based natural interactive learning in magnetic field instruction. Interact. Learn. Environ. 2017, 6, 778–791. [Google Scholar] [CrossRef]
- Cai, S.; Liu, C.; Wang, T.; Liu, E.; Liang, J.C. Effects of learning physics using Augmented Reality on students’ self-efficacy and conceptions of learning. Br. J. Educ. Technol. 2020, 52, 235–251. [Google Scholar] [CrossRef]
- Bacca Acosta, J.L.; Baldiris Navarro, S.M.; Fabregat Gesa, R.; Kinshuk, K. Framework for designing motivational augmented reality applications in vocational education and training. Australas. J. Educ. Technol. 2019, 35, 102–117. [Google Scholar] [CrossRef]
- Reid, N.; Shah, I. The role of laboratory work in university chemistry. Chem. Educ. Res. Pract. 2007, 8, 172–185. [Google Scholar] [CrossRef]
- Wojciechowski, R.; Cellary, W. Evaluation of learners’ attitude toward learning in ARIES augmented reality environments. Comput. Educ. 2013, 68, 570–585. [Google Scholar] [CrossRef]
- Erbas, C.; Demirer, V. The effects of augmented reality on students’ academic achievement and motivation in a biology course. J. Comput. Assist. Learn. 2019, 35, 450–458. [Google Scholar] [CrossRef]
- Khan, T.; Johnston, K.; Ophoff, J. The Impact of an Augmented Reality Application on Learning Motivation of Students. Adv. Hum. Comput. Interact. 2019, 2019, 7208494. [Google Scholar] [CrossRef]
- Huwer, J.; Barth, C.; Siol, A.; Eilks, I. Combining reflections on education for sustainability and digitalization—Learning with and about the sustainable use of tablets along an augmented reality learning environment. Chemkon 2021, 28, 235–240. [Google Scholar] [CrossRef]
- Akçayır, M.; Akçayır, G.; Pektaş, H.M.; Ocak, M.A. Augmented reality in science laboratories: The effects of augmented reality on university students’ laboratory skills and attitudes toward science laboratories. Comput. Hum. Behav. 2016, 57, 334–342. [Google Scholar] [CrossRef]
- Sahin, D.; Yilmaz, R.M. The effect of Augmented Reality Technology on middle school students’ achievements and attitudes towards science education. Comput. Educ. 2020, 144, 103710. [Google Scholar] [CrossRef]
- Akçayır, M.; Akçayır, G. Advantages and challenges associated with augmented reality for education: A systematic review of the literature. Educ. Res. Rev. 2017, 20, 1–11. [Google Scholar] [CrossRef]
- Albuquerque, G.; Sonntag, D.; Bodensiek, O.; Behlen, M.; Wendorff, N.; Magnor, M. A Framework for Data-Driven Augmented Reality. In Augmented Reality, Virtual Reality, and Computer Graphics; Springer: Berlin/Heidelberg, Germany, 2019; pp. 71–83. [Google Scholar]
- Cai, S.; Chiang, F.-K.; Wang, X. Using the Augmented Reality 3D Technique for a Convex Imaging Experiment in a Physics Course. Int. J. Eng. Educ. 2013, 29, 856–865. [Google Scholar]
- Osman, S. The Effect of Augmented Reality Application toward Student’s Learning Performance in PC Assembly. Int. J. Adv. Trends Comput. Sci. Eng. 2020, 9, 401–407. [Google Scholar] [CrossRef]
- Salmi, H.; Thuneberg, H.; Vainikainen, M.-P. Making the invisible observable by Augmented Reality in informal science education context. Int. J. Sci. Educ. Part B 2016, 7, 253–268. [Google Scholar] [CrossRef]
- Allcoat, D.; Hatchard, T.; Azmat, F.; Stansfield, K.; Watson, D.; von Mühlenen, A. Education in the Digital Age: Learning Experience in Virtual and Mixed Realities. J. Educ. Comput. Res. 2021, 59, 795–816. [Google Scholar] [CrossRef]
- Buchner, J.; Kerres, M. Media comparison studies dominate comparative research on augmented reality in education. Comput. Educ. 2023, 195, 104711. [Google Scholar] [CrossRef]
- Chao, J.; Chiu, J.L.; DeJaegher, C.J.; Pan, E.A. Sensor-Augmented Virtual Labs: Using Physical Interactions with Science Simulations to Promote Understanding of Gas Behavior. J. Sci. Educ. Technol. 2015, 25, 16–33. [Google Scholar] [CrossRef]
- Chiu, J.L.; DeJaegher, C.J.; Chao, J. The effects of augmented virtual science laboratories on middle school students’ understanding of gas properties. Comput. Educ. 2015, 85, 59–73. [Google Scholar] [CrossRef]
- De Micheli, A.J.; Valentin, T.; Grillo, F.; Kapur, M.; Schuerle, S. Mixed Reality for an Enhanced Laboratory Course on Microfluidics. J. Chem. Educ. 2022, 99, 1272–1279. [Google Scholar] [CrossRef]
- Fidan, M.; Tuncel, M. Integrating augmented reality into problem based learning: The effects on learning achievement and attitude in physics education. Comput. Educ. 2019, 142, 103635. [Google Scholar] [CrossRef]
- Garzón, J.; Acevedo, J. Meta-analysis of the impact of Augmented Reality on students’ learning gains. Educ. Res. Rev. 2019, 27, 244–260. [Google Scholar] [CrossRef]
- Hsiao, K.F.; Chen, N.S.; Huang, S.Y. Learning while exercising for science education in augmented reality among adolescents. Interact. Learn. Environ. 2012, 20, 331–349. [Google Scholar] [CrossRef]
- Lu, S.-J.; Liu, Y.-C.; Chen, P.-J.; Hsieh, M.-R. Evaluation of AR embedded physical puzzle game on students’ learning achievement and motivation on elementary natural science. Interact. Learn. Environ. 2018, 28, 451–463. [Google Scholar] [CrossRef]
- Tarng, W.; Lin, Y.-J.; Ou, K.-L. A Virtual Experiment for Learning the Principle of Daniell Cell Based on Augmented Reality. Appl. Sci. 2021, 11, 762. [Google Scholar] [CrossRef]
- Núñez-Redó, M.; Quirós, R.; Núñez, I.; Carda, J.; Camahort, E. Collaborative augmented reality for inorganic chemistry education. In Proceedings of the 5th WSEAS/IASME International Conference on Engineering Education, Vouliagmeni, Greece, 25–27 August 2008; pp. 271–277. [Google Scholar]
- Radu, I.; Schneider, B.; Machinery, A.C. What Can We Learn from Augmented Reality (AR)? Benefits and Drawbacks of AR for Inquiry-based Learning of Physics. In Proceedings of the 2019 CHI Conference on Human Factors in Computing Systems, Glasgow, UK, 4–9 May 2019. [Google Scholar]
- Czok, V.; Krug, M.; Müller, S.; Huwer, J.; Kruse, S.; Müller, W.; Weitzel, H. A Framework for Analysis and Development of Augmented Reality Applications in Science and Engineering Teaching. Educ. Sci. 2023, 13, 926. [Google Scholar] [CrossRef]
- Sirakaya, M.; Alsancak Sirakaya, D. Trends in Educational Augmented Reality Studies: A Systematic Review. Malays. Online J. Educ. Technol. 2018, 6, 60–74. [Google Scholar] [CrossRef]
- Thees, M.; Kapp, S.; Strzys, M.P.; Beil, F.; Lukowicz, P.; Kuhn, J. Effects of augmented reality on learning and cognitive load in university physics laboratory courses. Comput. Hum. Behav. 2020, 108, 106316. [Google Scholar] [CrossRef]
- Cai, S.; Wang, X.; Chiang, F.-K. A case study of Augmented Reality simulation system application in a chemistry course. Comput. Hum. Behav. 2014, 37, 31–40. [Google Scholar] [CrossRef]
- Jones, L.L.; Kelly, R.M. Visualization: The Key to Understanding Chemistry Concepts. In Sputnik to Smartphones: A Half-Century of Chemistry Education; ACS Symposium Series; American Chemical Society: Washington, DC, USA, 2015; Volume 1208, pp. 121–140. [Google Scholar]
- Rodríguez, F.C.; Frattini, G.; Krapp, L.F.; Martinez-Hung, H.; Moreno, D.M.; Roldán, M.; Salomón, J.; Stemkoski, L.; Traeger, S.; Dal Peraro, M.; et al. MoleculARweb: A Web Site for Chemistry and Structural Biology Education through Interactive Augmented Reality out of the Box in Commodity Devices. J. Chem. Educ. 2021, 98, 2243–2255. [Google Scholar] [CrossRef]
- Domínguez Alfaro, J.L.; Gantois, S.; Blattgerste, J.; De Croon, R.; Verbert, K.; Pfeiffer, T.; Van Puyvelde, P. Mobile Augmented Reality Laboratory for Learning Acid–Base Titration. J. Chem. Educ. 2022, 99, 531–537. [Google Scholar] [CrossRef]
- Fombona-Pascual, A.; Fombona, J.; Vicente, R. Augmented Reality, a Review of a Way to Represent and Manipulate 3D Chemical Structures. J. Chem. Inf. Model. 2022, 62, 1863–1872. [Google Scholar] [CrossRef]
- Wong, C.H.S.; Tsang, K.C.K.; Chiu, W.K. Using Augmented Reality as a Powerful and Innovative Technology to Increase Enthusiasm and Enhance Student Learning in Higher Education Chemistry Courses. J. Chem. Educ. 2021, 98, 3476–3485. [Google Scholar] [CrossRef]
- Mystakidis, S.; Fragkaki, M.; Filippousis, G. Ready Teacher One: Virtual and Augmented Reality Online Professional Development for K-12 School Teachers. Computers 2021, 10, 134. [Google Scholar] [CrossRef]
- Teichrew, A.; Erb, R. How augmented reality enhances typical classroom experiments: Examples from mechanics, electricity and optics. Phys. Educ. 2020, 55, 065029. [Google Scholar] [CrossRef]
- Wahyu, Y.; Suastra, I.W.; Sadia, I.W.; Suarni, N.K. The Effectiveness of Mobile Augmented Reality Assisted STEM-Based Learning on Scientific Literacy and Students’ Achievement. Int. J. Instr. 2020, 13, 343–356. [Google Scholar] [CrossRef]
- Eriksen, K.; Nielsen, B.E.; Pittelkow, M. Visualizing 3D Molecular Structures Using an Augmented Reality App. J. Chem. Educ. 2020, 97, 1487–1490. [Google Scholar] [CrossRef]
- Pan, Z.; López, M.F.; Li, C.; Liu, M. Introducing augmented reality in early childhood literacy learning. Res. Learn. Technol. 2021, 29, 2539. [Google Scholar] [CrossRef]
- Wu, H.K.; Lee, S.W.Y.; Chang, H.Y.; Liang, J.C. Current status, opportunities and challenges of augmented reality in education. Comput. Educ. 2013, 62, 41–49. [Google Scholar] [CrossRef]
- Li, F.; Wang, X.; He, X.N.; Cheng, L.; Wang, Y.Y. How augmented reality affected academic achievement in K-12 education—A meta-analysis and thematic-analysis. Interact. Learn. Environ. 2021, 31, 5582–5600. [Google Scholar] [CrossRef]
- Singh, G.; Mantri, A.; Sharma, O.; Dutta, R.; Kaur, R. Evaluating the impact of the augmented reality learning environment on electronics laboratory skills of engineering students. Comput. Appl. Eng. Educ. 2019, 27, 1361–1375. [Google Scholar] [CrossRef]
- Lin, T.J.; Duh, H.B.L.; Li, N.; Wang, H.Y.; Tsai, C.C. An investigation of learners’ collaborative knowledge construction performances and behavior patterns in an augmented reality simulation system. Comput. Educ. 2013, 68, 314–321. [Google Scholar] [CrossRef]
- Penn, M.; Ramnarain, U. South African university students’ attitudes towards chemistry learning in a virtually simulated learning environment. Chem. Educ. Res. Pract. 2019, 20, 699–709. [Google Scholar] [CrossRef]
- Ling, Y.; Zhu, P.; Yu, J. Which types of learners are suitable for augmented reality? A fuzzy set analysis of learning outcomes configurations from the perspective of individual differences. Educ. Technol. Res. Dev. 2021, 69, 2985–3008. [Google Scholar] [CrossRef]
- Sáez-López, J.M.; Cózar-Gutiérrez, R.; González-Calero, J.A.; Gómez Carrasco, C.J. Augmented Reality in Higher Education: An Evaluation Program in Initial Teacher Training. Educ. Sci. 2020, 10, 26. [Google Scholar] [CrossRef]
- Wyss, C.; Furrer, F.; Degonda, A.; Bührer, W. Augmented Reality in der Hochschullehre. Medien. Z. Theor. Prax. Medien. 2022, 47, 118–137. [Google Scholar] [CrossRef]
- Haas, B.; Lavicza, Z.; Houghton, T.; Kreis, Y. Can you create? Visualising and modelling real-world mathematics with technologies in STEAM educational settings. Curr. Opin. Behav. Sci. 2023, 52, 101297. [Google Scholar] [CrossRef]
- Wang, M.; Callaghan, V.; Bernhardt, J.; White, K.; Peña-Rios, A. Augmented reality in education and training: Pedagogical approaches and illustrative case studies. J. Ambient Intell. Humaniz. Comput. 2017, 9, 1391–1402. [Google Scholar] [CrossRef]
- Romano, M.; Díaz, P.; Aedo, I. Empowering teachers to create augmented reality experiences: The effects on the educational experience. Interact. Learn. Environ. 2023, 31, 1546–1563. [Google Scholar] [CrossRef]
- Vogelsang, C.; Finger, A.; Laumann, D.; Thyssen, C. Vorerfahrungen, Einstellungen und motivationale Orientierungen als mögliche Einflussfaktoren auf den Einsatz digitaler Werkzeuge im naturwissenschaftlichen Unterricht. Z. Didakt. Naturwiss. 2019, 25, 115–129. [Google Scholar] [CrossRef]
- Tesch, M.; Duit, R. Experimentieren im Physikunterricht—Ergebnisse einer Videostudie. Z. Didakt. Naturwiss. 2004, 10, 51–69. [Google Scholar]
- Duit, R.; Tesch, M. On the role of the experiment in science teaching and learning—Visions and the reality of instructional practice. In HSci 2010: 7th International Conference Hands-on Science “Bridging the Science and Society Gap”, 25–31 July 2010, Rethimno, Greece; Kalogiannakis, M., Stavrou, D., Michaelides, P.G., Eds.; The University of Crete: Rethymno, Greece, 2010. [Google Scholar]
- Krug, M.; Czok, V.; Müller, S.; Weitzel, H.; Huwer, J.; Kruse, S.; Müller, W. AR in science education—An AR based teaching-learning scenario in the field of teacher education. Chemkon 2022, 29, 312–318. [Google Scholar] [CrossRef]
- Sweller, J. Implications of Cognitive Load Theory for Multimedia Learning. In The Cambridge Handbook of Multimedia Learning; Cambridge University Press: Cambridge, UK, 2005; Volume 27, pp. 27–42. [Google Scholar]
- Mayer, R.E. The Cambridge Handbook of Multimedia Learning, 2nd ed.; Cambridge University Press: Cambridge, UK, 2014. [Google Scholar] [CrossRef]
- Henne, A.; Möhrke, P.; Thoms, L.-J.; Huwer, J. Implementing Digital Competencies in University Science Education Seminars Following the DiKoLAN Framework. Educ. Sci. 2022, 12, 356. [Google Scholar] [CrossRef]
- Krug, M.; Thoms, L.-J.; Huwer, J. Augmented Reality in the Science Classroom—Implementing Pre-Service Teacher Training in the Competency Area of Simulation and Modeling According to the DiKoLAN Framework. Educ. Sci. 2023, 13, 1016. [Google Scholar] [CrossRef]
- Becker, S.; Meßinger-Koppelt, J.; Thyssen, C.; Joachim Herz, S. Digitale Basiskompetenzen. In Orientierungshilfe und Praxisbeispiele für die Universitäre Lehramtsausbildung in den Naturwissenschaften; Auflage, Ed.; Joachim Herz Stiftung: Hamburg, Germany, 2020. [Google Scholar]
- Kotzebue, L.v.; Meier, M.; Finger, A.; Kremser, E.; Huwer, J.; Thoms, L.-J.; Becker, S.; Bruckermann, T.; Thyssen, C. The Framework DiKoLAN (Digital Competencies for Teaching in Science Education) as Basis for the Self-Assessment Tool DiKoLAN-Grid. Educ. Sci. 2021, 11, 775. [Google Scholar] [CrossRef]
- DiBaNa. Digital Basic Competencies for Science Teachers in an Online Platform for Acquiring Digital Teaching Competencies. Available online: https://www.dibana.de (accessed on 31 October 2023).
- Autodesk, Inc. Tinkercad, 1.4; Autodesk, Inc.: San Francisco, CA, USA, 2022.
- Zappar, Ltd. Zapworks, v6.5.34-stable; Zappar, Ltd.: London, UK, 2022.
- International GeoGebra Institute. GeoGebra 3D; 5.0.744.A Web-App to Draw 3D Functions and Discover 3D Geometry with a 3D Graphing Calculator. Available online: https://www.geogebra.org/ (accessed on 31 October 2023).
- De Backere, J.; Zambri, M. LeARnCHEM, 1.1. Available online: https://apps.apple.com/ca/app/learnchem/id1634480997 (accessed on 31 October 2023).
- Cohen, J. A Coefficient of Agreement for Nominal Scales. Educ. Psychol. Meas. 1960, 20, 37–46. [Google Scholar] [CrossRef]
- Fleiss, J.L. Measuring nominal scale agreement among many raters. Psychol. Bull. 1971, 76, 378–382. [Google Scholar] [CrossRef]
- Krippendorff, K. Estimating the Reliability, Systematic Error and Random Error of Interval Data. Educ. Psychol. Meas. 2016, 30, 61–70. [Google Scholar] [CrossRef]
- Sertdemir, Y.; Burgut, H.R.; Alparslan, Z.N.; Unal, I.; Gunasti, S. Comparing the methods of measuring multi-rater agreement on an ordinal rating scale: A simulation study with an application to real data. J. Appl. Stat. 2013, 40, 1506–1519. [Google Scholar] [CrossRef]
- R Core Team. R: A Language and Environment for Statistical Computing; 4.3.1; R Foundation for Statistical Computing: Vienna, Austria, 2023. [Google Scholar]
- Microsoft Corporation. Microsoft Excel, 16.78.3; Microsoft Corporation: Redmond, WA, USA, 2023.
- Guttman, L. A basis for analyzing test-retest reliability. Psychometrika 1945, 10, 255–282. [Google Scholar] [CrossRef]
- Cronbach, L.J. Coefficient alpha and the internal structure of tests. Psychometrika 1951, 16, 297–334. [Google Scholar] [CrossRef]
- leARnCHEM. Available online: https://apps.apple.com/de/app/learnchem/id1634480997 (accessed on 31 October 2023).


| Subscale | Item | Item text |
|---|---|---|
| Technical Implementation | 1 | The AR in the learning scenario operates smoothly and reliably. |
| 2 | The teachers are confident in controlling the AR. | |
| 3 | The handling of the AR is intuitive and simple for the learners. | |
| 4 | The functionality of the AR is sufficiently described and explained. | |
| 5 | The tracking method chosen is appropriate for the teaching scenario. | |
| Fit of the AR | 6 | The AR supports at least one specific learning goal. |
| 7 | There is a connection to previous and subsequent teaching sequences. | |
| 8 | Relevant references to real situations or applications are made. | |
| 9 | The AR offers clear benefits compared to conventional visualizations. | |
| 10 | Potential benefits and challenges of AR use for teaching are discussed. | |
| 11 | The AR helps learners to develop a better understanding of the content. | |
| Interactivity and Engagement | 12 | The AR encourages learners to actively engage with the subject matter. |
| 13 | There are additional possibilities besides viewing the object, e.g., interactivity or individualization. | |
| 14 | There are feedback mechanisms (analogous or digital) to provide learners with feedback on their use of AR. | |
| Visualization | 15 | The complexity of the AR (cf. [60]) fits the learning goal addressed (in terms of cognitive load [61]). |
| 16 | The design laws [62] are taken into account. | |
| Creativity and Originality | 17 | The lesson design demonstrates an original and creative use of AR to support the learning process. |
| 18 | The AR was created by the teachers themselves. |
| Group | Topic | Learning Goals | AR |
|---|---|---|---|
| 1 | Construction of Amino Acids | Learners determine the concept of chirality through the structure of amino acids. | AR model of L-alanine for comparison with the model built using the model kit (Tools: TinkerCAD [68] and Zapworks Designer [69]) |
| 2 | Properties of Enzymes Illustrated Using the Bioluminescence of Fireflies | Learners describe the structure and properties of an enzyme, explaining its mechanism using appropriate models: the key–lock principle and induced fit model. | AR model of key–lock principle (TinkerCAD [68] and Zapworks Designer [69]) |
| 3 | Introduction to Chirality | Learners can explain the chirality of a molecule based on the presence of an asymmetrically substituted carbon atom. | Aligning AR models of chiral or achiral substances with the model kit (TinkerCAD [68] and zapworks designer [69]) |
| 4 | Introduction to Orbital Theory | Learners recognize the relationship between a wave function and an orbital representation | AR model of the orbital representation (Geogebra [70]) |
| 5 | Bond Formation by Orbital Overlap | Learners apply their knowledge of orbital models to simple atomic bonds. | AR model of the molecules and first simple connection (leARnchem [71]) |
| 6 | Superposition Principle | Learners can explain wave phenomena such as the path difference and constructive and destructive interference with the superposition principle. | AR simulation of the interference pattern of transversal waves with two emitters (Geogebra [70]) |
| Subscale | Item | Item text | 1 | 2 | 3 | 4 | NA | 1 | 2 | 3 | 4 | NA | ||
|---|---|---|---|---|---|---|---|---|---|---|---|---|---|---|
| Technical Implementation | 1 | The AR in the learning scenario operates smoothly and reliably. | 22 | 4 | 3 | 0 | 1 | 73% | 13% | 10% | 0% | 3% | 0.85 | 0.89 |
| 2 | The teachers are confident in controlling the AR. | 21 | 4 | 2 | 0 | 3 | 70% | 13% | 7% | 0% | 10% | |||
| 3 | The handling of the AR is intuitive and simple for the learners. | 16 | 9 | 1 | 0 | 4 | 53% | 30% | 3% | 0% | 13% | |||
| 4 | The functionality of the AR is sufficiently described and explained. | 16 | 6 | 6 | 2 | 0 | 53% | 20% | 20% | 7% | 0% | |||
| 5 | The tracking method chosen is appropriate for the teaching scenario. | 23 | 3 | 2 | 1 | 1 | 77% | 10% | 7% | 3% | 3% | |||
| Fit of the AR | 6 | The AR supports at least one specific learning goal. | 25 | 5 | 0 | 0 | 0 | 83% | 17% | 0% | 0% | 0% | 0.88 | 0.92 |
| 7 | There is a connection to previous and subsequent teaching sequences. | 27 | 3 | 0 | 0 | 0 | 90% | 10% | 0% | 0% | 0% | |||
| 8 | Relevant references to real situations or applications are made. | 19 | 5 | 1 | 0 | 5 | 63% | 17% | 3% | 0% | 17% | |||
| 9 | The AR offers clear benefits compared to conventional visualizations. | 23 | 5 | 2 | 0 | 0 | 77% | 17% | 7% | 0% | 0% | |||
| 10 | Potential benefits and challenges of AR use for teaching are discussed. | 19 | 5 | 4 | 0 | 2 | 63% | 17% | 13% | 0% | 7% | |||
| 11 | The AR helps learners to develop a better understanding of the content. | 24 | 5 | 1 | 0 | 0 | 80% | 17% | 3% | 0% | 0% | |||
| Interactivity and Engagement | 12 | The AR encourages learners to actively engage with the subject matter. | 26 | 2 | 1 | 1 | 0 | 87% | 7% | 3% | 3% | 0% | 0.48 | 0.67 |
| 13 | There are additional possibilities besides viewing the object, e.g., interactivity or individualization. | 16 | 1 | 4 | 8 | 1 | 53% | 3% | 13% | 27% | 3% | |||
| 14 | There are feedback mechanisms (analogous or digital) to provide learners with feedback on their use of AR. | 5 | 5 | 0 | 17 | 3 | 17% | 17% | 0% | 57% | 10% | |||
| Visualization | 15 | The complexity of the AR fits the learning goal addressed (in terms of cognitive load). | 20 | 7 | 3 | 0 | 0 | 67% | 23% | 10% | 0% | 0% | 0.03 | 0.07 |
| 16 | The design laws are taken into account. | 10 | 12 | 1 | 0 | 7 | 33% | 40% | 3% | 0% | 23% | |||
| Creativity and Originality | 17 | The lesson design demonstrates an original and creative use of AR to support the learning process. | 17 | 10 | 0 | 3 | 0 | 57% | 33% | 0% | 10% | 0% | 0.67 | 0.80 |
| 18 | The AR was created by the teachers themselves. | 21 | 2 | 0 | 5 | 2 | 70% | 7% | 0% | 17% | 7% |
| Item | V15 | |||||||
|---|---|---|---|---|---|---|---|---|
| 1 | 2 | 3 | 4 | NA | valid | total | ||
| V16 | 1 | 7 | 1 | 2 | 0 | 0 | 10 | 10 |
| 2 | 7 | 5 | 0 | 0 | 0 | 12 | 12 | |
| 3 | 0 | 1 | 0 | 0 | 0 | 1 | 1 | |
| 4 | 0 | 0 | 0 | 0 | 0 | 0 | 0 | |
| NA | 6 | 0 | 1 | 0 | ||||
| valid | 14 | 7 | 2 | 0 | ||||
| total | 20 | 7 | 3 | 0 | ||||
Disclaimer/Publisher’s Note: The statements, opinions and data contained in all publications are solely those of the individual author(s) and contributor(s) and not of MDPI and/or the editor(s). MDPI and/or the editor(s) disclaim responsibility for any injury to people or property resulting from any ideas, methods, instructions or products referred to in the content. |
© 2024 by the authors. Licensee MDPI, Basel, Switzerland. This article is an open access article distributed under the terms and conditions of the Creative Commons Attribution (CC BY) license (https://creativecommons.org/licenses/by/4.0/).
Share and Cite
Henne, A.; Syskowski, S.; Krug, M.; Möhrke, P.; Thoms, L.-J.; Huwer, J. How to Evaluate Augmented Reality Embedded in Lesson Planning in Teacher Education. Educ. Sci. 2024, 14, 264. https://doi.org/10.3390/educsci14030264
Henne A, Syskowski S, Krug M, Möhrke P, Thoms L-J, Huwer J. How to Evaluate Augmented Reality Embedded in Lesson Planning in Teacher Education. Education Sciences. 2024; 14(3):264. https://doi.org/10.3390/educsci14030264
Chicago/Turabian StyleHenne, Anna, Sabrina Syskowski, Manuel Krug, Philipp Möhrke, Lars-Jochen Thoms, and Johannes Huwer. 2024. "How to Evaluate Augmented Reality Embedded in Lesson Planning in Teacher Education" Education Sciences 14, no. 3: 264. https://doi.org/10.3390/educsci14030264
APA StyleHenne, A., Syskowski, S., Krug, M., Möhrke, P., Thoms, L.-J., & Huwer, J. (2024). How to Evaluate Augmented Reality Embedded in Lesson Planning in Teacher Education. Education Sciences, 14(3), 264. https://doi.org/10.3390/educsci14030264