
Assessment of Teacher Motivation, Psychometric Properties of the Work Tasks Motivation Scale for Teachers (WTMST) in Spanish Teachers

 , , and
Abstract
1. Theoretical Framework
2. Method
2.1. Participants
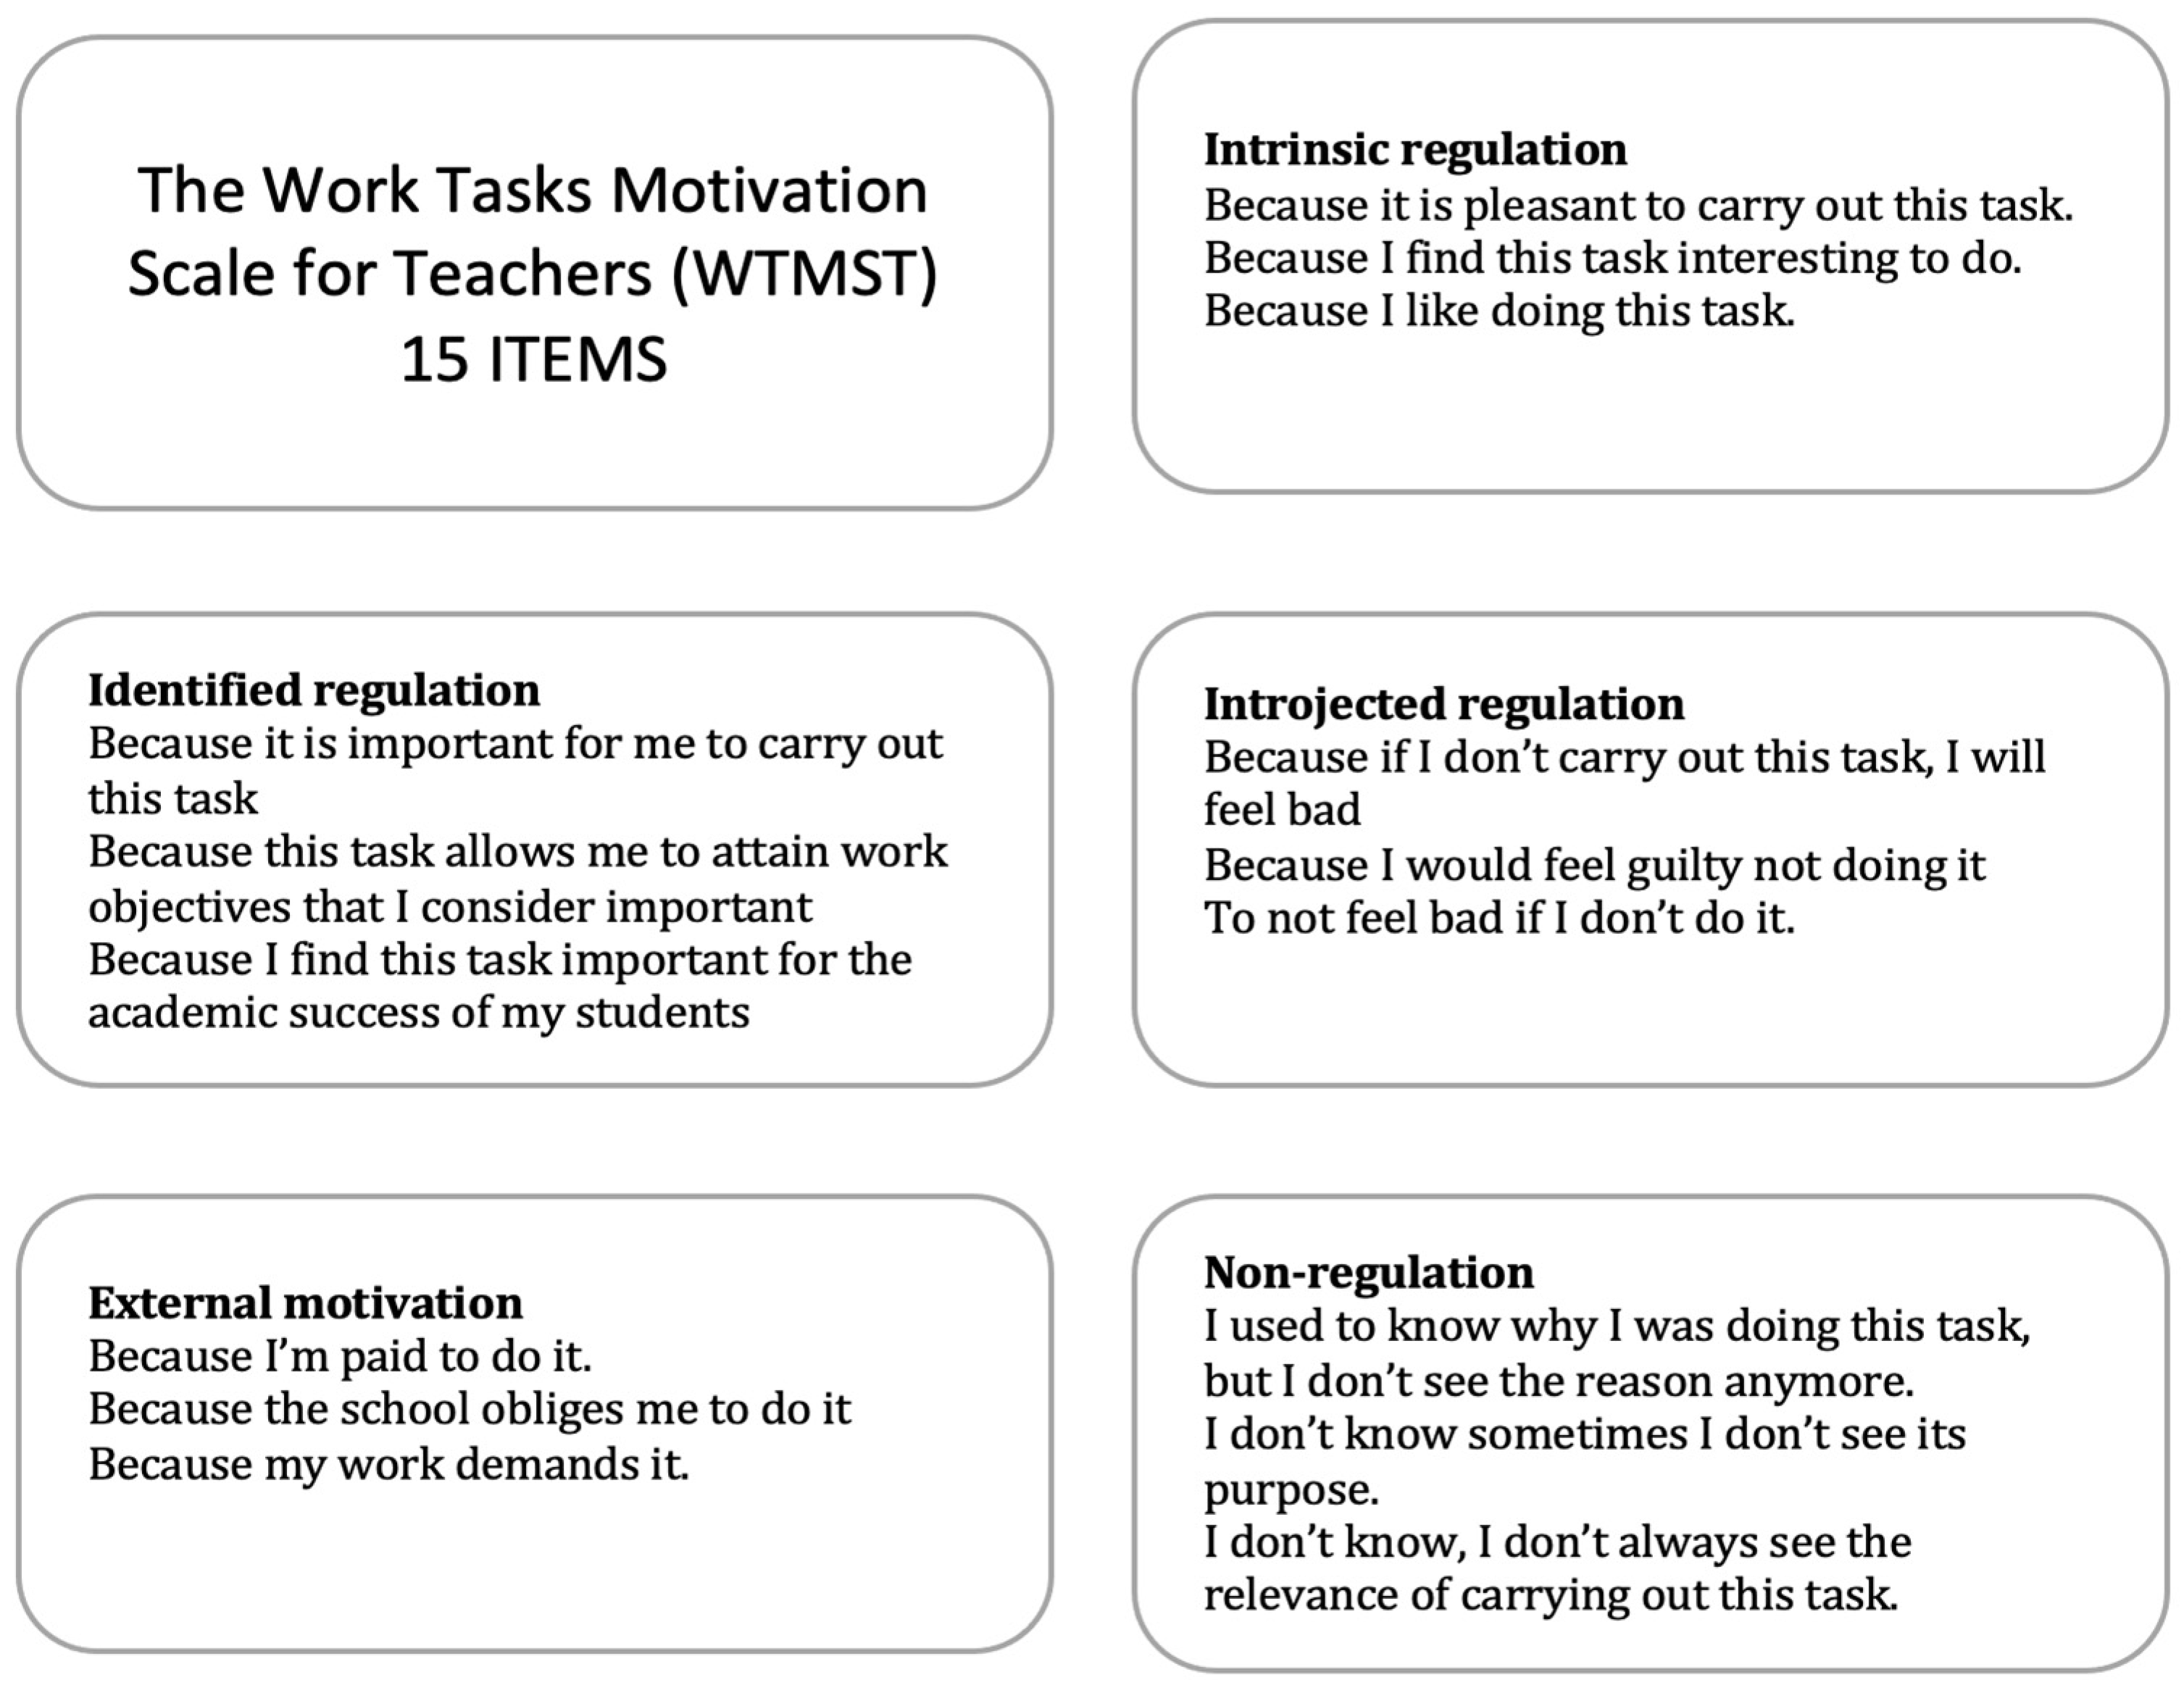
2.2. Instrument
- ▪
- Translation of the scale into Spanish from the original English version by three bilingual persons with experience in the field of educational evaluation. These translations were discussed with the research team until a consensus was reached and the first Spanish version was developed.
- ▪
- An educator with teaching experience in English evaluated the conceptual equivalence, clarity, and contextuality of each of the sentences and answer options of this first version. With the pertinent rectifications, a new version was obtained.
- ▪
- Consultation was also carried out with educators who are experts in the teacher’s own tasks (class preparation, teaching, student assessment, classroom management, administrative and complementary tasks, etc.).
- ▪
- A second Spanish version was obtained, which was then translated back into English by a native bilingual translator.
- ▪
- A pilot test was then carried out with 75 teachers (25 teaching in early childhood education, 25 in primary education, and 25 in secondary education) in order to assess the comprehension, time required to complete the questionnaire, clarity of the questions, and adequacy of the answers.
- ▪
- Finally, with the results of this test, a final version of the WTMST scale was made by the research team to check its suitability for application to Spanish-speaking populations.
2.3. Procedure
2.4. Statistical Analysis
3. Results
3.1. Preliminary Item Analysis and Mardy Coefficient
3.2. First Study: Exploratory Factor Analysis of the WTMST Scale
- Four-Factor Model: α = 0.825, ω = 0.802 (introjected regulation: α = 0.968, ω = 0.969; intrinsic motivation and identified regulation: α = 0.903, ω = 0.906; demotivation: α = 0.919, ω = 0.920; external regulation: α = 0.836, ω = 0.843).
- Five-Factor Model: α = 0.825, ω = 0.802 (introjected regulation: α = 0.968, ω = 0.969; intrinsic motivation: α = 0.916, ω = 0.921; identified regulation: α = 0.865, ω = 0.868; demotivation: α = 0.847, ω = 0.848; external regulation: α = 0.847, ω = 0.848).
3.3. Second Study: Confirmatory Factor Analysis of the WTMST Scale
3.4. Third Study: Relationship of Gender and Age with the Five Factors of the WTMST Questionnaire
4. Discussion
5. Limitations and Educational Implications
Author Contributions
Funding
Institutional Review Board Statement
Informed Consent Statement
Data Availability Statement
Acknowledgments
Conflicts of Interest
References
- Putri, A.F.; Andriningrum, H.; Rofiah, S.K.; Gunawan, I. Teacher Function in Class: A Literature Review; Atlantis-Press: Amsterdam, The Netherlands, 2019; Volume 10. [Google Scholar] [CrossRef]
- Börü, N. The factors affecting teacher-motivation. Int. J. Instr. 2018, 11, 761–776. [Google Scholar] [CrossRef]
- Skaalvik, E.M.; Skaalvik, S. Job demands and job resources as predictors of teacher motivation and well-being. Soc. Psychol. Educ. 2018, 21, 1251–1275. [Google Scholar] [CrossRef]
- Bardach, L.; Klassen, R.M. Teacher motivation and student outcomes: Searching for the signal. Educ. Psychol. 2021, 56, 283–297. [Google Scholar] [CrossRef]
- Fitria, H.; Suminah, S. Role of Teachers in Digital Instructional Era. J. Soc. Work Sci. Educ. 2020, 1, 70–77. [Google Scholar] [CrossRef]
- Borashkyzy, A.U.; Amina, A.; Eshtayevna, S.Z.; Userkhanovna, K.K.; Myktybaevna, D.D.; Issaevna, B.A. The evaluation of primary school teacher role on research activities. Int. J. Cogn. Res. Sci. Eng. Educ. 2020, 8, 29–38. [Google Scholar] [CrossRef]
- Lobato, C.; Madinabeitia, A. Perfiles Motivacionales del Profesorado ante la Formación en Metodologías Activas en la Universidad. Form. Univ. 2011, 4, 37–48. [Google Scholar] [CrossRef]
- López, J. Un giro copernicano en la enseñanza universitaria: Formación por competencias. Rev. Educ. 2009, 356, 279–301. [Google Scholar]
- Pino Juste, M. Metodologías activas como clave en los procesos de innovación en la escuela. In Éxito Educativo: Claves de Construcción y Desarrollo; Rego, M.A.S., Moledo, A.V.A.Y.M.L., Eds.; Editorial Tirant lo Blanch: Valencia, Spain, 2019; pp. 129–150. [Google Scholar]
- Tébar, L. El perfil del profesor mediador. In Aula XXI; Santillana: Madrid, Spain, 2003. [Google Scholar]
- Song, M. Chinese English as Foreign Language Teachers’ Self-Efficacy and Motivation as Predictors of Burnout. Front. Psochol. 2022, 13, 899687. [Google Scholar] [CrossRef] [PubMed]
- Toropova, A.; Myrberg, E.; and Johansson, S. Teacher job satisfaction: The importance of school working conditions and teacher characteristics. Educ. Rev. 2021, 73, 71–97. [Google Scholar] [CrossRef]
- Sato, M.; Fernández Castillo, F.; Oyanedel, J.C. Teacher motivation and burnout of English as a foreign language teachers: Do demotivators really demotivate them? Front. Psychol. 2022, 13, 891452. [Google Scholar] [CrossRef]
- Madigan, D.J.; Kim, L.E. Towards an understanding of teacher attrition: A meta-analysis of burnout, job satisfaction, and teachers’ intentions to quit. Teach. Teach. Educ. 2021, 105, 103–425. [Google Scholar] [CrossRef]
- De Jesus, S.N.; Lens, W. An Integrated Model for the Study of Teacher Motivation. Appl. Psychol. 2005, 54, 119–134. [Google Scholar] [CrossRef]
- Bishay, A. Teacher Motivation and Job Satisfaction: A Study Employing the Experience Sampling Method. J. Undergrad. Sci. 1996, 3, 147–155. [Google Scholar]
- Levesque, M.; Blais, M.R.; Hess, U. Motivation, comportements organisationnels discrétionnaires et bien-être en milieu Africain: Quand le devoir oblige? J. Behav. Sci. 2004, 36, 321–332. [Google Scholar] [CrossRef]
- Alexandra, U.H.I. Studying Motivation and Productivity in Academic Research. A Methodological Proposal. Econ. Sci. Serie 2011, 1, 1311. [Google Scholar]
- Emo, W. Teachers’ motivations for initiating innovations. J. Educ. Chang. 2015, 16, 171–195. [Google Scholar] [CrossRef]
- Osman, D.J.; Warner, J.R. Measuring teacher motivation: The missing link between professional development and practice. Teach. Teach. Educ. 2020, 92, 103–164. [Google Scholar] [CrossRef]
- Appova, A.; Arbaugh, F. Teachers’ motivation to learn: Implications for supporting professional growth. Prof. Dev. Educ. 2018, 44, 5–21. [Google Scholar] [CrossRef]
- Pelletier, L.G.; Séguin-Lévesque, C.; Legault, L. Pressure from above and pressure from below as determinants of teachers’ motivation and teaching behaviors. J. Educ. Psychol. 2002, 94, 186–196. [Google Scholar] [CrossRef]
- Haenilah, E.Y.; Hariri, H.; Ridwan, J.; Ochayi, O.A.; Maydiantoro, A.; Zainaro, M.A. Literature Review of Good Teachers: The Attributes and Gaps of Indonesian Teachers as a Profession. Acad. J. Interdiscip. Stud. 2022, 11, 175. [Google Scholar] [CrossRef]
- Salton, Y.; Riddle, S.; Baguley, M. The ‘good’ teacher in an era of professional standards: Policy frameworks and lived realities. Teach. Teach. 2021, 28, 51–63. [Google Scholar] [CrossRef]
- Nalipay, M.J.N.; King, R.B.; Mordeno, I.G.; Wang, H. Are good teachers born or made? Teachers who hold a growth mindset about their teaching ability have better well-being. Educ. Psychol. 2022, 42, 23–41. [Google Scholar] [CrossRef]
- Day, J.; Hughes, S.; Zanders, C.; van Zanen, K.; Moos, A. What Does a Good Teacher Do Now? Crafting Communities of Care. Pedagogy 2021, 21, 389–402. [Google Scholar] [CrossRef]
- Fernet, C.; Sencal, C.; Guay, F.; Marsh, H.; Dowson, M. The Work Tasks Motivation Scale for Teachers (WTMST). J. Career Assess. 2008, 16, 256–279. [Google Scholar] [CrossRef]
- Deci, E.L.; Ryan, R.M. The “What” and “Why” of Goal Pursuits: Human Needs and the Self-Determination of Behavior. Psychol. Inq. 2000, 11, 227–268. [Google Scholar] [CrossRef]
- Katz, I.; Assor, A.; Kanat-Maymon, Y. A projective assessment of autonomous motivation in children: Correlational and experimental evidence. Motiv. Emot. 2008, 32, 109–119. [Google Scholar] [CrossRef]
- Miquelon, P.; Vallerand, R.J.; Grouzet, F.M.E.; Cardinal, G. Perfectionism, academic motivation, and psychological adjustment: An integrative model. Personal. Soc. Psychol. Bull. 2005, 31, 913–921. [Google Scholar] [CrossRef]
- Ratelle, C.F.; Guay, F.; Vallerand, R.J.; Larose, S.; Senécal, C. Autonomous, Controlled, and Amotivated Types of Academic Motivation: A Person-Oriented Analysis. J. Educ. Psychol. 2007, 99, 734–746. [Google Scholar] [CrossRef]
- Grouzet, F.M.E.; Vallerand, R.J.; Thill, E.E.; Provencher, P.J. From Environmental Factors to Outcomes: A Test of an Integrated Motivational Sequence. Motiv. Emot. 2004, 28, 331–346. [Google Scholar] [CrossRef]
- Cook, D.A.; Artino, A.R. Motivation to learn: An overview of contemporary theories. Med. Educ. 2016, 50, 997–1014. [Google Scholar] [CrossRef]
- Ryan, R.M. Control and information in the intrapersonal sphere: An extension of cognitive evaluation theory. J. Personal. Soc. Psychol. 1982, 43, 450–461. [Google Scholar] [CrossRef]
- Ryan, R.M.; Mims, V.; Koestner, R. Relation of reward contingency and interpersonal context to intrinsic motivation: A review and test using cognitive evaluation theory. J. Personal. Soc. Psychol. 1983, 45, 736–750. [Google Scholar] [CrossRef]
- Plant, R.W.; Ryan, R.M. Intrinsic motivation and the effects of self-consciousness, self-awareness, and ego-involvement: An investigation of internally controlling styles. J. Personal. 1985, 53, 435–449. [Google Scholar] [CrossRef]
- Ryan, R.M.; Connell, J.P.; Plant, R.W. Emotions in nondirected text learning. Learn Individ. Differ. 1990, 2, 1–17. [Google Scholar] [CrossRef]
- Ryan, R.M.; Koestner, R.; Deci, E.L. Ego-involved persistence: When free-choice behavior is not intrinsically motivated. Motiv. Emot. 1991, 15, 185–205. [Google Scholar] [CrossRef]
- Deci, E.L.; Eghrari, H.; Patrick, B.C.; Leone, D.R. Facilitating Internalization: The Self-Determination Theory Perspective. J. Personal. 1994, 62, 119–142. [Google Scholar] [CrossRef]
- Mertler, C.A. Teacher Motivation and Job Satisfaction in the New Millennium. In Proceedings of the Annual Meeting of the Mid-Western Educational Research Association, Chicago, IL, USA, 24–27 October 2021; ERIC Clearinghouse: Chicago, IL, USA, 2001; pp. 24–27. [Google Scholar]
- Roth, G.; Assor, A.; Kanat-Maymon, Y.; Kaplan, H. Autonomous motivation for teaching: How self-determined teaching may lead to self-determined learning. J. Educ. Psychol. 2007, 99, 761–774. [Google Scholar] [CrossRef]
- Hein, V.; Ries, F.; Pires, F.; Caune, A.; Emeljanovas, A.; Ekler, J.H.; Emeljanovas, A.; Valantiniene, I. The Relationship Between Teaching Styles and Motivation to Teach Among Physical Education Teachers. J. Sports Sci. Med. 2012, 11, 123–130. [Google Scholar]
- Rodríguez, S.; Núñez, J.C.; Valle, A.; Blas, R.; Rosario, P. Auto-eficacia docente, motivación del profesor y estrategias de enseñanza. Escritos Psicol. 2009, 11, 1–7. [Google Scholar] [CrossRef]
- Visser-Wijnveen, G.J.; Stes, A.; Van Petegem, P. Development and validation of a questionnaire measuring teachers’ motivations for teaching in higher education. High Educ. 2012, 64, 421–436. [Google Scholar] [CrossRef]
- Choi, S.A. Measure of English Teacher Motivation: Scale Development and Preliminary Validation. Adv. Sci. Technol. Lett. 2014, 59, 85–88. [Google Scholar]
- Hernández, R.; Fernández-Collado, C.; Baptista, P. Metodología de la Investigación; McGraw Hill: Mexico City, Mexico, 2014. [Google Scholar]
- Muñiz, J.; Elosua, P.; Hambleton, R.K. Directrices para la traducción y adaptación de los tests. Psicothema 2013, 25, 151–157. [Google Scholar]
- Ato, G.M.; Vallejo, G. Diseños de Investigación en Psicología; Larousse-Ediciones Pirámide: Madrid, Spain, 2015. [Google Scholar]
- Byrne, B.M. Structural Equation Modelling with AMOS: Basic Concepts, Applications, and Programming; Routledge Taylor & Francis Group: New York, NY, USA, 2010. [Google Scholar]
- Loehlin, J.C.; Beaujean, A.A. Latent Variable Models An Introduction to Factor, Path, and Structural Equation Analysis; Taylor & Francis: New York, NY, USA, 2017. [Google Scholar]
- San Martín, R.; Ruíz, M.A.; Pardo, A.; Ruiz, M.; Pardo, A. Modelos de ecuaciones estructurales. Papeles Del Psicólogo 2010, 31, 34–45. [Google Scholar]
- Byrne, B.M. Structural Equation Modeling with AMOS: Basic Concepts, Applications, and Programming; Lawrence Erlbaum Associates Publishers: Mahwah, NJ, USA, 2001. [Google Scholar]
- George, D.; Mallery, P. IBM SPSS Statistics 26 Step by Step: A Simple Guide and Reference; Routledge: New York, NY, USA, 2019. [Google Scholar]
- Bollen, K.A. Structural Equations with Latent Variables; John Wiley & Sons: Hoboken, NJ, USA, 1989. [Google Scholar]
- Selcuk, K.; Goksuluk, D.; Zararsiz, G. Package‘MVN’: Multivariate Normality Test. Available online: https://cran.r-project.org/web/packages/MVN/MVN.pdf (accessed on 14 February 2024).
- Gomes, D.; Borba, D. Psicologia das Organizações, do Trabalho e dos Recursos Humanos; Coimbra University Press: Coimbra, Portugal, 2011; pp. 243–319. [Google Scholar]
- Lusková, M.; Hudáková, M. Making the process of university teachers’ motivation more effective. Turk. Online J. Educ. Technol. 2015, 1, 308–313. [Google Scholar]
- Cho, G.; Hwang, H.; Sarstedt, M.; Ringle, C.M. Cutoff criteria for overall model fit indexes in generalized structured component analysis. J. Mark. Anal. 2020, 8, 189–202. [Google Scholar] [CrossRef]
- Jordan Muiño, F. Valor de corte de los índices de ajuste en el análisis factorial confirmatorio. Rev. Investig. Psicol. Soc. 2021, 7, 66–71. [Google Scholar]
- Kline, R.B. Principles and Practice of Structural Equation Modeling, 3rd ed.; The Guilford Press: New York, NY, USA, 2023. [Google Scholar]
- Lewis, T.F. Evidence Regarding the Internal Structure: Confirmatory Factor Analysis. Meas. Eval. Couns. Dev. 2017, 50, 239–247. [Google Scholar] [CrossRef]
- McNeish, D.; An, J.; Hancock, G.R. The Thorny Relation Between Measurement Quality and Fit Index Cutoffs in Latent Variable Models. J. Personal. Assess. 2017, 100, 43–52. [Google Scholar] [CrossRef]
- Wu, H.; Leung, S.O. Can Likert Scales be Treated as Interval Scales? A Simulation Study. J. Soc. Serv. Res. 2017, 43, 527–532. [Google Scholar] [CrossRef]
- Ebel, R.L. Confidence Weighting and Test Reliability on JSTOR. J. Educ. Meas. 1965, 2, 49–57. [Google Scholar] [CrossRef]
- Kline, P. The Handbook of Psychological Testing, 2nd ed.; Routledge: London, UK, 1999. [Google Scholar]
- Hair, J.F.; Hult, G.T.M.; Ringle, C.M.; Sarstedt, M.A. Primer on Partial Least Squares Structural Equation Modeling (PLS-SEM); Sage Publications: Thousand Oaks, CA, USA, 2017. [Google Scholar]
- Miles, J.; Gilbert, P.A. Handbook of Research Methods for Clinical and Health Psychology; Oxford University Press: Oxford, UK, 2005. [Google Scholar]
- Cuadras, C.M. Problemas de Probabilidades y Estadística; Edicions Universitat Barcelona: Barcelona, Spain, 2016; Volume 1. [Google Scholar]
- Nunnally, J.C. Psychometric Theory, 2nd ed.; McGraw-Hill: New York, NY, USA, 1978. [Google Scholar]
- Viseu, J.; Neves de Jesus, S.; Rus, C.; Canavarro, J.M. Teacher motivation, work satisfaction, and positive psychological capital: A literature review. Electron. J. Res. Educ. Psychol. 2016, 14, 439–461. [Google Scholar] [CrossRef]


| ITEMS | MEAN | SD | SKEWNESS (ES = 0.127) | KURTOSIS (ES = 0.253) | Ri-t | αi (αT = 0.825) |
|---|---|---|---|---|---|---|
| WTMST1 | 24.69 | 7.27 | −0.02 | −0.45 | 0.385 | 0.818 |
| WTMST2 | 11.56 | 5.72 | 1.35 | 2.16 | 0.238 | 0.825 |
| WTMST3 | 26.66 | 6.92 | −0.15 | −0.21 | 0.369 | 0.817 |
| WTMST4 | 30.89 | 8.33 | −0.69 | −0.16 | 0.434 | 0.815 |
| WTMST5 | 35.20 | 5.01 | −0.84 | 0.85 | 0.296 | 0.822 |
| WTMST6 | 20.82 | 8.83 | 0.20 | −0.91 | 0.594 | 0.803 |
| WTMST7 | 10.04 | 5.30 | 1.57 | 1.97 | 0.293 | 0.822 |
| WTMST8 | 31.60 | 6.38 | −0.69 | 0.54 | 0.463 | 0.814 |
| WTMST9 | 29.33 | 6.89 | −0.46 | −0.19 | 0.391 | 0.817 |
| WTMST10 | 11.30 | 5.51 | 1.31 | 1.72 | 0.250 | 0.829 |
| WTMST11 | 17.89 | 9.92 | 0.51 | −0.81 | 0.664 | 0.796 |
| WTMST12 | 17.40 | 9.72 | 0.56 | −0.73 | 0.668 | 0.798 |
| WTMST13 | 33.71 | 6.11 | −1.08 | 1.76 | 0.276 | 0.823 |
| WTMST14 | 20.39 | 9.80 | 0.15 | −1.02 | 0.541 | 0.807 |
| WTMST15 | 15.67 | 9.58 | 0.79 | −0.38 | 0.635 | 0.799 |
| MARDIA Coefficient | 46.09 [p × (p + 2), 15 × (15 + 2) = 255] | |||||
| ITEMS | 4-FACTOR MODEL | 5-FACTOR MODEL | |||||||
|---|---|---|---|---|---|---|---|---|---|
| YR | IMR | D | ER | YR | IM | IR | D | ER | |
| 12. Because if I don’t, I will feel bad. | 0.977 | 0.984 | |||||||
| 11. Because I would feel guilty if I didn’t do it. | 0.946 | 0.923 | |||||||
| 15. So that I won’t feel bad if I don’t do it | 0.937 | 0.921 | |||||||
| 3. Because I like doing it | 0.940 | 0.965 | |||||||
| 1. Because it is pleasant to perform this task | 0.897 | 0.892 | |||||||
| 6. Because it is interesting | 0.821 | 0.613 | |||||||
| 7. It is important to me | 0.784 | 0.848 | |||||||
| 8. Because I find this task important for the academic success of my students. | 0.579 | 0.814 | |||||||
| 9. Because this task allows me to achieve goals that I consider important in my work. | 0.558 | 0.622 | |||||||
| 10. I don’t know, sometimes I don’t see the purpose. | 0.908 | 0.914 | |||||||
| 11. I used to find meaning in this task but not anymore. | 0.877 | 0.894 | |||||||
| 12. I don’t know, I don’t always find the relevance of this task. | 0.876 | 0.855 | |||||||
| 13. Because my job requires it | 0.791 | 0.865 | |||||||
| 14. Because the center requires it | 0.705 | 0.808 | |||||||
| 15. Because they pay me to do it | 0.694 | 0.669 | |||||||
| 16. AUTOVALUE | 4.61 | 4.33 | 1.83 | 1.30 | 4.61 | 4.33 | 1.83 | 1.30 | 0.84 |
| 17. % VARIANCE | 30.75 | 28.92 | 12.20 | 8.70 | 30.75 | 28.92 | 12.20 | 8.70 | 5.63 |
| 18. % ACCUMULATED VARIANCE | 80.57 | 86.20 | |||||||
| 4-MF | 1 | 2 | 3 | 5-MF | 1 | 2 | 3 | 4 |
| YR | 1 | MI | 1 | |||||
| MRI | 0.085 | 1 | YR | 0.112 * | 1 | |||
| D | 0.369 ** | −0.282 ** | 1 | ER | 0.104 * | 0.440 ** | 1 | |
| ER | 0.440 ** | 0.185 ** | 0.160 ** | D | −0.192 ** | 0.369 ** | 0.160 ** | 1 |
| IR | 0.643 ** | 0.033 | 0.248 ** | −0.337 ** |
| Models | χ2(df) | χ2/df | CFI | TLI | GFI | SRMR | RMSEA (CI) | AIC |
|---|---|---|---|---|---|---|---|---|
| Model achieved WTMST | 713.35 (84) | 8.49 | 0.896 | 0.873 | 0.897 | 0.089 | 0.143 (0.133–0.152) | 684.24 |
| Theoretical model WTMST | 407.81 (80) | 5.09 | 0.932 | 0.911 | 0.902 | 0.067 | 0.077 (0.065–0.089) | 478.81 |
| One-dimensional model WTMST | 3473.7 (90) | 38.59 | 0.498 | 0.281 | 0.512 | 0.265 | 0.320 (0.311–0.329) | 3533.7 |
| Invariance Models | X2 | df | CFI | TLI | RMSEA | RMSEA 90% CI | SRMR | ΔCFI | ΔRMSEA |
|---|---|---|---|---|---|---|---|---|---|
| 987.18 | 149 | 0.924 | 0.903 | 0.082 | 0.059–0.106 | 0.068 | - | - |
| 1002.104 | 154 | 0.920 | 0.907 | 0.079 | 0.058–0.104 | 0.080 | 0.004 | 0.003 |
| 1017.701 | 160 | 0.913 | 0.910 | 0.079 | 0.059–0.101 | 0.083 | 0.007 | <0.001 |
| GENDER | YR | D | ER | IM | IR |
|---|---|---|---|---|---|
| Male (n = 106) | 51.57 (6.11) | 32.24 (2.78) | 72.12 (4.18) | 81.52 (9.98) | 96.02 (7.28) |
| Female (n = 263) | 50.72 (9.24) | 33.17 (3.29) | 72.11 (3.21) | 80.34 (9.36) | 99.82 (4.68) |
| AGE | YR | D | ER | IM | IR |
| <38 years (n = 99) | 44.95 (7.59) | 29.12 (3.79) | 72.02 (3.76) | 87.18 (7.63) | 99.43 (6.87) |
| 38–52 years (n = 180) | 51.32 (8.35) | 32.65 (5.26) | 72.26 (3.62) | 78.42 (8.64) | 93.05 (8.04) |
| >52 years (n = 90) | 56.87 (8.14) | 37.60 (8.43) | 71.92 (3.07) | 78.06 (9.67) | 96.13 (8.67) |
Disclaimer/Publisher’s Note: The statements, opinions and data contained in all publications are solely those of the individual author(s) and contributor(s) and not of MDPI and/or the editor(s). MDPI and/or the editor(s) disclaim responsibility for any injury to people or property resulting from any ideas, methods, instructions or products referred to in the content. |
© 2024 by the authors. Licensee MDPI, Basel, Switzerland. This article is an open access article distributed under the terms and conditions of the Creative Commons Attribution (CC BY) license (https://creativecommons.org/licenses/by/4.0/).
Share and Cite
Criado-Del Rey, J.; Portela-Pino, I.; Domínguez-Alonso, J.; Pino-Juste, M. Assessment of Teacher Motivation, Psychometric Properties of the Work Tasks Motivation Scale for Teachers (WTMST) in Spanish Teachers. Educ. Sci. 2024, 14, 212. https://doi.org/10.3390/educsci14030212
Criado-Del Rey J, Portela-Pino I, Domínguez-Alonso J, Pino-Juste M. Assessment of Teacher Motivation, Psychometric Properties of the Work Tasks Motivation Scale for Teachers (WTMST) in Spanish Teachers. Education Sciences. 2024; 14(3):212. https://doi.org/10.3390/educsci14030212
Chicago/Turabian StyleCriado-Del Rey, Julia, Iago Portela-Pino, José Domínguez-Alonso, and Margarita Pino-Juste. 2024. "Assessment of Teacher Motivation, Psychometric Properties of the Work Tasks Motivation Scale for Teachers (WTMST) in Spanish Teachers" Education Sciences 14, no. 3: 212. https://doi.org/10.3390/educsci14030212
APA StyleCriado-Del Rey, J., Portela-Pino, I., Domínguez-Alonso, J., & Pino-Juste, M. (2024). Assessment of Teacher Motivation, Psychometric Properties of the Work Tasks Motivation Scale for Teachers (WTMST) in Spanish Teachers. Education Sciences, 14(3), 212. https://doi.org/10.3390/educsci14030212