1. Introduction
Providing labs for computational simulation and interactive classrooms for brain-storming ideas are essential in creating an environment for understanding big data problems [
1]. Information processing requires good knowledge of Mathematics strong programming skills and creativity for making user interfaces for clients [
2]. Fluency in writing is also needed for both software documentation and discussing the choice of parameters in a simulation. The unique location of James Cook University (JCU) enables students to gain employment in industries such as the military, mining, agriculture, and fishing. Students can also take up internships at research labs during term breaks.
Research is an important part of the undergraduate curriculum and can lead to publication of results in a journal. In [
3,
4], the authors showed that it is important for students to understand the research question to find a solution. Teamwork was found to be beneficial in solving research problems, since each student had different skills. In [
5] they reported a study on online quizzes for a mathematics subject and overcame a low passing rate. All students were asked the same questions with unlimited attempts to improve their understanding. The subject was taught by multiple lecturers both during the day and at night. They concluded that when the lecturer emphasized the application of concepts, the students were motivated to perform better [
6,
7].
The teacher must structure an environment where students can constantly reflect on different ways of problem solving. In such an environment, learners can recognize value by adding questions and look for multiple ways to respond to them. Hence, students must be motivated to practice an approach by actively asking questions about ideas [
8,
9]. Student response can help a teacher identify previous knowledge and help them orient to the curriculum [
10,
11]. Digital technologies have allowed for dynamic simulations that can trigger formulation of questions that can then be supported by data reasoning. This can be achieved by creating graphs visualizing relationships among data elements. Heuristics propose looking at simpler cases and assumptions to represent the problem to be solved. For example, in algebra we can simplify a circle using origin
as the centre and any point on the horizontal axis as
where
r is the radius [
12,
13].
The Information Technology (IT) discipline is unique in its presence on multiple JCU campuses. This provides an opportunity to share teaching methods with peers. The main campus acts as a role model and subject coordinator for content development and delivery. One of the requirements of the Australian Computer Society accreditation exercise is to ensure that the subject content serves as a template for future teaching.
Figure 1 shows the result of a moderation exercise of grades by the main campus in Townsville with two subordinate campuses. The aim of moderation is to ensure that performance of students is not limited by campus facilities [
14].
The distribution of students in different ranges of total scores is more uniform on the main campus. Campus 2 and 3, however, show a large variance, where some students perform very well, and some have poor marks. This could be due to small class sizes and lack of adequate teaching support compared to the main campus. Grading is also moderated by different casual support staff such as research students. This is mutually beneficial as the subject is relevant to their research and the students find it approachable.
In this article, we study the use of an online Kahoot quiz that students can join using a mobile phone for teaching artificial intelligence(AI) concepts [
15].
Section 2 discusses general approaches to teaching AI subjects;
Section 3 provides the content covered and heuristics that can be used during the Kahoot online quiz in a lecture;
Section 4 provides observations on the effect of Kahoot on student grades at the end of the term and feedback comments received. Lastly, in
Section 5 we provide our conclusions and directions for future work.
2. Approaches
In [
16] the authors compared the effectiveness of true/false versus multiple-choice questions (MCQ) quiz questions for student learning. They concluded that MCQ when combined with Face2face learning are superior in developing student skills. Their aim was to find a fast method to evaluate large classes. In contrast, our study is focused on progress made by students during the term irrespective of class size. In [
17] the authors study the process of collaboratively generating high quality MCQ in a class. They argue that repeated use of MCQ can lead to memorisation of concepts. Their study focused on whether the MCQ generation motivates students to learn and the number of likes that a question receives from fellow students. However, during our studies we considered different types of heuristics that may be converted into MCQ to help students understand a particular topic.
There has been an explosion in the number of algorithms for data analytics. Interleaving theoretical concepts with simulations has been a characteristic feature of all lectures. Encouraging students to present their work to the class has also been instrumental in increasing attendance and providing early feedback [
18]. For most external students, accessibility of materials on the subject site significantly affects performance.
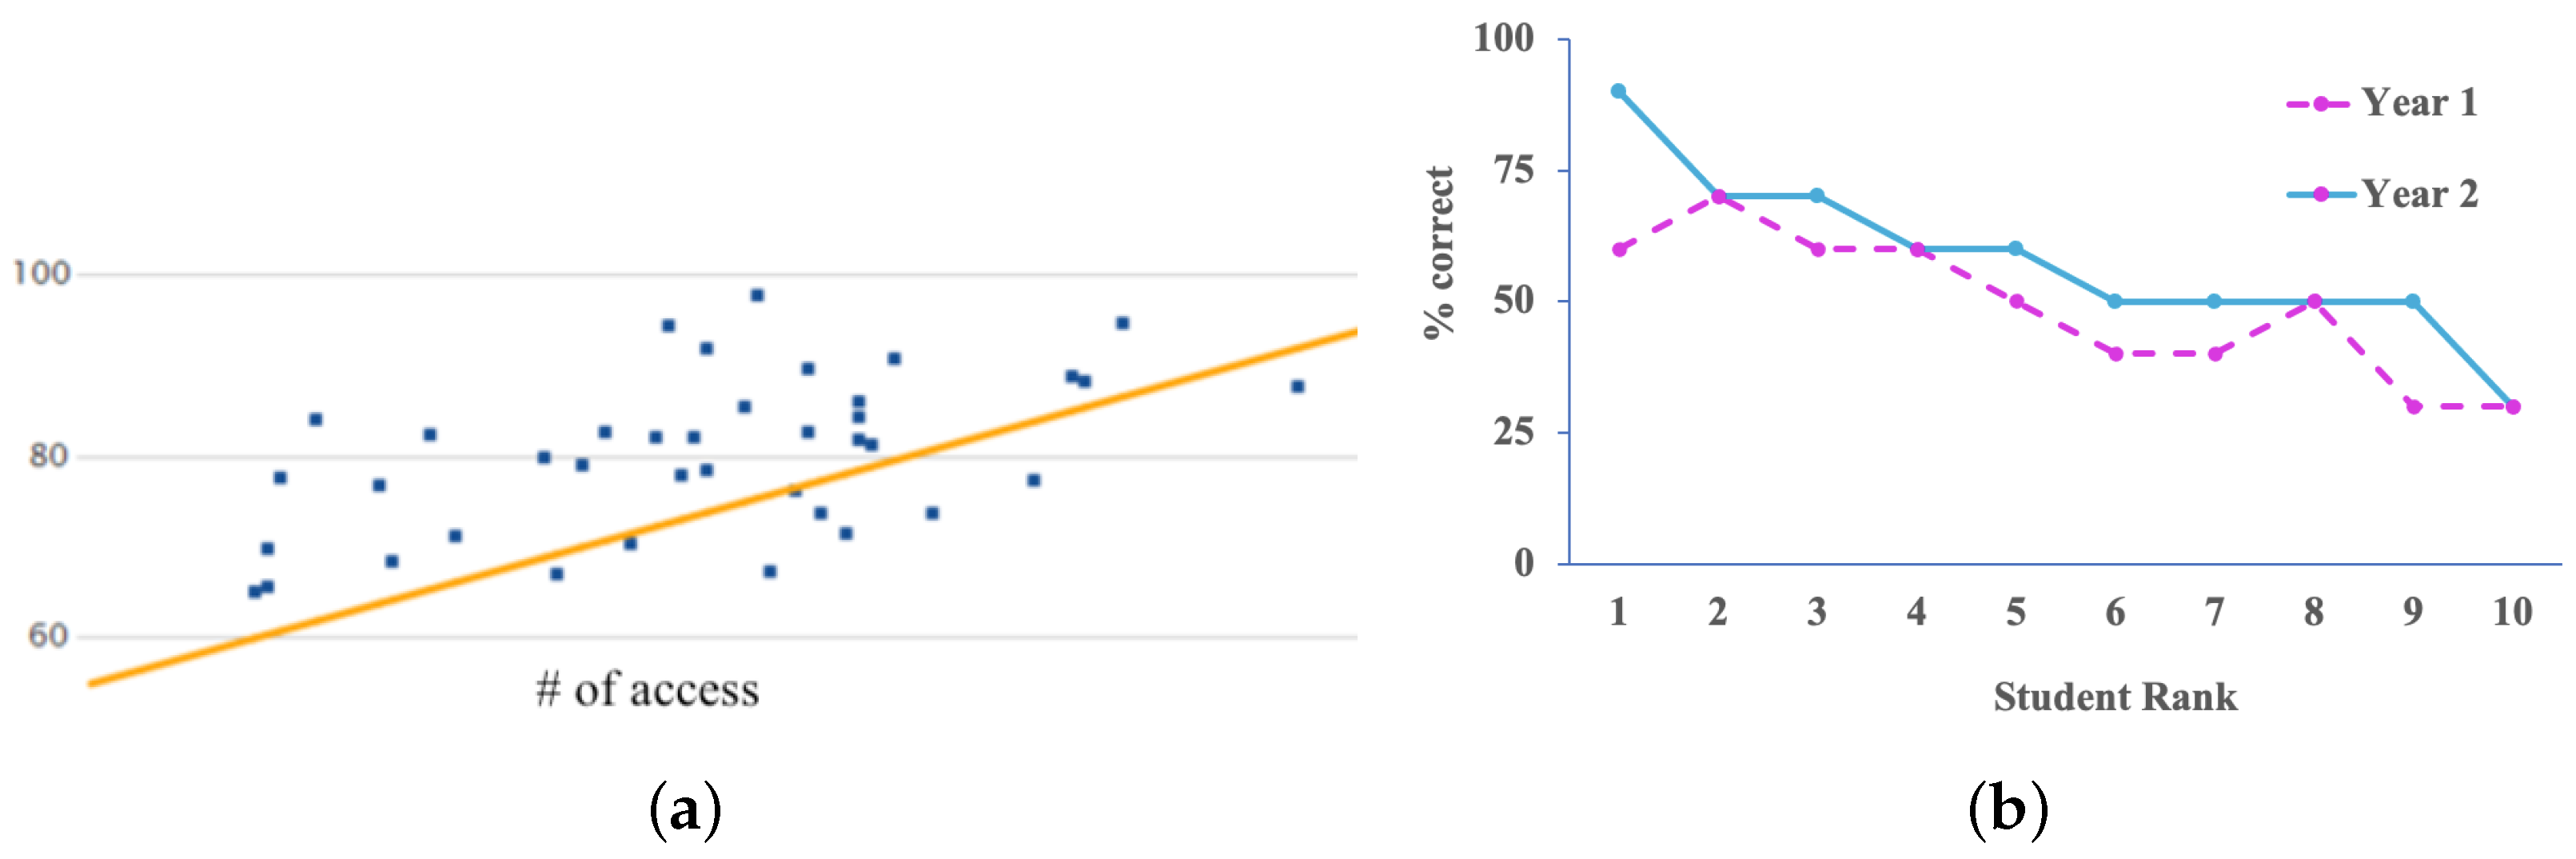
Figure 2a reinforces that student grades in 2022 were positively correlated with the number of accesses. However, the variance in student behaviour is high across all grades. Weak students are often detected as outliers when combining different types of analytics, such as lecture viewing durations and number of quiz attempts [
19].
In the past, students focused on programming skills in the first year and then learned data analysis in the second and third year. However, this year we have offered ‘Introductory Machine Learning’ as an internal subject to first year students where they are introduced to simple algorithms and learn how to make conclusions from the data. This year, students were asked to participate in a Kahoot quiz using their mobile phones.
Figure 2b shows the ranking of the top 10 students in week 9 of Year 1 and Year 2. We observed slightly better individual performance in Year 2 compared to Year 1. A paired
t-test showed that the improvement is statistically significant with a
p-value of 0.0187. Since Year 2 has increased difficulty, this indicates a large variance in student performances. Staged learning where Year 1 is a pre-requisite for Year 2 might reduce such fluctuations.
Peer review of teaching, student evaluation and teaching seminars have been critical for successful delivery of subjects to undergraduate students in IT. At the beginning of each term, a subject outline is provided to the students with feedback received and proposed changes from the previous year. Recently, IT has undergone two significant changes: (i) instead of separate teaching on four campuses, we are conducting concurrent lectures through video conferencing (ii) instead of offering a bi-semester model with 13 weeks, we are now offering trimesters with 10 weeks. This has mostly been in response to covid-related isolation and a decline in student enrollments. Hence, a refresh of subjects was needed to align with the new structure and delivery.
During the first week of the term, we try to identify cohorts with special needs. Software project management is challenging for students with vision or attention-related disorders. Here, it becomes important to reinforce concepts using visual content such as animations and serious games. Women are under-represented in my class, and we strive to make them participate in healthy discussions and strictly monitor any verbal arguments. We had to introduce an online evening session for students juggling between work and studies. Sharing personal employment experiences with them and using mature students as mentors has worked very well with designing assignments relevant to the real world.
We have received encouraging feedback from students. The response with respect to teaching and assessment feedback was mostly positive. However, several students struggled with some sections in the lectures and assessments. While it is easy to sequentially follow instructions for data analysis, students were hesitant to experiment with new datasets. Student feedback was supported by high evaluation scores. However, only a small percentage of students responded to the survey, probably due to COVID.
We conducted a peer review of teaching with other universities that emphasized that one of the main purposes of education is employability. Hence, greater context to real world industry examples needs to be introduced into lectures. The review also prompted us to allow group discussions when completing the assignments [
20]. Another suggestion was to allow students to select their datasets from data challenges such as Kaggle. We also conducted an industry review of the curriculum and received suggestions on how to update the subject to current market needs. To deal with low student scores, it is recommended that the rubrics encourage a personal approach to problem solving such as that followed by leading companies. It was advised to show them how to solve the assignment on parallel datasets.
3. Methodology
In the past, student behaviour was attributed to individual responses to external stimuli. Here, information was presented in the form of sequential instructions. The instructor was the centre of the interaction, and the role of the learner was to absorb the material presented. Traditional approaches to teaching mathematics assumed that each student responds differently to the material presented. However, recent approaches suggest that knowledge is constructed by a learner based on his experiences. When a student encounters a situation he/she can’t understand, then he seeks new knowledge to solve it. In such an approach, it is necessary to design open-ended questions to reveal the prior experience of a learner. One of the advantages of this method is that it can allow deduction of complex scientific equations.
Planning teaching activities can help achieve predefined objectives with reduced wastage of time. It also provides direction to both teachers and learners so that significant gains are made within a few months. Learning experiences have to be designed in view of the subject to be taught. An appropriate learning environment must be created for learners with diverse backgrounds. These experiences should also promote higher socio-cognitive interactions in the classroom. For example, heuristics described in
Table 1 provide an opportunity for alternate ways of solving and enhance the creativity of the learner. A concept map showing relationships among different sub-topics will make it easier for a student to participate in class activities. For instance, the Kahoot quiz has many gaming components that make the class fun.
For this study we considered a class size of 50 students in Year 1 and 75 students in Year 2. Over 15% of the students were from non-English speaking backgrounds and 40% had an Australian Tertiary Admission Rank (ATAR) score below 75. Minorities included disabled students (5%) and indigenous students (5%). There is a gender imbalance in IT with only 20% female students. Recently, there has been an increase in students from metro regions (30%) and external online students (15%).
AI-based games in Unity and YouTube videos were particularly popular with the students. Participation marks were offered during practicals where students were invited to solve the questions in front of the entire class. This allowed for instant feedback from students on how to make conclusions from graphs [
21]. Solutions for each practical were provided a week after the due date so that students can improve through self-reflection. For the second-year subject, the end-of-year exam was replaced by two assessment tasks on the same dataset. The first assessment was of lower weight with preliminary data analysis and the second one required much deeper understanding of the subject. A parallel dataset was used in class to demo the assignment so that students could learn by comparing the results on both problems.
To measure student learning this year, we introduced a Kahoot quiz during the recess of each lecture that students could attend through their mobile phones from different campuses. The top student score in each quiz was given a bonus mark and encouraged students to compete to do better. Selected questions with low response rates were used to make the graded quiz assessments in the term.
Depending on the topic, we can employ different heuristic approaches to teaching content related to AI.
Table 1 provides some of the main concepts covered in Year 1 and Year 2 subjects. The second column provides a possible heuristic approach to teaching that concept. For an introductory subject, we use Java-based software with a Graphical User Interface (GUI). The student only has to alter parameters for a particular algorithm and the software generates the results and graphs. For example, if you want to convert temperature to discrete states, you will have to select a splitting strategy for hot and cold.
Figure 3 illustrates the selection of parameters for a neural network training, such as ‘Hiddenlayer configuration’, ‘Learning rate’ and ‘Training time’. The output vector space shows that the three classes given by red, blue and green are well separated by the classifier.
For the advanced subject in Year 2, we allow students to use Python libraries. This requires knowledge of software development and allows simulation on very large datasets with millions of samples. For example, when selecting an explanatory and response variable, we can use correlation to select the best combination. This year we introduced 10 Kahoot Multiple Choice Questions (MCQ) during the lecture recess of two Year 1 and Year 2 subjects on AI.
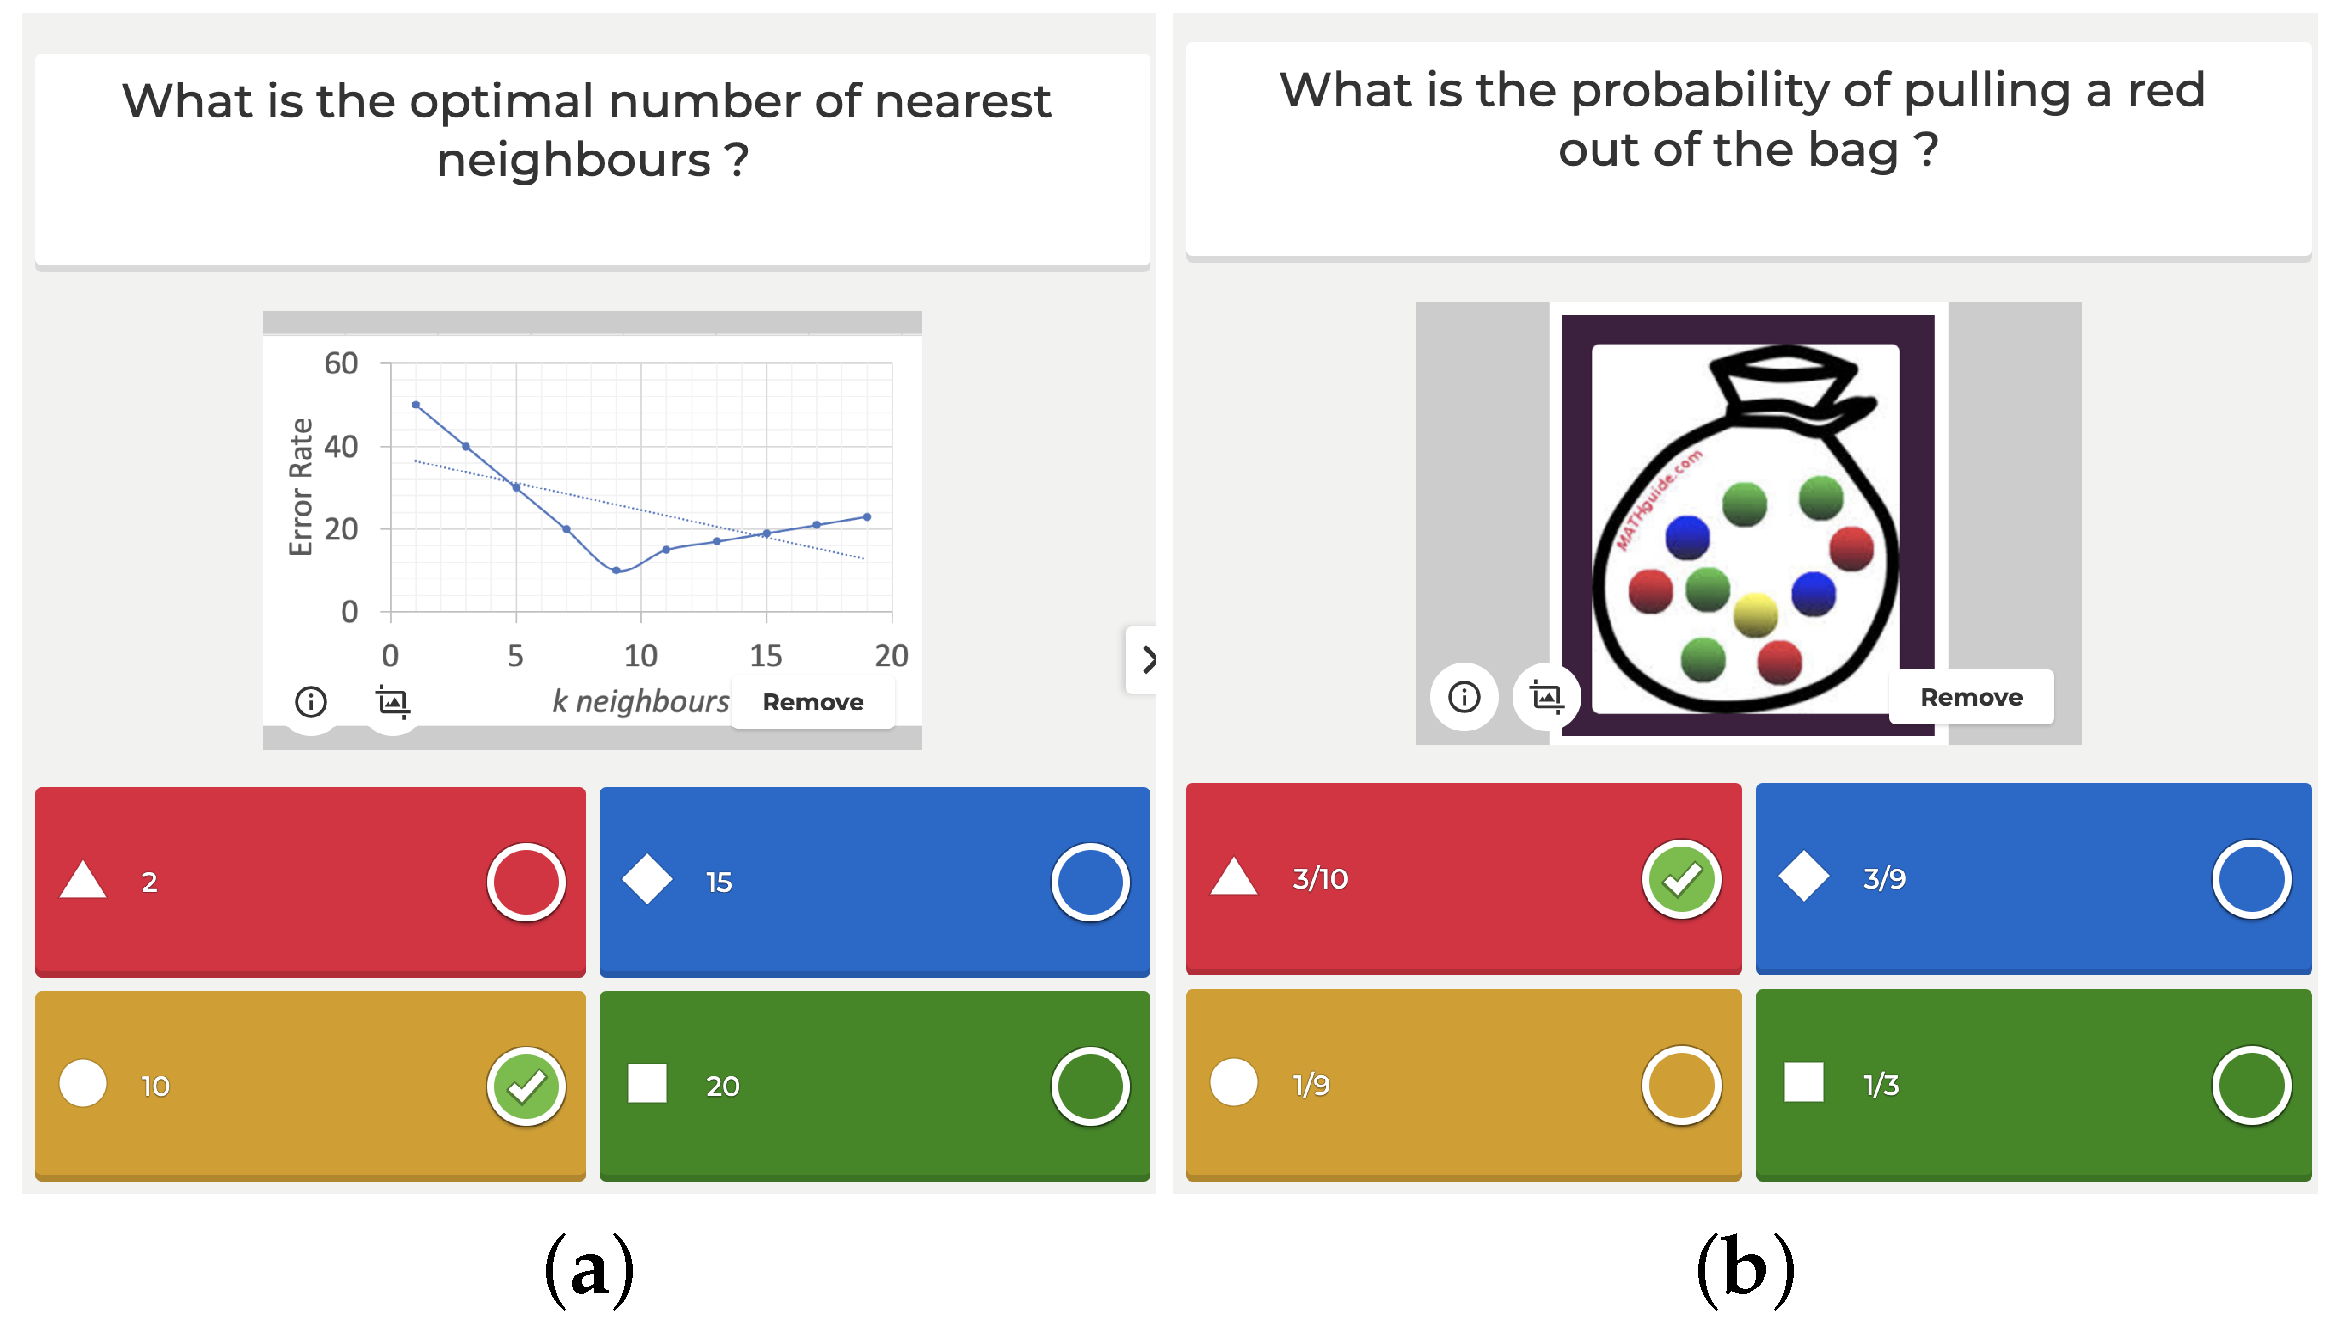
Figure 4 illustrates an example of MCQ’s from the two subjects. For the introductory subject in Year 1, students had to run different algorithms using Weka software and determine the best parameter settings for high classification accuracy. The second-year subject covered advanced concepts such as the use of Python scientific libraries to study the underlying distributions of data.
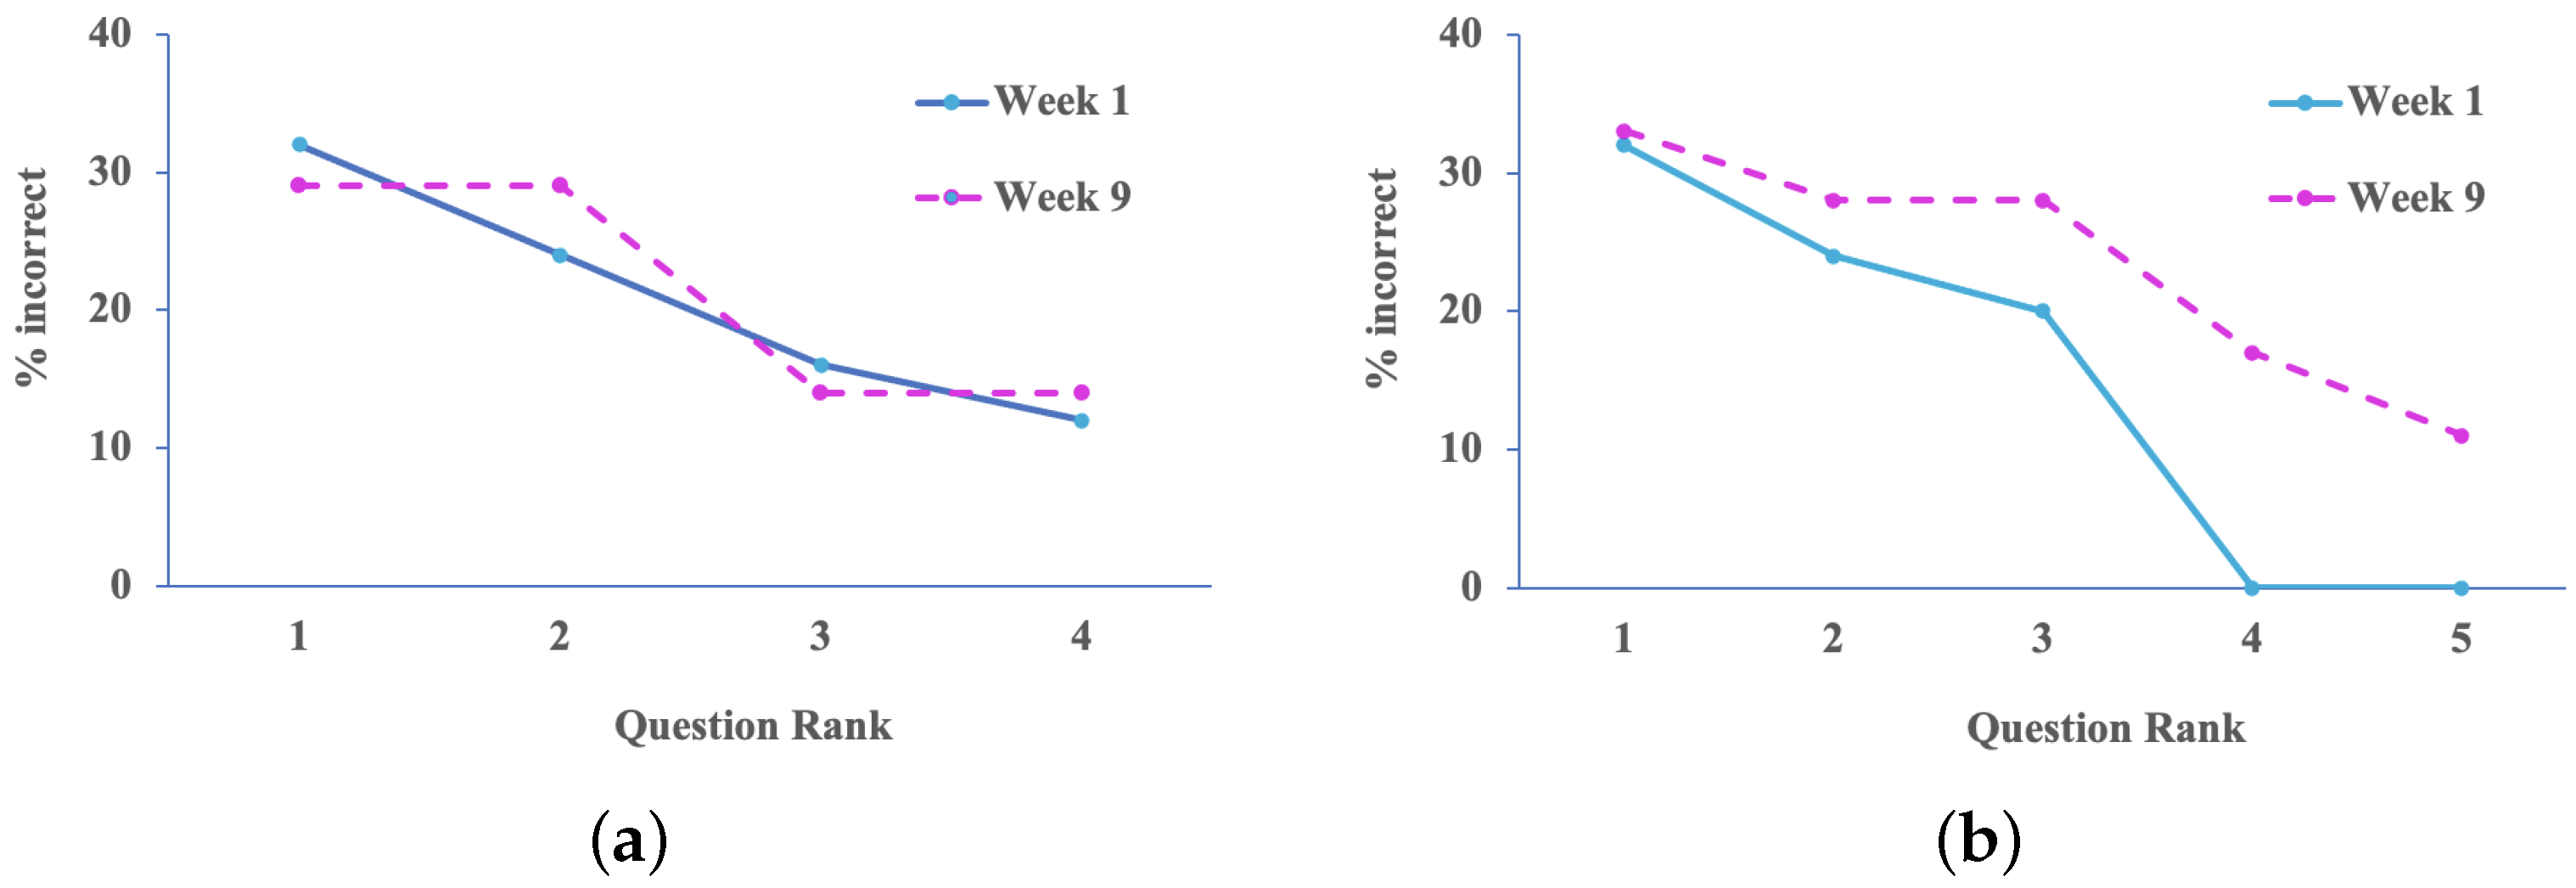
Questions for which more than 10% of the students were incorrect were compared between week 1 and week 9 of the term. For Year 1, four out of ten questions in the quiz had a high failure rate as shown in
Figure 5. Student performance did not change much across the term. In contrast, for Year 2, students performed better in week 1 compared to week 9. For example, only three questions had more than 10.
4. Results
To interact with students effectively, a teacher must use digital technologies. Teaching aids can be classified based on the senses they stimulate. For example, lecture notes are a form of visual aid, and the human voice connects to our sense of hearing. New emerging media such as group discussions through video conferencing are multi-sensory. AI also requires the use of supercomputers that can process gigabytes of data in a few seconds. Such electronic or E-Learning can minimize the cost of education.
In the past, E-Learning was limited to asynchronous communication where students and teachers interacted via email. Using the internet, it is much easier to achieve synchronous communication conversations with students in real time. During video conferencing, students can also see the teacher from remote locations. Hence, an online classroom is distinct from the traditional approach of verbal communication using multi-media for teaching. The internet is also a source of information to support teaching.
A student feedback survey was conducted at the end of the term as shown in
Table 2. Feedback about the weekly quiz during the lecture was positive in both Year 1 and Year 2. For example, a Year 1 student said that ‘Kahoot is a great way to track our progress.’ However, we observe a lack of conceptual understanding in students. For example, a second-year student says that ‘Running codes is much easier than explaining results’. Students were not able to understand the real-world ocean dataset provided for the assignment in year 2.
Written tests can be classified as subjective or objective. A subjective test includes essay type questions where the evaluation depends on the process of solving them. MCQ’s, on the other hand, are objective in nature and have become popular because the solution has high reliability. This type of learning can only be attained by in depth study and memorization. During Year 1 this year we conducted a closed book written exam. There was also an individual project component where rubrics were provided. For AI, the accuracy of each step and the completeness of work were key indicators of performance. For Year 2 subject, students had to only complete two assignments that were evaluated based on creativity and originality of the information.
For year 1, students were provided a benchmark dataset and asked to train a classifier using Weka GUI. No sample solution was provided. The large number of available parameter options in the software appeared to confuse them. During year 2, students were asked to analyze a big data problem using Python libraries and a sample solution was provided. They were next asked to change the arguments in the Python function call for a new dataset. While they understood the sample solution, they were not able to apply the knowledge to a new task. This indicates that students require a lot of practice in analyzing diverse problems and under different parameter settings.
In
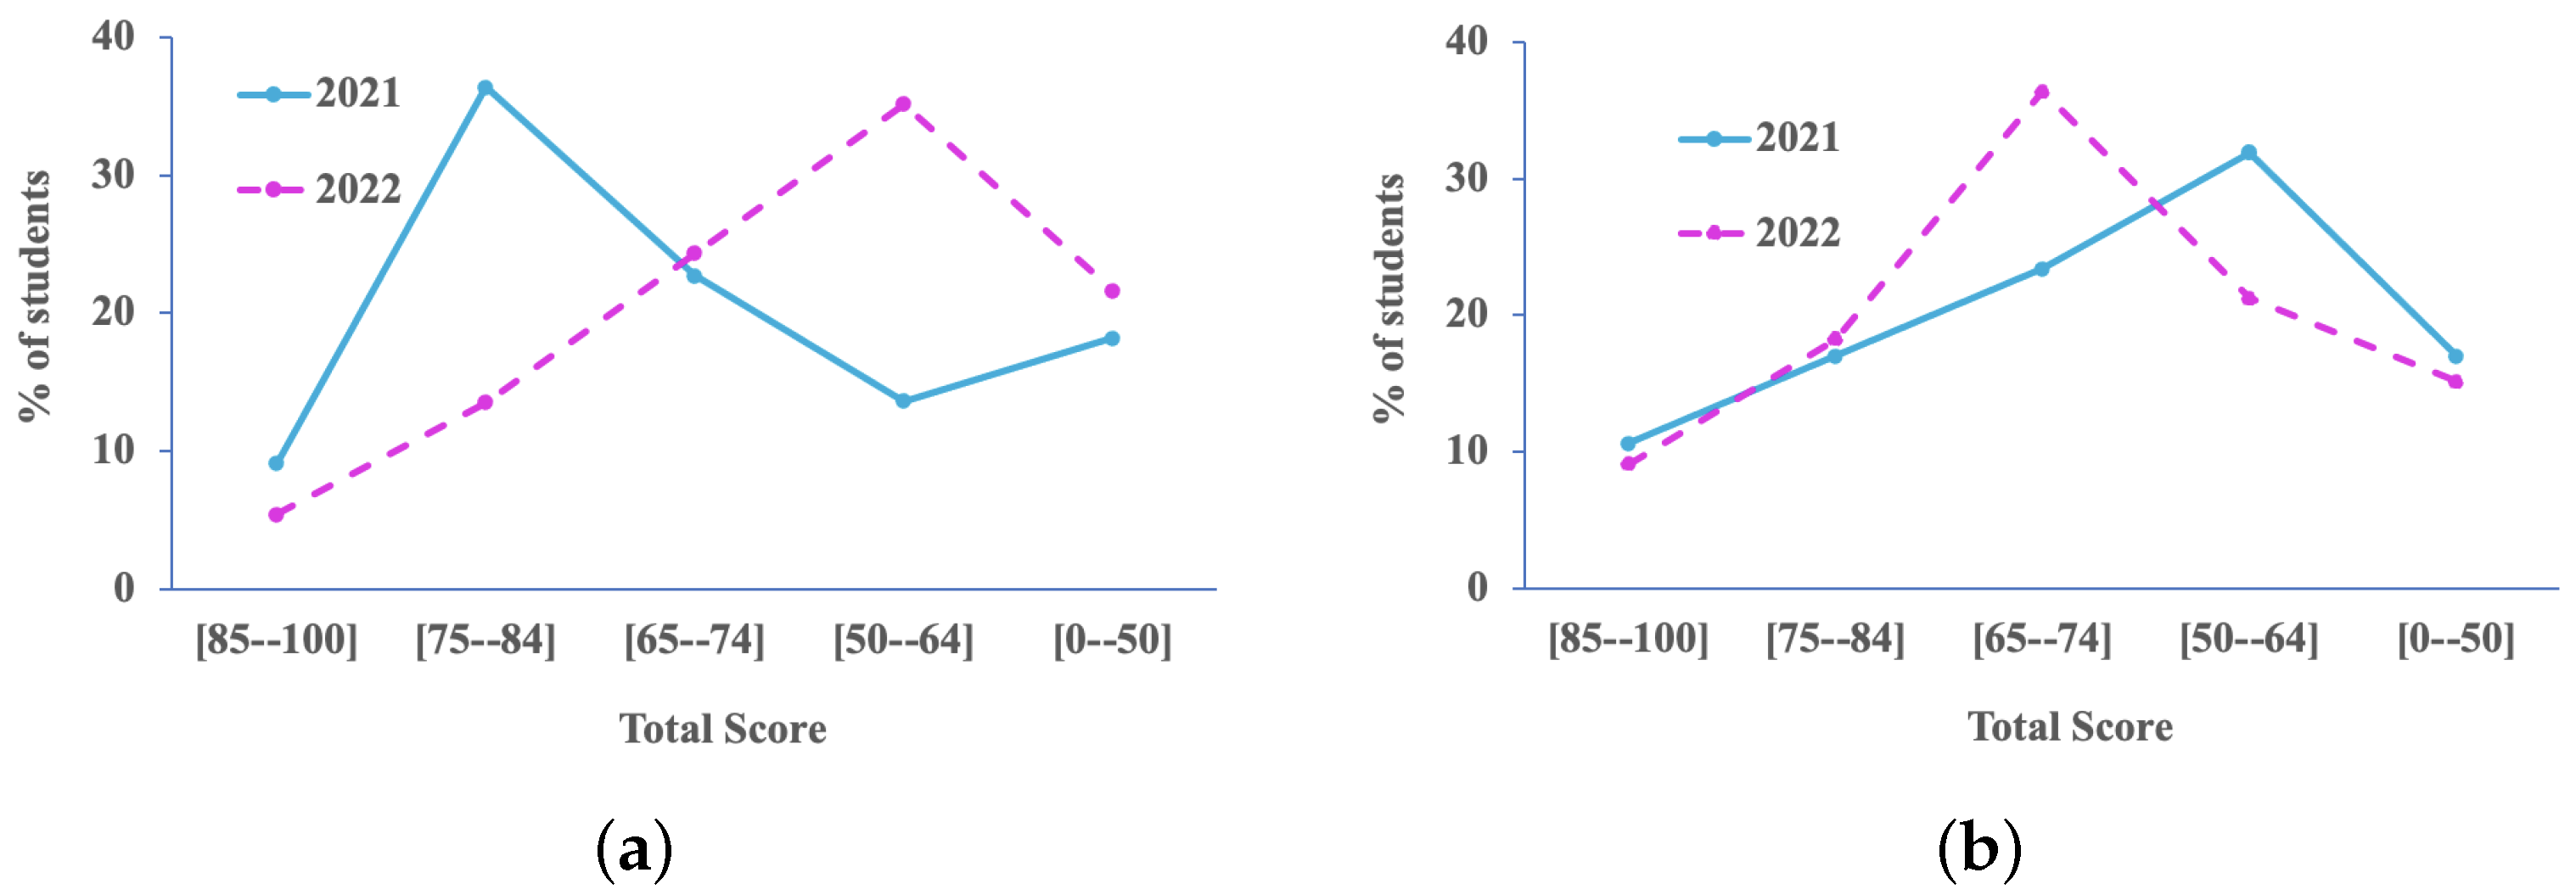
Figure 6 we compare the total subject score distribution before (2021) and after (2022) introduction of the Kahoot quiz during the lecture. Year 1 saw a decline in the overall student score with a peak in the range of 50 to 65 marks. Year 2, on the contrary, saw an improvement in student scores with a peak in the range of 65 to 75 marks. One of the reasons for the lower grades could be that the final exam was conducted as an open book online in 2021 due to the pandemic. For Year 2, the exam was replaced by two assignments. Another reason could be that Year 1 students are transitioning from school life to university and are introduced to data analysis for the first time.
To quantify the improvement we conducted a chi-square test on the grades shown in
Figure 6. For Year 1, the result was statistically significant with a
p-value of 0.00024. However, for Year 2 the result was not significant, with a
p-value of 0.2. We can hence conclude that the introduction of a closed book exam has significantly reduced student grades for Year 1 students. The use of Kahoot resulted in some improvement in grades for Year 2 students. In this study we have tried to quantify the effect of Kahoot quiz on student learning in 2021 and compared it with 2020 when no quiz was used. Hence it is sufficient to use two years of data.
5. Conclusions
This study provides implications of how an introductory machine learning subject was transitioned from online self-study to live lectures. There was a decline in overall student scores, indicating that students require a lot of practice in data analysis. Student performance in the Kahoot quiz showed a large variance. This could indicate that some students have not understood the simple algorithms before progressing to advanced topics such as data distribution. Student feedback suggests that lectures and assignments are particularly difficult. The use of parallel datasets to demo the assignment solution would hence be helpful in improving student confidence.
Following the concept of strands for programming or data mining, it was necessary to show continuity in learning and assessments between the year 1 and year 2 subjects. While in year 1 students can use existing software for data analysis and only interpret the results, in year 2 they have to develop the backend code for such software. Theoretically, year 1 introduces simple concepts such as data representation and training of models. The lectures aim to provide a gradual transition and application of school level mathematics such as linear algebra and probability to more complex models [
22]. Year 2 dwelled deeper into data collection and how to create a research hypothesis. We also found that the Kahoot online quiz resulted in significant improvement of student grades for Year 2 students.
The most challenging part was teaching students how to design experiments. Students were allowed to select a pair of variables from the dataset and study their relationship using available Python libraries. For example, one can show that temperature decreases with depth under water. Due to the high level of noise in real world data, students easily got confused and were unable to visualize meaningful trends. To deal with this problem, we taught them how to use charts to visually observe variables and narrow down possible relationships before performing in-depth analysis. It was necessary to make them use common-sense to design a hypothesis before running the software and trying to make conclusions. They were encouraged to discuss findings with respect to a bigger picture, such as making decisions in commercial settings. Instead of relying only on assignment submissions, Additional weight on class participation and learning can hence help weak students.


