Abstract
Interest influences adults’ and young learners’ learning in formal and informal contexts. Although interest and interest development frameworks have been used in research on student-learning, they are not used in teacher-focused research, especially as “outcomes” of teacher professional development (PD) activities. In this study, we used interest development as the outcome of PD in computer science (CS) and investigated the factors that influenced teachers’ (n = 5) interest development toward CS using various data sources and analysis methods. We found that interest development is (a) varied, (b) influenced by self-relation, knowledge, and affect, (c) associated with reengagement with PD activities, and (d) it can be captured using computational text analysis methods and online log data.
1. Introduction
Interest, as a motivational variable, describes a positive psychological state and a desire to (re)engage with activities [1]. Historically, interest has been defined as the key motivational construct for learning [2]. Yet, it has rarely, if at all, been a factor that is kept in consideration for teacher learning, especially in professional Development (PD) activities. PD literature placed special emphasis on “attitude change, or commitment to innovation rather than its results or the processes by which it worked” [3] (p. 181) and is replete with studies on effective PD design elements [4]. Although there have been significant shifts in PD research, interest as a motivational factor has mostly been used in student-focused research and not teacher-focused research [5].
Teachers’ PD activities are structured and unstructured learning experiences that the teachers participate in to learn new content or pedagogical skills and engage in personal growth [3]. Teachers can engage in various PD activities each year, ranging in scope, duration, content, and delivery. Online PD opportunities have recently become widespread [4]. Although teachers attend PD opportunities, their sustained engagement and completion rates vary, as is the case with most massive open online courses (MOOCs) [6,7]. Interest enables teachers to use their learning during and after PD. After a PD activity, some teachers try to apply their learning in their classrooms. However, some teachers prefer not to use them [8]. It is, therefore, important to understand the “how and why” of teachers’ sustained engagement in PD opportunities, especially when they are optional or voluntary. In this paper, therefore, our purpose was to explore the variance in the interest development among teachers during a semester-long online professional development and identify the components of interest development through existing and new data analysis methods to identify how it develops and impacts engagement and reengagement with the PD activities.
2. Background
2.1. Interest and Interest Development
Interest is the desire to reengage with tasks [1]. It is, however, composed of various cognitive and affective components [5], which makes it a key motivational factor and a robust predictor of task engagement and performance [9]. Interest is a critical variable in predicting attention and learning. Interest researchers (i.e., [1]) define interest as “a cognitive and affective motivational variable that develops; its components include knowledge, value, and feelings.” (p. 24). This definition also highlights the importance of knowledge and affective factors. In their most recent work, Renninger and Hidi (2022) highlighted the importance of self-relation, or individuals finding a connection with tasks for interest.
Dewey (1913), in his seminal work, describes interest, its difference and similarities to effort, and its role in education and learning. According to Dewey, interest(s) “in the emotional sense of the word, is the evidence of how the self is engaged, occupied, taken up with, concerned in, absorbed by, carried away by, this objective subject-matter” (p. 90).
Based on his description, the key elements of interest are self-relation to a task/topic, including self-identification with the process and its outcomes. For example, for someone interested in designing games, although challenging, attending a course to learn about game design could be of interest. The person’s continued attendance on the course would signify developing interest. This perseverance, according to Dewey, is a sign of interest and engagement with the subject.
An important aspect of interest is that it is a dynamic construct: it can develop or diminish; people can gain or lose interest and regain or re-lose their interest in certain things. One theory that guides interest development is Hidi and Renninger’s (2006) early work that categorizes interest into four distinct phases (Figure 1):
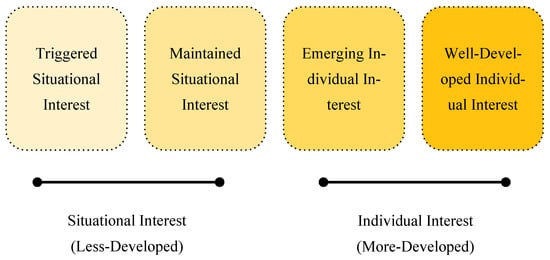
Figure 1.
Interest Development Framework [1,10].
The first phase of interest development is triggered situational interest, where someone is introduced to a topic/object that they find interesting. Through various social, self-related, and content-related factors, interest development happens. It should be noted that, however, that interest development is not linear, nor is it a guaranteed [11].
Interest development is supported by key factors: value, knowledge, and affect [5,9]. Self-related information processing (or value) is one of the key factors for interest development [10]. Simply put, this relates to individuals’ finding a connection between the target task/object and their lives [2]. Recent research (e.g., [12]) and extant work (e.g., [13]) have provided evidence for the importance of self-relation in their work, where they tested the effectiveness of utility value interventions. As evidenced in this body of work, for example, Hecht et al. (2021) found that students’ interest developed after engaging in reflection activities where they reflected on the connection between their lives and the subject matter.
Another important aspect of interest development is knowledge increase. In all interest development models [1,2,5,10], learning more about a certain topic is a key component of interest development. Once interest is triggered, therefore, it is essential that the individuals both develop a deeper knowledge of the subject matter and relate to it. Increasing content knowledge is essential for developing an interest [1].
Finally, the affective component of interest development refers to the positive emotions accompanying engagement with a task [1]. Along with the cognitive components (self-relation and knowledge), the affective element plays a key role in interest development, especially during the early phases. For example, Renninger and Hidi (2016) describe a person’s interest development in a hobby (e.g., photography) during the early stages of enjoyment.
Despite its importance for learning and education, interest has not been widely used in teacher-focused research [5]. Even rarer are studies where an interest development framework was used or that use interest or interest development frameworks in the context of teacher professional learning. Especially in contexts where voluntariness (and interest) is of utmost importance, interest can be used as a proxy for engagement. We do not know of any research studies investigating teacher engagement in PD activities through the interest development framework. Therefore, our research fills and bridges an important gap and brings interest development (i.e., educational psychology) theory into teacher professional learning research and literature.
2.2. Teacher Professional Learning
For more than 30 years, researchers have tried to identify effective PD features with varying names and numbers. A consensus has almost been reached on the key factors: collaboration, active learning, content focus with best examples, support mechanism with facilitation, sustained length, and relevance/alignment [3,14]. Additionally, Bragg et al. (2021) identified similar design elements for PD efforts with online components and added a focus on flexibility and delivery mode as two additional critical components. Collectively, PD activities with an intentional design by these elements have a better likelihood of producing improved teachers’ knowledge, skills, practices, and student achievement. However, it should be noted that, in any learning and teaching context, high fidelity is not too common and depends on many internal and external factors.
Literature reviews and studies on computer science (CS) PD have pointed to similar PD design features [15]. Using the extant evidence on effective PD, we designed and offered a year-long PD program with in-person, live, and online activities to co-develop a CS curriculum for middle schools through a sustained CS content and pedagogy-focused PD.
2.3. Project GAME Professional Development
To prepare teachers to teach middle school CS using game-development activities, we designed and developed a program that involved teacher PD, curriculum co-development [16] and curriculum implementation. In this study, we focus on the teacher PD component of the program.
Due to the COVID pandemic, the first part of our PD activities was offered online during the fall semester (four months). The online PD activities included several platforms and modalities. Each week, teachers:
- were assigned weekly videos (5–7 min each) from a video-based course. Forty-five videos guided the teachers in designing, coding, and developing two games.
- had weekly videoconferences (n = 17) with the project PIs to discuss content-related topics for each week and reviewed the essential concepts covered in the lesson videos.
- participated in asynchronous text-based activities in an online LMS each week (n = 31). They reflected on their learning progress and posted responses to some discussion prompts.
We aimed to promote teachers’ interest development through a motivational design model of Attention, Relevance, Confidence, and Satisfaction (ARCS) [17,18]. The ARCS model provides an effective learning environment to engage teachers in online learning [19] and has been shown to enhance teachers’ engagement and reduce attrition [20].
First, to attract attention, we closely worked with the teachers, provided guidelines for them to navigate online materials (videos and activities in LMS), made announcements to notify teachers of the updates, and dedicated times to visit the teachers at their school and to communicate personally with the teachers for their needs.
Second, we established relevance by considering the bill mandating every middle and high school in the state to offer CS courses by 2024–2025. We also aligned our co-developed curriculum with the state standards to make the effort of learning and designing the curriculum relevant. Moreover, we recruited volunteers who responded to our call for participation in the study. This was a bottom-up approach that helped the teachers see the relevance of the work [14].
Third, we provided the teachers with high-quality PD materials and expert examples with varying difficulty levels to boost their confidence. We awarded badges to the teachers who completed the learning modules on time for encouragement.
Fourth, to keep teachers satisfied with their learning experience, they were provided incentives for participating in any learning activities and were asked to provide feedback about the process to make revisions helpful.
2.4. The Current Study
PD activities for teaching CS are becoming increasingly important as states start preparing for a teacher workforce that is interested in and capable of teaching CS in K-12 schools. Despite its established importance in learning, interest theory as a theoretical framework and an independent variable has not yet been a focus of teacher-focused research. As a key factor that impacts learning, we believe studying interest development in teacher professional development contexts can help us design more effective PD activities. Moreover, although interest development and its components have been well theorized (e.g., [10]), we are not aware of any research that investigates each component (i.e., self-relation, knowledge, affect) in how they contribute to interest development in a systematic and quantifiable manner as we developed in this study. In other words, although interest development theory has a strong theoretical basis, as well as studies that provide research evidence (e.g., [21]), they are limited in their scope (e.g., short-term observational data) and do not examine the role of specific interest development components. We also believe the data collection and analysis approaches we use in this study present a viable way for PD providers and researchers to consider interest (development) as an outcome variable. Therefore, our study can be a model for future interest research and teacher professional development researchers due to its reusable methods and targeted data collection and analysis approaches.
Our purpose in this study was to explore the variance in the interest development among teachers during a semester-long PD and identify the components of interest development by investigating various conventionally used data sources. The analyses approach is commonly found in pretest, interview, and discussion (text) data. Given that interest develops differently for different individuals, and there are key factors that guide (and indicators of) its development, we sought to answer the following research questions:
- How did the teachers differ in their knowledge, self-relation, and excitement during the PD?
- How did the teachers differ in their engagement/participation?
- What are the interest profiles of the teachers (based on their knowledge, self-relation, excitement, and reengagement during the PD)?
3. Methods
To answer our research questions, we collected various types of data over a four-month time span. We approached data analysis from different perspectives to triangulate our data and paint a complete picture.
3.1. Participants, Context, and Procedures
The participants were five teachers working at middle schools in the Southeast US with varying levels of teaching experience (Table 1).

Table 1.
Participants’ teaching and CS teaching background.
The PD was offered during a fall semester during the COVID pandemic; therefore, the activities were offered fully online. Teachers participated in the PD voluntarily (i.e., the PD opportunity was announced in their schools, and they signed up), but compensation was provided through external funding for their participation. All PD activities were, therefore, optional for the teachers, but the PI team encouraged and supported their participation.
3.2. Instruments and Data Sources
We obtained data from various sources in the first four months of the PD program. First, we obtained data from a video-based learning platform regarding the number of videos the teachers watched. We also noted down the teachers’ attendance at the hangouts. Finally, we accessed the LMS logs to identify teachers’ page views and assignment submission numbers.
In addition to this data, teachers completed a CS test at the beginning and end of the PD, measuring the key concepts covered during the online PD. The test included questions where they identified CS concepts in each code or cases where they wrote the code for a given problem scenario.
We also collected the teachers’ assignments as text data. These data were gathered inside the LMS modules through weekly discussion posts, reflections, or exit tickets. The questions focused on asking the teachers about their learning experience (e.g., Write one thing you learned today.) as well as deeper questions that involve reflection on their learning (e.g., What has motivated you throughout video-based lessons to learn about computer science?).
3.3. Measures and Data Analysis
We adopted quantitative and qualitative approaches in analyzing our data. We have used several data sources and methods to create our quantitative measures. We tallied teachers’ video views, hangout attendance, page views, and assignment submissions from the LMS as measures of engagement and participation. We also created a CS knowledge measure by grading the CS test results using an answer key (7 questions, for 10 points each).
For each quantitative measure, we calculated a Percent of the Maximum Possible (POMP) score (Cohen et al., 1999). POMP scores interpret the scores easily by converting each score to a percentage out of the maximum achievable score on a given scale. POMP scores, therefore, provide a unified sense of the percentage achieved:
Using POMP scores in this manner allowed us to convey a meaning similar in magnitude and allows for comparison across different constructs [22]. Although not frequently used, POMP scores have been used in various educational psychology studies recently [23].
While analyzing the log data from the LMS, we noticed that the means or standard deviations of page views or assignment submissions were not fully useful in giving us a sense of the “steadiness” of participation. In our four-month PD, we noticed that while some participants visited the LMS and completed their assignments weekly, others completed their assignments in fewer instances. For example, one participant had 16 assignment submissions in total, and nine submissions were made in one day. Comparing this to another participant who had 31 submissions in 11 visits, we realized the need for another statistic to explain the steadiness in attendance. Therefore, we used the coefficient of variance (CV), measured by dividing the mean value by the standard deviation of the mean, as another metric to evaluate the LMS log data. CV points to the level of variability about the population means [24] and therefore represents how one participant’s variation is compared to the rest of the sample.
We approached the analysis of assignment text data in two ways. First, we used conventional qualitative analysis methods and looked for patterns in the data. Since we had directed research questions and a theory guiding our analyses, we used hypothesis coding [25] to analyze the text data for indices of interest development: knowledge, self-relation, and affect. In addition, we also benefitted from magnitude coding by counting how many times these indices appeared in the text to show the frequency at which the participants used them. Providing the frequency of these categories helped us identify each factor’s magnitude and dimensions for each participant [25]. During this process, a researcher first identified the keywords for the hypothesis coding based on the interest theory. We specifically used the indicators highlighted in the most recent interest development article by [10] as the three components of interest development: knowledge, self-relation, and affect. For example, a sentence that reads “I am excited learn more about …” was coded as “affect,” while a sentence that talked about “I learned about …” was coded as knowledge. Another researcher then checked this coding and agreed on the words and concepts that could be counted in each theoretical category. Upon this, the initial researcher completed the identification and counting of the codes both for hypothesis and magnitude coding.
To triangulate our human coding, we also used computational text analysis methods. First, we used the Linguistic, Inquiry, and Word Count software: LIWC-22 [26] LIWC-22 “At its core, LIWC-22 consists of software and a “dictionary”—that is, a map that connects important psychosocial constructs and theories with words, phrases, and other linguistic constructions” [27] (p. 2). Using the digital text data, the software compares the words in the dataset against the words in the dictionary. LIWC-22 then provides scores by “counting all of the words in a target text, then calculating the percentage of total words represented in each of the LIWC subdictionaries.” [27] (p. 3). In addition to the default dictionary that contains 12,000 words and 12 constructs (e.g., Cognition, Affect, Social processes), LIWC-22 also allows for creating user-made dictionaries. The user-made dictionaries allow for the creation of context-specific dictionaries in addition to theory-based ones. Instead of presenting the means for LIWC scores, we report the sum to reflect the depth of each participant’s contributions. Like the CV, by providing the sum, we aimed to capture and consider the steadiness and cumulative effort of participants’ contributions.
We used the tidytext R package [28] to calculate Term Frequency-Inverse Document Frequency (TF-IDF) to see what words were significantly present in each participant’s data. TF-IDF “works by determining the relative frequency of words in a specific document compared to the inverse proportion of that word over the entire document corpus. Intuitively, this calculation determines how relevant a given word is in a particular document” [29] (p. 30). In other words, it shows how important a word is (for each participant’s text data) compared to the rest of the corpus.
Combining the results from various measures, we placed participants into low, mid, and high categories for self-relation, knowledge, and excitement.
4. Results
4.1. RQ1: Differences in Self-Relation, Knowledge, and Excitement during the PD
4.1.1. Self-Relation during PD
One key factor in interest development is self-relation [10]. Therefore, we investigated the teachers’ answers to find traces of self-relation to identify value-related patterns.
Qualitative Analysis. We approached the qualitative (i.e., human coding) of the text data in two phases: First, we identified different types of self-relation language. We categorized self-relation indicators under two main categories: low and high. Then, we counted each participant’s frequency of self-relation terms to reach a sense of their self-relation profile. We then grouped our sample into three categories based on the frequencies of self-relation language in their data (Table 2). We followed the same approach to the other dimensions.
Table 2.
Self-relation Analyses Results.
After identifying self-relation quotes for the participants, we investigated the language used to see if there were different patterns. The key difference between participants’ self-relation language was that while generic statements identified low self-relation, high self-relation was indicated by quotes that included specifics. For example, as can be seen in the following quotation, Teacher D suggested: “I am still excited about the program because I know it will offer a great opportunity for the students at my school to be exposed to the other side of GAMING (sic.)”. This quote lacks specifics regarding how and in what ways it would be a great opportunity for the students. Similarly, another teacher, Teacher C, argued: “The biggest thing about programming is understanding the concept of solving a problem. Understanding the flow chart is applicable to Unity and solving issues in life”. It is hard to discern from these quotes, and low-self-relation quotes like this, how and why learning programming would be related to real-life problem solving.
On the other hand, the indicators for high self-relation included more details regarding the “how and why” of such a connection. The teachers’ responses involved more detail connecting these ideas to what they learned. For example, Teacher B described how learning programming was related to problem-solving like Teacher C, but they gave more details on how and connected these ideas to the course:
Considering the focus on product creation for solving real problems, this course would enable students to construct an understanding from evaluating applications and what it produces and identifying solutions. From the perspective of showcasing what a program looks like and what it can do, our students should be able to see and comprehend what elements of coding (computer programming) allow certain things to happen.
High self-relation indicators also included the relation of the PD program to others’ lives in a specific and targeted manner. For example, Teacher B described their relationship to coding and how they were motivated to teach their students: “What has motivated me throughout the course is the fact I am doing something that I once loved to do and moved away from and also the fact I am learning it to teach it to my students”.
In this part of the qualitative analysis, we concluded that teachers who developed self-relation to the PD content included specific arguments regarding the how and why, while the teachers with low self-relation described it in more generic terms.
Frequency of Responses. Approaching the qualitative analyses with a quantitative perspective, we counted the number of occurrences of self-relation-related quotes. We should note that all the teachers received the same prompts while answering the questions on different platforms. In our analyses, we found that while some teachers responded several times with detail, other teachers’ reports were limited. As can be seen in Table 2, two teachers, Teacher A (four times) and B (six times) made significantly more self-relation connections while answering the prompts compared to the others (C: two times, D: one time, E: none). The low self-relation teachers not only mentioned self-relation less in their responses; their responses were also not specific.
LIWC Analysis. Finally, in addition to human coding, to analyze the self-relation patterns of teachers, we benefited from computational tools: LIWC software. Self-relation is context specific. For example, in our case, our participants were teachers, and self-relation meant words corresponding to their teaching, as noted in the human coding section above. Therefore, based on the human-coded data, we formed a dictionary related to self-relation using frequently used words. This new dictionary included words such as opportunity, enable, teach, and student, words that refer to the ways PD is applied to teachers’ lives and their responsibility as teachers. The LWIC analysis showed that Teachers A (119.26) and B (77.13) used significantly more self-relation-related words in their responses than the others. This finding confirms the human coding analysis: Teachers A and B had the most self-relation responses.
Summary. Self-relation and connection of the activities to one’s life was key indicator that significantly varied between teachers. Looking at the frequency of responses related to value and the detail in their responses, we decided that there were three profiles considering the value through self-relation (Table 2). We considered Teachers A and B as having high value through self-relation. These teachers frequently talked about how the PD program is related to their or others’ lives and explained why and how. We considered Teachers C and D in the mid-range through the self-relation profile because they mentioned the program’s value much fewer times, and their responses were not as specific. Finally, we did not find self-related responses for Teacher E in human coding. Although LIWC results showed that she mentioned the words in our dictionary a few times, we categorized them in the low-self-relation group.
4.1.2. Knowledge Increase during PD
Knowledge increase is an important component of interest development [10]. We analyzed the knowledge increase resulting from participation in the PD program as one of the factors related to interest development from a few different perspectives. First, we analyzed the CS knowledge test the teachers completed before and after the PD program. In addition, like self-relation, we examined the teachers’ text data for traces of “knowledge” they gained during our PD through human coding and computational methods.
CS Knowledge Test. After grading the pre and posttest, we categorized teachers into quartiles to determine their relative performance and knowledge levels. To calculate the quartiles, we combined the scores from the pre and posttest and calculated the scores that would correspond to the 0–25th (1), 26th–50th (2), 50th–75th (3), and 75th–100th (4) quartiles. The first quartile included scores between 0–48.6, the second quartile consisted of scores between 48.6–55.7, the third quartile was between 55.8–63.95, and the last quartile consisted of scores between 63.95–100.
The results indicated that Teachers A and B started with the lowest CS knowledge (first quartile), while Teacher C had the highest knowledge (fourth quartile) on the pretest. Teachers D and E were in the second quartile. The results showed that teachers A and B scored the lowest in the pretest, improved the most in the post-test and ended in the third and fourth quartiles, respectively (Table 3). Compared to Teachers A and B, Teachers C, D, and E gained significantly smaller knowledge based on the CS test results.
Table 3.
CS Knowledge Test Score Changes from Pretest to Posttest.
Qualitative Analysis. Following the self-relation analysis steps, we first looked for, and identified patterns in text that corresponded to knowledge traces the teachers gained through the PD program. Based on our qualitative results, we noted that low-knowledge indicators were generic, while high-knowledge was indicated by PD-specific text.
We coded knowledge increase indicators that did not target program-specific language as low. For example, Teacher D mentioned, “Things can take longer to figure out than expected. Things can get frustrating when everything does not work correctly”. This description of their learning was in very general terms that could be applied to any other program and, therefore, considered a low knowledge indicator. Cases in the low category also included snippets where there was more detail but were still referring to basic steps. For example, Teacher C indicated they “learned the basic menu screen in Unity. I have also learned how to attach code to my Unity program using Visual Studio. I have learned the basic steps of creating and running code with the game”. As seen from the quotations, they talked about learning in general terms and the basic concepts without going into the mechanisms involved.
It should be noted that data from teachers C and D included some specificity indicating, albeit low, knowledge gains, despite being sporadic and limited. Teacher E, however, did not have elaborative text data to be analyzed for knowledge increase.
The pattern for the high category included PD-specific information that the teachers came across during their engagement in the course modules. For example, Teacher A mentioned:
After the meeting I better understand why we would use an array and switch in our codes. I also learned the importance of mapping out the solution to the challenge in plain English.
Another teacher talked about their experience during learning and specifically talked about a lesson and the knowledge she gained from it. As can be seen from the following quotation, they were involved and invested in the process and learning:
“I now can say I have steady rocket that lands on the launch pad. My rocket body parts were not assembled correctly even though they gave an appearance of being correct. That is because of my axis angles were not correct like I thought. I learned that I did not have my axis angles positioned correctly. I learned how to do that. This was key to me getting my body parts aligned straight. That was indeed my take away in this assignment”(Teacher B)
Frequency of Responses. In addition to qualitative analyses, we counted the times the teachers explicitly mentioned “knowledge bits” they learned from the PD activities. Corresponding to the previous analyses, Teachers A (ten times) and B (eight times) reported the highest number of knowledge references. Teacher C reported five times what they learned, but the responses were primarily related to the early weeks of the PD program. On the other hand, there were very few referrals to specific knowledge in Teacher D’s (two times) and E’s (none) text data.
LIWC Analysis. In addition to human coding, we benefited from LIWC software to analyze teachers’ knowledge-increase patterns. Since the knowledge language is context-specific, we created our own “knowledge” dictionary. It included words specific to our PD content and words that referred to knowledge gain and learning in our PD (e.g., learn, module, variables, Unity). The results of the LIWC analysis supported the qualitative analysis. They indicated that Teacher A (sum = 594) and B (sum = 468) referred to PD-related knowledge gains more than the other teachers (D = 83, E = 67, C = 215). In addition to our self-made dictionary, we also used the curiosity subcategory from the default LIWC dictionary as it related to knowledge-seeking and interest in new knowledge. The results for the curiosity dictionary also followed a similar pattern: A (sum = 106), B (sum = 70), C (sum = 58), E (sum = 23), and D (sum = 13).
Term Frequency—Inverse Document Frequency. In addition to LIWC, we also analyzed the text data collected during the PD through another computational text analysis method: TF-IDF. This analysis showed the most common words used by each teacher compared to the rest of the text data. As shown in Figure 2, teachers differed in the most frequent words they used while responding to prompts based on the words we noted to be in the knowledge category. For example, tf-idf results for Teachers A and B included PD-specific knowledge terms and learning-related topics (e.g., rocket, model, module, add, video). Teacher C’s results also included some language related to our PD and software (e.g., chart, function). However, the most frequently used words were not explicitly related to the PD (e.g., overcome, biggest, laptop). Teacher D mostly talked about general issues not specific to the PD process (e.g., energy, frustrating, exposed). The responses of Teacher E were mainly related to the implementation of the PD program (e.g., curriculum, assessment, target) rather than the learning-related topics of the PD.
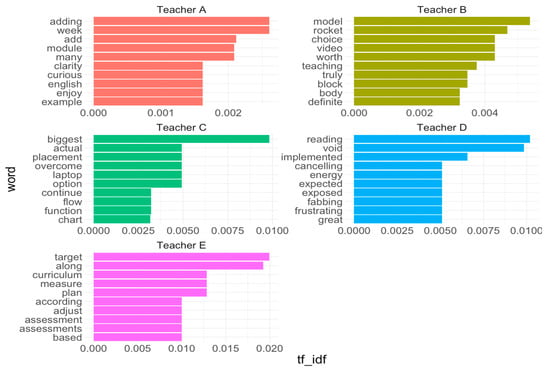
Figure 2.
Most Frequently Used Words By Each Teacher.
Summary. Based on our analyses of the participant data (knowledge test, qualitative, frequency of responses, LIWC, tf-idf), we categorized teachers in terms of their knowledge profiles (Table 4.). Results from different analyses aligned and provided a complete picture of the participants’ knowledge profiles. Teachers A and B were categorized as high due to the frequency of learning-related text they used. Furthermore, according to the computational text analyses, these teachers used the most knowledge-related words specific to their learning experiences during the PD. Both teachers confirmed these findings and showed the biggest knowledge gains in the CS test. We therefore categorized Teachers A and B as “high” in terms of their knowledge during PD.
Table 4.
Knowledge Profiles Based on Multiple Sources of Data.
For Teachers C and D, we found a significantly lower number of texts referring to specific learning through PD, and they showed marginal gains from the PD as indicated by their test score changes. They also were in the fourth and third posttest quartiles. We, therefore, categorized them in the “mid” knowledge category. Finally, Teacher E had the lowest scores in all the measures, placing them in the “low” category.
4.1.3. Affective Profiles
Positive feelings toward a subject are considered essential factors for interest development [10]. Therefore, reporting excitement about an experience (i.e., the PD program) or a certain content can indicate interest development. To find traces of positive emotion or excitement, we analyzed our data using multiple lenses: qualitative (human coding), frequency (human coding), and LIWC (computational coding).
Qualitative Analysis. Qualitatively investigating the data, we first identified text snippets containing affective words, then categorized them as low and high indicators. Like value through self-relation and knowledge increase, a low indicator of excitement included the display of excitement without any specificity to the content of PD. For example, Teacher C indicated that they were interested in learning without explaining why: “I am still very interested in learning more”.
The pattern for high excitement usually included explaining the reasons (i.e., elaboration) for them to feel excited. For example, Teacher A talked about their feelings toward coding and explained why they had positive feelings: “Adding the code is fun. I am eager to learn more about adding it and seeing changes”. Similarly, they discussed their feelings toward re-teaching these subjects: “I am curious as to how we would teach kids to identify the most important elements of their game”. They also discussed their excitement and attitude toward coding in general:
What has motivated me throughout the course is the fact I am doing something that I once loved to do and moved away from and also the fact I am learning it to teach it to my students. I still feel excited about the project as I did in the beginning. Because I have a background in coding, I knew there would be challenges, and I was and still am ready to embrace them.
Frequency of Responses. When we looked at the frequency of responses related to positive feelings, teachers’ responses showed great variation. Teachers A (eight times) and B (five times) reported positive feelings toward the PD and their learning (i.e., they indicated they are motivated, interested, and excited in different weeks.). In contrast, Teachers C and D talked once about positive feelings, while Teacher E did not have any response related to their positive feelings about the program.
LIWC Analysis. In addition, we benefited from LIWC software to analyze teachers’ affective difference patterns. For the affective difference patterns, we used the Satisfaction, Effort Enjoyment, and Accomplishment subcategories of the Behavioral Activation dictionary [30]. The creators of the dictionary characterized the satisfaction category with words such as enthuse, love, and satisfied. The effort-enjoyment subcategory was characterized by words like enjoy, energized, and enthusiastic. The accomplishment category included words such as proud, achieve, and goal. The LWIC analysis showed that Teachers A (sum = 84.56) and B (sum = 92.08) had higher satisfaction scores than other teachers. Moreover, Teacher A scored highest in terms of effort enjoyment (sum = 321.38) and accomplishment (sum 63.12). Therefore, LIWC results suggest that Teachers A and B talked more about positive feelings in their responses (Table 5).
Table 5.
Affective Differences in Participants’ Responses Using LIWC Analysis.
Summary. Our analyses of the teachers’ text data, both using human coding and computational methods, showed that there was variation among teachers. Still, these different types of analyses also confirmed each other’s findings (Table 6). While some teachers (Teachers A and B) frequently talked about the positive feelings they experienced during the PD and elaborated on how and why they were excited, other teachers did not talk much about the positive feelings, or their responses were more generic. Therefore, we categorized Teachers A and B in the high group. The next group, mid (Teacher C and D), included a lower frequency of positive emotions than the high group. Finally, the low group included participants with the lowest scores from the affective indicator measures.
Table 6.
Affective Profiles of the PD Participants.
4.2. RQ2: Reengagement Profiles
Log Data Analysis. Our PD was composed of multiple synchronous and asynchronous activities offered via various online platforms. By investigating teachers’ participation logs on these online platforms (e.g., calculating a total score based on the total percentage of engagement), we analyzed the reengagement profiles of our participants.
The video-learning platform’s modules were one of the essential components of our PD program because teachers were tasked to follow video-based learning activities on game design and computer programming and create their games. Therefore, while analyzing the reengagement profiles, we paid specific attention to the compilation of these modules compared to other activities. Figure 3 shows the number of videos watched each month separately for the PD period. Teachers A (91%) and B (80%) watched the greatest number of videos, while Teachers C (31%) and D (26%) watched close to half of the videos. Teacher E (2%) only watched one video out of the possible 45 videos.
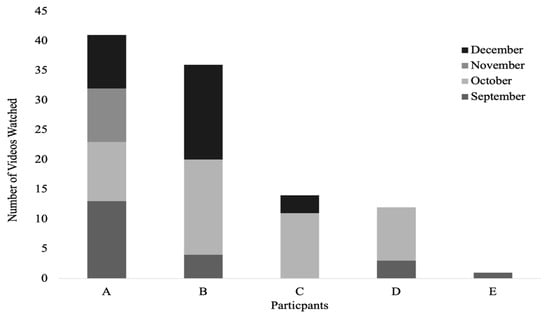
Figure 3.
The number of video lessons watched throughout the four months.
Another activity during our online PD was weekly virtual hangouts. We should note that these hangout attendances involved mostly passive participation, where the instructor reviewed the week’s materials, and the attendants followed along if they chose to. Teachers D (88%), B (82%), and A (71%) attended more than 70% of the hangouts, while C (53%) and E (53%) attended at least half of the sessions.
Finally, we analyzed the log data that were provided by the online LMS platform. We investigated the teachers’ page views and assignment submission statistics. To obtain a sense of participation density, we calculated the POMP score for both views and submissions by taking the maximum number of each category from the participation data (Table 7). This gave us a sense of normative participation distribution: Teachers A (85%) and B (58%) had the highest participation scores, while C (45%) was at the mid-level. Teachers D (28%) and E (18%) had low participation.
Table 7.
The POMP scores and COV for page view and assignment submissions.
Looking at the data more closely, we also noted another important statistic to help us understand the pacing of each participant to obtain an impression of their unified attendance. The coefficient of variance (CV) explains the homogeneity of dispersion (see Table 7). For Teachers A and B, the CV for the numbers for views and participation was low, indicating that their reengagement was frequent compared to Teachers C, D, or E.
LIWC Analysis. In addition, we benefited from LIWC software to analyze teachers’ reengagement patterns from the text data. For the reengagement patterns, we used the breadth, long-term, and structure subcategories of the Behavioral Activation dictionary [30]. The creators of the dictionary characterized the Breadth category with words such as involved, participate, and activity. The Long-term subcategory can be characterized by words such as effort, plan, invest, and commit. The structure subcategory consists of words such as progress, goal, and plan. These three specific categories provided us with teachers’ PD engagement-related words in their responses.
The LWIC analysis showed that Teacher A had a significantly higher number of engagement-related words in their responses compared to other teachers (see Table 8): breadth (sum = 150.25), long-term (sum = 109.07), and structure (sum = 123.71). Results from the LIWC analysis suggest that Teacher A was more engaged in the PD process than the other teachers, followed by teachers B and C. Teachers D and E had the lowest number of engagement-related vocabulary in their responses.
Table 8.
Linguistic differences using LIWC analysis for Reengagement-related vocabulary.
Summary. Results of the engagement data analyses from multiple data sources (LMS logs, video logs, text data) indicated that the teachers differed in their engagement. There were three reengagement profiles among the teachers: low, medium, and high engagement. We considered Teachers A and B in the high-reengagement group because they maintained participation in all platforms and completed several modules on the video-lesson platform. They also used more engagement-related vocabulary in their responses and scored higher in total compared to other teachers. Their participation was also consistent across different months (see Figure 4 and Table 7). We considered Teachers C and D as the mid-engagement group. They engaged with some of the activities and completed a few modules in the video-lesson platform, but their reengagement was much lower than the high group. Finally, Teacher E was considered in the low-reengagement profile because their participation was low across all platforms, and they hardly completed any video modules.
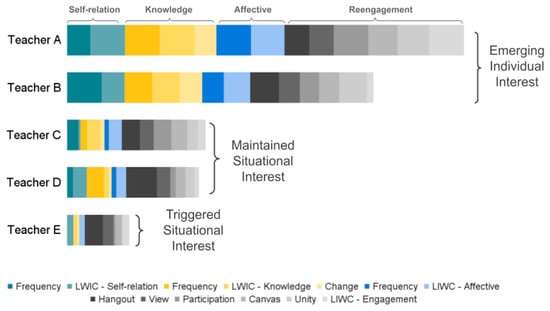
Figure 4.
Interest Profiles are based on self-relation, knowledge, affection, and reengagement.
4.3. RQ3: Interest Profiles
Interest can be defined as a predisposition to engage and reengage with content and tasks [1]. Although participation and reengagement can be proxies for interest, important factors signal the development of interest: knowledge, self-relation, and positive emotions [5]. Interest develops through positive changes in these factors.
Based on the interest development theory and our analysis of text data and log data, we identified three distinct interest profiles among the participants (Figure 4).
Two participants, teachers A and B, showed patterns for high knowledge gains, self-relation, affective investment, and reengagement with content during our PD. We believe that they carry the characteristics of “emerging individual interest” (Level 3) and maybe even some features of well-developed individual interest (Level 4). Emerging individual interest is characterized by having self-relation to the topic, increased knowledge, increased frequency of positive feelings, and independent reengagement with content. It is also noted that individuals at these later stages start being more curious about the content [10]. Our profile analysis results indicated (from multiple different perspectives) that two of our participants possessed these characteristics. On various occasions, their responses included value through self-relation either to themselves or their students’ lives. They reported excitement related to the program and its value. As seen in the previous section, they improved their knowledge the most. Reengagement patterns showed that they actively participated in all the components of the PD program. In addition, teachers A and B had the highest curiosity scores in the LIWC analysis, which suggests that they are in the later phases of interest development. Therefore, teachers A and B are in the emerging individual interest phase in the interest development framework.
At a lower level (mid-tier), we had another two participants: Teachers C and D. Based on the results of the profile analyses (i.e., inconsistent reengagement data, as well as lower frequency of self-relation and affective vocabulary usage), we determined that they carried the characteristics for “maintained situational interest” (Level 2). Maintained situational interest was characterized as reengagement with content, positive feelings, and developing knowledge and value [10]. They showed mid-level reengagement with content. Reengagement patterns indicated they participated in some parts of the PD program but did not actively engage in all the components. They had some positive feelings toward the PD content, but the frequency was much lower, and the responses were not as specific. However, they were unable to identify the self-relation of the content as frequently. Even though they started with a little prior knowledge, the increase was not as visible compared to the other teachers in the emerging individual interest phase. When closely investigated, it seems these teachers had developing levels of these factors. Still, they did not have fully developed value, knowledge, or positive feelings regarding the content of the PD program. Therefore, we believe their profiles on these factors align with the maintained situational interest phase of the interest development framework.
One participant, Teacher E, showed patterns for low value through self-relation, knowledge increase, positive feelings, and reengagement. This participant’s profile aligns with the “triggered situational interest” phase of the interest development model (Level 1). Triggered situational interest was characterized by temporary engagement with the content, needing support, and having positive or negative feelings [10]. Our findings from different analyses (e.g., log data, qualitative analysis, LWIC) indicated Teacher E possessed these patterns that could be identified as triggered situational interest. Teacher E had much lower responses related to value through self-relation. Human coding could not identify any response related to self-relation. They did not have responses related to positive feelings regarding the program. In addition, they rarely participated in the components. Like Teachers C and D, Teacher E started the program having some prior knowledge, but their knowledge had improved negligibly at the end of the PD program. Therefore, we believe their pattern on the indicators corresponds to the characteristics of the “triggered situational interest” phase of the interest development model.
5. Discussions and Implications
The purpose of this research was to explore the variance in the interest development among teachers during a semester-long PD and identify the components of interest development through investigating various conventionally used data sources and analysis approaches commonly found in pretest, interview, and discussion (text) data. To do so, we used the interest development model and explored our longitudinal and multi-faceted data using various data analysis and triangulation methods. Our results indicated that the teachers belonged to different interest profiles at the end of our PD, and we were able to find multiple sources of evidence to justify this categorization. More specifically, in this study, we were able to specifically identify how the three important interest development factors can be identified and examined: knowledge, self-relation, and affect. We believe the analysis approach we present in this paper can serve as a model for future studies where the focus is teacher professional development activities and other contexts such as K-12 or higher-education classrooms.
The teachers we categorized as the high-interest development group (i.e., Teachers A and B) showed the biggest knowledge gain. However, just assessing knowledge may not be enough to determine the success of a PD event. Therefore, in our study, we looked beyond knowledge. One of our teachers (Teacher C) had the highest knowledge level at the end of our PD, but they were not in the high-interest group. In addition to knowledge, we noted that the teachers in the high-interest group had significantly higher levels of self-relation and affect. The other end of the spectrum had teachers with lower levels of self-relation and affect. The teachers in the lower interest groups fared well in their post-PD knowledge. Nevertheless, they failed to reach the interest development levels of the teachers who started with significantly lower knowledge than they did. Based on this finding, we argue that knowledge development is important for interest development, but it alone is insufficient. Self-relation and affect significantly impact sustained participation and interest development. Our findings, therefore, provide strong evidence for Renninger and Hidi’s recent work (2022) in that self-relation is a key component of interest development.
Another key finding in our research was the close association between the sustained participation in asynchronous online PD activities and interest development profiles, and our identification of the key factors that led to this. The teachers with the highest interest also showed sustained attendance through our semester-long PD activities. This finding is important because it is a potential area of weakness for our research and many other online PD activities that can be improved. In our computational text analyses and human coding, we noted that the teachers who failed to show sustained participation (and low-interest Development) also found it difficult to make self-relation connections or develop affect. We know from educational psychology research that there are simple interventions, such as utility value interventions, where participants are asked to list connections between activities and their lives/careers (e.g., [12,31,32]). Such interventions are likely candidates for improving self-relation in contexts like ours [10]. Early research also suggests that for participants with low initial interest, supporting value development could be a key first step for interest development [33], confirming our findings. Therefore, our findings make it clear that even in PD settings, interest development can be varied among participants, and PD providers can offer support to participants with different needs [34].
We believe our research and the results contribute to teacher education and educational psychology. Although there has been a consensus in the PD literature on the critical factors for PD [3], and we followed these in our PD design, we found that other educational psychology-related factors played an important role in affecting the outcomes. In our PD design and implementation, we integrated the critical PD factors [3] into our PD (i.e., content focus, active learning, coherence, duration, and collective participation.
Despite this effort, however, teachers varied in their participation, and we highlight that this was (a) due to self-relation and affective (and knowledge)-related nuances, and (b) we have new tools at our disposal that we can use to capture them. Therefore, our results provide alternative (i.e., computational text analysis, log data analysis) methods to respond to Desimone’s call (2009) to look for new methods to measure PD effectiveness. In addition, we use interest and interest development theories as a core construct of PD effectiveness and measure it in multiple ways. To our knowledge, this has not been carried out in PD literature before and can open new ways for PD researchers to approach PD evaluation and understanding PD effectiveness.
From an educational psychology perspective, our findings confirm Hidi and Renninger’s seminal work [1,10] and Dewey’s (1913) in that we present evidence for the three important factors for interest development qualitatively and quantitatively. We believe our approach to data collection and the analysis methods we employed in our work can inspire new research. More specifically, we used and analyzed log, text, and test data to trace interest development. In our approach, we used these data in some innovative ways. For example, while analyzing the log data, we used the coefficient of variance as a metric of importance to identify participants who frequently attended versus the ones who sporadically attended. This could be an important metric for future research where centrality metrics (e.g., mean) would paint a different and possibly misleading picture. In addition, we used POMP scores [22] to unify our perceptions of completion and achievement. Finally, we provide computational text analysis methods as potential tools for educational researchers to use, at the least to triangulate their findings. As was seen in our results, these new methods (e.g., LIWC and tf-idf), as well as more advanced statistical methods (i.e., Supervised Machine Learning for Text Analysis: [35]), could provide educational research with new ways to think about their future research studies and data collection methods.
6. Limitations
One of the limitations of this study is related to the nature of the data collected. As we noted in the previous sections, we have taken multiple perspectives while looking at our data, but the methods employed have some limitations. For example, LIWC-22 analyses were used to capture certain vocabulary in the participants’ text data. They may not fully correlate with other measures, although this does not mean LIWC scores are invalid [27]. This may lead to under- or over-representation of categories in the text. Although we did not find a trace of self-relation of one of our participants in our human coding, the LIWC score for the participant was higher than that of a participant with two self-relation-identified sections. In our research, we tried to overcome this problem by triangulating our data and analyses and only reached a conclusion based on a consensus. Therefore, we caution researchers while using such tools and suggest using similar triangulation methods when possible. Similarly, we had a small sample size due to the nature of the study. However, we overcame some of the shortcomings caused by the small sample size by using various data types collected over a long period and using conventional and newly emerging data analysis methods.
Another limitation of our study is related to a possibly better alternative approach to data collection that we missed out on in this research. We collected and analyzed our text data cumulatively and reported on self-relation, knowledge, and affective “traces” cumulatively. Future studies can capture the data more time-specifically, so that the progression of the “traces” can also be captured and possibly tied to instructional activities. For example, if the researchers see a significant change in one of the factors on a certain day, they can track and see what led to the change.
Finally, it was beyond our scope to find the association between interest development and teachers’ success in teaching PD concepts. In a future study, it would be worthwhile to investigate if and how interest (development) predicts or is associated with teaching effectiveness and student success.
7. Conclusions
Interest can be characterized by both the affective state of individuals (e.g., excitement) and their desire to reengage with tasks. Once triggered, however, interest development is not guaranteed. As Dewey (1913) noted: “It is not enough to catch attention; it must be held. It does not suffice to arouse energy; the course that energy takes, the results that it effects are the important matters” (p. 91). Teacher professional development is key for reforms in education, and it is therefore important to measure their outcomes and effectiveness [3]. For work that is essentially built on interest (development), such as teacher professional learning, educational researchers need to consider interest development as a key outcome and variable of interest, especially given how it is independent of prior knowledge and supports knowledge development. Research, including ours, has given us both specific ways to target interest development (i.e., focusing on self-relation, knowledge, and affect) and ways to investigate the traces of key interest development factors using conventional and computational methods. We believe our work provides a new direction for teacher PD research as some of the ways we approached our data could become possible diagnostic tools (e.g., LIWC, log data analysis, tf-idf) for teacher PD providers.
Author Contributions
Conceptualization, M.A. and M.S.O.; methodology, M.A. and M.S.O.; software, M.A. and M.S.O.; validation, M.A. and M.S.O.; formal analysis, M.A. and M.S.O.; investigation, M.A. and S.D.; resources, M.A. and S.D.; data curation, M.A. and S.D.; writing—original draft preparation, M.A., M.S.O. and S.D.; writing—review and editing, M.A. and S.D.; visualization, M.A.; supervision, M.A.; project administration, M.A. and S.D.; funding acquisition, M.A. and S.D. All authors have read and agreed to the published version of the manuscript.
Funding
This research was funded by National Science Foundation: 2027948 and the APC was funded by National Science Foundation: 2027948.
Institutional Review Board Statement
The study was conducted in accordance with the Declaration of Helsinki, and approved by the Institutional Review Board of Georgia Southern University (H21033, 28 August 2020).
Informed Consent Statement
Informed consent was obtained from all subjects involved in the study.
Data Availability Statement
The data presented in this study are available on request from the corresponding author. The data are not publicly available due to human subjects’ privacy.
Conflicts of Interest
The authors declare no conflict of interest.
References
- Hidi, S.; Renninger, K.A. The Four-Phase Model of Interest Development. Educ. Psychol. 2006, 41, 111–127. [Google Scholar] [CrossRef]
- Dewey, J. Interest and Effort in Education; Houghton Mifflin Company: Boston, MA, USA, 1913. [Google Scholar]
- Desimone, L.M. Improving Impact Studies of Teachers’ Professional Development: Toward Better Conceptualizations and Measures. Educ. Res. 2009, 38, 181–199. [Google Scholar] [CrossRef]
- Bragg, L.A.; Walsh, C.; Heyeres, M. Successful design and delivery of online professional development for teachers: A systematic review of the literature. Comput. Educ. 2021, 166, 104158. [Google Scholar] [CrossRef]
- Long, J.F.; Hoy, A.W. Interested instructors: A composite portrait of individual differences and effectiveness. Teach. Teach. Educ. 2006, 22, 303–314. [Google Scholar] [CrossRef]
- Reich, J. MOOC completion and retention in the context of student intent. Educ. Rev. 2014, 8. [Google Scholar]
- Reich, J.; Ruipérez-Valiente, J.A. The MOOC pivot. Science 2019, 363, 130–131. [Google Scholar] [CrossRef]
- Osman, D.J.; Warner, J.R. Measuring teacher motivation: The missing link between professional development and practice. Teach. Teach. Educ. 2020, 92, 103064. [Google Scholar] [CrossRef]
- Renninger, K.A.; Hidi, S. Revisiting the Conceptualization, Measurement, and Generation of Interest. Educ. Psychol. 2011, 46, 168–184. [Google Scholar] [CrossRef]
- Renninger, K.A.; Hidi, S.E. Interest development, self-related information processing, and practice. Theory Pr. 2022, 61, 23–34. [Google Scholar] [CrossRef]
- Alexander, J.M.; Johnson, K.E.; Neitzel, C. Multiple points of access for supporting interest in science. In The Cambridge Handbook of Motivation and Learning; Cambridge University Press: Cambridge, UK, 2019; pp. 312–352. [Google Scholar]
- Hecht, C.A.; Grande, M.R.; Harackiewicz, J.M. The role of utility value in promoting interest development. Motiv. Sci. 2021, 7, 1–20. [Google Scholar] [CrossRef]
- Hulleman, C.S.; Godes, O.; Hendricks, B.L.; Harackiewicz, J.M. Enhancing interest and performance with a utility value intervention. J. Educ. Psychol. 2010, 102, 880–895. [Google Scholar] [CrossRef]
- Darling-Hammond, L.; Hyler, M.; Gardner, M. Effective Teacher Professional Development; Learning Policy Institute: Palo Alto, CA, USA, 2017. [Google Scholar]
- Menekse, M. Computer science teacher professional development in the United States: A review of studies published between 2004 and 2014. Comput. Sci. Educ. 2015, 25, 325–350. [Google Scholar] [CrossRef]
- Akcaoglu, M.; Dogan, S.; Hodges, C.B. Real Coding and Real Games: Design and Development of a Middle School Curriculum Using Unity 3D. TechTrends 2022, 66, 931–937. [Google Scholar] [CrossRef]
- Keller, J.M. Using the ARCS Motivational Process in Computer-Based Instruction and Distance Education. New Dir. Teach. Learn. 1999, 1999, 37–47. [Google Scholar] [CrossRef]
- Keller, J.; Suzuki, K. Learner motivation and E-learning design: A multinationally validated process. J. Educ. Media 2004, 29, 229–239. [Google Scholar] [CrossRef]
- Hodges, C.B. Designing to motivate: Motivational techniques to incorporate in e-learning experiences. J. Interact. Online Learn. 2004, 2, 1–7. [Google Scholar]
- de Freitas, S.I.; Morgan, J.; Gibson, D. Will MOOCs transform learning and teaching in higher education? Engagement and course retention in online learning provision: Engagement and course retention in online learning provision. Br. J. Educ. Technol. 2015, 46, 455–471. [Google Scholar] [CrossRef]
- Renninger, K.A.; Bachrach, J.E. Studying Triggers for Interest and Engagement Using Observational Methods. Educ. Psychol. 2015, 50, 58–69. [Google Scholar] [CrossRef]
- Cohen, P.; Cohen, J.; Aiken, L.S.; West, S.G. The Problem of Units and the Circumstance for POMP. Multivar. Behav. Res. 1999, 34, 315–346. [Google Scholar] [CrossRef]
- Sonnleitner, P.; Brunner, M.; Keller, U.; Martin, R. Differential relations between facets of complex problem solving and students’ immigration background. J. Educ. Psychol. 2014, 106, 681–695. [Google Scholar] [CrossRef]
- Coefficient of Variation. Available online: https://en.wikipedia.org/w/index.php?title=Coefficient_of_variation (accessed on 8 February 2023).
- Saldaña, J. The Coding Manual for Qualitative Researchers, 4th ed.; SAGE: Los Angeles, CA, USA, 2021; ISBN 978-1-5297-5597-8. [Google Scholar]
- Pennebaker, J.W.; Boyd, R.L.; Booth, R.J.; Ashakkumar, A.; Francis, M.E. Linguistic Inquiry and Word Count: LIWC. Mahway Lawrence Erlbaum Assoc. 2001, 71, 2022. Available online: https://www.liwc.app (accessed on 8 February 2022).
- Boyd, R.L.; Ashokkumar, A.; Seraj, S.; Pennebaker, J.W. The Development and Psychometric Properties of LIWC; University of Texas at Austin: Austin, TX, USA, 2022; Available online: https://www.liwc.app (accessed on 8 February 2023).
- Silge, J.; Robinson, D. tidytext: Text Mining and Analysis Using Tidy Data Principles in R. J. Open Source Softw. 2016, 1, 37. [Google Scholar] [CrossRef]
- Ramos, J. Using tf-idf to Determine Word Relevance in Document Queries. In Proceedings of the First Instructional Conference on Machine Learning; 2003; Volume 42, pp. 29–48. Available online: https://citeseerx.ist.psu.edu/document?repid=rep1&type=pdf&doi=b3bf6373ff41a115197cb5b30e57830c16130c2c (accessed on 8 February 2023).
- Burkhardt, H.A.; Alexopoulos, G.S.; Pullmann, M.D.; Hull, T.D.; Areán, P.A.; Cohen, T. Behavioral Activation and Depression Symptomatology: Longitudinal Assessment of Linguistic Indicators in Text-Based Therapy Sessions. J. Med. Internet Res. 2021, 23, e28244. [Google Scholar] [CrossRef]
- Hulleman, C.S.; Harackiewicz, J.M. Promoting Interest and Performance in High School Science Classes. Science 2009, 326, 1410–1412. [Google Scholar] [CrossRef] [PubMed]
- Priniski, S.J.; Rosenzweig, E.Q.; Canning, E.A.; Hecht, C.A.; Tibbetts, Y.; Hyde, J.S.; Harackiewicz, J.M. The benefits of combining value for the self and others in utility-value interventions. J. Educ. Psychol. 2019, 111, 1478–1497. [Google Scholar] [CrossRef]
- Doucette, D.; Clark, R.; Singh, C. Professional development combining cognitive apprenticeship and expectancy-value theories improves lab teaching assistants’ instructional views and practices. Phys. Rev. Phys. Educ. Res. 2020, 16, 020102. [Google Scholar] [CrossRef]
- Harackiewicz, J.M.; Smith, J.L.; Priniski, S.J. Interest Matters: The Importance of Promoting Interest in Education. Policy Insights Behav. Brain Sci. 2016, 3, 220–227. [Google Scholar] [CrossRef] [PubMed]
- Hvitfeldt, E.; Silge, J. Supervised Machine Learning for Text Analysis in R, 1st ed.; Chapman and Hall/CRC: Boca Raton, FL, USA, 2021; ISBN 978-1-00-309345-9. [Google Scholar]


Disclaimer/Publisher’s Note: The statements, opinions and data contained in all publications are solely those of the individual author(s) and contributor(s) and not of MDPI and/or the editor(s). MDPI and/or the editor(s) disclaim responsibility for any injury to people or property resulting from any ideas, methods, instructions or products referred to in the content. |
© 2023 by the authors. Licensee MDPI, Basel, Switzerland. This article is an open access article distributed under the terms and conditions of the Creative Commons Attribution (CC BY) license (https://creativecommons.org/licenses/by/4.0/).