Abstract
Scientific oral communication is of major importance in democratic societies, but science students often dread giving oral presentations because of the stress they cause, and more generally, because of their attitude towards science communication. As attitude influences behavior, attitude towards science communication might have an impact on the performance students give during an oral presentation. This study was conducted with French-speaking postsecondary CEGEP (17–19 years old) science students in Montreal, Quebec, Canada. In this mixed-methods study, students’ attitude towards oral communication in science (n = 1295) was measured using a five-component model (perceived relevance, anxiety, enjoyment, self-efficacy (S-E) and context dependency). We then observed, by video, a sample of 26 students and measured their oral performance skills during a presentation on a scientific topic. The results suggest a strong correlation between oral performance in science and two components of attitude: the enjoyment of doing oral presentations and a specific aspect of S-E we called Showmanship S-E. In addition, although most students had a high perception of the relevance of oral communication in science, this did not correlate to their oral performance and most experienced anxiety about their oral communication.
1. Introduction
Science communication is extremely important in a democratic society [1,2]. In the recent article ‘Revenge of the experts’, Aksoy, Eichgreen and Saka [3] report that epidemics, such as the COVID-19 pandemic, while they do not diminish people’s confidence in science, they do diminish their confidence in scientists. These authors attribute this to scientists’ lack of oral communication skills when they must explain health issues or when they have to prescribe binding health measures. Scientists are duty bound to inform the public debate, which includes explaining scientific discoveries and issues to citizens. However, as aptly put by interpersonal communication specialist Owen Hargie, “explaining is an activity often performed poorly by many professionals” [4] (p. 197). For instance, lack of communication skills by a doctor is an issue for their patient but, even so, communication skills are seldom taught in medical schools [5]. In addition to the health fields, scholars have also been emphasizing the need for better communicators in engineering for a long time: “the engineering profession [wants] fewer graduates who were trained only to be backroom experts and more who could interact with people outside the profession, be proactive and take leading roles” [6] (p. 306).
To become efficient communicators, health professionals, scientists and engineers must learn the principles of science communication, and to this end, several countries have incorporated communication goals into their postsecondary STEM curricula [2]. Among the goals for learning science communication, Baram-Tsabari and Lewenstein [7] mention an important principle of science communication: to become effective science communicators, students must learn to explain scientific concepts and models, to formulate arguments and to give clear explanations. Communicating about science thus entails that science communicators must have sufficient content knowledge mastery to talk about science, including the structure of discourse, argument, vocabulary, and scientific explanations [8].
Scientists in training must furthermore learn to develop science communication skills in at least two ways: they must be able to communicate their findings to peers, using specialized language and convincing arguments, and they must be able to communicate broader aspects of scientific concepts to a wide audience, to engage and inform non-specialists in science [1,6]. This is of major importance, because when it is done accurately, oral communication is particularly effective: people recall more when information is orally presented then when it is written [9,10]. But these abilities do not emerge simply innately in scientists; they have to be learnt [11]; both formally and informally, students trained in STEM will need, during the course of their careers, to communicate orally in their field: researchers who presents their results at conferences, engineers who explain the decisions needed to be made for the building of a structure, doctors who tell patients how to take care of their health problems, etc. However, it is recognized that communication is under-taught and under-assessed in science programs [1]. Initiatives of special training in communication are offered to some students, but it is not usually mandatory [7]. Yet, scientific oral communication has specific characteristics that we can hardly expect students to discover without education.
Regardless of the topic presented, it is very well known that for most of us, speaking in public entails some level of anxiety (Bodie, 2010; Goberman et al., 2011, McCroskey, 2009, Schlenker and Leary, 1982). In a classic stand up number, comedian Jerry Seinfeld tells it as it is for so many of us: “According to most studies, people’s number one fear is public speaking. Number two is death. Death is number two. Now this means, to the average person, if you have to go to a funeral, you’re better off in the casket that doing the eulogy” [12]. On a more serious note, this widespread fear has been extensively studied, as well as the conditions that alleviate or increase that anxiety, such as audience congeniality and competence perception [13], biologically-based traits such as neuroticism and introversion [14], and treatment of anxiety with fundamentals of speech course [15].
Reasons that students fear public speaking are the fear of judgement by the audience, the fear of being unable to self-regulate, the fear of disfluency, and the fear of performance evaluation, among others [16]. As an important component of the attitude towards oral communication, public speaking anxiety is part of the attitude model that we present later on in this paper, but public speaking anxiety is not the only aspect of oral communication we present in this study.
In addition, if students are poorly trained in the principles of oral communication, it may be difficult for them to develop a positive attitude towards OCS (oral communication in science). This is problematic considering that a better attitude towards OCS could lead to more engagement in communication activities [17].
Many studies have looked at students’ attitude towards specific areas of science, such as biology, e.g., [18,19], chemistry, e.g., [20], or engineering [6], e.g., [21], but fewer studies have looked at attitude towards OCS. When studied, attitude towards OCS only takes into account one attitude component at the time (e.g., self-efficacy), and therefore completely misses the multidimensional nature of attitude and the dynamic interaction that exists between its components [22].
Additionally, few scholars have addressed how attitude components can influence performance outcomes in oral presentations [21] and none of them have focused on the OCS context. Furthermore, several components of attitude appear to influence oral performance, whether it be anxiety [23,24], self-efficacy [25], or enjoyment [26]. One article about postsecondary oral presentations in chemistry reports a relationship between oral skills and attitude towards OCS [17], but in this researcher’s context, attitude conveys a sense of propensity or tendency, and does not strictly imply a component of self-efficacy (S-E). It seems essential to us, however, to consider as many components of attitude as possible, to capture those that are likely to significantly describe an attitude leading to a behavior towards OCS. This is the research context in which this research takes place. Attitude towards OCS and competence in real communication situations are the variables of the present study.
2. Conceptual Framework
Despite several important studies on the subject, attitude is still a poorly defined construct [27]. Probably due to its multidimensional nature, the lack of a common definition for this concept has led to the production of incomplete questionnaires that measure only one or a few components of attitude, and these vary from one questionnaire to another [27,28,29,30,31,32].
To address these shortcomings, van Aalderen-Smeets and her colleagues [22] proposed a theoretical framework of teachers’ attitude towards teaching science that takes into account the multidimensional nature of attitude and the interactions that exist between its different components.
This framework is also useful and pertinent to describe attitude towards OCS. On the one hand, it refers directly to the disciplinary field of science. On the other, its cognitive, affective and control dimensions capture the complexity of attitude towards communication, whether it is conducted by a teacher, a scientist, or a student. This framework has three dimensions: a cognitive dimension, referring to the perception of the difficulty of performing a task, its relevance and perceived gender-performance issues; an affective dimension referring to feelings of enjoyment or anxiety and a perceived control dimension which includes a personal factor, S-E, and an external factor, the context dependency. These three dimensions lead to behavior, which manifests as the performance of an OCS.
2.1. Framework of Perceptions and Attitude towards Oral Scientific Communication
In Figure 1, we present the adaptation of van Aalderen-Smeets’s et al. [22] framework for the context of science communication.
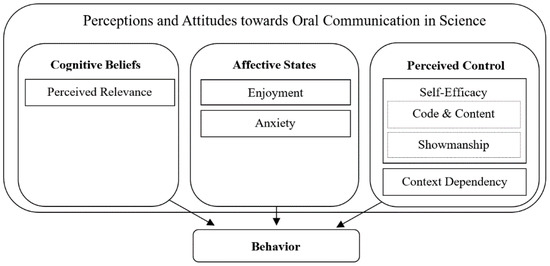
Figure 1.
Perceptions and attitude towards oral communication in science (PAOCS) model adapted from van Aalderen-Smeets et al. [22].
We kept the original attitude dimension labels, namely cognitive beliefs, affective states, and perceived control, as they were also reported by other scholars as being determinants of oral attitude. For instance, cognitive beliefs of perceived relevance of OCS were studied by Edmondston and Dawson [19]. The dimension of affective states (anxiety and enjoyment) is similar to the component of ‘motivation’ described by Spitzberg [33], which he defines as attitudes and feelings. Finally, S-E in oral communication as a component of the perceived control dimension was studied by scholars as part of the curriculum development [25,34] or as a teaching and learning tool in communication training [23,35]. In our context of science communication, we did not retain the cognitive components of task difficulty nor gender beliefs that were proposed by van Aalderen-Smeets et al. [22], as we focused our model on those components that were most relevant to OCS as already identified in the literature. In addition, to avoid producing a survey fatigue effect and because this study is a first investigation on this topic for this population, it was decided that the questionnaire be kept as short as possible. Decision to dismiss task difficulty and gender beliefs items from our questionnaire follows observations by van Aalderen-Smeets et al., who removed these dimensions upon data analysis, since they appear irrelevant to the results [22]. Future research could refine this model by reintroducing these components (gender beliefs and task difficulty), but for now we consider this theoretical framework to be at least a starting point for studying perceptions and attitude towards OCS in a more holistic way. In the following sections, we will review the literature related to all three dimensions of attitude as outlined in Figure 1.
2.1.1. Cognitive Beliefs
Perceived relevance is a factor in the cognitive beliefs dimension. Perceived relevance that students attribute to OCS refers as much to the overall importance that they attribute to this task in the field of science [36] as it does to the perceived usefulness that students see for their personal future [37]. In this regard, Leggett et al. [38] indicate that university science students do not seem to be aware of the importance of oral communication skills in their future work in the science field. This finding reinforces the results of Edmonston, Dawson and Schibeci [39], who indicate the low importance placed by students on oral communications or to dedicated OCS training, while these students are generally unaware of the characteristics of OCS.
2.1.2. Affective States
In the framework presented in Figure 1, anxiety has its theoretical roots in public speech anxiety [40]. It is felt by a majority of people [24], and finds its main source in the fear of being judged negatively by the audience [41,42]. It is characterized by physiological effects (e.g., increased heart rate), negative cognitive effects (e.g., difficulty concentrating while speaking), and behavioral effects (e.g., shaking and blushing) [40]. It has been suggested that anxiety about giving an oral speech in front of an audience may be an aggravating factor in poor speaking skills [23]. Public speaking anxiety might also be felt more strongly because of the illusion of transparency, a belief some speakers hold that their anxiety is more noticeable by the audience than it actually is [41]. The illusion of transparency is thus a self-perception that might cause even more reluctance to speak up in public.
Research has shown that postsecondary students particularly suffer from public speaking anxiety [43]. In a study with over one thousand college students, Ferreira Marinho and her colleagues [44] reported that almost two-thirds of them expressed a fear of public speaking. That percentage decreased with age, showing that younger college students (17–21-year-olds) are more prone to be anxious because of public speaking than older ones, maybe because older students have gained a general self-confidence that the younger do not have yet.
Nevertheless, oral communication in front of an audience does not always and only cause anxiety. It can also be thrilling and fun. In fact, “[s]tage fright is a negative term for excitement. No coach tells the team to be calm. This adrenaline can be channelled into enthusiasm” [45] (p. 1188). The fact remains that enjoyment in public speaking is less studied than anxiety, even if these two affective states are “the two faces of Janus” in oral communication [46]. In a study in the context of second language learning, Batenburg and her colleagues [47] report that oral communication could indeed very well be enjoyable. These researchers also observed that despite being felt at variable degrees by different individuals, enjoyment in oral communication does not appear to be a predictor of performance.
Regarding the relationship between enjoyment and anxiety, Boudreau, MacIntyre, and Dewaele [26] confirm the fluctuating relationship between these two components of attitude: “each emotion appears to operate somewhat independently of the other. Of course, the two emotions interact, converging or diverging during specific events” (p. 165). In this dynamic process, enjoyment and anxiety can be correlated in a contradictory way (for example: low anxiety, high enjoyment) or positively correlated (for example: high anxiety, high enjoyment).
2.1.3. Perceived Control
Perceived control comprises two factors of opposite nature: S-E, which is internal to the student, and the context dependency, which is external to the student. These two factors, however, act on the perception of being in control of the performance during an oral presentation.
S-E, as conceptualized by Bandura [48], has been widely studied in education. As Bandura explains: “perceived self-efficacy refers to beliefs in one’s capabilities to organize and execute the courses of action required to produce given attainments” [49] (p. 3). S-E is built from four sources: actual performances, vicarious experiences, forms of social persuasion and physiological indexes [49,50]. S-E increases if these sources are optimized. Students might be more inclined to persevere in a task if they feel they can succeed, if they witness the success of others in tasks that seem difficult to them, if social persuasion is based on encouragement, if these elements contribute to emotional states that favor perseverance.
S-E is considered to be a form of perceived control over the OCS situation, because it “results from a combination of feelings and beliefs about internal factors (abilities, knowledge, and experience) that influence the feeling of being in control with regard to the execution of particular behaviors” [22] (p. 168).
As was hypothesized with anxiety decreasing when self-confidence is increasing [47], McNatt [51] reported that the principal need expressed by college students to improve their performance in oral communication is better self-confidence, which he associates with S-E. As a perception of self, S-E seems indeed fruitful as a potential predictor of performance.
Dwyer and Fus [25] measured S-E and other self-reported measures such as communication apprehension and self-perceived public speaking competence in oral communication, using an ad hoc questionnaire for each of the concepts, and compared them to the final grades students received in a public speaking course. Their conclusion is that among all the self-reported measures, only S-E was a predictor of students’ grades.
Cameron and Dickfos [52], in an exploratory study, measured S-E with a set of five items designed specifically for their study in accounting education. They observed that students’ S-E and oral skills improved after a practice activity that included students being confronted with the videorecording of their own presentation. However, the authors were not conclusive about the ability of students to accurately self-evaluate their performance. They posited that the reason was that the S-E items used were rather generic compared with the specific context of that oral presentation.
S-E in our model is divided into two aspects: ‘code and content’ S-E and ‘showmanship’ S-E. Indeed, when measured for oral communication in science in a previous study [53], these two distinct constructs emerged. Code and content S-E in OCS is the belief that one can succeed in giving a clear, knowledgeable, and coherent oral presentation in science, including proper language and grammar. Showmanship S-E, on the other hand, relates to the dynamism the oral presenter thinks they can display and the interest they feel confident they can arouse in the audience. Note that the term showmanship should not be understood as the trait of being show-off or arrogant; rather, it describes the quality of someone being a “notably effective performer” [54]. These two emerging aspects of our previous study corroborate the theoretical concept proposed by De Grez and Valcke [21].
Building on the work of van Aalderen-Smeets et al. [22] and complementing S-E, which is an internal factor specific to the student, context dependency refers to the external conditions imposed on the student which contribute to performance constraints. For example, in the context of OCS, a student’s performance may be dependent on the teacher’s permission to use support materials for the presentation or to have to present in front of the class [55].
2.1.4. Outcome of Attitude: Behavior (Performance)
Often considered as the third dimension in the classical model of attitude [56], van Aalderen-Smeets’ et al. [22] framework places the behavioral dimension outside the concept of attitude. Adapted from the theory of planned behavior [57], this idea allows to study the relationship between attitude and behavior.
In their context, van Aalderen-Smeets and Walma van der Molen [58] found that teachers’ own attitude predicted their science teaching behavior (science teaching practice). In this study, the behavioral dimension can be defined as the observable behavior (performance) of the student during the task. This behavior can be assessed, for instance with the use of a specifically designed rubric, to determine the student’s oral competence.
2.2. Oral Competence and Oral Skills
Oral competence is defined by Spitzberg [33] as the sum of three components: knowledge, that is knowing what to communicate; skills, namely the ability to communicate appropriately given the situation; and motivation, which is the affective impulse to communicate. This definition is shared by other scholars [59,60], even if some other researchers indicate several definitions exist in parallel [24,61]. Spitzberg insists on the difference between these components: “the distinction among motivation, knowledge, and skills is indeed important because performance can be enhanced or inhibited by any one or all of these components” [33] (p. 324).
‘Performance’ is the outcome, the actual oral presentation (or other form of oral communication). In education, the performance is what is graded by teachers; it includes both the content (what is presented) and the way it is presented. While both knowledge and motivation influence performance, skills are the observable behavior that is graded. The same can be said about research on communication: when observing a participant, researchers observe the actualization of their competence, in other words their skills.
Oral communication in science has particularities that other types of discourse do not, one of the most salient being the complexity of the subject matter. OCS is not merely public speaking. Rather, science communicators must convey information that is inherently difficult for the public to grasp and yet also present it with convincing arguments when they address their peers [8]. OCS often also entails the need to explain these complex topics. Explaining is one type of skills in interpersonal communication, the skill of “getting your message across” [4]. Explaining, in addition to the everyday action we all do seamlessly, is also what orators must perform when they are in front of large gatherings, as well as health professionals with their patients, lawyers in a court of justice, engineers with their clients, etc. And even if it is a form of communication most important in society, “explaining is an activity often performed poorly by many professionals” [4] (p. 197).
Undergraduate science students are at the intersection of a dichotomy when they make an oral presentation on a subject they are studying. Although their classmates are not purely laymen, none of them is yet an expert. The oral presentation must therefore handle both clear explanations and solid scientific argument [18].
In this manner, four areas of importance relating to content knowledge emerge for OCS: the overall structure of a scientific presentation [62], credibility of argumentation [63,64], mastery of scientific vocabulary [8], and quality of scientific explanations [65].
Kulgemeyer [66] notes, however, that high content knowledge might also be detrimental to the quality of a scientific oral communication if the communicator does not make an effort to speak appropriately to the audience and to adapt their discourse to take into account what the audience already knows and what it does not know (known as “the expert blind spot” [67]). Taking the audience into account is part of the ‘interaction management’ described by Wiemann [68], which is the most central aspect in his model of communicative competence. In summary, oral communications in science “require scientists to establish purpose, consider audience, mentally compose understandable messages, deliver the message in an effective and persuasive manner, and listen to the responses” [8] (p. 693).
2.3. Assessment of Oral Competence
McCroskey and McCroskey [61] describe four ways that oral competence can be measured: objective observation, subjective observation, self-reporting or received-reporting. According to the authors, subjective observation, which involves observing a presentation and grading it with a descriptive rubric [69], is widely used to assess communication skills. In the research literature, several authors indeed report the use of rubrics, either for a general context [59,70,71] or for specific communication needs [72,73].
Dunbar et al. [74] used The Competent Speaker, a rubric developed by Morreale et al. [71] for the second edition to assess oral presentation skills of university students in a public speaking course. This rubric comprises eight criteria, or ‘competencies’ as called by the authors, which are formulated, for instance, as follows: ‘Competency one: Chooses and narrows a topic appropriately for the audience & occasion’ [71] (p. 10). Four competencies are about the content and structure, while the other four are about the quality of the delivery. Each competency has three levels of performance (excellent, satisfactory, and unsatisfactory), which are described in detail to help assessors grade the performance. However, since this instrument is intended for general communications, no aspect of the competencies specifically addresses the content, the explanation of terms or other ways of ensuring that the audience is able to understand the message, all of which are important in scientific communication. Dunbar et al. [74] remark that ‘students can benefit from the use of a standardized rubric based on discipline-specific criteria because it clearly identifies the competencies expected and allows them to see which areas are in the greatest need of improvement once they have been assessed’ [74] (p. 125). The Competent Speaker does not provide discipline-specific criteria. Moreover, these authors report that the use of a rubric with only three levels of performance might be constraining for the assessors, who would prefer a more fine-grained assessment tool [74].
De Grez, for his part [59,75], developed a rubric to assess business administration students’ oral presentation skills. His rubric contains nine criteria, each with five performance levels. With a factor analysis of data collected by observing students’ oral presentations, De Grez concluded that these nine criteria could be regrouped under two factors: delivery (eye-contact, vocal delivery, enthusiasm, and body-language) and content (introduction, structure, conclusion), with two other criteria loading on to both factors (contact with the audience and professionalism) [76]. Even if De Grez’s rubric has a ‘content’ component, it is still not content-specific, but rather designed to assess the structure of the presentation. This rubric would therefore be incomplete to assess scientific oral communication if the quality of the content were to be evaluated.
Similarly, Kerby and Romine [70] proposed a rubric of eight criteria classified into four competencies. This rubric, intended to assess business students’ oral presentations, still includes two characteristics that are relevant for science communication and that were missing from other rubrics. First, one criterion was specifically about the content of the presentation: ‘Understanding of the Content’. The highest performance level for that criterion describes a presenter who can demonstrate understanding of their topic and, in a group presentation, ‘demonstrate understanding of other members’ material’ [70] (p. 177). Additionally, the criterion ‘Audience Awareness’ is very relevant for OCS, the highest level of performance being described as ‘Consistently demonstrates awareness of the audience’s level of understanding through use of discipline-related language, content, and examples’ [70] (p. 178). Still, this rubric does not include criteria about language quality (vocabulary and grammar), which were present in The Competent Speaker, and which are pertinent for all types of communication in any domain.
Finally, McLaren [17] proposes a rubric of ten criteria for the assessment of science presentations that mostly overlap those described by previously reported research. One unique element in her rubric is that structure, clarity of content and interest from audience are group-criteria, while only language, eye contact and anxiety management are individually assessed. However, as proposed by Kerby and Romine [70], even in group presentations, students can and should be assessed individually on their mastery of content. Furthermore, McLaren’s rubric describes criteria that are not specifically designed for science communication assessment but are more general. In that sense, they do not appear to be sufficiently specific for OCS. For instance, no instrument was found that proposed criteria to evaluate the structure of scientific discourse, credibility of argumentation and scientific explanations.
3. Material and Methods
3.1. Objectives of This Study
This study was conducted to compare science students’ perceptions and attitude towards OCS with their performance skills during an oral presentation on a scientific topic. The objectives of this study are twofold:
- Study the correlations between the five factors of the theoretical model of attitude towards oral communication in science, as presented previously in Figure 1;
- Study the correlations between these factors and oral communication skills.
These objectives were achieved by first by developing a questionnaire that measures the components presented in our framework of attitude towards OCS (except for the context dependency component, which is the subject of a parallel study [55] and by creating an exhaustive rubric for analyzing OCS performance skills that is consistent with this specific context. For Objective 1, students answered that questionnaire, which contained items specific to each of these five factors. Correlations were then measured between the factors. For Objective 2, students were observed during an oral presentation in class. The rubric, developed for this study, was used to assess oral their oral skills. Afterwards, correlation analysis between score (measured as part of Objective 1) and OCS performance skills was performed. Details on the methods for both objectives are presented in the following sections.
3.2. Design of This Study
This research follows a convergent parallel mixed-methods design [77] based on two measurement instruments: the perceptions and attitude towards oral communication in science (PAOCS) questionnaire (see Supplementary File S1) and the assessment of oral communication in science skills (AOCSS) rubric (see Supplementary File S2). The design entails mixed methods in the sense that both quantitative and qualitative data were collected; as per Creswell’s and Creswell’s label, it is particularly a convergent parallel mixed-methods design because the “investigator typically collects both forms of data at roughly the same time and then integrates the information in the interpretation of the overall results” [77] (p. 15), as shown in Figure 2.
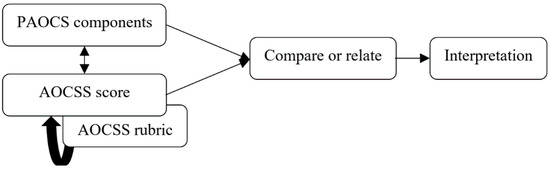
Figure 2.
Convergent parallel mixed-methods design.
The PAOCS questionnaire measures the attitude components of the PAOCS framework (PAOCS components). These attitude components are then compared side by side to the measure of performance skills during an OCS (AOCSS score). The AOCSS score is obtained by qualitative analysis of video using the AOCSS rubric. Both PAOCS questionnaire and AOCSS rubric will be presented in Section 3.5, below.
3.3. Context of This Study
This research was conducted in Montreal, Quebec, Canada. One aspect of the educational system in this province is that it is government prescribed up to grade 13. For science students, grades 12 and 13 consist of a mandatory 2-year preuniversity CEGEP-program. This preuniversity science program has the same curriculum at all the participant CEGEP. The curriculum is made up of specific training courses in chemistry, physics, biology, and mathematics, and general education courses (literature, second language, philosophy, and physical education). The science CEGEP diploma is an enrolment prerequisite to most STEM university programs.
This study was conducted with a sample of science students from seven CEGEP. We surveyed the students in their first semester (Fall 2018) to validate the PACOS questionnaire and again in their last semester of year two (equivalent to Grade 13), before their graduation from CEGEP (Winter 2020). At this time, they were all enrolled in university for the following year.
3.4. Participants and Data Collection
Figure 3 presents an overview of the data collection process. As shown in this figure, a sample of 1295 students answered the first PAOCS questionnaire to validate the PAOCS questionnaire and 266 of them answered the questionnaire a second time (a retention rate of 21%). The retention rate was not very high given that COVID-19 pandemic hit in March 2020, right before the second questionnaire was to be administered. Hence, we opted for an online format for that questionnaire, expecting a high attrition (participants might decide to drop-out of the project or not to answer), a common challenge of longitudinal studies [78]. Still, the retention of 21% after two years allows the possibility of some analysis.
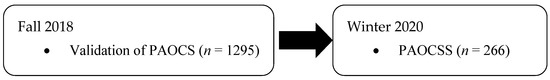
Figure 3.
Data collection.
Of these 266 students, 26 were videorecorded during an oral presentation. Stratified sampling with proportional allocation was conducted [79], with strata derived from a cluster analysis of S-E. In addition to producing a model that has a silhouette of 0.5, the cluster analysis respects the four criteria established by Olsen and Lie [80]. The composition of the profiles and the distribution of students videotaped in each profile are described in Table 1.

Table 1.
Comparison of the composition of the stratified sample of videotaped students to the whole sample.
As shown in this table, stratifying the students selected for videotaping yields a distribution that is not significantly different to that of the students who responded to the PAOCS questionnaire in the Winter 2020 semester (χ2 [2] = 3.0204, p = 0.221).
The videotaping was part of a regular science course: twelve in a biology course, seven in a chemistry course and seven in a physics course. In the biology and chemistry courses, the topic of the oral presentation was an experimental project that the students were required to conduct during the remainder of the semester. The audience for these presentations consisted of the professors and the other students in the class (around 25 students in total). In the physics course, the topic of the oral presentation was to explain a scientific concept (the atom) and the audience consisted only of the professor and a few students (between one and three). The duration of the presentation (10–12 min) and its weighting on the final grade (5%) were the same across all disciplines. Additionally, all teachers assessed the presentation with similar criteria. These criteria are similar to those of the AOCSS rubric, so students were similarly assessed by our research team and their teacher.
3.5. Instruments
Two instruments were developed for this study: the PAOCS questionnaire and the AOCSS rubric. Both instruments are described in the following sections, along with the metrics used to measure their reliability.
3.5.1. PAOCS Questionnaire
The perceptions and attitude towards oral communication in science (PAOCS) questionnaire is a 34-item Likert-type scale on four levels (1: totally disagree, 2: disagree, 3: agree and 4: totally agree). The four-level scale was preferred because it has been shown that young students may have difficulty to adequately self-evaluate on a scale of six or more levels and because an even number of levels removes the possibility of a refuge value in the center of the scale [81]. Other researchers also showed that four-level scales yield results that are more consistent with the normal law, at least for students averaging 12 years old [82]. Although the participants of this study are older (17–19 years old), we chose to follow the recommendations of these researchers.
Some of the items in the questionnaire were selected from questionnaires in the literature and adapted to the OCS context [52,83,84,85,86] while others were produced specifically to cover the concepts identified in our theoretical framework. The selected and adapted items were reviewed by four educational experts to assess the relevance of the statements and wording of the statements (for further details, readers may consult [53]).
After that, the questionnaire was validated with 1295 CEGEP science students in the first phase of this study (Fall 2018). Exploratory factor analysis (KMO = 0.964 greater than 0.6 and significant Bartlett’s test χ2(496) = 2528, p < 0.001) [87] followed by a confirmatory factor analysis (RMSEA < 0.05; CFI = 0.94; SRMR = 0.05 and χ2(517) = 1735.43) showed that the items of the PAOCS questionnaire could be grouped into five factors explaining 67.5% of variance. The adjustment indices for the CFA were derived from the recommendations of Kline [88]. The RMSEA were less than 0.05, which corresponds to an acceptable fit [89]. The comparative fit indices (CFI) were also acceptable since they were above 0.95 [90]. Finally, the SRMR value was good, since it was lower than 0.06 [90]. As presented in Table 2, the internal consistency of each scale varies between 0.77 and 0.95 (Cronbach’s alphas), which is acceptable [91]. Internal consistency is “the most important form of reliability for multi-item instruments” [77] (p. 154). In both EFA and CFA, factor loadings were considered acceptable when they had a value greater than 0.3 [92].
Table 2.
The five factors of PAOCS questionnaire, keywords, and fidelity indices.
Specifically, some statements on the showmanship S-E and code and content S-E were inspired in part by the questionnaires of Cameron and Dickfos [52] and Demir [83] and others were developed by the research team. An example of a statement for showmanship S-E would be, “I am interesting when I communicate orally”, while an example of code and content S-E would be: “I have the required level of scientific vocabulary” or “I express myself correctly” (all examples are freely translated from French). The enjoyment items were taken and adapted from van Aalderen-Smeets and Walma van der Molen’s [86] questionnaire or from Hasni and Potvin’s [84] affective component of interest. An example of a statement for this variable would be, “I really enjoy doing an oral science communication”. The anxiety statements are from an adaptation of the van Aalderen-Smeets and Walma van der Molen’s [86] questionnaire. An example of a statement for this variable would be, “I feel nervous when doing an oral communication in science”. Finally, the statements on perceived relevance are taken from an adaptation of the Simpkins, Davis-Kean, and Eccles [85] questionnaire, with additional questions developed by the research team. An example of a statement for this variable would be, “For me, being good at oral science presentations is important”.
The component context dependency of the PAOCS model is not present in the PAOCS questionnaire scale and was observed only during the interviews with students during a parallel study [55]. It refers to external conditions imposed on the student which contribute to performance constraints (e.g., having friends in the audience, having the teacher’s permission to use notes, having chosen themselves the topic of the presentation). Qualitative results during that parallel study seem to indicate that context dependency in OCS is mostly influential on showmanship S-E. Notably, the more the context is perceived favorably by the student, the more highly their showmanship S-E is expressed.
3.5.2. AOCSS Rubric
The performance skills during oral presentation were assessed with the assessment of oral communication in science skills (AOCSS) rubric, developed for the present study. This rubric focuses on nine criteria, described in Table 3.
Table 3.
Description of the AOCSS rubric’s criteria.
As mentioned earlier, this rubric was adapted from different sources [59,70,71] and developed for the specific context of oral presentations in science. The final criteria were reviewed by a college science professor and a research assistant specializing in linguistics. They evaluated the clarity of the criteria, their appropriateness, and the consistency of the intervals between each level.
Each criterion was detailed into five performance levels to help assessors give a grade for each one. For instance, the first criterion of the AOCSS rubric is Language. The five performance levels for this criterion are (freely translated from original French): “the language of the presentation is always correct”, “the language of the presentation is correct despite some minor errors”, “the language of the presentation is mostly correct”, “the language of the presentation has errors that might impede understanding from the audience”, and “the language of the presentation has several errors and thus, understanding is impeded”. Similar description of the five performance levels were developed for each of the nine criteria listed in Table 3.
Each video recording of oral presentations collected for this study was individually observed and assessed by two assessors (one of the authors of this paper and a research assistant), following a method used by other scholars in similar context [74,76]. After the assessment of one recording, the assessors discussed to reach a common understanding of the rubric. After this discussion, they cross-coded 10% of the data, for an interrater agreement of over 80%. The other oral presentations were then assessed individually by the two assessors. Ultimately, any discrepancy between the two assessors was discussed, and a consensus was reached for each evaluation [93].
4. Results and Discussion
In this section, we first present the measurements from the two instruments (PAOCS and AOCSS), then we analyze the relationships between these measurements, as stated in the purpose of this study. Section 4.1 details the results for Objective 1. Section 4.2 describes the oral skills assessed as part of the pursuance of Objective 2, while Section 4.3 presents the completed results for Objective 2.
4.1. Students’ Perceptions and Attitude towards OCS
Objective 1 of this research is to study the correlation between the five factors of the theoretical model of attitude towards OCS, that is perceived relevance, enjoyment, anxiety, code and content S-E and showmanship S-E. Science students answered the questionnaire during their last semester of CEGEP. This questionnaire measured their perceptions and attitude towards OCS on the three dimensions outlined in the PAOCS framework: perceived control, affective states, and cognitive beliefs. These three dimensions divided into the five components presented earlier in Figure 1 (except context dependency, not measured by the questionnaire).
Before delving into the scores for each component, it is worthwhile to inspect the correlations between all five components. These correlations are presented in the first columns of Table 4.
Table 4.
Mean scores for the five components of the PAOCS questionnaire (n = 266) and correlations (Pearson’s r) between these components.
We note that the two components that correlate the most are the two aspects of S-E (r = 0.61), which could be explained by the fact that these two components, while two separate factors as per the factor analysis, are still similar ontologically. Another correlation is quite high, that is between the two affective states components: enjoyment and anxiety (r = −0.61). This correlation is negative, showing that the more a student enjoys OCS, the less they feel anxious about this activity, and reciprocally. Inverse correlations between these two factors were also observed by van Aalderen-Smeets and Walma van der Molen [86]. Both components of the affective state dimension correlate significantly (r > 0.35) with the two components of the perceived control dimension (negatively with anxiety). These two dimensions of attitude towards OCS seem therefore to be closely related. Finally, in the dimension of cognitive beliefs, we note that perceived relevance does not correlate substantially with anxiety nor with code and contents S-E (respectively r = −0.26 and r = 0.35), while it correlates at a higher level with enjoyment and showmanship S-E (respectively r = 0.44 and r = 0.48). This seems to indicate that students who feel that OCS is relevant to them (perceived relevance) also enjoy it more (enjoyment) and perceive more highly their ability to give lively oral presentations in science (showmanship S-E).
After having inspected correlations between the components of the PAOCS, this next section will detail the mean scores for each component, as presented in Table 4. The possible score for each component ranges from 1 (strongly disagree) to 4 (strongly agree). Overall, we can see that students showed various perception scores from one component to another. A score over 2.5 shows mainly agreement with the items, while below 2.5 shows disagreement.
First, the perceived relevance component is the one with which students agreed the most. This high perception of relevance supports the fact that oral communication is not only deemed important by professors or curriculum designers, but also by science students themselves. This is quite the opposite of what was previously reported [19,38]; contrary to Leggett et al., participants in our study were not asked to compare the relevance of OCS with other science skills. Therefore, we cannot conclude on the relative perceived relevance for OCS, but we still can observe that they perceive this skill as quite highly relevant in absolute terms.
Secondly, in the dimension of affective states, scores show that students felt more anxiety than enjoyment about oral presentations (t [265] = 4.590, p < 0.001, η2 = 0.074, for a moderate effect size), as was previously described in the communication apprehension field of research [61]. Moreover, this last component received the lowest score among the five of the PAOCS, showing that students, on average, do not enjoy oral presentations. Reasons as to why oral presentations are disliked take their origin in the anxiety public-speaking generates in most people: both physical (trembling, heart racing) and psychological (negative self-discourse and fear of being judged) symptoms are common [40] and explain why anxiety and dislike are so closely related when it comes to make an oral presentation in class.
Finally, regarding the two aspects of S-E in the perceived control dimension, we can see that students have a relatively positive S-E. Yet, students have a considerably higher S-E regarding the code and content of their presentation than the one regarding showmanship (t [265] = 7.049, p < 0.001, η2 = 0.16, for a large effect size). It tells us that they perceive their ability of conveying a scientific presentation with appropriate language and structure, as well as sound scientific content (code and content S-E), at quite a higher level than their ability to give an interesting and lively oral presentation (showmanship S-E).
As the hypothesis formulated by McNatt [51], strong self-efficacy might be the first step of being a good oral communicator. As our results measured two aspects of S-E, it is interesting to note the difference in the level of these two aspects in the students. As Cavanagh and his colleagues [94] note, though, self-efficacy in the academic context might not be entirely transferable to a professional setting, which is a more stressful environment with higher stakes. But as Bandura [48,49] describe S-E in a particular task, it is strongly correlated to motivation and the desire to get involved in that type of task. Even if students’ high S-E in OCS in school is only a steppingstone to engage in more oral communication activities, it could very well feed their future S-E in more authentic contexts.
4.2. Assessment of Performance: Measurement of Skills in OCS
In the pursuance of Objective 2, which is the measure of correlation between attitude and skills in OCS, we observed and assessed oral presentations. Students’ performance during that oral presentation in science was assessed with the AOCSS rubric. The students that were assessed (n = 26) are a subsample of students who answered the questionnaire (n = 266). Mean scores for the nine criteria of the rubric are presented in Table 5.
Table 5.
Mean performance scores for the nine criteria of the AOCSS rubric (n = 26).
The mean global performance score is near 80%, showing that these students were, overall, quite good in OCS. This was to be expected, as these students were in the process of completing their final semester of the science program at the time of this oral presentation.
Criteria that scored particularly high are Use of proper scientific vocabulary and Vocal delivery, while Presence is the criterion that was graded the lowest by the assessors. Furthermore, mean scores specific for each of the three blocks of criteria, Language proficiency, Content, and Showmanship, show that students performed significantly better in Language proficiency and in content than in showmanship, as shown by a one-way repeated-measures ANOVA (Wilk’s Lambda = 0.733, F (2, 24) = 4.379, p < 0.05, η2 = 0.267). Follow up comparisons indicated that the pairwise difference between Showmanship and Language proficiency and between Showmanship and Content was significant (p < 0.01, Cohen’s d = 0.51 for a moderate effect size), while the pairwise difference between Language proficiency and Content was not significant (p > 0.05). This indicates that although students are good with the language and scientific content, they have significantly more difficulty giving an interesting and lively oral presentation. And yet, showmanship is deemed by scholars as the most important aspect of oral communication, as reported by Dunbar and her colleagues [74]. These same researchers report a similar observation, that is showmanship being slightly lower than other criteria when they evaluated oral communication performance in the context of a general education public speaking course. While they do not provide a hypothetical explanation for that observation, we can suppose that this subskill might be more difficult to develop, furthermore if not supported by teaching. Being able to give an engaging presentation is not merely a nice perk, because “it is first necessary to motivate and gain attention of the learner in order for learning to take place” [45]. Specific tools to help support the development of showmanship will be suggested further in this paper.
This observation is coherent with what was reported in the previous section: when asked to self-evaluate their ability with the PAOCS questionnaire, students also reported a code and content S-E that was higher than their showmanship S-E. This relationship, as well as other relationships between perceptions and attitude (PAOCS questionnaire scores) and skills assessment (AOCSS rubric scores), will be presented in more detail in the following section.
4.3. Exploring the Relationship between Students’ Perceptions and Attitude, and Their Oral Skills
After having looked at students’ perceptions and attitude regarding OCS and their performance scores in oral presentation, the next section will explore the relationships between these two sets of measurement. This corresponds to the Objective 2 of this research, that is the correlation between attitude factors and oral communication skills.
To investigate this, we analyzed Pearson’s correlations between AOCSS global performance score and the five components of attitude. These correlations are as follows: r = –0.072 between perceived relevance and performance score, r = 0.454 between enjoyment and performance score, r = –0.241 between anxiety and performance score, r = 0.284 between code and content S-E and performance score, and r = 0.422 between showmanship S-E and performance score.
Only two components of attitude significantly correlate (p < 0.05) with global oral performance score in OCS: enjoyment and showmanship S-E. The other three components—perceived relevance, anxiety, and code and content S-E—do not seem to be linked with performance score. Those five results will be discussed more in details below.
We recall that perceived relevance of OCS was the component of attitude with the highest score (3,37/4), showing that students think that oral communication is indeed very relevant for them. This observation in itself is contrary to what was observed by other scholars [19,52]. This discrepancy may be explained by our context: students were about to graduate and go on to university, mostly to pursue scientific careers and they were questioned about the relevance of OCS in science in general. Regarding the correlations with oral performance, though, no statistically significant correlation was observed with the performance score. This leads towards the interpretation that regardless of their skills, all students find OCS relevant, as the high score to this factor in the PAOCS suggested. This is an uplifting result: all science students, regardless of their actual ability in the matter, consider OCS to be very important for them, as future scientists.
There is no significant correlation between performance and anxiety, but the correlation index still is negative showing a tendency of inverse proportionality. This suggests that the less students are anxious, the better they perform in an oral presentation in science, which makes sense. The fact that the correlations are not statistically significant might indicate that anxious students can still perform well despite their anxiety. It has been documented that anxiety from speaking in front of a class might be linked to lack of performance [40,95,96]. However, as mentioned by Bodie [40], only students with high public speaking anxiety sometimes demonstrate speaking styles that negatively impacted their performance (for instance, ‘confrontation style’ and ‘inflexible style’).
On the contrary, performance scores significantly correlate with enjoyment, the second affective factor measured in the PAOCS. Students who declared enjoying OCS more performed better and, conversely, those who declared enjoying it less got lower performance scores. We can postulate that, as performance can be improved by more practice, enjoyment of oral communication can lead individuals to engage more in frequent practice: they might seek out more opportunities to practice if they find it more enjoyable and this can translate into better performance. As mentioned earlier and by other researchers [46], enjoyment in oral communication has been much less studied than anxiety. Still, one group of researchers studied performance in oral communication in relation to enjoyment [47]. The context of that study is very different than the one reported here, as it was conducted with Dutch students of English as a foreign language (EFL). Still, the researchers report that enjoyment was not a predictor of performance in that context, contrary to the results of the present study. As oral communication is more an intrinsic part of learning a second language as it is of learning science, it might be more difficult to see a correlation between enjoyment and performance. In science, students often sit and listen to a teacher or perform intellectually challenging exercises; doing an oral presentation could be seen by some of them as a welcome change of pace in the course. More enthusiastic students towards oral communication might better prepare themselves, as they enjoy that type of activity, while reluctant students might dread the time they will have to stand up in front of the class. That very contrasted attitude could explain in part the relationship between enjoyment and performance we observed during this study.
For S-E, the significant correlations concern only showmanship: indeed, showmanship S-E correlates significantly with performance score. When students declared having a high perception of their ability to be dynamic and to give a presentation that would generate interest, they indeed performed better globally (as measured with the AOCSS rubric). This points towards a potential underlying factor, which is confidence in the presentation skills.
What is more surprising is the lack of correlation between code and content S-E and performance score. This result is somewhat contrary to what was observed by De Grez and Valcke [21], who reported that performance in oral communication was indeed correlated with S-E. Since we measured two distinct aspects of S-E, and one correlated with performance while the other did not, we could postulate that global S-E measured by De Grez and Valcke might not be fine-grained enough to perceive that distinction. This can also be explained by the difference in study design: De Grez and Valcke’s S-E instrument was constituted of items directly related to criteria used for skills assessment, whereas our S-E scale was more general and did not question students on the precise presentation we observed, but rather on their abilities in OCS in general.
In another study on the relationship between oral S-E and performance, Cavanagh and his colleagues [94] used students’ course grade as a proxy of performance in oral communication, as the topic of the entire course was communication. Similarly to what was observed by De Grez and Valcke [21], they report that students’ oral S-E was a strong predictor of course grade, thus of oral performance. The instrument used to measure S-E was specifically created for that study and does not measure different aspects of S-E, as we observed with factor analysis on our own instrument [53].
5. Educational Implications
Based on the results from our study and on the recent literature, we formulate in this section a few recommendations for educators who would be interested in improving their students’ skills in OCS. To begin, providing more opportunities to practice oral communication in class is recommended by several researchers [60,97,98,99]. This could help students not only develop a habit of speaking about science in front of an audience, but also strengthen their self-efficacy while doing so. Additionally, as our results point towards the fact students’ showmanship S-E is positively correlated to their perform in an oral presentation, it would be relevant to foster specifically that type of S-E during instruction. To do so, teachers could envision providing specific advice on the importance of not reading a text, of facing the audience, and of anticipating the questions, as these three skills are important to be a good oral presenter [45]. A certain level of showmanship can help audience engagement and listening, as “it is first necessary to motivate and gain attention of the learner in order for learning to take place” [45] (p. 1189). A good oral presenter must also communicate both content and emotion, as “nothing helps a presentation more than communicating passion and confidence. The audience will recognize those emotions, and they will add credibility to the message” [45] (p. 1188).
The second factor that is correlated to performance in OCS from our data is enjoyment of doing oral presentations. Instructors could help increase the enjoyment by allowing students to choose their own subject for an oral presentation. This could in turn increase motivation, which is recognized as an important predictor of oral presentation performance [100]. Motivating teachers have been characterized by the way their teaching meets several needs of their students: when teachers offer choice, students need for autonomy is met; when teachers help them master the course contents, students need for competence is met; when teachers display a warm and supportive attitude towards them, students need for relatedness is met [101,102]. As such, when teachers offer choice of topic for an oral presentation, when they provide students opportunities of practicing oral communication, and furthermore in a safe environment and with an accepting attitude, students’ needs are met, which contributes to motivation towards learning of oral communication. In turn, such a class climate could also improve teachers’ motivation, as their needs would also be better met in that type of environment [103].
As such, a more overarching consideration would thus be to design oral presentation opportunities that could boost students’ self-confidence, as they seem to indicate that they first need to feel self-confident in front of the public before considering improving their oral skills [51]. This could be done, for instance, by designing successive scaffolded oral activities, in which the size of the audience is gradually increased (one-on-one, in small groups, in the front of the class) to help students first build self-confidence in a safe environment before having to face a large group [97,100]. After having developed a basis of self-confidence, development of S-E could also be fostered by gaining specific skills in OCS, for instance learning how to formulate a good scientific explanation [65], a “crucial part of skilled professional practice in areas such as education, medicine, nursing, management, technology, and law” [4] (p. 196). Instructors could design learning activities that would highlight critical characteristics of a good explanation in their specific domain and have students gain practice in constructing such explanations. This could help the development of students’ oral S-E.
6. Conclusions
In this study, we investigated the relationships between components of attitude towards OCS (Objective 1, Section 4.1) and also assessed students’ oral skills during an oral presentation in class (Section 4.2). As an exploratory analysis, we then explored the relationships between students’ attitude components and their oral skills in an OCS context (Objective 2, Section 4.3).
From the study of the relationship between attitude components towards OCS, we conclude that the enjoyment and showmanship S-E components were correlated with all the others. Moreover, these two components are the only ones to be correlated with perceived relevance. This suggests that future research on attitude towards OCS might benefit from including the components of enjoyment and showmanship S-E. For instance, it might be of interest to researchers and teachers to know if classroom activities designed to enhance the pleasure of doing an oral presentation or the feeling of being able to give a lively and engaging presentation could be beneficial to the development of oral skills [76].
Assessment of students’ skills in OCS showed that they perform better in the aspects of the Language proficiency (language, speech, and vocal delivery) and Content (scientific vocabulary and explanations, narrative thread, and argument) than in Showmanship (audience awareness and presence). Showmanship seems therefore to be one aspect of oral presentation skills that teachers might want to develop in their students. Students who have more difficulty in this area need opportunities to practice and opportunities to learn the techniques that they may feel are innate in others [45]. This opens the door to targeted reinforcement, offered specifically to students who need it. One might think here of something like the formative workshop described by Dumais [104], which targets one aspect of speaking at a time.
Based on the PAOCS framework, we compared postsecondary science students’ perceptions and attitude towards oral communication in science (OCS) with their performance skills in an oral presentation on a scientific topic. We noted that there was a significant correlation between oral performance in science and one aspect of S-E, that is showmanship S-E, which we define as the dynamism the oral presenter thinks they can display and the interest they think they can arouse in the audience. This understanding of showmanship is certainly important to any scientific discourse, as professional scientists indeed must consider their audience, were they engineers, doctors or pure laboratory scientists. Having to explain orally, recommend, solicit, etc., requires a certain degree of showmanship to adapt the discourse to the audience and the context of communication.
This observation should be contrasted with the absence of correlation between the other aspect of S-E and performance, that is code and content S-E, which we define as the belief that one can succeed in giving a clear, knowledgeable, and coherent oral presentation in science, including proper language and grammar. This suggests that supporting pedagogical activities aimed at improving ability in OCS might be more efficient if they targeted the improvement of showmanship S-E. While correlation is not causation, it appears that Showmanship has a significant influence on global OCS performance.
We also measured a positive correlation between oral performance in OCS and enjoyment of that type of activity. Therefore, if pedagogical initiatives were to be implemented, not only should stress-reducing strategies be planned, but also ways of making oral presentations more enjoyable to students. Liking the activities seems as strongly correlated to performance as S-E, and thus it should not be overlooked.
7. Limitations
The portrait we trace here is particular to our educational context, but readers from abroad may find our observations useful since 18–19-year-old students in chemistry, physics or biology classes are required to make oral presentations on scientific topics in most countries. The stress and anxiety caused by having to speak about difficult topics in front of an audience are somewhat universal features of oral presentations and all future scientists must learn how to communicate orally. From a statistical point of view, our convenience sample is certainly a limitation to the generalization of the results. Furthermore, the small sample size selected for the oral performance assessment (n = 26) is also a limitation, although the data followed a normal distribution.
As this research was conducted under a mixed-methods research design, some ‘pitfalls’ identified by Wilkinson and Staley [105] had to be accounted for and prevented if possible. One of the eight most common pitfall identified by these authors, and one our study suffered from, is the small sample for the qualitative part of this study, that is n = 26 for the observations (by video) of an oral presentation. The conclusions we present related to the analysis of associations between quantitative measures and qualitative observations, are therefore only exploratory at this point. A larger sample of qualitative observations would have been warranted to confirm our exploratory observations, that still present an interesting portrait of an understudied topic, that is correlation between self-perception and performance in oral communication in science.
Additionally, given the fact that the number of students observed was not sufficient to perform a distinct analysis for biology, physics, and chemistry, we can only postulate that there might be a discipline-specific effect on the relationship between attitude and oral skills. For instance, a student with a higher S-E in biology than in physics would probably perform better doing an oral presentation in biology than in physics. Further research would be needed to demonstrate the relationships between discipline-specific S-E and oral skills in that discipline.
Supplementary Materials
The following supporting information can be downloaded at: https://www.mdpi.com/article/10.3390/educsci12070466/s1, Supplementary File S1: PAOCS Questionnaire, Supplementary File S2: AOCSS Rubric.
Author Contributions
C.C. and S.L. both conducted the research. They analyzed the data, discussed results, and drew conclusions. They both participated in the creation of the instruments and in the data collection. C.C. wrote this paper and S.L. reviewed and expanded it. All authors have read and agreed to the published version of the manuscript.
Funding
This research was funded by the Programme d’aide à la recherche sur l’enseignement et l’apprentissage (‘Teaching and Learning Research Support Program’) from Quebec’s provincial Ministry of Education (grant number PA2017-016) and by the Programme d’aide à la diffusion des résultats de recherche au collégial (‘Support Program for the Dissemination of CEGEP-Level Research Results’) from the same Ministry.
Institutional Review Board Statement
This study was conducted in accordance with the Declaration of Helsinki, and approved by the Institutional Review Board of each institution where data were collected (all dates of approval are anterior to data collection). Informed consent was obtained from all subjects involved in this study.
Informed Consent Statement
Informed consent was obtained from all subjects involved in the study.
Data Availability Statement
The data presented in this study are available on request from the corresponding author. The data are not publicly available due to restriction from ethics committees.
Acknowledgments
The authors which to thank Claude-Émilie Marec, research assistant, for her help during data collection and analysis, and Bruno Voisard, chemistry professor, for his insights on the development and use of the AOCSS rubric. They also warmly thank all students who participated in this study, and the institutions that facilitated their participation.
Conflicts of Interest
The authors declare no conflict of interest.
References
- Chan, V. Teaching oral communication in undergraduate science: Are we doing enough and doing it right? J. Learn. Des. 2011, 4, 71–79. [Google Scholar] [CrossRef]
- Kulgemeyer, C.; Schecker, H. Students Explaining Science—Assessment of Science Communication Competence. Res. Sci. Educ. 2013, 43, 2235–2256. [Google Scholar] [CrossRef]
- Eichengreen, B.; Aksoy, C.G.; Saka, O. Revenge of the Experts: Will COVID-19 Renew or Diminish Public Trust in Science? SRC Discussion Paper No 96; Systemic Risk Centre, The London School of Economics and Political Science: Houghton, London, 2020. [Google Scholar]
- Hargie, O. Skilled Interpersonal Communication: Research, Theory and Practice, 7th ed.; Routledge: London, UK, 2021. [Google Scholar] [CrossRef]
- Belim, C. Mirror, mirror, on the wall, who’s the communicationally competent one of all? and the other side of the mirror: Health professional communication competences and patient evaluation. In Health Communication Models and Practices in Interpersonal and Media Contexts: Emerging Research and Opportunities; IGI Global: Hershey, PA, USA, 2022; pp. 108–133. [Google Scholar] [CrossRef]
- Jennings, A.; Ferguson, J. Focusing on communication skills in engineering education. Stud. High. Educ. 1995, 20, 305–314. [Google Scholar] [CrossRef]
- Baram-Tsabari, A.; Lewenstein, B.V. Science communication training: What are we trying to teach? Int. J. Sci. Educ. Part B 2017, 7, 285–300. [Google Scholar] [CrossRef]
- Yore, L.; Bisanz, G.L.; Hand, B.M. Examining the literacy component of science literacy: 25 years of language arts and science research. Int. J. Sci. Educ. 2003, 25, 689–725. [Google Scholar] [CrossRef]
- De Beni, R. Learning from Texts or Lectures: Loci Mnemonics can Interfere with Reading but not with Listening. Eur. J. Cogn. Psychol. 1997, 9, 401–416. [Google Scholar] [CrossRef]
- De Beni, R.; Moè, A. Imagery and rehearsal as study strategies for written or orally presented passages. Psychon. Bull. Rev. 2003, 10, 975–980. [Google Scholar] [CrossRef]
- Stevens, S.; Mills, R.; Kuchel, L. Teaching communication in general science degrees: Highly valued but missing the mark. Assess. Eval. High. Educ. 2019, 44, 1163–1176. [Google Scholar] [CrossRef]
- Seinfeld, J. The Pilot. In Seinfeld; NBC: New York, NY, USA, 1993. [Google Scholar]
- MacIntyre, P.D.; Macdonald, J.R. Public speaking anxiety: Perceived competence and audience congeniality. Commun. Educ. 1998, 47, 359–365. [Google Scholar] [CrossRef]
- Kelly, L.; Keaten, J.A. Treating communication anxiety: Implications of the communibiological paradigm. Commun. Educ. 2000, 49, 45–57. [Google Scholar] [CrossRef]
- Hunter, K.M.; Westwick, J.N.; Haleta, L.L. Assessing Success: The Impacts of a Fundamentals of Speech Course on Decreasing Public Speaking Anxiety. Commun. Educ. 2014, 63, 124–135. [Google Scholar] [CrossRef]
- Lefebvre, L.; Lefebvre, L.E.; Allen, M. Training the butterflies to fly in formation: Cataloguing student fears about public speaking. Commun. Educ. 2018, 67, 348–362. [Google Scholar] [CrossRef]
- McLaren, I. Science students’ responses to an oral communication skills development initiative: Attitude and moti-vation. Int. J. Teach. Learn. High. Educ. 2019, 31, 73–85. [Google Scholar]
- Divan, A.; Mason, S. A programme-wide training framework to facilitate scientific communication skills development amongst biological sciences Masters students. J. Furth. High. Educ. 2016, 40, 543–567. [Google Scholar] [CrossRef]
- Edmondston, J.; Dawson, V. Perspectives of Science Communication Training Held by Lecturers of Biotechnology and Science Communication. Int. J. Sci. Educ. Part B 2014, 4, 195–210. [Google Scholar] [CrossRef]
- Applebee, M.S.; Johanson, A.P.; Lawler-Sagarin, K.A.; Losey, E.N.; Munro-Leighton, C. The Three-Minute Slide as an Effective Tool for Developing Oral Communication Skills. J. Chem. Educ. 2018, 95, 1419–1422. [Google Scholar] [CrossRef]
- De Grez, L.; Valcke, M. Student response system and how to make engineering students learn oral presentation skills. Int. J. Eng. Educ. 2013, 29, 940–947. [Google Scholar]
- Van Aalderen-Smeets, S.I.; Van Der Molen, J.H.W.; Asma, L.J.F. Primary teachers’ attitudes toward science: A new theoretical framework. Sci. Educ. 2012, 96, 158–182. [Google Scholar] [CrossRef]
- Chesebro, J.W.; McCroskey, J.C.; Atwater, D.F.; Bahrenfuss, R.M.; Cawelti, G.; Gaudino, J.L.; Hodges, H. Communication apprehension and self-perceived communication competence of at-risk stu-dents. Commun. Educ. 1992, 41, 345–360. [Google Scholar] [CrossRef]
- McCroskey, J.C. Communication apprehension: What have we learned in the last four decades. Hum. Commun. 2009, 12, 179–187. [Google Scholar]
- Dwyer, K.K.; Fus, D.A. Perceptions Of Communication Competence, Self-Efficacy, And Trait Communication Apprehension: Is There an Impact on Basic Course Success? Commun. Res. Rep. 2002, 19, 29–37. [Google Scholar] [CrossRef]
- Boudreau, C.; MacIntyre, P.D.; Dewaele, J.-M. Enjoyment and anxiety in second language communication: An idiodynamic approach. Stud. Second Lang. Learn. Teach. 2018, 8, 149–170. [Google Scholar] [CrossRef]
- Blalock, C.L.; Lichtenstein, M.J.; Owen, S.; Pruski, L.; Marshall, C.; Toepperwein, M. In Pursuit of Validity: A comprehensive review of science attitude instruments 1935–2005. Int. J. Sci. Educ. 2008, 30, 961–977. [Google Scholar] [CrossRef]
- Barmby, P.; Kind, P.M.; Jones, K. Examining Changing Attitudes in Secondary School Science. Int. J. Sci. Educ. 2008, 30, 1075–1093. [Google Scholar] [CrossRef]
- Murphy, P.M. Teaching Structure–Property Relationships: Investigating Molecular Structure and Boiling Point. J. Chem. Educ. 2007, 84, 97. [Google Scholar] [CrossRef]
- Osborne, J.; Simon, S.; Collins, S. Attitudes towards science: A review of the literature and its implications. Int. J. Sci. Educ. 2003, 25, 1049–1079. [Google Scholar] [CrossRef]
- Potvin, P.; Hasni, A. Analysis of the Decline in Interest Towards School Science and Technology from Grades 5 Through 11. J. Sci. Educ. Technol. 2014, 23, 784–802. [Google Scholar] [CrossRef]
- Toma, R.B.; Lederman, N.G. A Comprehensive Review of Instruments Measuring Attitudes Toward Science. Res. Sci. Educ. 2020, 52, 567–582. [Google Scholar] [CrossRef]
- Spitzberg, B.H. Communication competence as knowledge, skill, and impression. Commun. Educ. 1983, 32, 323–329. [Google Scholar] [CrossRef]
- Rubin, R.B.; Rubin, A.M.; Jordan, F.F. Effects of Instruction on Communication Apprehension and Communication Competence. Commun. Educ. 1997, 46, 104–114. [Google Scholar] [CrossRef]
- Tucker, M.L.; McCarthy, A.M. Presentation self-efficacy: Increasing communication skills through service-learning. J. Manag. Issues 2001, 13, 227–244. [Google Scholar]
- Eccles, J.S.; Wigfield, A. Motivational Beliefs, Values, and Goals. Annu. Rev. Psychol. 2002, 53, 109–132. [Google Scholar] [CrossRef] [PubMed]
- Viau, R. La Motivation en Contexte Scolaire, 5th ed.; De Boeck: Bruxelles, Belgium, 2009; Available online: https://www.deboecksuperieur.com/ouvrage/9782804111489-la-motivation-en-contexte-scolaire (accessed on 18 February 2021).
- Kinnear, A.; Boyce, M.; Bennett, I. Student and staff perceptions of the importance of generic skills in science. High. Educ. Res. Dev. 2004, 23, 295–312. [Google Scholar] [CrossRef]
- Edmondston, J.E.; Dawson, V.; Schibeci, R. Undergraduate Biotechnology Students’ Views of Science Communication. Int. J. Sci. Educ. 2010, 32, 2451–2474. [Google Scholar] [CrossRef][Green Version]
- Bodie, G.D. A Racing Heart, Rattling Knees, and Ruminative Thoughts: Defining, Explaining, and Treating Public Speaking Anxiety. Commun. Educ. 2010, 59, 70–105. [Google Scholar] [CrossRef]
- Goberman, A.M.; Hughes, S.; Haydock, T. Acoustic characteristics of public speaking: Anxiety and practice effects. Speech Commun. 2011, 53, 867–876. [Google Scholar] [CrossRef]
- Schlenker, B.R.; Leary, M.R. Social anxiety and self-presentation: A conceptualization model. Psychol. Bull. 1982, 92, 641–669. [Google Scholar] [CrossRef]
- Al-Saggaf, M.A.; Azman, A.A.I.B. Management and Science University BTESL Students’ Perceptions towards Anxiety in Oral Presentation. J. Transl. Lang. Stud. 2021, 2, 66–81. [Google Scholar] [CrossRef]
- Marinho, A.C.F.; de Medeiros, A.M.; Gama, A.C.C.; Teixeira, L.C. Fear of Public Speaking: Perception of College Students and Correlates. J. Voice 2017, 31, 127.e7–127.e11. [Google Scholar] [CrossRef]
- Collins, J. Education techniques for lifelong learning: Giving a PowerPoint presentation: The art of communicating effectively. RadioGraphics 2004, 24, 1185–1192. [Google Scholar] [CrossRef][Green Version]
- Dewaele, J.M.; MacIntyre, P.D. The two faces of Janus? Anxiety and enjoyment in the foreign language class-room. Stud. Second Lang. Learn. Teach. 2014, 4, 237–274. [Google Scholar] [CrossRef]
- Van Batenburg, E.S.L.; Oostdam, R.; Van Gelderen, A.J.S.; Fukkink, R.G.; De Jong, N. Oral Interaction in the EFL Classroom: The Effects of Instructional Focus and Task Type on Learner Affect. Mod. Lang. J. 2019, 103, 308–326. [Google Scholar] [CrossRef]
- Bandura, A. Self-efficacy mechanism in human agency. Am. Psychol. 1982, 37, 122–147. [Google Scholar] [CrossRef]
- Bandura, A. Self-efficacy: Toward a unifying theory of behavioral change. Psychol. Rev. 1977, 84, 191–215. [Google Scholar] [CrossRef] [PubMed]
- Schunk, D.H.; DiBenedetto, M.K. Self-efficacy theory in education. In Handbook of Motivation at School; Wentzel, K.R., Miele, D.B., Eds.; Routledge: London, UK, 2016. [Google Scholar]
- McNatt, D.B. Enhancing public speaking confidence, skills, and performance: An experiment of service-learning. Int. J. Manag. Educ. 2019, 17, 276–285. [Google Scholar] [CrossRef]
- Cameron, C.; Dickfos, J. ‘Lights, Camera, Action!’ Video Technology and Students’ Perceptions of Oral Communication in Accounting Education. Account. Educ. 2014, 23, 135–154. [Google Scholar] [CrossRef]
- Langlois, S.; Cormier, C. Sentiment d’efficacité personnelle à l’oral d’étudiants postsecondaires en sciences: Élaboration de l’échelle Perception et attitude envers la communication orale scientifique (PACOS). Mes. Éval. En Éducation 2021, 44, 61–101. [Google Scholar] [CrossRef]
- Merriam-Webster. “Showman”, Merriam-Webster.com Dictionary. Available online: https://www.merriam-webster.com/dictionary/showman (accessed on 18 January 2022).
- Langlois, S.; Cormier, C.; Marec, C.-É. Respecter les normes et posséder un sens du spectacle en communication orale en sciences: Les deux aspects du sentiment d’efficacité personnelle d’étudiants postsecondaires en sciences. Can. J. Sci. Math. Technol. Educ. 2021, 21, 518–538. [Google Scholar] [CrossRef]
- Jones, M.G.; Leagon, M. Science teacher attitudes and beliefs. In Handbook of Research on Science Education; Lederman, N., Abell, S., Eds.; Routledge: New York, NY, USA, 2014; Volume 2, pp. 830–843. [Google Scholar]
- Ajzen, I. The Theory of Planned Behavior. Organ. Behav. Hum. Decis. Process. 1991, 50, 179–211. [Google Scholar] [CrossRef]
- Van Aalderen-Smeets, S.I.; van der Molen, J.H.W. Improving primary teachers’ attitudes toward science by attitude-focused professional development. J. Res. Sci. Teach. 2015, 52, 710–734. [Google Scholar] [CrossRef]
- De Grez, L. Optimizing the Instructional Environment to Learn Presentation Skills. Ph.D. Thesis, Ghent University, Ghent, Belgium, 2009. Available online: http://hdl.handle.net/1854/LU-7051516 (accessed on 7 March 2021).
- Van Ginkel, S.; Gulikers, J.; Biemans, H.; Mulder, M. Towards a set of design principles for developing oral presentation competence: A synthesis of research in higher education. Educ. Res. Rev. 2015, 14, 62–80. [Google Scholar] [CrossRef]
- McCroskey, J.C.; McCroskey, L.L. Self-report as an approach to measuring communication competence. Commun. Res. Rep. 1988, 5, 108–113. [Google Scholar] [CrossRef]
- Haber, R.J.; Lingard, L.A. Learning oral presentation skills. J. Gen. Intern. Med. 2001, 16, 308–314. [Google Scholar] [CrossRef] [PubMed]
- De Waard, A.; Pander Maat, H. Epistemic modality and knowledge attribution in scientific discourse: A taxono-my of types and overview of features. In Proceedings of the Workshop on Detecting Structure in Scholarly Discourse, Jeju Island, Korea, 12 July 2012; pp. 47–55. Available online: https://www.aclweb.org/anthology/W12-4306 (accessed on 1 April 2021).
- Florence, M.K.; Yore, L.D. Learning to write like a scientist: Coauthoring as an enculturation task. J. Res. Sci. Teach. 2004, 41, 637–668. [Google Scholar] [CrossRef]
- Treagust, D.F.; Harrison, A.G. The genesis of effective scientific explanations for the classroom. In Researching Teaching: Methodologies and Practices for Understanding Pedagogy; Loughran, J., Ed.; Routeledge: Abingdon, UK, 1999. [Google Scholar]
- Kulgemeyer, C. Impact of Secondary Students’ Content Knowledge on Their Communication Skills in Science. Int. J. Sci. Math. Educ. 2018, 16, 89–108. [Google Scholar] [CrossRef]
- Nathan, M.J.; Petrosino, A. Expert Blind Spot Among Preservice Teachers. Am. Educ. Res. J. 2003, 40, 905–928. [Google Scholar] [CrossRef]
- Wiemann, J.M. Explication and Test of a Model of Communicative Competence. Hum. Commun. Res. 1977, 3, 195–213. [Google Scholar] [CrossRef]
- Hafner, J.; Hafner, P. Quantitative analysis of the rubric as an assessment tool: An empirical study of student peer-group rating. Int. J. Sci. Educ. 2003, 25, 1509–1528. [Google Scholar] [CrossRef]
- Kerby, D.; Romine, J. Develop Oral Presentation Skills Through Accounting Curriculum Design and Course-Embedded Assessment. J. Educ. Bus. 2009, 85, 172–179. [Google Scholar] [CrossRef]
- Morreale, S.P.; Moore, M.; Surges-Tatum, D.; Webster, L. (Eds.) The Competent Speaker Speech Evaluation Form; National Communication Association: Washington, DC, USA, 2007. [Google Scholar]
- Crossman, J.M. Assessment of Oral Communication Competencies at Johnson & Wales University. A Pilot Program Assessing Culinary Arts and Pastry Arts Students. 1996. Available online: https://eric.ed.gov/?q=pastry&pg=3&id=ED393987 (accessed on 7 March 2021).
- Murdock, R.C. An Instrument for Assessing the Public Communication of Scientists. Ph.D. Thesis, Iowa State University, Ames, IA, USA, 2017. [Google Scholar]
- Dunbar, N.E.; Brooks, C.F.; Kubicka-Miller, T. Oral Communication Skills in Higher Education: Using a Performance-Based Evaluation Rubric to Assess Communication Skills. Innov. High. Educ. 2006, 31, 115–128. [Google Scholar] [CrossRef]
- De Grez, L.; Valcke, M.; Roozen, I. The impact of an innovative instructional intervention on the acquisition of oral presentation skills in higher education. Comput. Educ. 2009, 53, 112–120. [Google Scholar] [CrossRef]
- De Grez, L.; Valcke, M.; Roozen, I. The impact of goal orientation, self-reflection and personal characteristics on the acquisition of oral presentation skills. Eur. J. Psychol. Educ. 2009, 24, 293–306. [Google Scholar] [CrossRef]
- Creswell, J.W.; Creswell, J.D. Research Design: Qualitative, Quantitative, and Mixed Methods Approaches, 5th ed.; SAGE Publications, Inc.: Thousand Oaks, CA, USA, 2018; Available online: https://us.sagepub.com/en-us/nam/research-design/book255675 (accessed on 10 November 2020).
- Frey, B.B. The SAGE Encyclopedia of Educational Research, Measurement, and Evaluation; SAGE Publications, Inc.: Thousand Oaks, CA, USA, 2018; ISBN 978-1-5063-2615-3. [Google Scholar]
- Blair, E.; Blair, J. Applied Survey Sampling; SAGE Publications, Inc.: Thousand Oaks, CA, USA, 2014. [Google Scholar]
- Olsen, R.V.; Lie, S. Profiles of Students’ Interest in Science Issues around the World: Analysis of data from PISA 2006. Int. J. Sci. Educ. 2011, 33, 97–120. [Google Scholar] [CrossRef]
- Smith, E.V., Jr.; Wakely, M.B.; De Kruif, R.E.L.; Swartz, C.W. Optimizing Rating Scales for Self-Efficacy (and Other) Research. Educ. Psychol. Meas. 2003, 63, 369–391. [Google Scholar] [CrossRef]
- Toland, M.D.; Usher, E.L. Assessing mathematics self-efficacy: How many categories do we really need? J. Early Adolesc. 2016, 36, 932–960. [Google Scholar] [CrossRef]
- Demir, S. An Evaluation of Oral Language: The Relationship between Listening, Speaking and Self-efficacy. Univers. J. Educ. Res. 2017, 5, 1457–1467. [Google Scholar] [CrossRef][Green Version]
- Hasni, A.; Potvin, P. Student’s interest in science and technology and its relationships with teaching methods, family context and self-efficacy. Int. J. Environ. Sci. Educ. 2015, 10, 337–366. [Google Scholar] [CrossRef]
- Simpkins, S.D.; Davis-Kean, P.E.; Eccles, J.S. Math and science motivation: A longitudinal examination of the links between choices and beliefs. Dev. Psychol. 2006, 42, 70–83. [Google Scholar] [CrossRef]
- Van Aalderen-Smeets, S.; Van Der Molen, J.W. Measuring Primary Teachers’ Attitudes Toward Teaching Science: Development of the Dimensions of Attitude Toward Science (DAS) Instrument. Int. J. Sci. Educ. 2013, 35, 577–600. [Google Scholar] [CrossRef]
- Tabachnick, B.G.; Fidell, L.S. Using Multivariate Statistics, 7th ed.; Pearson: New York, NY, USA, 2019. [Google Scholar]
- Kline, R.B. Becoming a Behavioral Science Researcher: A Guide to Producing Research that Matters, 2nd ed.; Guildford Press: New York, NY, USA, 2019. [Google Scholar]
- Bentler, P.M. EQS Structural Equations Program Manual; Version 6; Multivariable Software, Inc.: Encino, CA, USA, 2006. [Google Scholar]
- Hu, L.T.; Bentler, P.M. Cutoff criteria for fit indexes in covariance structure analysis: Conventional criteria versus new alternatives. Struct. Equ. Model. Multidiscip. J. 1999, 6, 1–55. [Google Scholar] [CrossRef]
- Nunnally, J.C. Psychometric Theory; McGraw-Hill: New York, NY, USA, 1978. [Google Scholar]
- Field, A. Discovering Statistics Using SPSS: North American Edition, 5th ed.; SAGE Publications, Inc.: London, UK, 2017. [Google Scholar]
- Karsenti, T.; Savoie-Zajc, L. La Recherche en Éducation: Étapes et Approches, 4th ed.; Les Presses de l’Université de Mont-réal: Montréal, QC, Canada, 2018. [Google Scholar]
- Cavanagh, T.M.; Leeds, C.; Peters, J.M. Increasing Oral Communication Self-Efficacy Improves Oral Communication and General Academic Performance. Bus. Prof. Commun. Q. 2019, 82, 440–457. [Google Scholar] [CrossRef]
- Amini, A. A Correlation between Students’ Anxiety Levels and Oral Presentation Performance in EFL Speaking Class. J. Engl. Educ. Teach. 2019, 3, 403–412. [Google Scholar] [CrossRef]
- Habe, K.; Yassi, A.H.; Arafah, B.; Imran, N. Correlation between level of anxiety and public speaking perfor-mance through systematic learning approach in foreign language. Int. J. Sci. Res. 2016, 9, 1658–1663. [Google Scholar]
- Blanchet, P.-A.; Lison, C.; Lépine, M. L’enseignement de la compétence orale dans les cours de français du col-légial: Quels choix de contenus? In L’oral et Son Enseignement: Pluralité des Contextes Linguistiques; Dumais, C., Bergeron, R., Lavoie, C., Eds.; Éditions Peisaj: Montréal, QC, Canada, 2017; pp. 103–125. [Google Scholar]
- Dumais, C. Communiquer oralement: Une compétence à développer au collegial. Pédagogie Collégiale 2017, 31, 13–19. [Google Scholar]
- Sénéchal, K.; Chartrand, S.-G. Représentations et pratiques de l’enseignement de l’oral en classe de français: Changements et constantes depuis 25 ans. In Représentations, Analyses et Descriptions du Français Oral, de Son Utilisation et de Son Enseignement au Primaire, au Secondaire et à L’université; Bergeron, R., Plessis-Bélair, G., Eds.; Éditions Peisaj: Montréal, QC, Canada, 2012; pp. 185–199. [Google Scholar]
- Kelsen, B.A.; Liang, H.-Y. Role of the Big Five Personality Traits and Motivation in Predicting Performance in Collaborative Presentations. Psychol. Rep. 2019, 122, 1907–1924. [Google Scholar] [CrossRef] [PubMed]
- Ryan, R.M.; Deci, E.L. Intrinsic and extrinsic motivations: Classic definitions and new directions. Contemp. Educ. Psychol. 2000, 25, 54–67. [Google Scholar] [CrossRef] [PubMed]
- Vermote, B.; Aelterman, N.; Beyers, W.; Aper, L.; Buysschaert, F.; Vansteenkiste, M. The role of teachers’ motivation and mindsets in predicting a (de)motivating teaching style in higher education: A circumplex approach. Motiv. Emot. 2020, 44, 270–294. [Google Scholar] [CrossRef]
- Moè, A.; Katz, I. Emotion regulation and need satisfaction shape a motivating teaching style. Teach. Teach. 2021, 27, 370–387. [Google Scholar] [CrossRef]
- Dumais, C. Atelier pour un enseignement de l’oral. Québec Français 2010, 157, 58–59. [Google Scholar]
- Wilkinson, I.A.G.; Staley, B. On the pitfalls and promises of using mixed methods in literacy research: Perceptions of reviewers. Res. Pap. Educ. 2019, 34, 1–23. [Google Scholar] [CrossRef]
Publisher’s Note: MDPI stays neutral with regard to jurisdictional claims in published maps and institutional affiliations. |
© 2022 by the authors. Licensee MDPI, Basel, Switzerland. This article is an open access article distributed under the terms and conditions of the Creative Commons Attribution (CC BY) license (https://creativecommons.org/licenses/by/4.0/).