Article

Comparison of In-Person and Virtual Labs/Tutorials for Engineering Students Using Blended Learning Principles

Wolfson School of Mechanical, Electrical and Manufacturing Engineering, Loughborough University, Loughborough LE11 3TU, UK
*
Author to whom correspondence should be addressed.
Educ. Sci. 2022, 12(3), 153; https://doi.org/10.3390/educsci12030153
Submission received: 31 January 2022 / Revised: 15 February 2022 / Accepted: 20 February 2022 / Published: 23 February 2022

Abstract

:
The paper compares the effectiveness of in-person and virtual engineering laboratory sessions. The in-person and virtual laboratory sessions reported here comprise six experiments combined with short tutorials. The virtual lab combined enquiry-based learning and gamification principles. The integration of the virtual labs with in-person teaching created a blended learning environment. The effectiveness of this approach was assessed based on (i) the student feedback (i.e., a questionnaire with open-ended questions and Likert scale feedback), (ii) the students’ engagement with the virtual lab, and (iii) the impact on the academic performance (i.e., class test results). The students reported greater confidence in the understanding of theory in the virtual lab than the in-person lab. This is interesting given that the instruction for the virtual lab and the in-person lab of one experiment is identical (i.e., same instructor, same enquiry-based learning techniques, and same explanations). The students also appreciated the ability to complete the virtual lab anytime, anywhere, for as long as they needed, and highlighted the benefits of the interactivity. The median class test scores of the students who completed some or all the virtual lab experiments was higher than those who did not (83–89% vs. 67%).

1. Introduction

The requirement for online learning during the pandemic [1,2] offered valuable opportunities to create and test virtual versions of in-person labs as well as to combine online and in-person laboratories in a blended learning environments. Students receive face-to-face instructions as well as complete activities at home using various technological resources in a blended learning environment [3].
A specific form of blended learning is the flipped classroom methodology [4]. It is an active learning methodology [5] and is regarded as one of the most innovative pedagogical approaches [6]. In a traditional classroom, students learn the content in the lecture and practise on their own at home through homework [6]. The learning activities are rearranged in a flipped classroom setting [4]: the students learn at home using virtual resources, such as videos or texts, before attending the lecture. By doing so, the students are better prepared for the face-to-face session to practise and apply what they have learned beforehand [7]. The interest in flipped classrooms is on the rise [8] due to the increasing availability of emerging technologies [4] such as Web 2.0 tools for use as personal learning environments [9]. This allows students to learn ‘just-in-time’ and provides them with ‘at-your-fingertips’ learning opportunities [9]. By personalising the learning process and changing it into a learner-driven rather than a tutor-driven approach, the students are empowered to control their own educational process [4] and adapt their own learning environment to their personal preference [9].
Another promising learning technique is gamification [10,11]. The aim of gamification is to increase the student’s motivation, engagement and productivity [12]. Gamification usually does not require actual games to be included into the learning environment. The focus should rather be on integrating game design elements into the learning environment [12] in order to transmit similar experiences [11]. Gamification can be used to increase the learning performance, commitment, and satisfaction of the students, which are important elements in educational environments [13].
The contribution of this paper is an evaluation of a virtual lab for first-year mechanical engineering students. The virtual lab was integrated into the module as a flipped classroom lab (i.e., integrated with the in-person lab) and as a remote lab (i.e., to replace the in-person lab) depending on the student’s circumstances. It included gamification elements to increase student motivation, comprehension, and engagement with the lab.
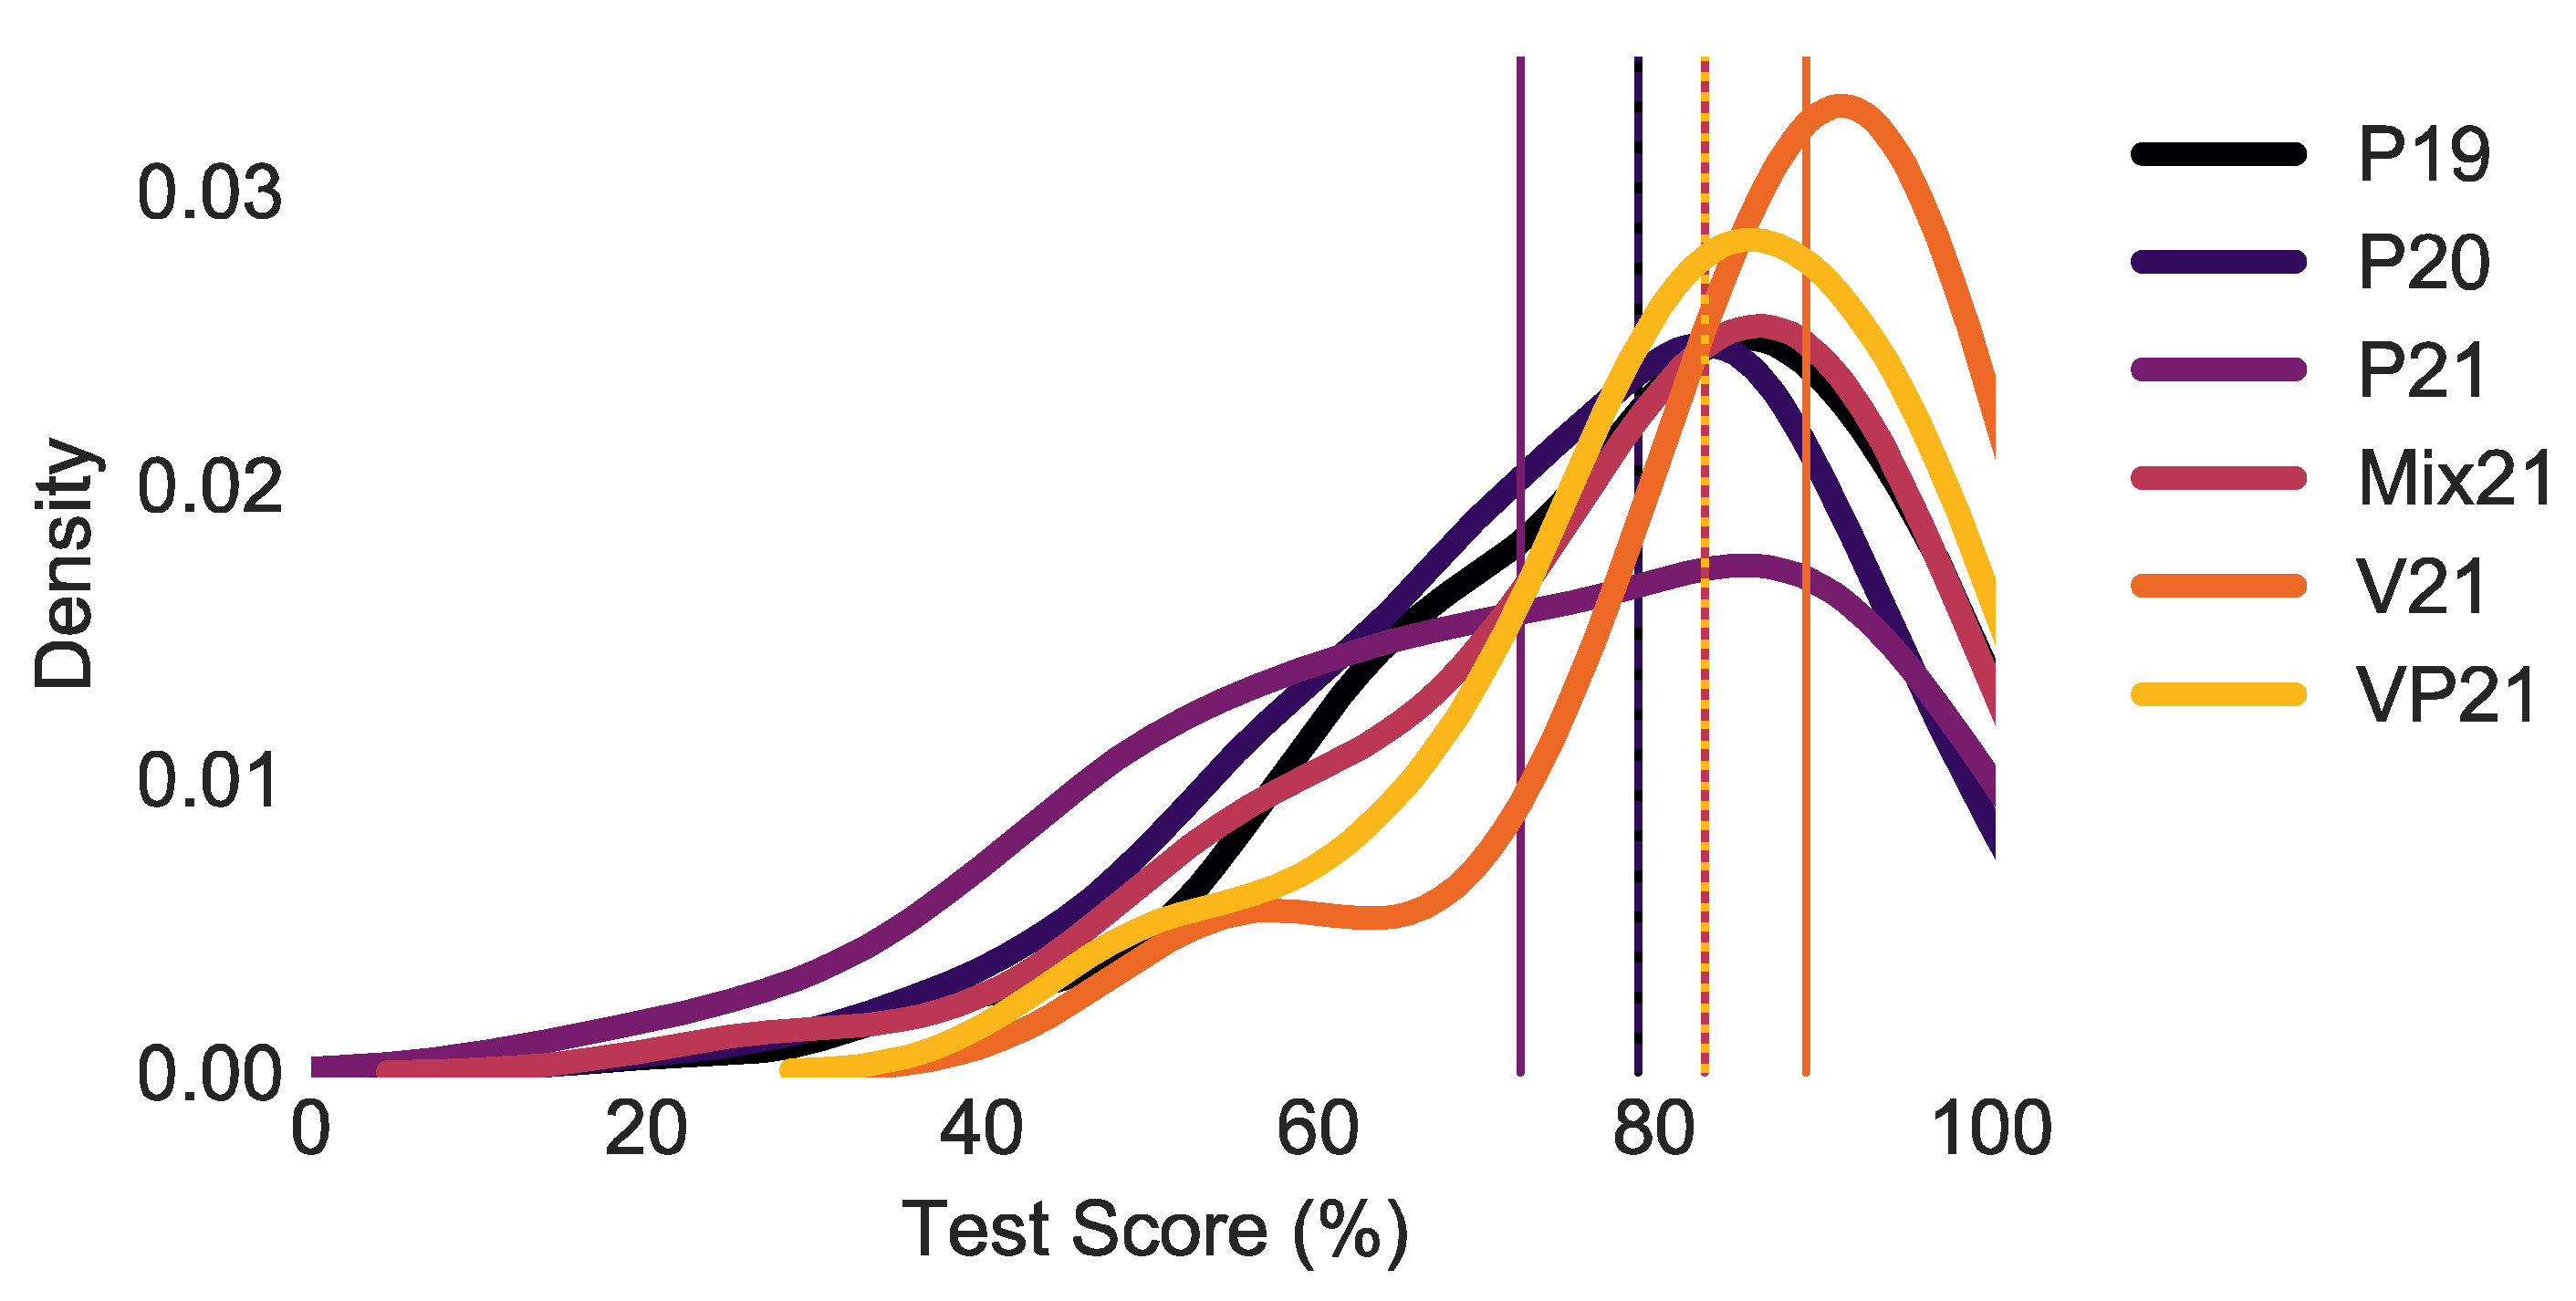
At first, the students’ engagement with the virtual lab was analysed using the data gathered by the online platform of the virtual lab. Then, the feedback from the students about the virtual lab was evaluated. Finally, the exam scores of the students completing only the virtual lab experiments (V21), only the in-person lab experiments (P21), a mixture of both in-person lab and virtual lab experiments (Mix21), and both virtual and in-person versions of all the experiments (VP21) were assessed and compared along with student scores in the previous two years (P19, P20).
This paper builds on a shorter survey about the same virtual lab with fewer participants published in [14]. Due to the overwhelmingly positive feedback from the first short survey, we created a more in-depth survey to gain valuable insights into the students’ opinion. By doing so, we not only evaluated the opinion of the students about the virtual lab but also their measurable performance.

2. Literature Review

2.1. Flipped Classroom

Most of the research studies on flipped classroom principles focused on higher education [13]. Akçayır et al. [13] conducted a systematic literature review of 71 studies about flipped classrooms. They concluded that 52.1% of all studies reported improvement in student performance based on their GPAs, standardized test scores, and course grades. 18.3% and 14.0% of the studies reviewed in [13] reported increases in student satisfaction and level of engagement, respectively. Additionally, Akçayır et al. [13] listed the following as common benefits of flipped classrooms: motivation (9.9% of the studies), increased knowledge (9.9%), improved critical thinking skills (8.5%), and confidence (7.0%). A plausible reason for this could be the greater interaction in the face-to-face learning part of the flipped classroom methodology and the increased responsibility of the students to complete the preparatory work for the face-to-face learning part [3]. The most commonly mentioned pedagogical contributions were enabling flexible learning (22.5% of the studies), individualized learning (11.3%), enhancing enjoyment (11.3%), better preparation before class (8.5%), fostering autonomy (8.5%), offering collaboration opportunities (5.6%), and more feedback (5.6%). The benefits of the increased focus on active learning in the face-to-face lectures is frequently mentioned in the literature [3]. Additionally, a flipped classroom allows for a more efficient class time (12.7%) and more time for practice (7.0%) [13].
On the other hand, some researchers concluded that creating videos for flipped classroom models might not be worth the effort [13]. They suggested focusing on selecting appropriate in-classroom activities instead [13]. In fact, 14.0% of the studies reviewed by Akçayır et al. [13] reported an increased time consumption due to flipped classroom, and higher workload (7.0% of the studies [13]), especially for creating quizzes for interactive learning [15]. Other researchers reported that flipped classroom could be a cost-effective option when the student numbers were increasing or funding for staff was reducing [3]. Limiting factors reported for flipped classroom were a lack of student preparation before class (12.7% of the studies), students needing guidelines at home (9.9%), and being unable to seek help while out-of-class (9.9%) [13]. A total of 11.3% and 9.9% of the studies reported that students found the flipped classroom too time consuming and that their workload increased, respectively [13]. A total of 8.5% of the studies reported that students did not prefer flipped classroom [13], possibly because they were used to passive learning from traditional lectures, which required less engagement and proactive effort from them [16]. A total of 5.6% of the studies reported that students had adoption problems and felt anxious about the flipped classroom [13]. The flipped classroom experience can also be negatively influenced by the video quality (12.7% of the studies), inequality of technology accessibility (8.5%), and the need for technology competency (7.0%) [13]. A potential way to overcome these problems could be providing support staff to help lecturers create pre-class activities [3]. Further, O’Flaherty [3] argues that students nowadays expect technology to be used in their learning environment.
According to Akçayır et al. [13], the most common out-of-class activities are videos (78.9%), reading (49.3%), and quizzes (42.3%). Özbay et al. [7] reported that most studies used online lectures (45.8%), online videos (37.5%), textbook (29.2%), online quizzes (20.8%), and power point lectures (20.8%). This is in line with O’Flaherty et al. [3], who found that most flipped classrooms used pre-recorded lectures, annotated notes, automated tutoring systems, and interactive videos. According to O’Flaherty [3], most pre-class activities used in the studies they reviewed were taken from pre-existing resources, such as videos from the Khan Academy (https://www.khanacademy.org/, accessed on 29 January 2022). Most studies regarded quizzes as beneficial as they allowed measurement of student learning [13], provided a reason [17], and encouraged the students to complete the out-of-class activities [18].

2.2. Gamification

The research on gamification in education is continuously increasing since 2013 [12]. While gamification was first applied in the marketing and business sector [11], it is nowadays most commonly used in computing subject areas [12]. Gamification is most frequently used in universities and companies as an in-house training strategy [11]. Gamification is aimed at increasing the intrinsic motivation of students [19]. Based on the systematic literature review by Subhash et al. [12], most studies reported improved attitude, engagement, motivation, and student performance. The most frequently used game elements are badges, leader boards, levels, feedback, and points [12]. Alhammad et al. [11] provided a comprehensive overview of literature reviews on gamification.

2.3. Surveys

The most common method to evaluate flipped classrooms are surveys with Likert scales and open-ended questions [3]. Several studies such as [5,18,20] evaluated the effectiveness of the flipped classroom methodology based on, for example, surveys to measure student satisfaction and comparison of the exam results to measure the performance. According to Özbay et al. [7], the most common study form was a pre-test and post-test measurement of a single group (i.e., flipped classroom taught group) as well as pre-test and post-test measurements of two groups (i.e., traditionally taught group vs. flipped classroom taught group).

3. Methodology

3.1. Overview

The way students engage with laboratory sessions had to be adjusted in the academic year 2020–2021 due to the restriction of in-person teaching caused by the pandemic. Hence, it was necessary to create a virtual version of the in-person lab. The lab is part of the Statics & Dynamics module (first year, second semester) for mechanical engineering students at Loughborough University, UK. Between 150–170 students enrolled each year between 2019 and 2021.

3.2. Description of the Experiments

The lab includes the following six experiments:
Experiment 1: Epicyclic Gear Train
Experiment 2: Rolling Down an Inclined Plane
Experiment 3: Toppling vs. Sliding on Inclined Plane
Experiment 4: Three Bar Linkage–Crank Connecting Mechanism
Experiment 5: Four Bar Linkage
Experiment 6: Energy Methods
A detailed explanation of the labs can be found in [14].

3.3. Description of the In-Person Labs

Before the COVID-19 pandemic, 12 groups of around 3 students worked on the 6 experiments (two sets of equipment per experiment). The groups were facilitated by 3 instructors in addition to a supervisor in-charge of overseeing all of the lab operations. The Epicyclic Gear Train experiment (experiment 1) requires the most instructions due to the complexity of the gear changes. Hence, one instructor supervised both groups of students who worked on experiment 1. Another instructor supervised the four groups working on experiment 2 and 3. The third instructor supervised the remaining students. The student-to-instructor ratio was between 6 students (experiment 1) and 18 students (experiment 4–6) per instructor. The students had 40 minutes to complete each experiment.

3.4. Description of the COVID-19 Compliant In-Person Labs

To reduce the risk of spreading COVID-19, a few changes had to be made to the lab. The students had to show the results of a recent COVID-19 test on their phone before they entered the lab and had to clean the equipment after they finished the experiment. We allowed the students to arrive and enter the labs during a specified timeframe to reduce queuing. We reduced the time per experiment from 40 min to 30 min to give the students sufficient opportunity to clean the experimental rig. The students worked alone and only rarely in pairs. To compensate for this, we increased the number of instructors to 4 instructors, plus a supervisor in charge of overseeing the lab operations (note: three of the instructors in 2021 were also instructors in 2020), therefore resulting in a student-instructor ratio of between two to a maximum of eight students per instructor (usually 2–4 students per instructor). The student-to-instructor ratio for the Epicyclic Gear Train experiment was 2 (maximum 4) students per instructor. Lower student-teacher ratios allowed the instructor to guide the students to the correct answer by applying inquisitive learning strategies. The instructor for the Epicyclic Gear Train experiment created the virtual labs. Hence, the instructor knew the questions used in the virtual lab to guide the students to the correct answer. Therefore, the students were guided to the correct answer in the virtual lab and in the in-person lab in the exact same way. This is not the case for all other experiments.

3.5. Description of the Virtual Experiments

The virtual lab was implemented on Loughborough University’s web-based virtual learning platform, LEARN. Hence, the students were familiar with the learning platform. Following the definition by Heradio et al. [21], the platform was classed as a remote access-simulated resource. Web-based applications have the advantage that they do not require a specific operating system and are therefore more portable as well as not requiring access to the user’s hard disk [21].
The goal was to create the virtual version of the in-person lab to be as interactive as possible but without developing any new software. The students collected data in the virtual lab as they would do in the in-person lab. For example, they measured the time required for a cylinder to roll down an inclined plane using a stopwatch in experiment 2, or measured angles using a real protractor in experiment 4 and 5. Using real/physical equipment during the virtual lab allowed students to experience the hands-on feeling similar to in-person experiments.
Multi-cam editing and slow-motion cameras were used to enable students to gain a better understanding of the mechanics of the experiment. For example, they saw the Energy Methods experiment (experiment 6) from three angles in slow motion to enable the students to see the relationship between the tension in the spring, the extension of the spring and the movement of the weights in the dynamic experiment. Slow-motion footage allowed the students to determine the exact video frame when the cylinder starts toppling. Hence, the measurement precision of the virtual experiments was usually more precise compared to the in-person experiments.
Active learning methodologies such as inquisitive learning and inquiry-based learning techniques have been used to guide students to the correct answer in the interactive tutorials instead of telling them the answer. Inquiry-based learning encourages students to discover information themselves instead of the teacher stating facts [22]. It is regarded as one of the most important teaching models and enhances the self-learning skills as well as the problem solving skills of the students [22,23]. These learning techniques have been used to guide students to the correct answer in the interactive tutorials as opposed to telling them the answer.
To create an interactive learning environment, a variety of interactive question types have been used instead of multiple-choice questions. For example, the students used building blocks to construct equations and to draw free body diagrams etc. The students also used physical measuring equipment (e.g., stopwatch, protractor) to measure the data in the experiments. This level of interactivity ensures that the students must at least try to complete the virtual experiment and try to work through the theory before receiving any feedback. The instructor can check how the students interact with the virtual lab through the web-based virtual learning platform. Hence, it is not enough for the student to simply log into the web based virtual learning platform and then just do other things. In order to obtain the points or progress through the virtual lab, they have to physically interact with the virtual lab.
It should be noted that the virtual labs were created by the instructor who supported the first experiment (i.e., Epicyclic Gear Train) in the in-person lab. Hence, both the virtual version and the in-person version of the Epicyclic Gear Train experiment use the exact same script of questions to guide the students to the correct answer. In fact, the scripts were so similar that the instructor did not need to finish a question before the student gave the correct answer as they recognised the question from the virtual lab. This has the advantage that the virtual version of the first experiment can be seen as an exact copy of the in-person lab. Differences in the results are therefore caused by the delivery mode (virtual vs. in-person) and not due to the explanation given.
The students spent as much time as they wished on the virtual lab, worked at any time, from anywhere, and repeated the lab as many times as they wish.
Sometimes it was easy to predict which mistakes the students would make, and therefore the students received feedback with hints to specific mistakes they made. The performance of the students in the virtual lab was also monitored to identify opportunities to improve the virtual lab for future cohorts. The possibility to monitor the students’ performance while doing their out-of-class work is a unique advantage of flipped classroom and blended learning [24].

3.6. Evaluation Methods for the Effectiveness of the Virtual Lab and the Blended Learning Experience

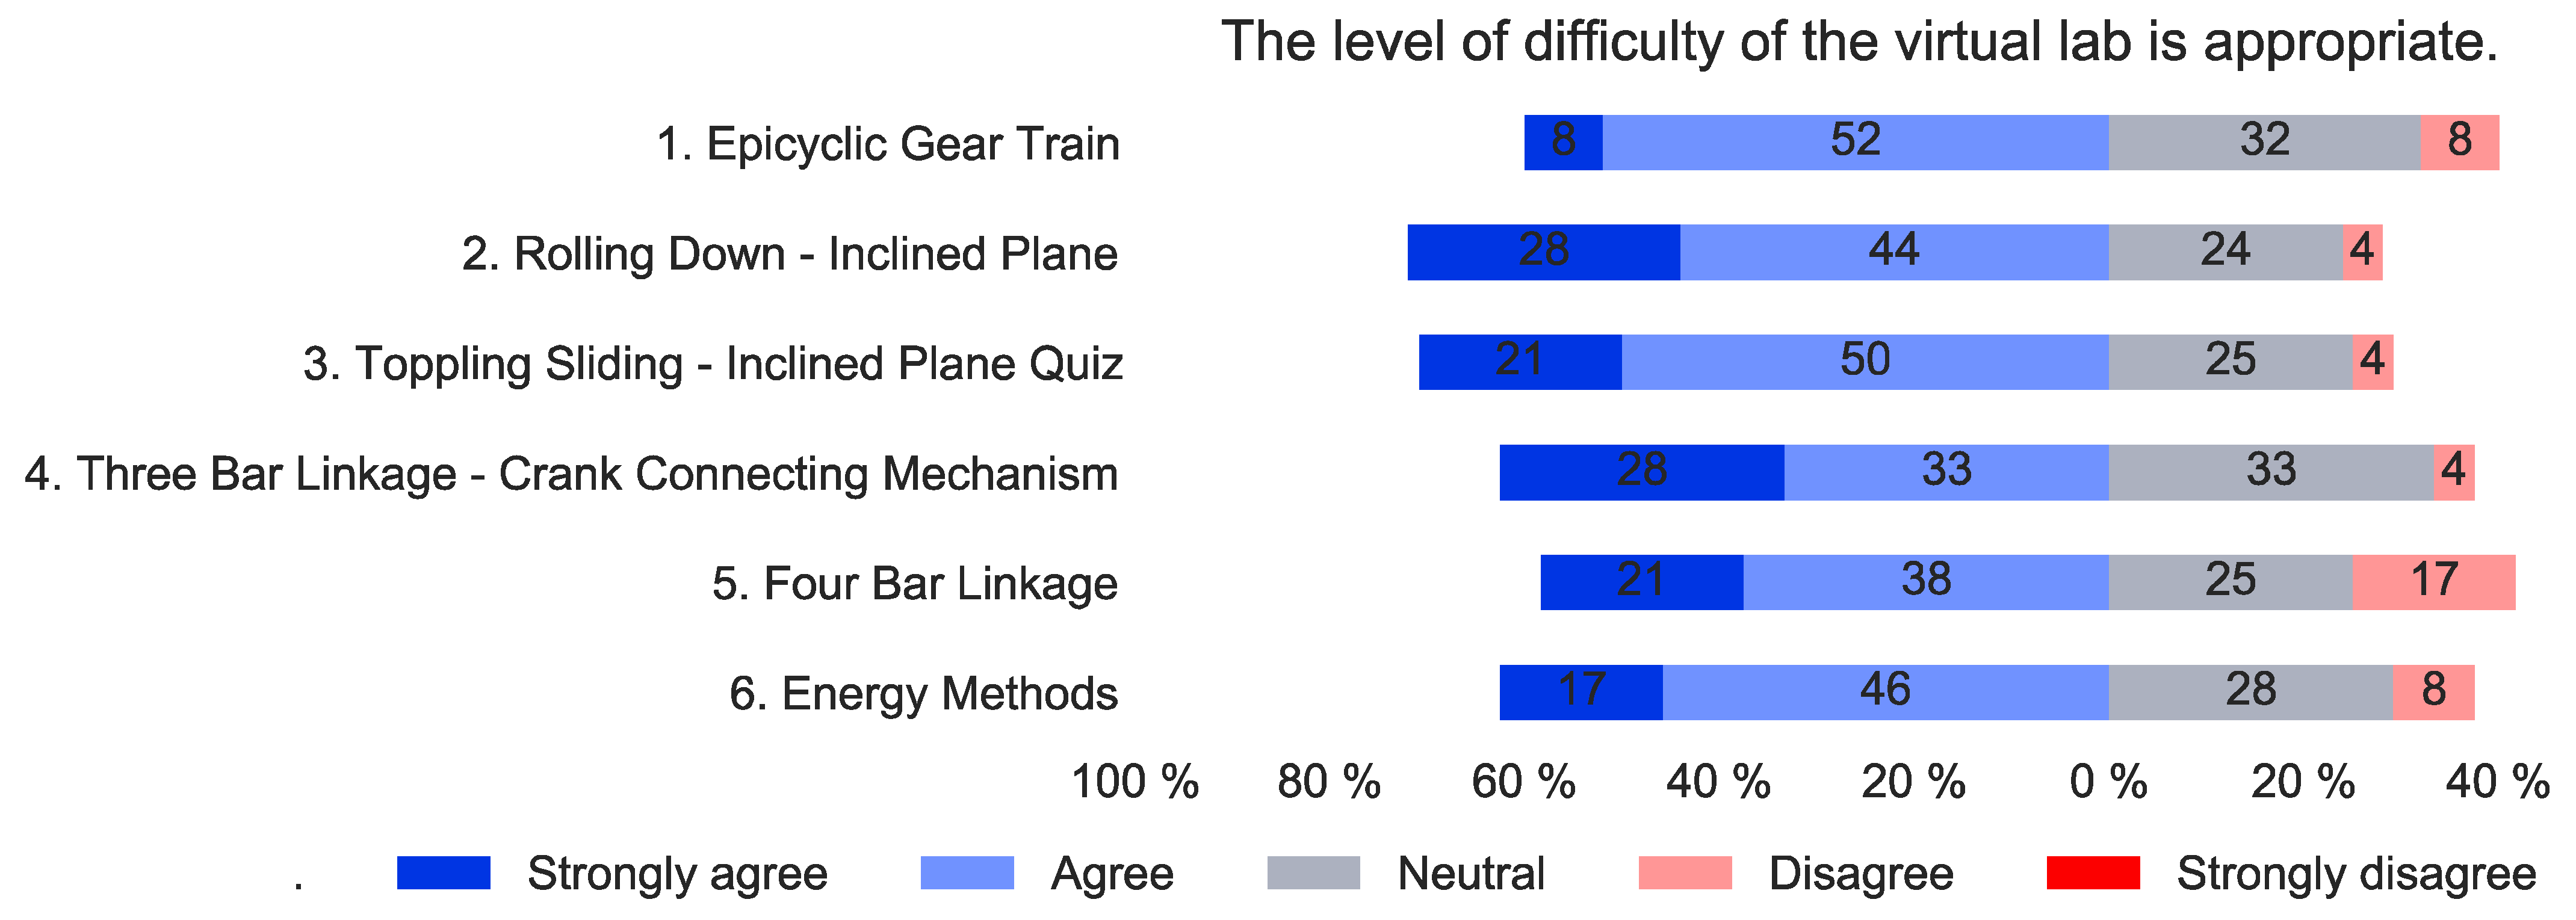
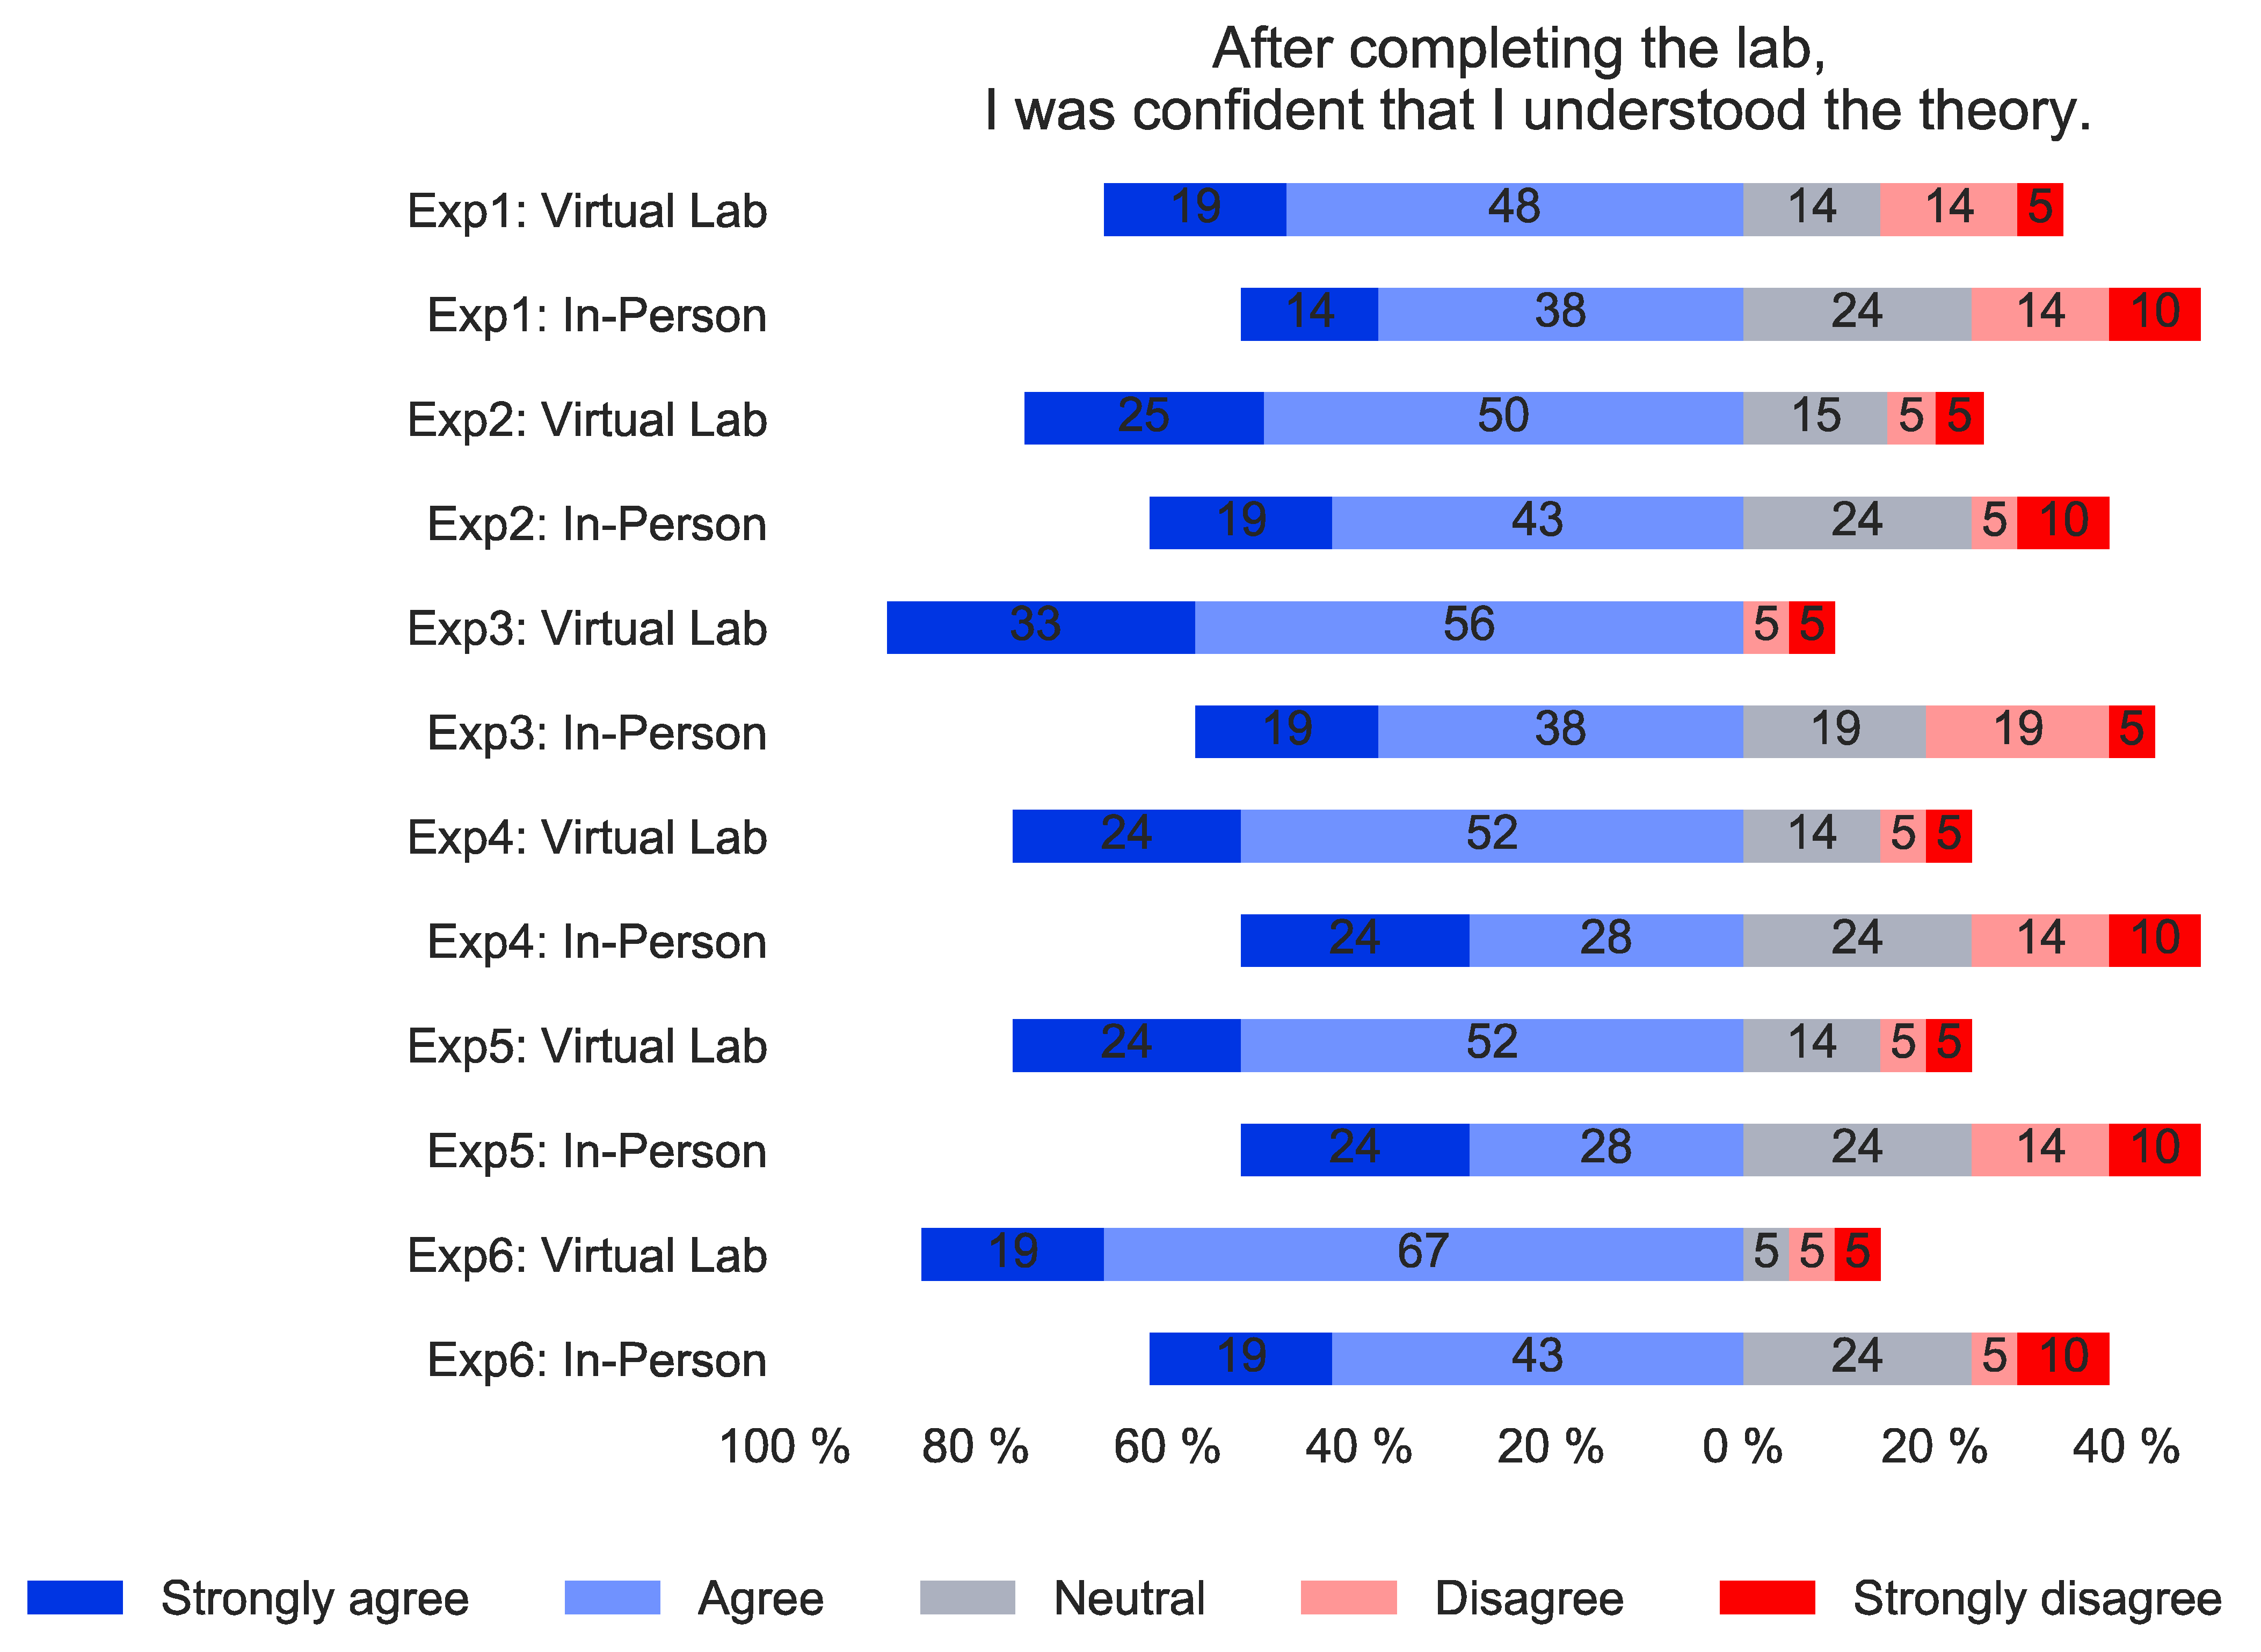
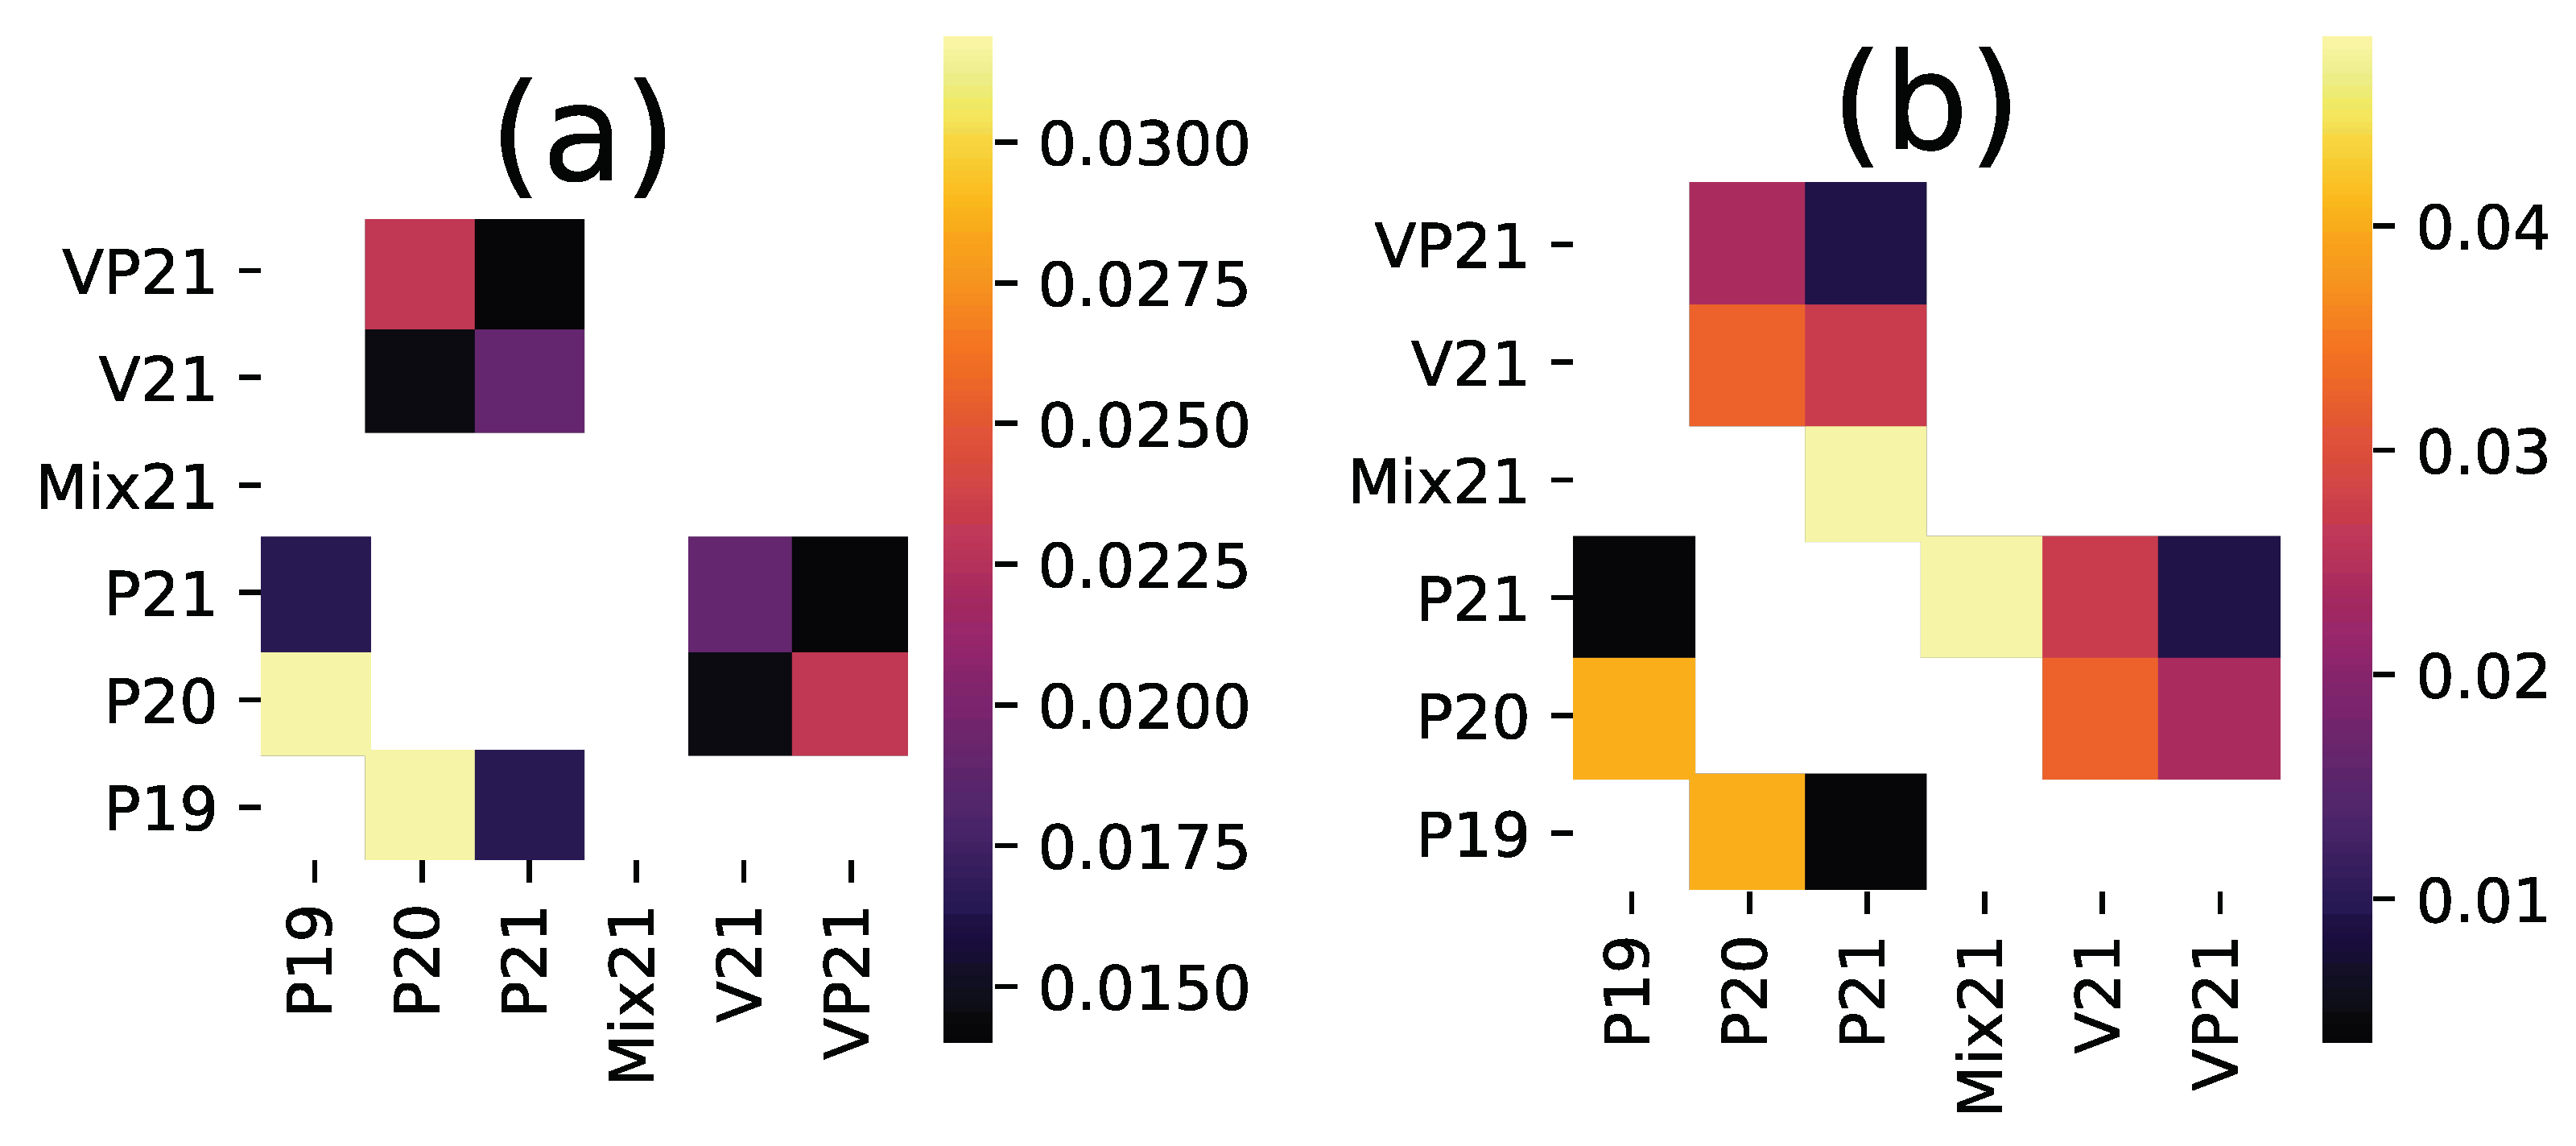
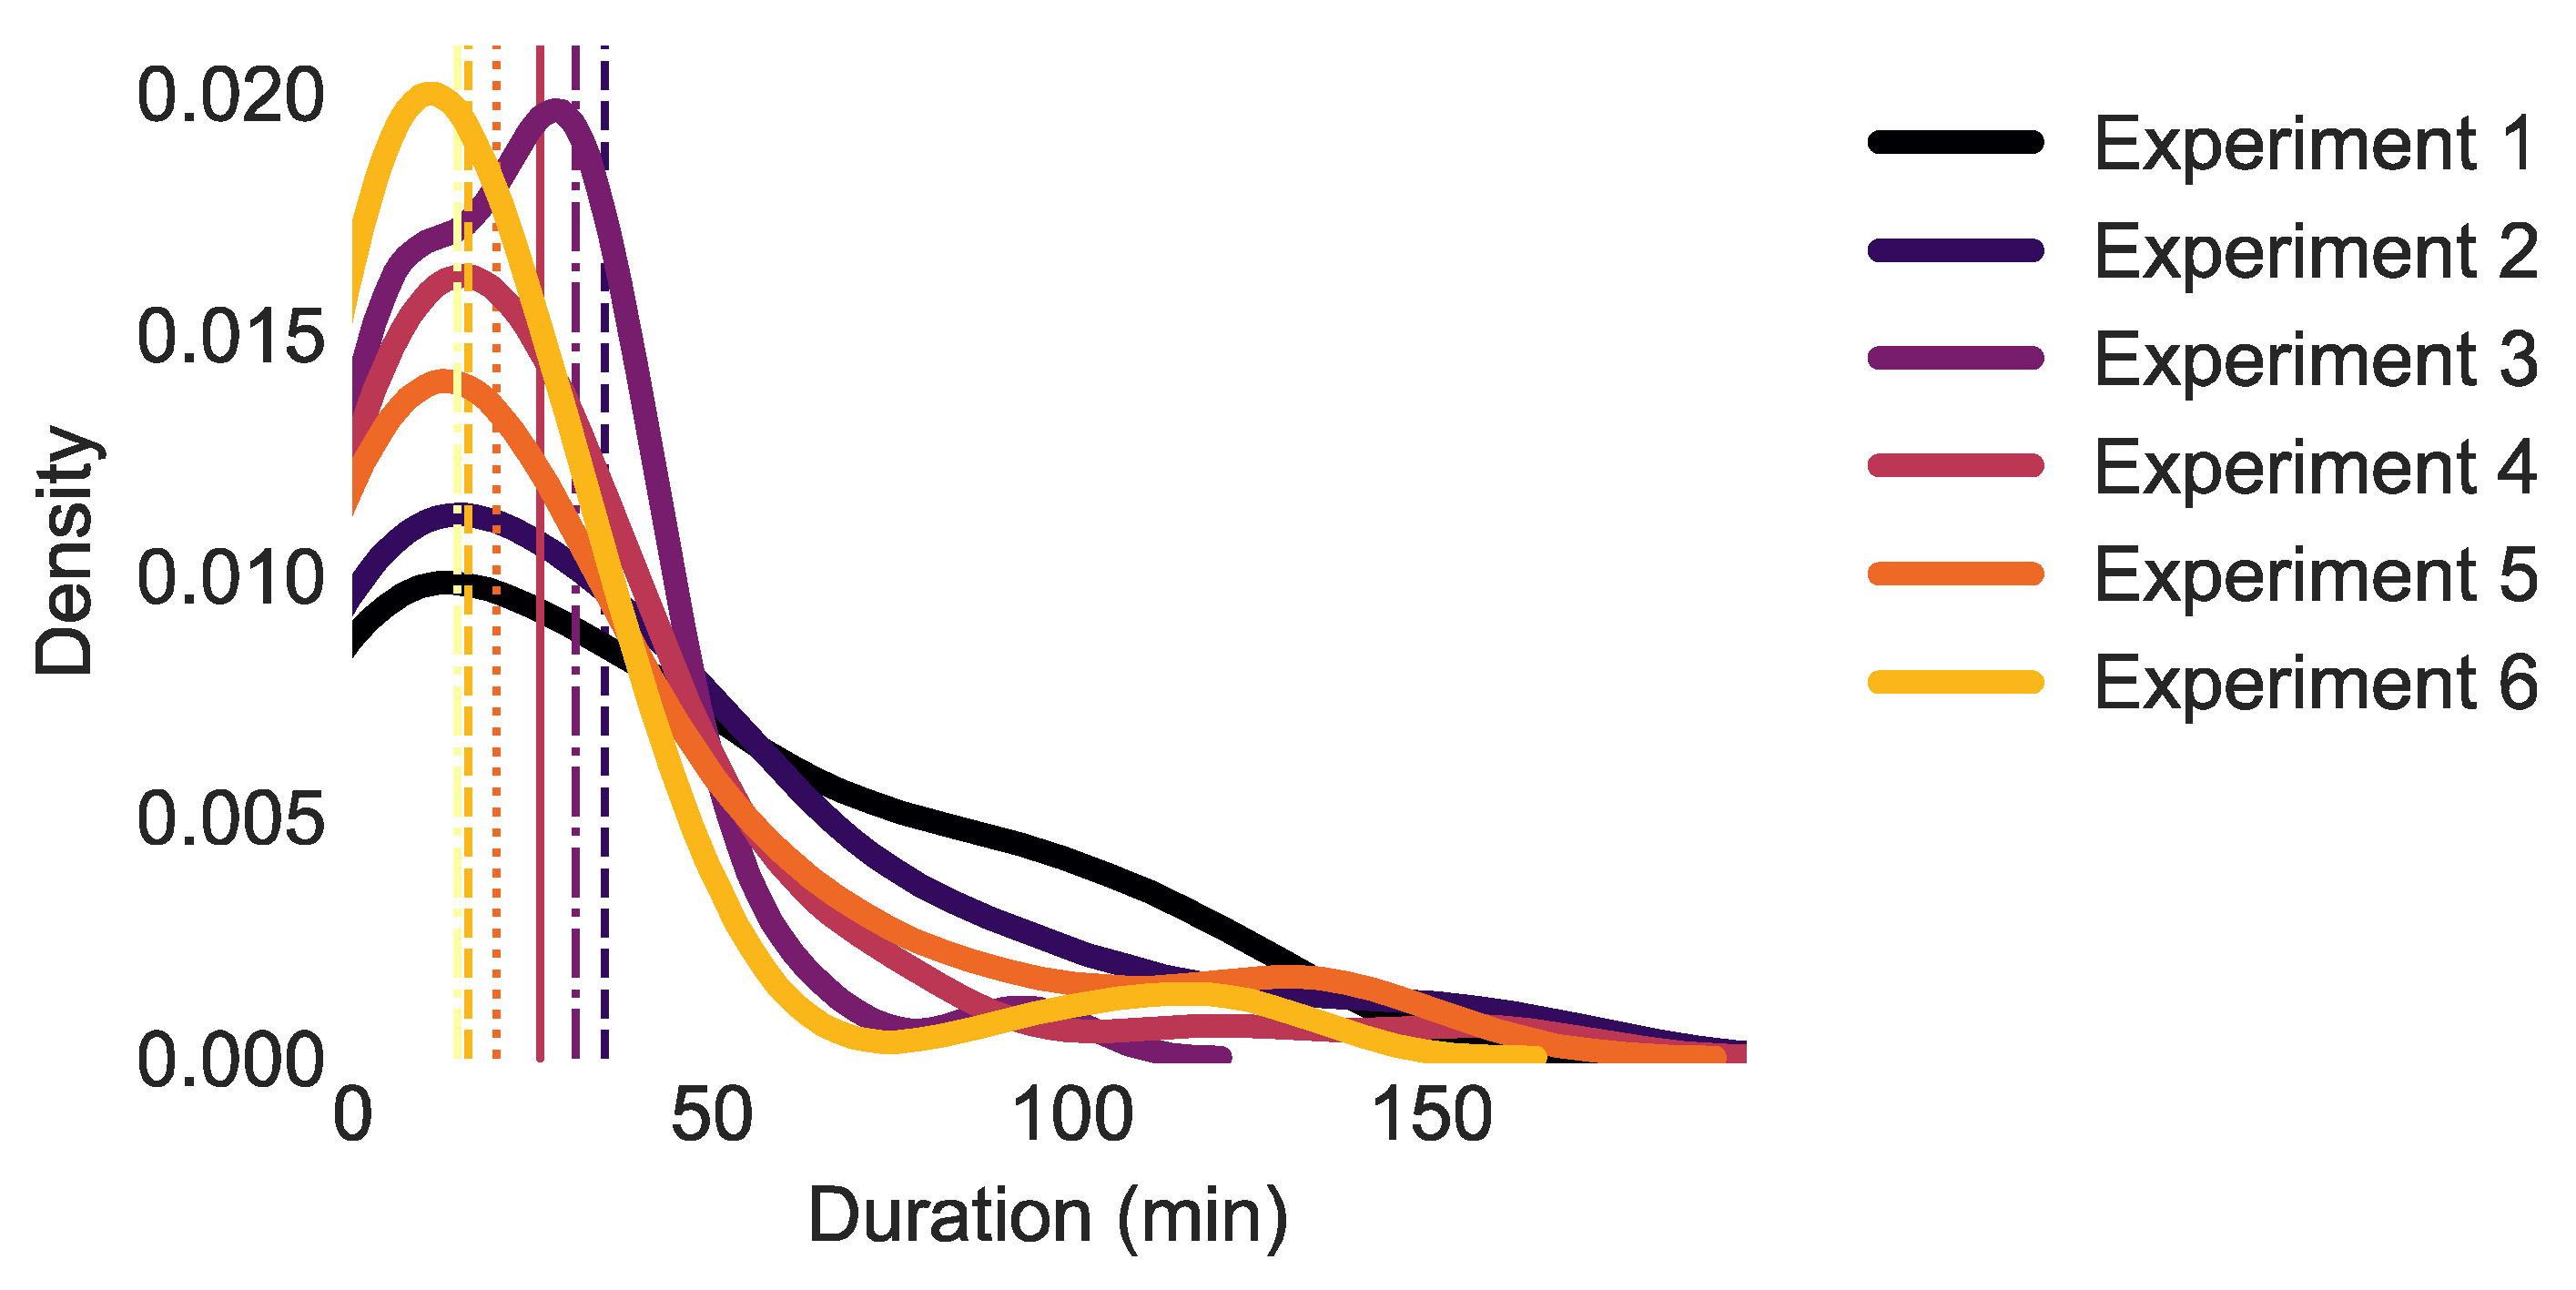
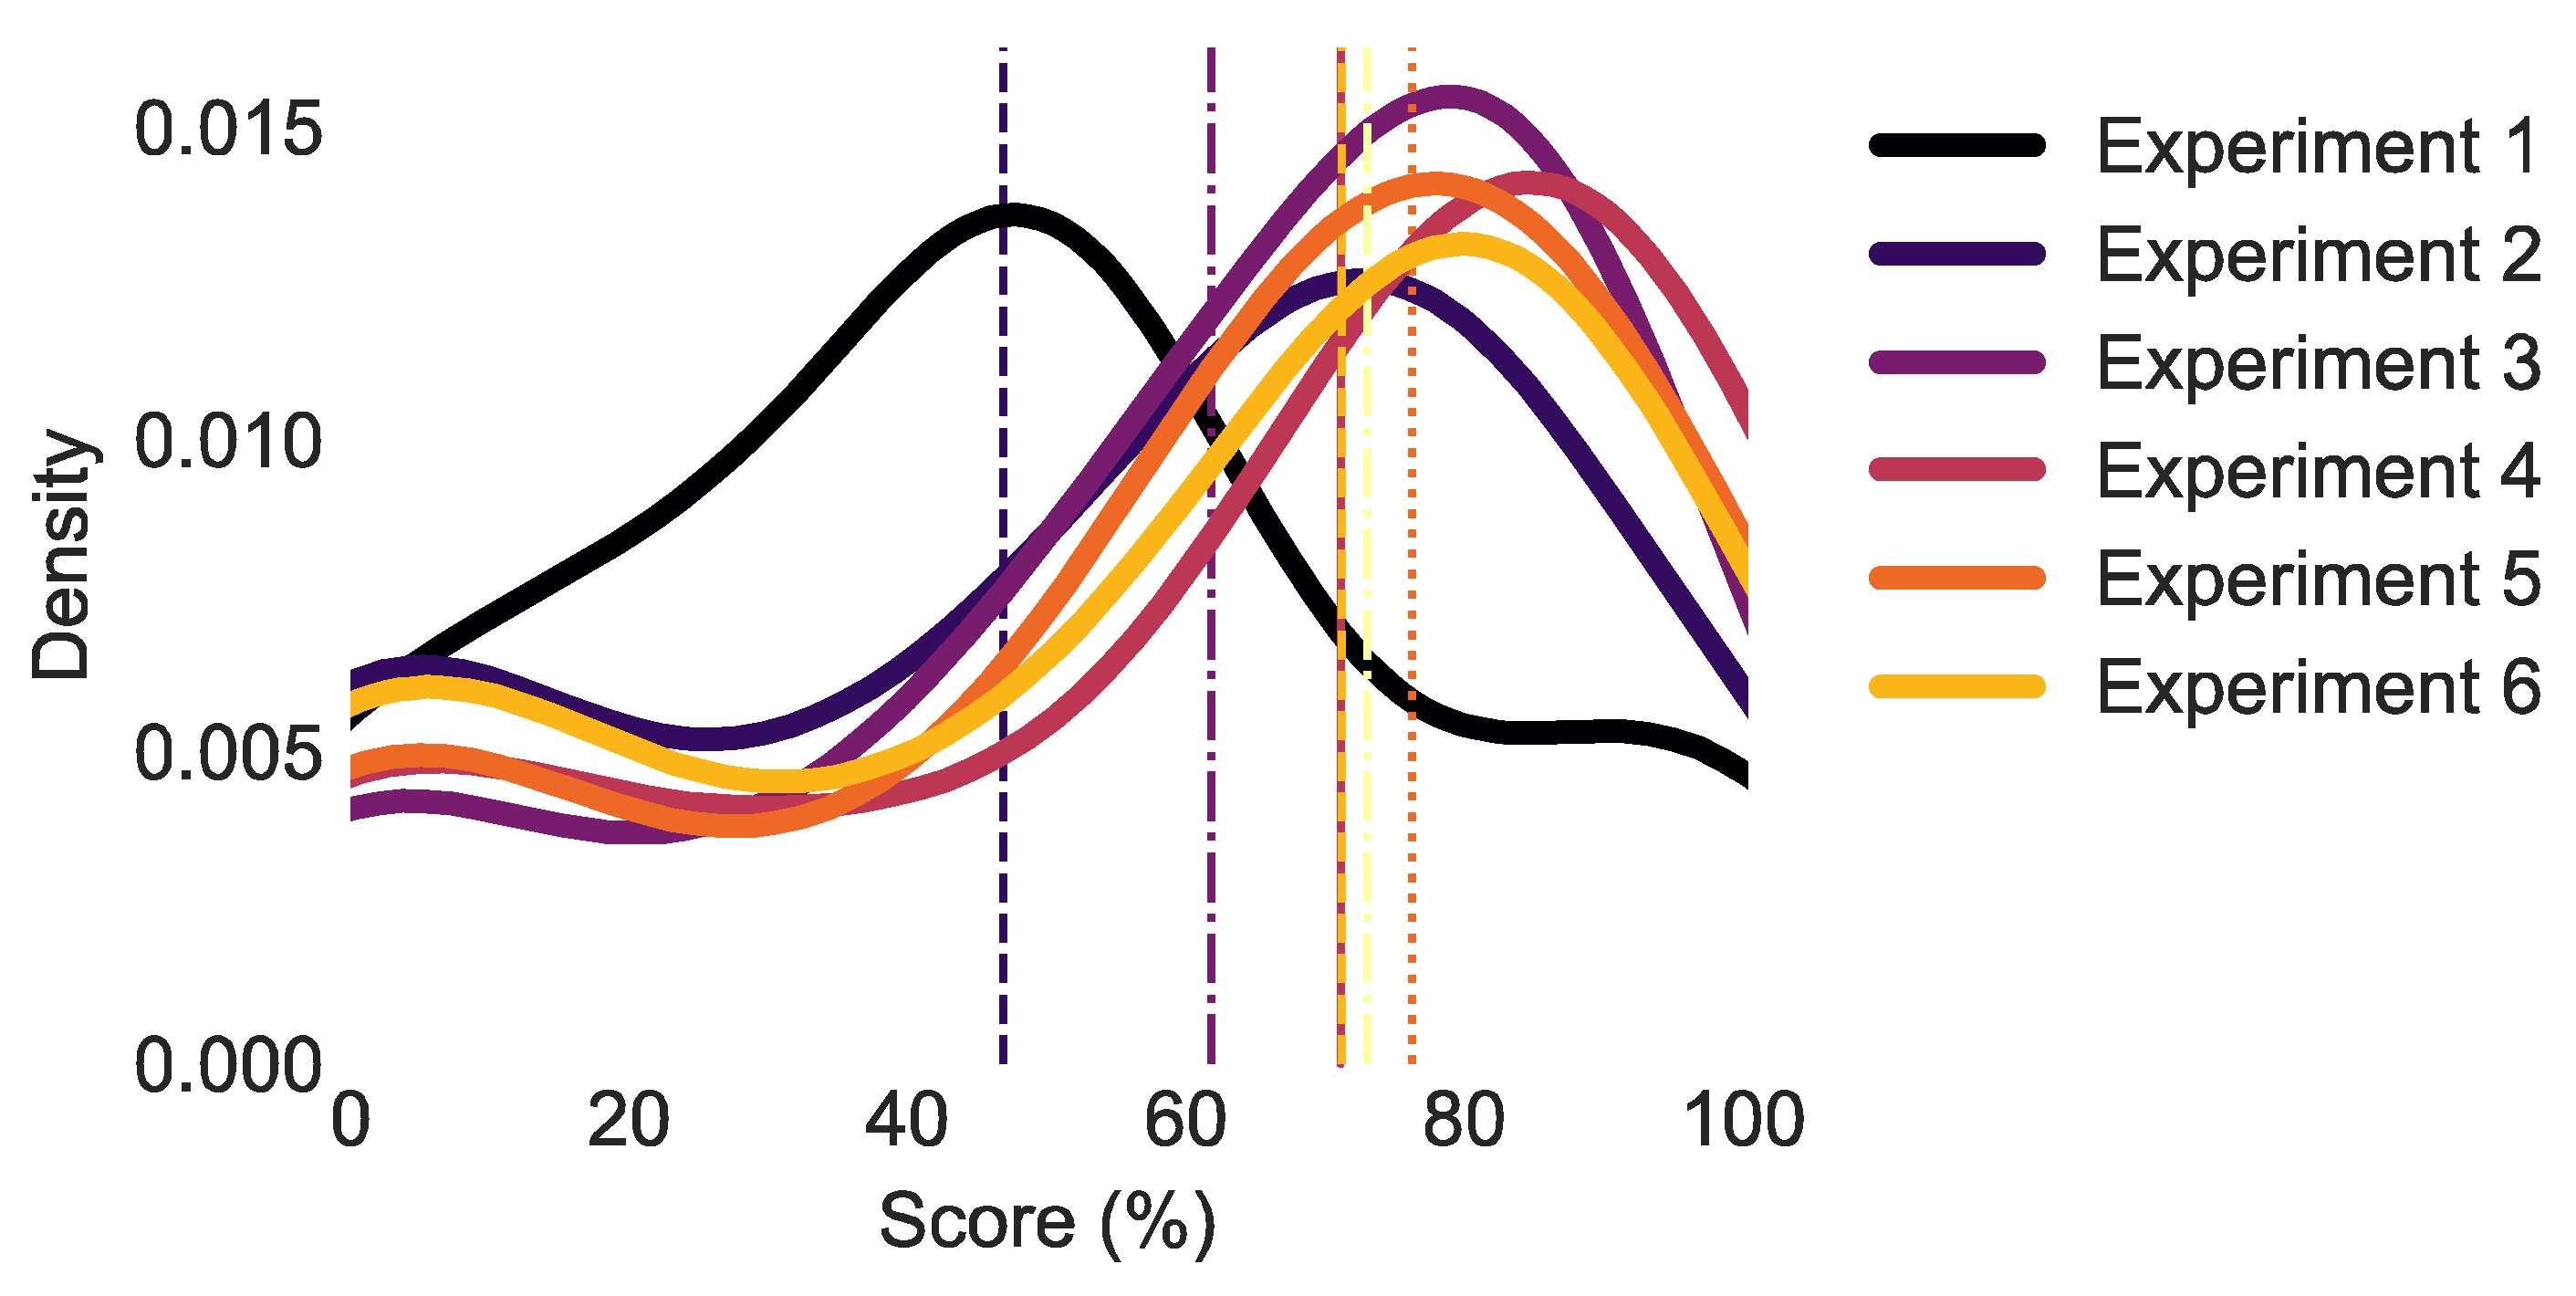
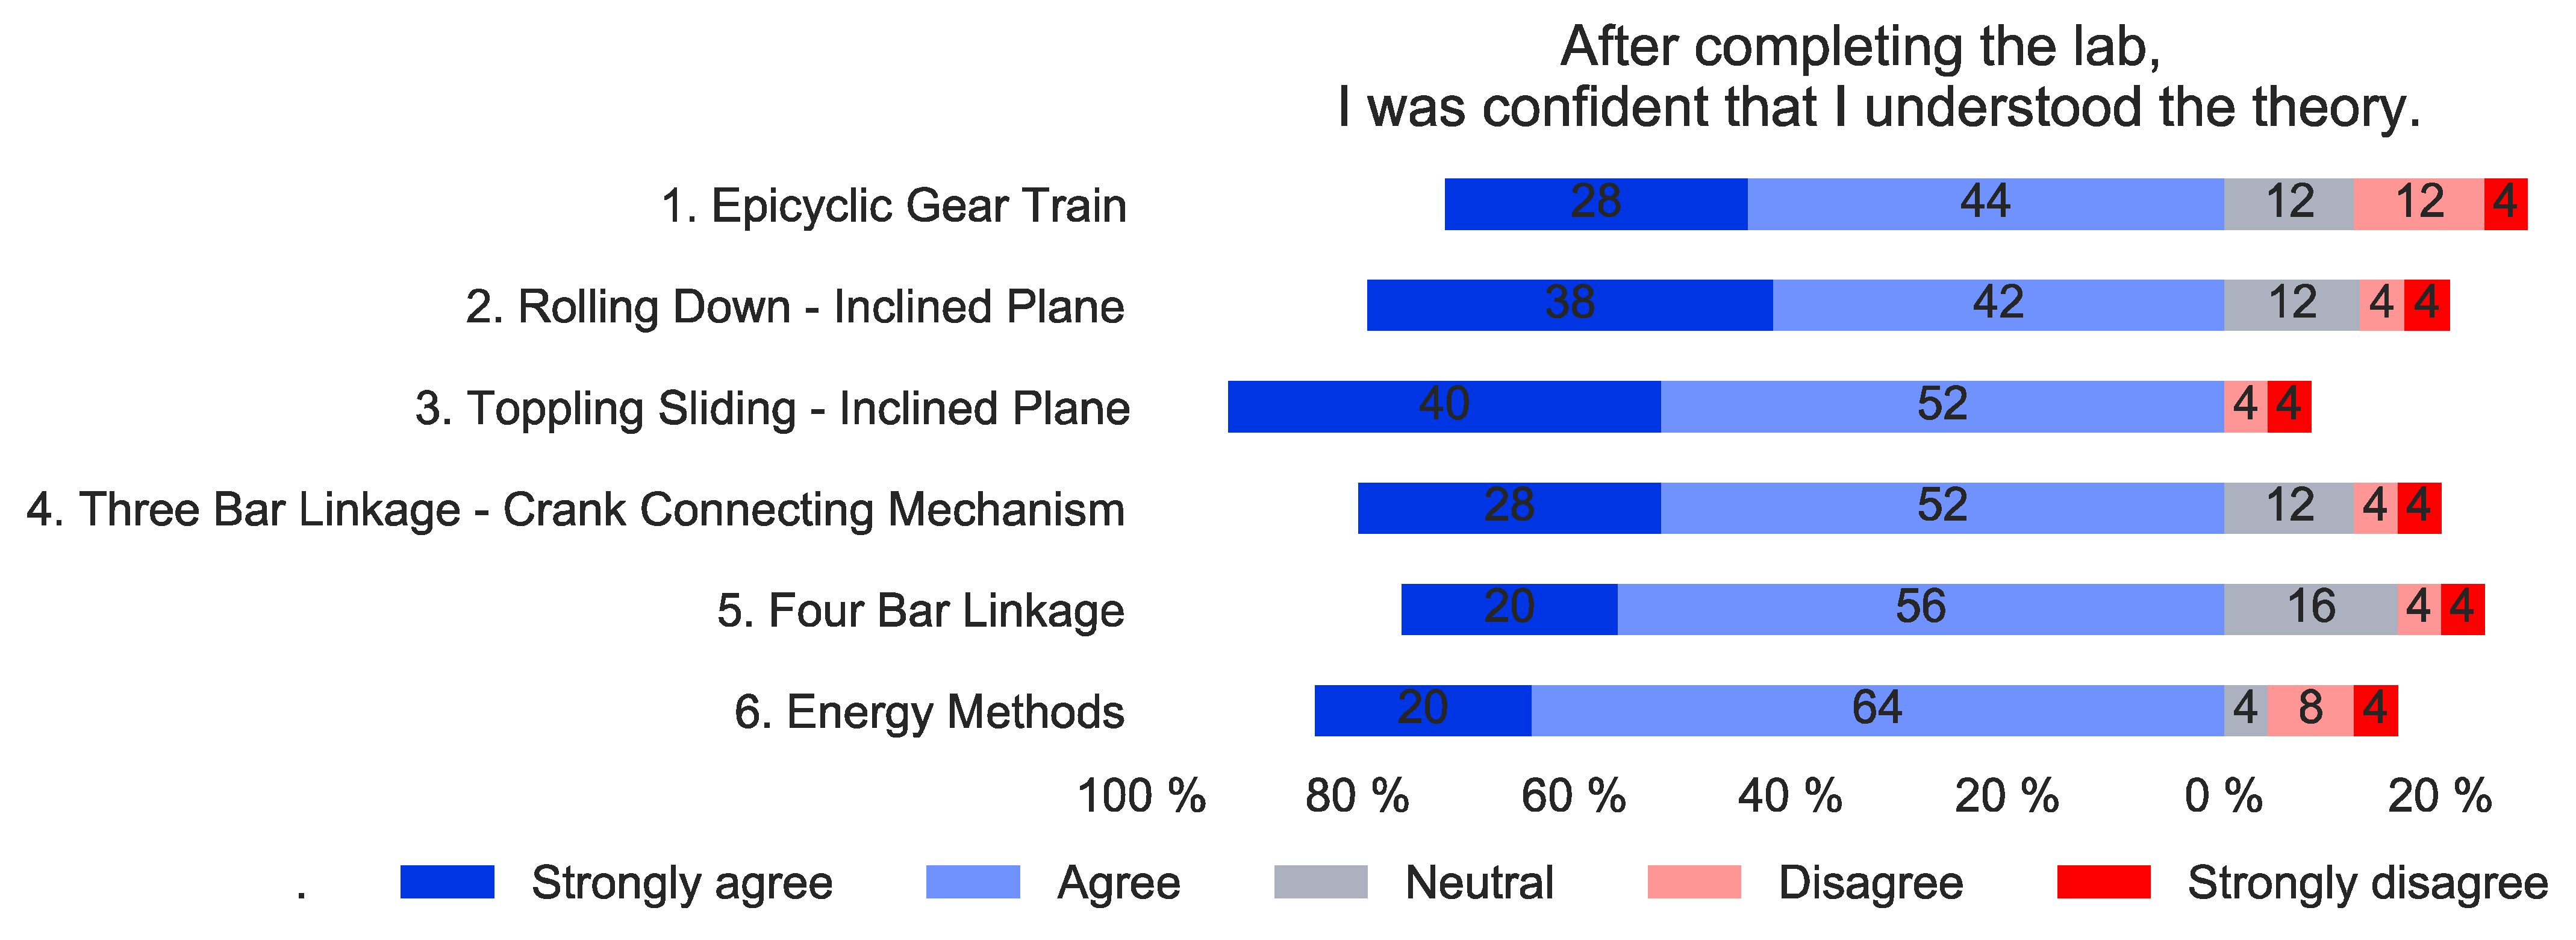
The effectiveness of the virtual lab and the blended learning experience has been evaluated based on three aspects: first, the engagement of the students with the virtual lab was analysed, as the virtual lab was not a mandatory part of the module and could be done either before, after, or in between the in-person lab sessions. Second, a post-course survey has been used to gain insight into the students’ satisfaction and recommendations. Third, the academic performance has been evaluated by comparing class test results of various groups of students based on a Kruskal–Wallis test.
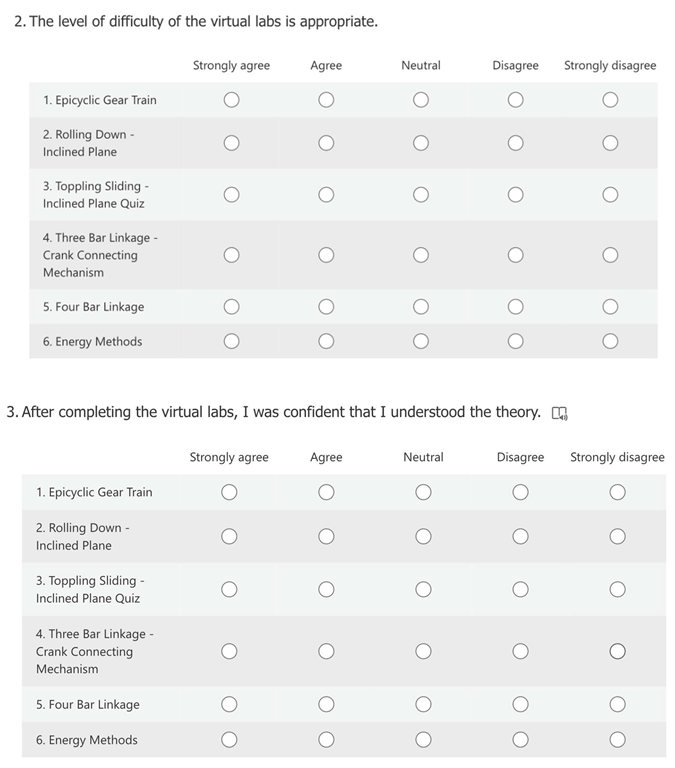
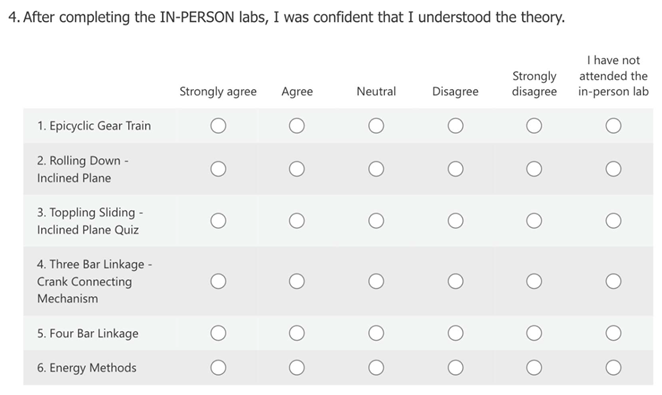
All students who completed all virtual labs regardless of whether they performed the in-person lab were asked to complete the survey (Appendix A). The survey included open ended questions and Likert scale feedback. The survey was approved by the Loughborough University Ethics Review Sub-Committee (2021-5123-3838). A total of 25 students completed the survey between 13 May 2021 and 4 June 2021.
In addition, at the end of the semester, all students took part in a class test, which was conducted online using LEARN which provided insights on the improvements in learning outcomes as a result of the virtual lab.

3.7. Description of the Study Groups

Three different year groups have been compared. The 2018/2019-year group attended the in-person lab as normal. While most of the students in the 2019/2020-year group attended the in-person labs as normal, some students could only attend three of the experiments in-person and watched videos of the other three experiments due to the COVID-19 lockdown. Note: these videos were not the same as the videos used in the virtual labs. We accommodated seven different groups of students the 2019/2020-year: (1) those who only performed the virtual labs as they could not return to campus, (2) those who only performed three of the experiments as virtual labs and the other three experiments as in-person labs, as they returned too late on campus to complete all labs in-person, (3) those who completed all six experiments virtually before the in-person labs, (4) those who completed the six experiments in-person before doing them virtually, (5) those who performed all labs in-person and completed the virtual labs in between the two in-person session, (6) those who completed all labs in-person and no virtual labs, and (7) those who have done neither the in-person lab nor the virtual lab.
We are comparing the following six groups:
P19: Completed the in-person labs in the year 2019.
P20: Almost all students completed the in-person labs in the year 2020 (only a few students were unable to attend the second half of the labs because of the COVID-19 lockdown).
The groups for the year in 2021 are combined as follows:
P21: Completed all COVID-19 approved in-person labs in the year 2021 but no virtual labs.
V21: Completed all virtual labs in the year 2021 but none of the in-person labs.
VP21: Completed all virtual labs and COVID-19 approved in-person labs in the year 2021.
Mix21: Worked on a mixture of virtual labs and COVID-19 approved in-person labs in the year 2021.

3.8. Limitations

The students were not allocated into specific groups and chose the group that fits best to their living situation (e.g., cannot return to campus). While this approach was appreciated by the students, the disadvantage is that this study is not a randomised control study. Hence, the results might be biased given that the students in group VP21 are probably the students who are rather keen and might therefore be better performing students. On the other hand, the effort students put in also varies in a properly randomised study and therefore might affect the results especially when the number of students is low. The authors refrain from conducting statistical test in most cases given that the number of students who took part in the survey was low.

4. Results

4.1. Engagement with Virtual Lab

Given that the virtual lab was not mandatory, each experiment had only been attempted or completed by 101 to 118 of the 166 students who signed up for the module.
Table 1 illustrates the students’ interaction with the virtual lab; 100% represents the total number of students who had at least attempted a virtual experiment. Around 50% of the students who attempted a specific experiment completed it at least once. Interestingly, the experiments have been completed multiple times by around 9% of the students. For example, they could have completed it as preparation for the in-person lab session and later as preparation for the class test.
A possible reason for one third of the students not attempting any virtual lab could be that the virtual lab was too time consuming (Figure 1). The median duration the students take to complete a virtual experiment are 35 min, 31 min, 26 min, 20 min, 16 min, and 14.5 min. While the number of questions/tasks varies between the virtual labs (i.e., 17, 10, 13, 9, 13, and 15), the main reason for the reduction in the duration is most likely the increasing familiarity with conducting experiments virtually.
Figure 2 shows the score of the students for each of six experiments in the virtual lab (i.e., the highest score achieved for students who attempted the lab multiple times). The scores (i.e., points for correctly answered questions divided by the maximum number of points) of the Epicyclic Gear Train (experiment 1) are the worst, which could be caused by the students not being familiar with doing a lab virtually, but also because it is the most difficult experiment. Apart from the first two experiments, the average score is always larger than 70%.

4.2. Student Feedback and Satisfaction

4.2.1. Self-Perceived Level of Difficulty of the Virtual Lab

A post-course survey was conducted with students who completed the virtual labs with 25 responses. The students were asked whether the level of difficulty of each experiment in the virtual labs was appropriate (Figure 3). Most students were happy with the level of difficulty of the virtual lab. Apart from the 5th experiment, only one or two students selected disagree and no student selected strongly disagree. Experiments 2 and 3 were the easiest, and experiment 5 was the most difficult. This is in-line with the results from an earlier, shorter survey published in [14]. While the tasks in experiments 4 and 5 were the same, the students used a Three Bar Linkage in experiment 4 and a Four Bar Linkage in experiment 5. With the only difference being that the students received fewer hints in experiment 5 compared to experiment 4. Hence, it is understandable that the students struggled more with experiment 5 compared to 4.

4.2.2. Confidence of Understanding the Theory of the In-Person and Virtual Lab

The students were asked whether they felt confident that they understood the theory after they completed either the in-person and virtual lab. Figure 4 only includes the students who completed all virtual and in-person labs. Figure 4 shows that more students understood the theory after doing the virtual lab than the in-person lab. Apart from the last two experiments (Exp5 and Exp6), the number of students who were confident that they understood the theory after doing the virtual lab was between 23 pp and 33 pp higher than the in-person lab. Between 81% and 90% of all students rated the virtual lab better or the same as the in-person lab. Apart from the first experiment (Exp1), between 38% and 48% rated the virtual lab better than the in-person lab. A possible reason for this is that Exp1 was the only experiment where active learning techniques were used in both the in-person and the virtual labs.
The authors refrain from conducting a statistical test to determine whether there is significance due to the low number of participants.
It was interesting to note that 24 pp more students agreed or strongly agreed that they understood the theory after doing the virtual lab compared to the in-person lab of the Epicyclic Gear Train (Exp 1) given that both were presented by the same instructor using the same script/questions. A possible explanation is that the practical part of this experiment takes at least 20 min, leaving only 10 min for the theory. Hence, the students might feel rushed to give an answer without having enough time to think properly. In contrast, the students spent significantly longer on the theory in the virtual lab. This might be caused by students being hesitant to guess answers in the virtual lab given that their answers will be recorded and visible to module tutors and module leaders. (Note: the virtual lab is voluntary and not graded). Due to this, the students spent more time thinking about an answer which could have a positive effect on their understanding. In the survey, 86% of students agreed or strongly agreed that the virtual lab gave them more time to understand the theory than the in-person lab and 33% of the students struggled to finish the in-person lab within the allowed time frame.
From the above observations, it can be reasonably concluded that the virtual lab was better in teaching the theory than an in-person lab. This implies that inquisitive learning techniques cannot only be used for in-person teaching but also be used successfully for interactive online tools, like the virtual lab.
In Figure 5, all 25 students were included (21 students who performed both the in-person and virtual labs and four students who only performed the virtual lab). Three of these four students always agreed or strongly agreed that they understood the theory of the virtual lab. If all 25 students are included, then 72–92% of the students agreed or strongly agreed that they understood the theory after doing the virtual lab.

4.2.3. General Questions and Satisfaction of the Students with the Virtual Lab

As can be seen in Figure 6, some students seem to struggle to finish the in-person lab in the allocated time (agree + strongly agree: 36%), and the majority of students agreed (59%) or strongly agreed (27%) that the virtual lab gave them more time to understand the theory.
While 64% of the students agreed that the theory is easier to understand in the virtual lab (18% disagreed), only 18% of the students agreed or strongly agreed that it was easier to perform the experiment online (56% disagreed or strongly disagreed). The majority of students seems to prefer to be taught the theory through the virtual lab but want to complete the experiment in-person. With only 9% of the students agreeing or strongly agreeing that the virtual lab should replace the in-person lab, it can clearly be seen that the students see the benefits of both and would not want to miss either. In fact, there was a clear consensus that both the virtual and the in-person lab should be offered (agree or strongly agree: 91%, nobody disagreed).
All students agreed (35%) or strongly agreed (61%) that the opportunity to complete the virtual lab at any time is beneficial.
Given that more students did not feel that the virtual lab was more engaging than the in-person lab, it seems that the virtual lab needs improvements. However, it is possible that the students were simply had enough of online learning, as only online learning was allowed for most parts of their first year and lectures were still online at the time of the lab. The students might have simply enjoyed mixing with their friends in person in the lab. (Note: Household mixing indoors was still illegal at the time of the lab and most students were not allowed to return to campus for the previous few months). Nevertheless, 83% agreed or strongly agreed that the virtual lab improved their learning experience and 43% of the students agreed or strongly agreed that they encouraged others to complete the virtual lab as well. This compares to only 13% of the students who disagreed with that statement. Additionally, 55% agreed or strongly agreed that they felt more motivated to complete the theory in the virtual lab than in the in-person lab. Only 32% disagreed or strongly disagreed with that statement.

4.2.4. Open-Ended Feedback Questions and Student’s Opinion

In the last part, of the survey, the students were asked to write down what they liked and did not like about the virtual lab.
A few major themes were prominently in the responses: (i) the ability to complete the lab on any day at anytime from anywhere, (ii) interactivity, and (iii) increased confidence and understanding. Seven students commented that they appreciated that they were able to complete the virtual lab at any time. One student stated for example: “Being able to access the material as a student who couldn’t return to Loughborough this term was very useful”. Several students mentioned that they appreciated the interactivity of the virtual lab. They benefitted from testing their understanding and receiving immediate feedback. The different question styles increased the engagement with the virtual lab. Three students mentioned that the virtual lab increased their confidence in the in-person lab. One student stated, e.g., “Every virtual lab increased my confidence and understanding of the experiment.” Seven students commented positively about the explanations, hints, and videos. One student stated, “In the planetary gear experiment the explanation was really easy to follow, and it gradually became less spoon-fed which was good for practice.” Another student stated, “the videos were helpful in explaining the theory and were concise too”. However, one student felt that the explanations were not detailed enough. We did not intend for the students to complete the virtual lab while they performed the in-person lab. However, one student completed the virtual lab while doing the in-person lab at the same time: “It followed the lab sheets with the same order so it was easy to complete both at the same time. There was an opportunity at every stage to check whether you’ve made a mistake.” This option of conducting the virtual labs and the in-person labs could be worth investigating further. Three students mentioned that it was difficult to motivate themselves to complete the labs and it is very time consuming: “I also found myself getting bored a little bit quicker than I might in the normal lab […]”. Only two students mentioned that they were missing the face-to-face interaction of the in-person lab.
Overall, the students seem to be happy with the virtual lab and it increased their confidence in understanding the in-person lab. Especially the interactivity and convenience improved their learning experience.

4.3. Student Performance: Test Results

After removing all students who scored 0 (i.e., did not take part in the in-class test), the number of students in each group were 152 (P19), 169 (P20), 67 (P21), 42 (Mix21), 9 (V21), and 27 (VP21). The median scores were identical in 2019 and 2020 (i.e., P19: 79%, P20: 79%). This result might seem unexpected. However, only the last in-person lab session had to be cancelled due to lockdown. Hence, only a small group of students were affected by this. Note: The class test was online in 2019, 2020 and 2021. A clear difference can be seen in the scores of the students in 2021 (Figure 7). The median score of the students who only attended the in-person lab (P21) is lower than all other groups (72%). This is most likely caused by the change to COVID-19 secure labs, which negatively affected the learning experience compared to the normal lab. The median score of the students who completed a mixture of virtual and in-person labs (Mix21) was 83%, who completed only virtual labs (V21) was 89% and those who completed both (VP21) was 83%.
A Kruskal–Wallis test and a t-test was conducted on two groups at a time to determine whether the scores are statistically different. Kruskal–Wallis test compares ranks and is a nonparametric test. This test is more suitable for this dataset due to the large variation of the number of students per group [25]. A significance level of p < 0.05 was chosen. As can be seen in Figure 8, there is no statistical significance between most groups.
The group P21 and P20 are different from the group V21 and VP21. The p-values range from p = 0.014, to p = 0.023. Hence, the students who completed all virtual labs performed better than the students who did not. Note, the groups P19 and P20 are significantly different in both tests even though the median is the same. This can be explained by the fact that the Kruskal–-Wallis test tests ranks and not the median.

5. Conclusions

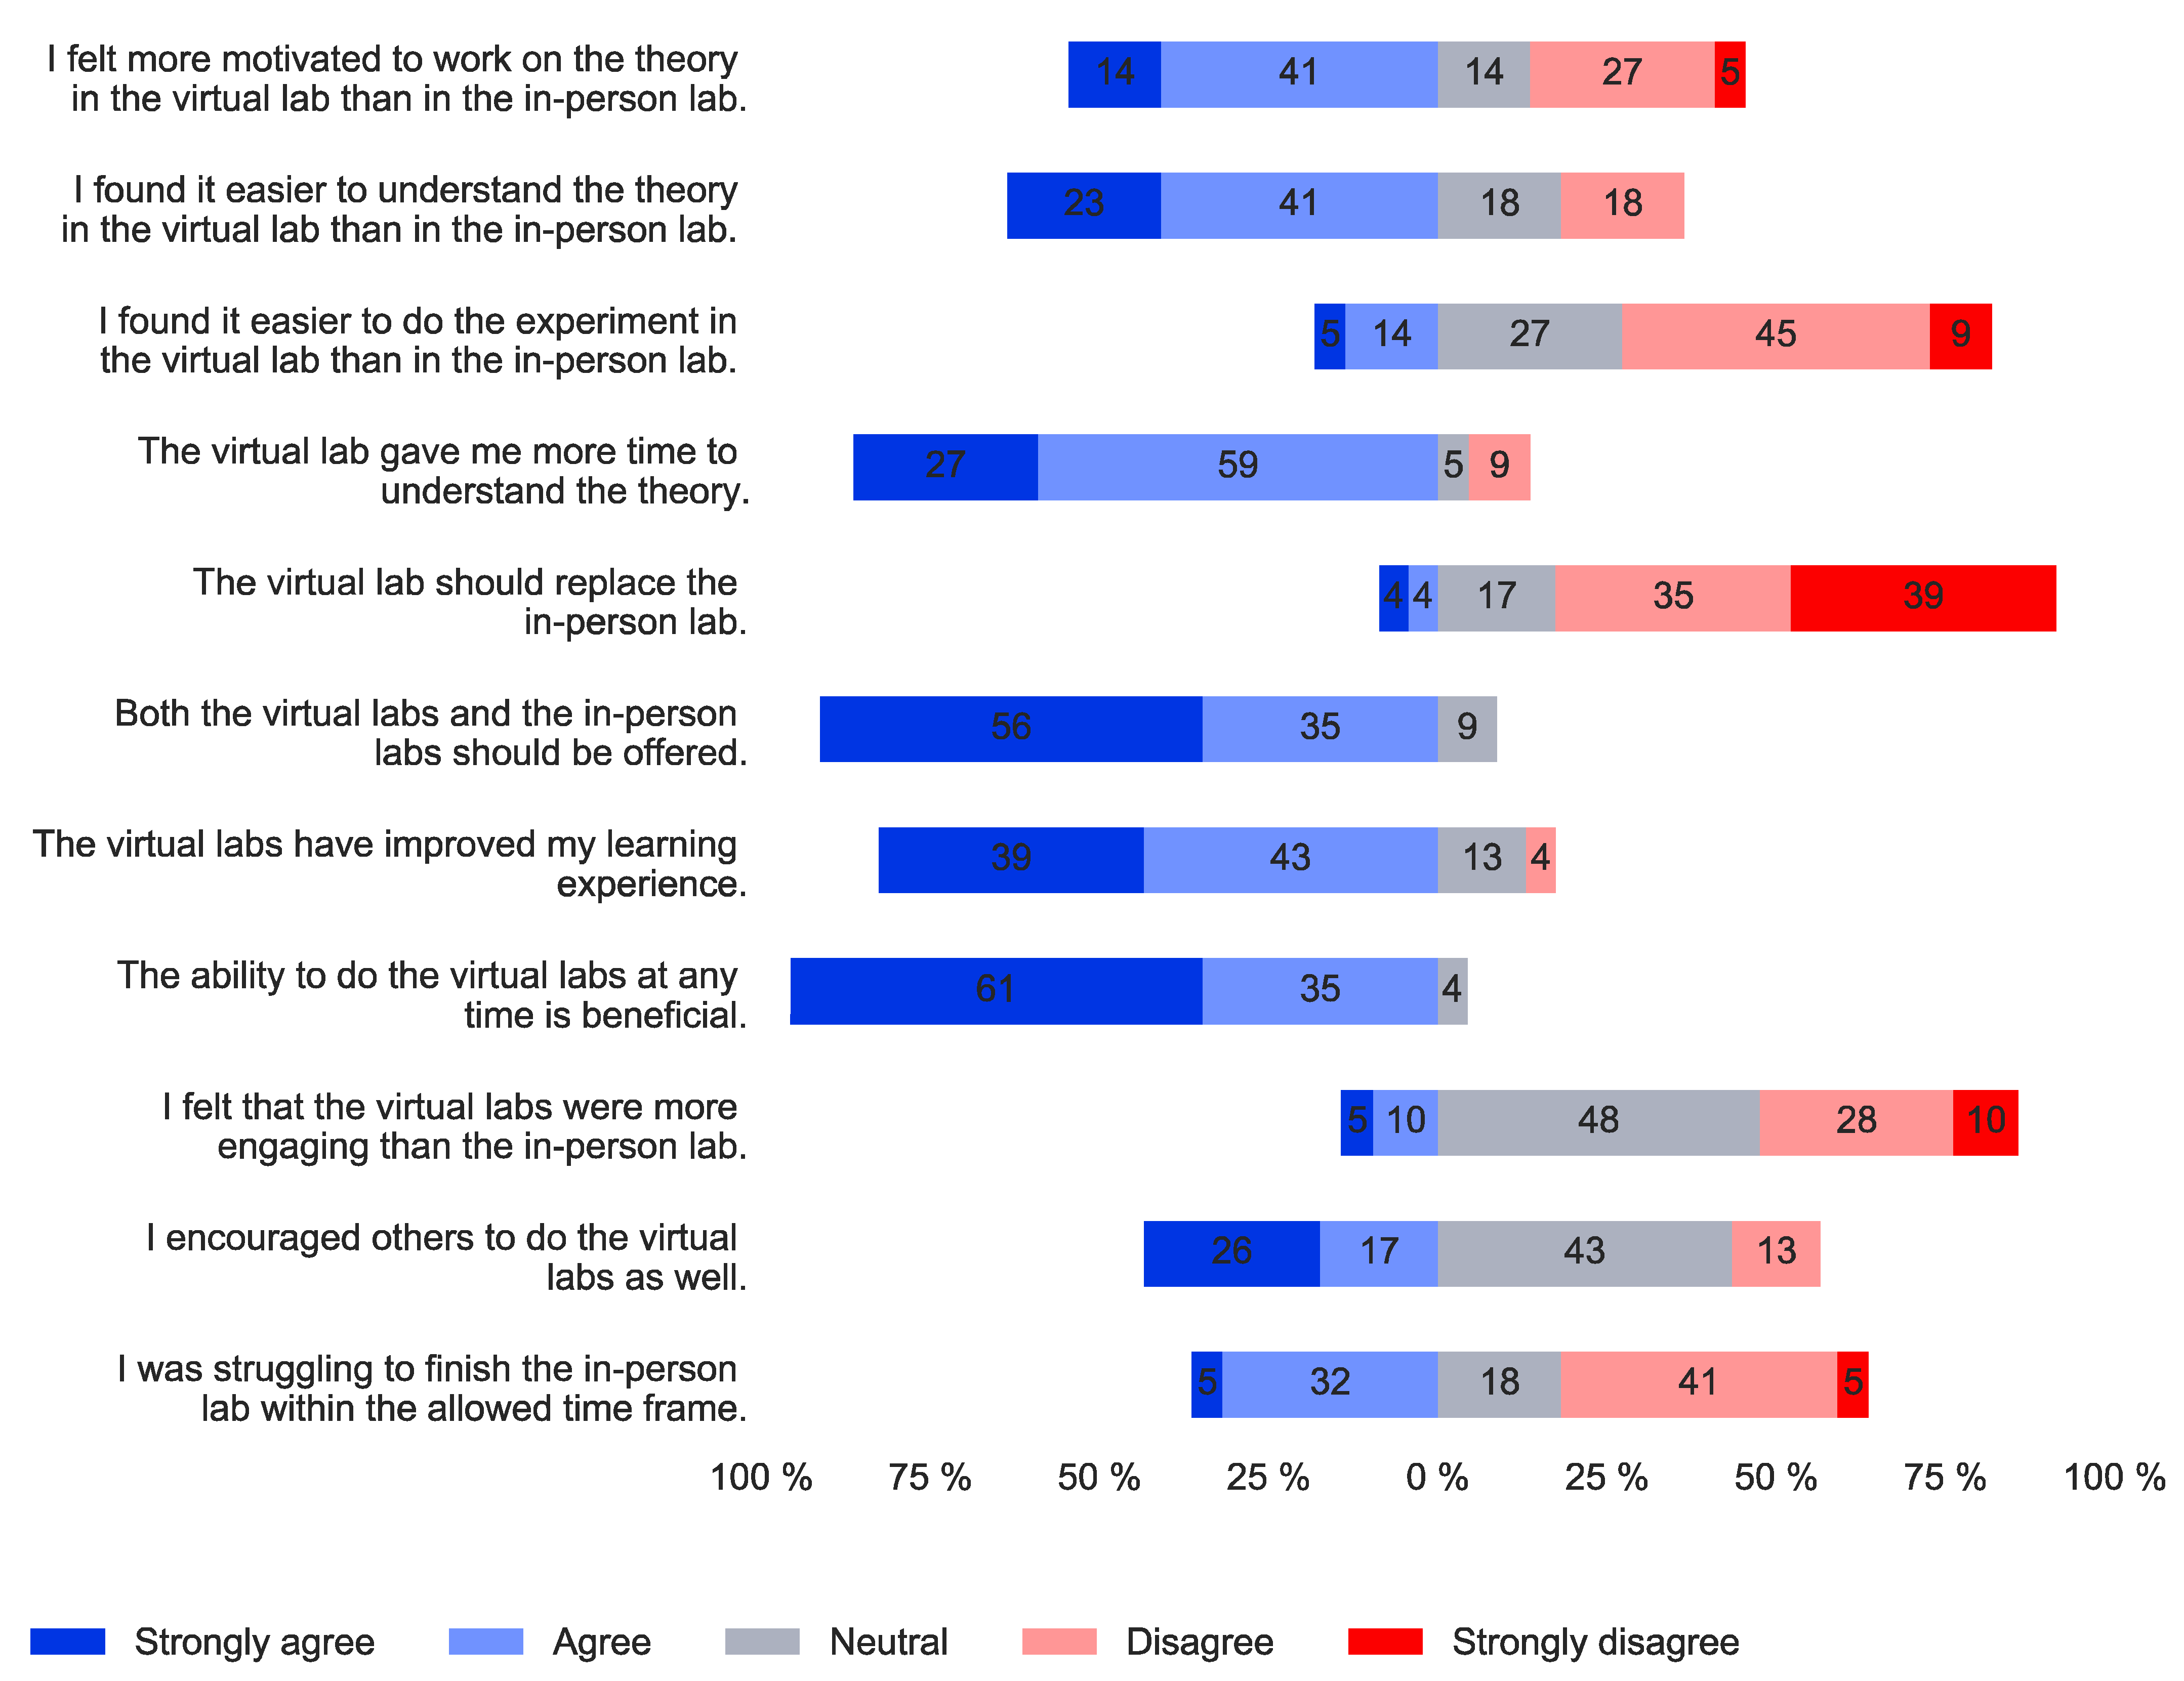
The student feedback from the survey highlights the students’ appreciation for the virtual lab. While the students rejected the suggestion to use the virtual lab as a replacement for the in-person lab, most students preferred to complete both the in-person and the virtual lab. This result is interesting given that this option apparently doubles the workload of the students. The main advantages of the virtual lab mentioned by the students was the ability to complete the virtual lab anytime from anywhere. In addition, the interactivity of the virtual lab was appreciated by the students. Based on a Kruskal–Wallis test, it can be concluded that the test scores in a class test are significantly different between students who completed all and those who completed none of the virtual labs. The median score for the students who completed all of the virtual labs was higher than for the students who completed only the COVID-19 secure in-person lab. This indicates that students not only preferred having a virtual version of the in-person lab, but it also improved their learning outcomes. Even though the virtual lab was not mandatory, each of the six experiments was fully completed at least once by half of the students who attempted it. Around 9% of the students completed the experiments multiple times.
The results of this study indicate that it is best to offer both virtual and in-person learning environments to maximise student satisfaction, learning outcomes, and class test performance.

6. Future Work

In future work, students will be randomly allocated in groups instead of allowing them to choose their preferred group and study method. In this study, this was impossible due to the pandemic affecting when the students returned to campus, and therefore students were left to choose their preferred study method (i.e., groups) depending on when they were on campus. We hope to collect more data (class test results and survey responses) to increase the statistical significance of future evaluations. In addition, an investigation on whether the virtual lab should be completed before, during, or after the in-person lab will be conducted.

Author Contributions

Conceptualization, M.S.; methodology, M.S.; software, M.S.; validation, M.S.; formal analysis, M.S.; investigation, M.S.; resources, M.S. and S.W.; data curation, M.S.; writing—original draft preparation, M.S.; writing—review and editing, M.S., S.W., and S.G.; visualization, M.S.; supervision, S.W. and S.G.; project administration, S.W., S.G. All authors have read and agreed to the published version of the manuscript.

Funding

This research received no external funding.

Institutional Review Board Statement

The survey has been reviewed and deemed appropriate by the Ethics Review Sub-Committee at Loughborough University (2021-5123-3838).

Informed Consent Statement

Informed consent was obtained from all subjects involved in the study.

Data Availability Statement

Not applicable.

Conflicts of Interest

The authors declare no conflict of interest.

Appendix A

The survey, which was conducted using Microsoft Forms.
Education 12 00153 i001Education 12 00153 i002Education 12 00153 i003Education 12 00153 i004

References

  1. Bonfield, C.A.; Salter, M.; Longmuir, A.; Benson, M.; Adachi, C. Transformation or evolution?: Education 4.0, teaching and learning in the digital age. High. Educ. Pedagog. 2020, 5, 223–246. [Google Scholar] [CrossRef]
  2. Díaz, M.S.; Antequera, J.G.; Pizarro, M.C. Flipped Classroom in the Context of Higher Education: Learning, Satisfaction and Interaction. Educ. Sci. 2021, 11, 416. [Google Scholar] [CrossRef]
  3. O’Flaherty, J.; Phillips, C. The use of flipped classrooms in higher education: A scoping review. Internet High. Educ. 2015, 25, 85–95. [Google Scholar] [CrossRef]
  4. Ahmed, M.M.H.; Indurkhya, B. Investigating cognitive holding power and equity in the flipped classroom. Heliyon 2020, 6, e04672. [Google Scholar] [CrossRef] [PubMed]
  5. Rodríguez, G.; Díez, J.; Pérez, N.; Baños, J.; Carrió, M. Flipped classroom: Fostering creative skills in undergraduate students of health sciences. Think. Ski. Creat. 2019, 33, 100575. [Google Scholar] [CrossRef]
  6. Hoshang, S.; Hilal, T.A.; Hilal, H.A. Investigating the Acceptance of Flipped Classroom and Suggested Recommendations. Procedia Comput. Sci. 2021, 184, 411–418. [Google Scholar] [CrossRef]
  7. Özbay, Ö.; Çınar, S. Effectiveness of flipped classroom teaching models in nursing education: A systematic review. Nurse Educ. Today 2021, 102, 104922. [Google Scholar] [CrossRef]
  8. Dooley, L.; Makasis, N. Understanding Student Behavior in a Flipped Classroom: Interpreting Learning Analytics Data in the Veterinary Pre-Clinical Sciences. Educ. Sci. 2020, 10, 260. [Google Scholar] [CrossRef]
  9. Rahimi, E.; Berg, J.V.D.; Veen, W. Facilitating student-driven constructing of learning environments using Web 2.0 personal learning environments. Comput. Educ. 2015, 81, 235–246. [Google Scholar] [CrossRef]
  10. Parra-González, M.E.; López-Belmonte, J.; Segura-Robles, A.; Moreno-Guerrero, A.-J. Gamification and flipped learning and their influence on aspects related to the teaching-learning process. Heliyon 2021, 7, e06254. [Google Scholar] [CrossRef]
  11. Alhammad, M.M.; Moreno, A.M. Gamification in software engineering education: A systematic mapping. J. Syst. Softw. 2018, 141, 131–150. [Google Scholar] [CrossRef]
  12. Subhash, S.; Cudney, E.A. Gamified learning in higher education: A systematic review of the literature. Comput. Hum. Behav. 2018, 87, 192–206. [Google Scholar] [CrossRef]
  13. Akçayır, G.; Akçayır, M. The flipped classroom: A review of its advantages and challenges. Comput. Educ. 2018, 126, 334–345. [Google Scholar] [CrossRef]
  14. Schnieder, M.; Ghosh, S.; Williams, S. Using gamification and flipped classroom for remote/virtual labs for engineering students. In Proceedings of the ECEL 2021 20th European Conference on e-Learning, Berlin, Germany, 28–29 October 2021. [Google Scholar]
  15. Howitt, C.; Pegrum, M. Implementing a flipped classroom approach in postgraduate education: An unexpected journey into pedagogical redesign. Australas. J. Educ. Technol. 2015, 31, 458–469. [Google Scholar] [CrossRef] [Green Version]
  16. Chen, Y.; Wang, Y.; Chen, N.-S. Is FLIP enough? Or should we use the FLIPPED model instead? Comput. Educ. 2014, 79, 16–27. [Google Scholar] [CrossRef] [Green Version]
  17. Wilson, S.G. The Flipped Class: A Method to Address the Challenges of an Undergraduate Statistics Course. Teach. Psychol. 2013, 40, 193–199. [Google Scholar] [CrossRef]
  18. Galway, L.P.; Corbett, K.K.; Takaro, T.K.; Tairyan, K.; Frank, E. A novel integration of online and flipped classroom instructional models in public health higher education. BMC Med. Educ. 2014, 14, 181. [Google Scholar] [CrossRef] [Green Version]
  19. Gómez-Carrasco, C.-J.; Monteagudo-Fernández, J.; Moreno-Vera, J.-R.; Sainz-Gómez, M. Effects of a Gamification and Flipped-Classroom Program for Teachers in Training on Motivation and Learning Perception. Educ. Sci. 2019, 9, 299. [Google Scholar] [CrossRef] [Green Version]
  20. van Alten, D.C.; Phielix, C.; Janssen, J.; Kester, L. Effects of self-regulated learning prompts in a flipped history classroom. Comput. Hum. Behav. 2020, 108, 106318. [Google Scholar] [CrossRef]
  21. Heradio, R.; de la Torre, L.; Dormido, S. Virtual and remote labs in control education: A survey. Annu. Rev. Control. 2016, 42, 1–10. [Google Scholar] [CrossRef]
  22. Chen, C.-M.; Li, M.-C.; Chen, Y.-T. The effects of web-based inquiry learning mode with the support of collaborative digital reading annotation system on information literacy instruction. Comput. Educ. 2022, 179, 104428. [Google Scholar] [CrossRef]
  23. Schallert, S.; Lavicza, Z.; Vandervieren, E. Towards Inquiry-Based Flipped Classroom Scenarios: A Design Heuristic and Principles for Lesson Planning. Int. J. Sci. Math. Educ. 2021, 20, 277–297. [Google Scholar] [CrossRef]
  24. Davies, R.; Allen, G.; Albrecht, C.; Bakir, N.; Ball, N. Using Educational Data Mining to Identify and Analyze Student Learning Strategies in an Online Flipped Classroom. Educ. Sci. 2021, 11, 668. [Google Scholar] [CrossRef]
  25. MacFarland, T.W.; Yates, J.M. Kruskal–Wallis H-Test for Oneway Analysis of Variance (ANOVA) by Ranks. In Introduction to Nonparametric Statistics for the Biological Sciences Using R; Springer International Publishing: Cham, Switzerland, 2016; pp. 177–211. [Google Scholar]
Figure 1. Distribution of the time-scale for each student to complete one of the six experiments in the virtual lab (using only the highest aggregated grade attempt for each student) (dotted line = median).
Education 12 00153 g001
Figure 2. Distribution of scores achieved by each student in one of the six experiments in the virtual lab (only the highest score of each student is illustrated here) (dotted line = median).
Education 12 00153 g002
Figure 3. Level of difficulty of the virtual lab is appropriate (values in percent).
Education 12 00153 g003
Figure 4. Confidence of understanding the theory after completing either an in-person or virtual lab (only students who completed both, the in-person, and virtual labs) (N = 21) (values in percent).
Education 12 00153 g004
Figure 5. Confidence of understanding the theory of the virtual lab (all students) (N = 25) (values in percent).
Education 12 00153 g005
Figure 6. General Questions (sum is not 100% given that students could choose not to answer a question if they, e.g., have not done the in-person lab) (values in percent).
Education 12 00153 g006
Figure 7. Class test scores of various groups of students (P19 and P20 as well as Mix21 and VP21 have the same median score).
Education 12 00153 g007
Figure 8. Statistical significance (p-value) for each combination (i.e., pairs) of the groups. Kruskal– Wallis test (a), t-test (b) (white: no statistical significance).
Education 12 00153 g008
Table 1. Attempts and completions of the virtual lab (100% is the number of students who attempted or completed a specific virtual lab).
Percentage of the Students Who…123456
attempted the virtual lab but not finished it47%50%50%51%53%51%
finished the virtual experiment once35%36%39%38%30%39%
finished the virtual experiment once and attempted it another time7%5%4%6%8%3%
finished the virtual experiment twice 7%6%5%3%6%7%
finished the virtual experiment twice and attempted it another time0%0%1%1%1%0%
finished the virtual experiment 3 times4%3%1%1%1%0%
finished the virtual experiment 3 times and attempted it another time0%0%0%0%1%0%
Publisher’s Note: MDPI stays neutral with regard to jurisdictional claims in published maps and institutional affiliations.

