1. Introduction
Over the past decades, geographical education in many countries has increasingly placed emphasis on geographical enquiring skills. Modern educational theories advocate that skills should be acquired through active enquiries in which teachers facilitate student learning [
1]. Geographical enquiring skills are an important component of the Chinese geographical curriculum for high school education. However, the teaching practices in most of China’s secondary schools are based on traditional knowledge transmission, emphasizing geographical knowledge learning by rote. Similar to South Africa, where student exposure to the practical uses of geographical information system (GIS) is limited [
2], Chinese students have few opportunities to engage in enquiring activities in their in-school learning, especially geographical activities relating to geospatial technologies. GIS is a software system that processes digital geospatial data to allow users to store, visualize and analyze spatial data [
3]. Previous studies indicated a correlation between the introduction of GIS-based learning method and student engagement [
4,
5,
6]. Some scholars have noted that the incorporation of GIS into geographical teaching could promote students’ development of geographical knowledge [
5,
7]. For instance, a few student research projects used GIS to visualize data about noxious weeds, dead trees, safety issues and natural disasters [
8,
9,
10,
11]. Applying GIS to geological fieldwork enabled students to comprehend the connections among geological structures and features more easily than conventional teaching [
12]. Student spatial thinking and reasoning were improved after exposure to the uses of GIS [
13,
14]. The enquiring activities in this article are intended to help students to understand how geographical elements within urban structures are related through the lens of property price visualization enabled by GIS.
According to the seventh national census released by the National Statistics Bureau on 11 May 2021, the number of people living in cities and towns in China was 901,991,162, accounting for 63.89% of the total population (the urbanization rate of the registered population in China in 2020 was 45.4%) [
15]. As China’s urbanization progresses, different urban structures, such as concentric zones [
16] and sectors [
17], or multiple nuclei [
18] have emerged. Urban structures are introduced by the competition of various urban elements in the interaction process of physical and human factors. These urban structures are indicative of the spatial distribution of specific functional areas that are characterized by the centralization and clustering of dominant activities. These functional areas serve not only as production spaces, but also living spaces. Basic living needs, such as clothing, food, apartments and communications, are closely related to certain functional areas. As one of the basic needs, apartment prices are regulated by different elements in urban spatial structures, resulting in the spatial differentiation of apartment prices.
Urban study is an important aspect of high school geography. The school geography textbook introduces urban structures and how the formation and changes in urban internal spatial structures are driven by different elements [
19]. It describes how different land uses in urban inner space come into being by using three pictures of residential, commercial and industrial landscape [
19]. The textbook adopts a city as a case study to invite students to analyze the reasons for the formation of its different functional areas [
19]. Although it explains how various elements interact within urban structures, it only provides students with a static and abstract impression of geographical knowledge bereft of the direct experience of the case study city. As a result, students have few opportunities to enquire how different and specific elements within an urban structure are interrelated.
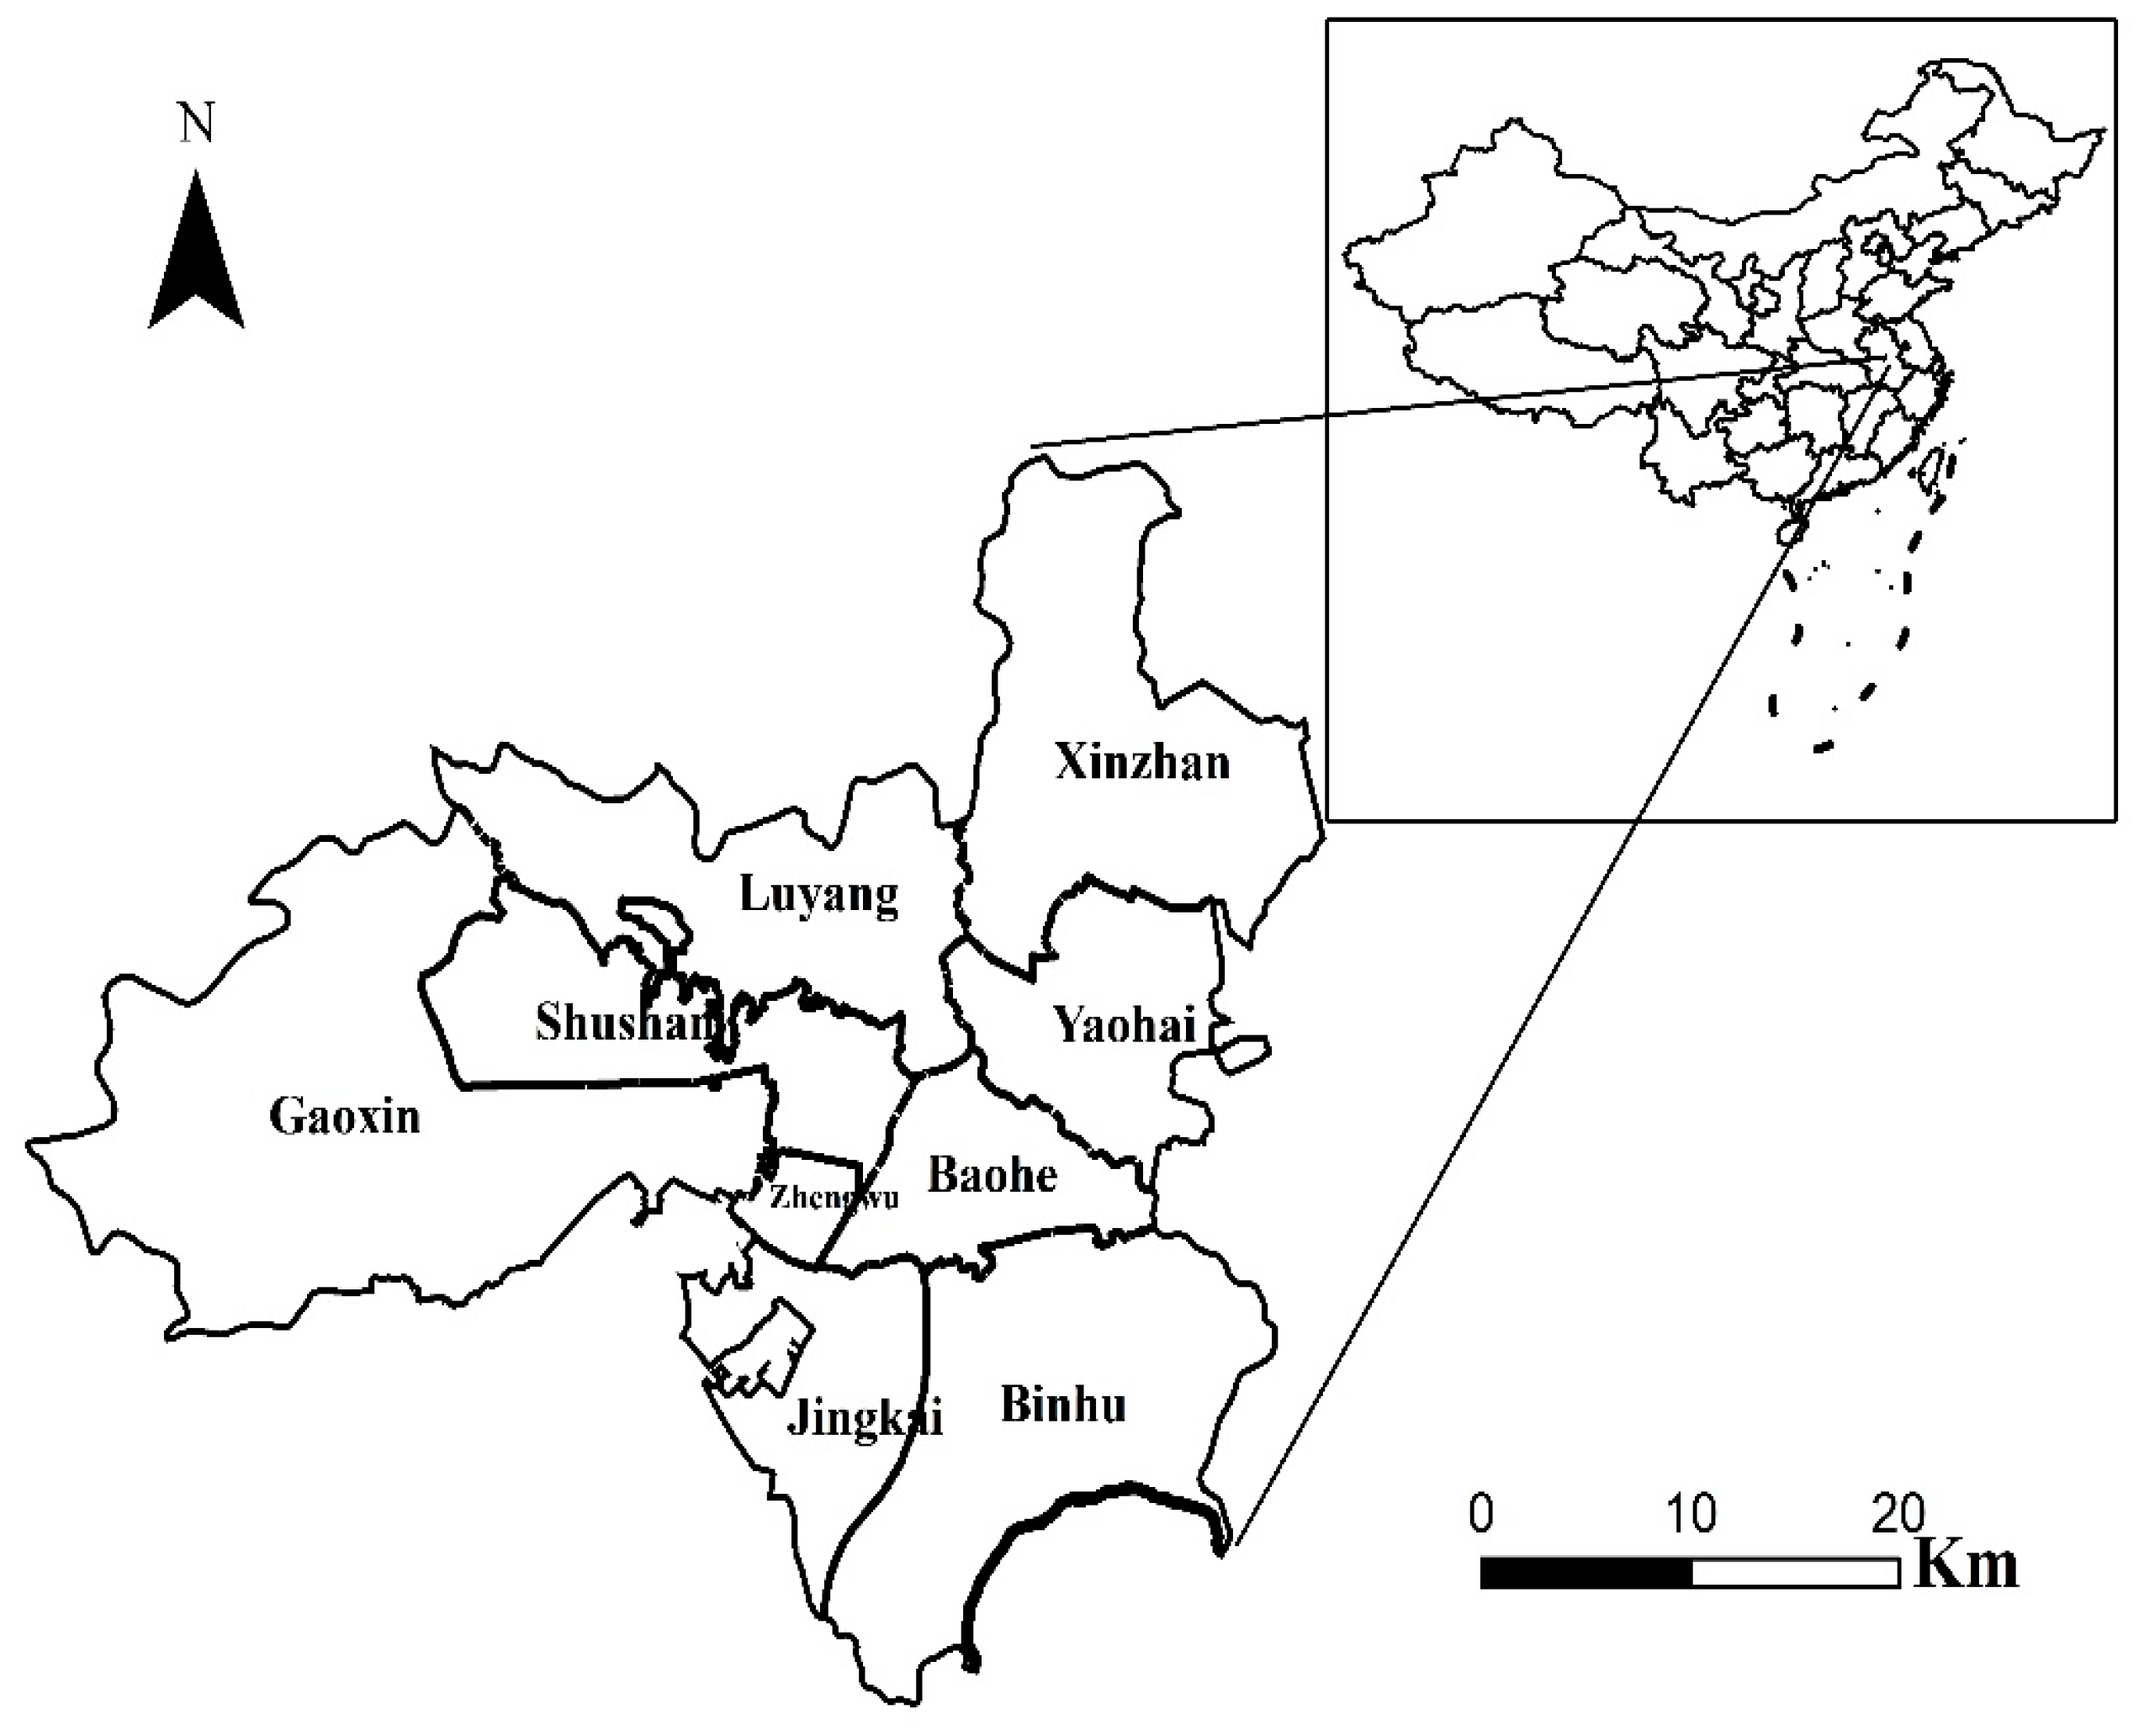
GIS is widely used to visualize spatial relations and this article aims to capitalize on the potential benefits of GIS to teach the relations of property prices to urban elements in Hefei city (
Figure 1). This article may also shed light on how students perceive the integration of GIS into geographical teaching.
2. Methodology
The Chinese educational system is generally structured in four stages: six years of primary school, three years of lower secondary (or junior high) school and three years of upper secondary (or senior high) school, followed by higher education. It is compulsory that every child in China receives a nine-year primary and lower secondary education, which begin at about ages 6 and 12, respectively. Afterwards, students can advance to upper secondary education if they perform well in the place allocation examinations. In China, urban schools are better financed than rural schools. As such, we chose an urban high school because they have computers, essential for GIS-based teaching, available. The students that participated in the GIS-based enquiring activities were in their first year of upper secondary education. The students were aged about 15 years old and included 23 males and 17 females. The students in the class had few opportunities of being exposed to GIS technology in their regular geography class teaching. As such, they were guided by the authors to input, process and output geographical data and information of property prices as well as to enquire the relations of property prices to other elements, after being taught the basics of the GIS software. We used Hefei city, with which the students were familiar, as a case study. In recent years, Hefei city has developed rapidly and attracted a large number of jobseekers from all over the country. The changing urban spatial structure ensuing from the increase in population has transformed the relations of different elements. In this context, we wanted to show the students how the specific element of apartment prices relates to other urban elements.
2.1. Data Sources
The prices of apartments in Hefei city were obtained from the website of the property brokerage Lianjia [
20] as of 22 December 2021. The price unit is Chinese yuan per square meter (CNY/m
2). Although the prices of second-hand apartments listed online were only referential, not the actual transaction price, according to our exchanges with Lianjia’s property brokers, the difference between the actual transaction price and the referential price was generally within 5%. Therefore, the online referential price could generally represent the actual transaction prices of apartments. A total of 22,684 apartment prices across urban districts in Hefei city were collected. Those counties under the jurisdiction of Hefei city were excluded from analysis because of there only being few available apartments. The districts are shown in
Figure 2. The quantity and the average prices of listed apartments in respective districts are presented in
Table 1.
2.3. Procedures
The authors guided the students to use a web data extractor called LocoySpider (available at
http://www.locoy.com, accessed on 30 September 2022) to collect apartment listings on the website of Lianjia property brokerage. This activity was intended to collect the latitudes and longitudes of 22,684 listed apartments and their unit prices. The longitudes and latitudes of the listed apartments were input into the ArcGIS system to display their corresponding positions in map layers. Kriging interpolation analysis was performed according to the unit price of each listed apartment to create a raster map of apartment price distribution. During the teaching process, the students were divided into four teams of 10 students each. Every student in the teams was assigned specific tasks. In the first team, two students input the latitudes and longitudes of the government offices and converted the raster map of apartment price distribution into a vector map of apartment price isoline. The other students in the team conducted buffer analysis to generate a topological map of governmental office locations and apartment price distribution. The second, third and fourth teams performed similar operations to create the topological maps of schools, hospitals, main roads and apartment price distribution, respectively. Afterwards, each team discussed and stated to the whole class the spatial relations of apartment prices to governmental office locations, schools, hospitals and main roads. During their discussions and statements, other students could question them. The entire enquiring activities took four teaching hours.
2.4. Post-Teaching Data Gathering
A qualitative approach was applied in gathering data relating to student attitudes towards and views on the GIS-based teaching after completing all teaching sessions. The data sources were field notes, interviews and small group discussions. The field notes recorded their operational skills of generating datasets and raster maps of apartment price distribution in GIS. The questions in interviews and group discussions included whether they enjoyed and were interested in the GIS-based teaching, whether the GIS-based teaching improved their knowledge and skills and what were the differences they felt between the GIS-based teaching and conventional teaching. These data sources were helpful to evaluate how the students perceived the GIS-based teaching in relation to conventional geography teaching. Interviews and post-teaching group discussions were later transcribed. Content analysis [
21] was performed to code and organize themes emerged from field notes and transcriptions of interviews and discussions.
3. Results
3.1. Spatial Differentiation of Apartment Prices
Using the Kriging interpolation analysis, the spatial distribution of 22,684 apartment prices collected from the brokerage is presented in
Figure 3.
As shown in
Figure 3, the apartment prices in Hefei are characterized by a multi-polar distribution. Binhu and Zhengwu are the two districts with the highest apartment prices, with an average price of more than 30,000 CNY/m
2 (about USD 4709 per square meter); the second highest districts are the downtown (the junction of Baohe, Luyang and Shushan), Gaoxin and Jingkai with an average apartment price of 20,000 CNY/m
2 (about USD 3139 per square meter); the districts with a low apartment price are primarily Yaohai and Xinzhan. The spatial autocorrelation analysis shows that the spatial autocorrelation index (Moran I) is 0.924214 and the z value is 602.5194 with
p < 0.0001, indicating that apartment prices are clustered significantly with a prominent spillover effect. The clusters of high apartment prices are mainly distributed around provincial governmental offices and elite primary and secondary schools.
3.2. The Relations of Apartment Prices with Other Geographical Elements
3.2.1. The Geographical Element of Governmental Offices
The relation between governmental office locations and apartment prices was the first objective of the enquiring activity. In this activity, the governmental offices were considered to be the points of interest, around which 1-, 2- and 3-km radii (termed as buffer areas) were analyzed to explore the relations between apartment prices and the locations of governmental offices. In the first step, the students were divided into several teams to obtain the data of apartment prices in respective districts of the city using LocoySpider, a network tool used as a web data extractor. Next, under the aide of the authors, the students input the data file of apartment prices into ArcGIS and constructed a map that displayed the apartment prices within 1-, 2- and 3-km distance from the governmental offices. They then conducted further GIS analysis to find the spatial patterns of apartment prices in relation to their distances from the governmental offices (
Figure 4). The GIS-based analysis indicated that high-priced apartments were concentrated in 2-km distance from governmental offices. The students constructed a ring buffer analysis to study the relations between the governmental offices location and apartment prices and found that 60% of high-priced apartments with a price tag of above 20,000 CNY/m
2 (about USD 3139 per square meter) were in 3-km distance from governmental offices, particularly evident for the provincial and municipal governmental offices. The GIS-generated map shows some interesting trends; in most cases, the more distant the apartments are from government offices, the lower their prices.
In a follow-up discussion, the authors asked the students to compare the apartment prices in the Zhengwu district ten years before and in the present and discussed with the class to find information to explain why the property price soared. The students explained that, previously, the apartment prices in the Zhengwu district were low due to its dirty and disordered environment. After the relocation of the municipal government office to the Zhengwu district, the environment of Zhengwu was greatly improved. The continuous improvements in living environments and facilities attracted apartment buyers from all over the province. As a result, the property prices were increased. The students found information from the Internet to provide another example to show the impact of governmental offices on property prices. In April 2016, after the relocation of the provincial governmental offices to Binhu, a number of measures were undertaken to improve the environment and facilities, such as constructing roads around lakes, renovating parks, protecting lakeside wetlands and other recreational spaces. With these improvements, the property prices in Binhu soared from 4000 CNY/m2 (about USD 627 per square meter) to over 20,000 CNY/m2 (about USD 3139 per square meter) in just a few years.
3.2.2. The Geographical Element of Elite Schools
The relation between elite school locations and apartment prices was the second objective of the GIS-based class activity. The selected elite schools for the activity were Hefei No. 1 Secondary School, Hefei No. 6 Secondary School, Hefei No. 8 Secondary School, Hefei No. 48 Secondary School, Hefei No. 50 Secondary School, the Affiliated Secondary School of University of Science and Technology of China and Hefei Nanmen Primary School. The reason for selecting these schools was that they are recognized as famous schools with high quality teaching. Similar to the above activity relating to government offices, these elite schools were considered to be the points of interest, around which 1-, 2- and 3-km radii were analyzed to explore spatial patterns of apartment prices in relation to their distances from the elite schools (
Figure 5). The GIS-based analysis shows that high-priced apartments are essentially within 3 km’ distance from the elite schools.
In a follow-up discussion, the authors asked the students to enquire the reasons that justify the higher prices of the apartments adjoining the elite schools. The students tried to find relevant information to support the higher apartment prices. They argued that these apartments located within these schools’ catchment area were called school district apartments. The students whose parents bought school district apartments could be admitted to these elite schools. As such, it is a common phenomenon that Chinese parents exploit all their financial resources to buy these high-priced school district apartments so that their children can receive the good education provided by these elite schools. Parents seeking for a good education actually pushed apartment prices up in the school districts.
3.2.3. The Geographical Element of Hospitals
The relation between hospital locations and apartment prices was the third objective of the GIS-based class activity. The selected hospitals for the activity were the First Affiliated Hospital of Anhui Medical University, Anhui Provincial Hospital and their branches. The reason for selecting these hospitals was that they were the leading hospitals with the highest Class A rating in Hefei city. The annual outpatient number of the First Affiliated Hospital of Anhui Medical University is 5.85 million, and the number of discharged patients and operations is 302,800 and 175,200, respectively [
22]. The Anhui Provincial Hospital had 5.8 million outpatient visits, 300,000 discharges and 170,000 operations in 2021 [
23]. These hospitals, featuring excellent facilities and able doctors, enjoy a high reputation among citizens. Similar to the above activity relating to school locations, the selected hospitals were considered to be the points of interest, around which 1-, 2- and 3-km radii were analyzed to explore the trends of apartment prices in relation to their distance from the hospitals (
Figure 6). The results show that high-priced apartments are generally within 3 kilometers’ distance from the hospitals.
In a follow-up class discussion, the authors asked the students to investigate the underlining reasons for the higher prices of the apartments in the vicinity of the hospitals. The students explained that people pay more and more attention to their health and the concept of disease prevention is becoming increasingly popular in China. In addition, China is a populous country with serious population aging. The seventh national census showed that the population aged 60 and above in China accounted for 18.70% of the total population, and the population aged 65 and above accounted for 13.50% of the total population [
15]. The elderly want to buy apartments that are within a convenient distance to see a doctor. As a result, they pushed the prices of apartments up in the vicinity of the hospitals.
3.2.4. The Geographical Element of Transportation Infrastructure
The relation between transportation infrastructure and apartment prices was the last objective of the GIS-based class activity. The selected main roads were considered as an indicator of transportation infrastructure. It was assumed that the main roads could offer smooth and good traffic to shorten the time and lower the cost of commuting from residential to working and recreational spaces. In order to analyze the correlation between main roads and apartment prices, several main roads of Hefei city were selected as the central lines. The students conducted a GIS-based buffer zone analysis to find patterns of the spatial distribution of apartment prices in relation to their 1-, 2- and 3-km distance from the main roads (
Figure 7). The analysis shows that high-priced apartments are most often distributed along the main road with good traffic conditions. The prices of apartments decrease with the increase in distance from the two sides of the main roads, suggesting that transportation infrastructure is correlated significantly with apartment prices.
In a follow-up class discussion, the authors requested the students to find the reasons why apartments along the main roads were priced higher. The students from different teams searched relevant information and explained that the convenient access to traffic roads has a great impact on the commuting of citizens. Hefei has experienced a rapid expansion in population. The seventh national census showed that the urban population in Hefei was 5.1182 million. Compared to the sixth national census in 2010, the growth rate was 25.65% [
24]. The rapid growth in population increases the pressure on urban traffic. The speed of vehicles during the morning and evening traffic peaks has been greatly reduced. Coupled with the shortage of parking spaces, the time and economic costs of citizens’ commuting rise steadily. Therefore, choosing an apartment near to main roads with good traffic conditions is an important consideration in the process of buying an apartment for the white-and blue-collar.
3.2.5. Students’ Views on GIS-Based Teaching
The content analysis of field notes reveals that initially the students had difficulties in operating the GIS software. However, a majority of the students could produce datasets and a raster map of apartment price distribution using GIS technology after being assisted and tutored by the authors. In the post-teaching interviews and discussions, we asked the students whether they enjoyed and were interested in GIS-based teaching. More than three fourths of the students’ responses indicated that they liked the way geography was taught with GIS technology and that GIS-based teaching aroused a lot of interest in them, as exemplified by: “I like to generate maps by myself using GIS.” “I prefer the GIS-based teaching because I see the technology is useful for making a correct decision through the analysis of property prices.” “I am interested in the geospatial technology, hopefully I have more opportunities to use it in the future.” With respect to the question about their gains in knowledge and skills from GIS-based teaching, a large number of their responses demonstrated that they learnt new knowledge unavailable in geography textbooks and new skills to make virtual maps with GIS technology. For instance, some of their responses in this category were: “I have never expected there are so many factors that relate to the apartment prices.” “I am excited that I am able to produce maps with GIS.” “I have learnt how to stack maps on one another.” These responses partially reinforce what the field notes revealed. Responses to the question regarding their feelings about the differences between the GIS-based and conventional teaching show that more than 85% of the students favored the new GIS-based teaching that they had never experienced before. The pronounced difference they felt was that the teaching mode dramatically changed with the integration of GIS. The conventional teaching mode they previously experienced was teacher-led lecturing and note-taking of what their teacher imparted and wrote on the chalkboard with little chance to acquire knowledge and skills by themselves. In contrast, the GIS-based teaching provides much room to acquire new knowledge that would otherwise be imparted to them or unavailable in conventional teaching. Examples of responses that fall into this category are: “The GIS-based teaching are more interesting because it enables me to enquire the knowledge.” “We are not the receiver of what is being taught, but rather an explorer.”
4. Discussion and Conclusions
Geography is regarded as a “less useful” course in Chinese secondary schools. This might be due to the mechanical teaching approach prevalent in geographical education. Geographical knowledge is learnt through imparting rather than enquiring. This article presented a GIS-based teaching model that engaged students in learning the relations between different urban elements through the lens of property price. According to students’ responses, the use of ArcGIS to visualize the relations of apartment prices with various urban elements kindled their interest in learning geography because they felt geography could help to make well informed decisions through geospatial analysis tools. This resonates with prior studies [
5,
25,
26,
27] that show that GIS-based activities can significantly increase student interest in geography. The students were excited about the GIS technology as they had never experienced it in their geographical class before. Field notes, interviews and discussions suggest that most of the students had gained the skill of generating datasets and raster maps. This coincides with prior studies [
27,
28,
29] that demonstrate geospatial technologies can enhance participants’ knowledge and skills of creating different types of maps. The students felt that they changed from being passive learners in a conventional teaching mode to being active enquirers in the GIS-based teaching mode. This result resonates with previous studies [
27,
30,
31,
32] that show that geospatial technologies support and encourage enquiry-based learning by allowing learners to explore data with queries.
It is worth noting that several aspects of GIS-based activities should be attended to. Firstly, a good design of geographical enquiring activities should be based on real issues that can be referential to the geographical theories or laws in their textbooks. In this way, students will perceive the usefulness of geography in explaining phenomena in their daily lives. Additionally, the enquiring activities should be based on contexts with which the students are familiar so that they can test and validate their findings in their after-class field activities. Secondly, it would be better that the relations of the studied elements can be demonstrated through visualization enabled by GIS software. The sampling should be easy for students and the sampled data from the field or the Internet can be input into the GIS software to generate maps. Thirdly, for those students who have never been exposed to GIS software, it would be preferable that enquiring activities do not require the complex operation and processing of the GIS software, or it will require a considerable amount of teaching time and students may feel it is very daunting to use GIS software. Lastly, enquiring activities should fall within the zone of proximal development. This can challenge students and, in the meantime, be solved through their own efforts.
This paper has the following limitations. The elements that affect property prices are culture-based. This means that some of the elements that significantly influence property prices in China may not be applicable to other cultures. In addition, although in most cases the trend indicates the apartments near the above-discussed geographical elements are priced higher, there are cases that contradict this trend. These contradicting cases were not enquired. Due to the limited teaching hours for school geography and the shortage of geography-related hardware, the students’ exposure to the geospatial analysis tool was insufficient and thus they might not be very skilled or proficient in operating the analysis tool.
Author Contributions
Conceptualization, C.W. and D.Y.; administration, C.W; class observation, D.Y.; data curation, H.X.; writing—original draft preparation, C.W. and D.Y.; writing—review and editing, C.W. and D.Y. All authors have read and agreed to the published version of the manuscript.
Funding
This research received no external funding.
Institutional Review Board Statement
Ethical review and approval were waived for this study due to institutional regulations.
Informed Consent Statement
Consent was waived due to local institutional regulations.
Data Availability Statement
Data is not publicly available due to institutional regulations.
Acknowledgments
We thank the students from Hefei No. 2 Secondary School for their participation in the GIS-based teaching exercise and the four anonymous reviewers for their constructive comments on the early draft of the article. This article is written as part of the National Undergraduate Innovation and Entrepreneurship Training Program (14098011) and Anhui Provincial Undergraduate Innovation and Entrepreneurship Training Program (202114098069S).
Conflicts of Interest
The authors declare no conflict of interest.
References
- Novak, J.D. Learning, Creating and Using Knowledge; Lawrence Erlbaum: London, UK, 1998. [Google Scholar]
- Mkhongi, F.A.; Musakwa, W. Perspectives of GIS education in high schools: An evaluation of uMgungundlovu district, KwaZulu-Natal, South Africa. Educ. Sci. 2020, 10, 131. [Google Scholar] [CrossRef]
- Favier, T.; van der Schee, J. Learning geography by combining fieldwork with GIS. Int. Res. Geogr. Environ. Educ. 2009, 18, 261–274. [Google Scholar] [CrossRef]
- Favier, T.; van der Schee, J. The effects of geography lessons with geospatial technologies on the development of high school students’ relational thinking. Comput. Educ. 2014, 76, 225–236. [Google Scholar] [CrossRef]
- Kerski, J.J. The implementation and effectiveness of geographic information systems technology and methods in secondary education. J. Geogr. 2003, 102, 128–137. [Google Scholar] [CrossRef]
- Norton, E.; Li, Y.; Mason, L.R.; Washington-Allen, R.A. Assessing the impact of a geospatial data collection app on student engagement in environmental education. Educ. Sci. 2019, 9, 118. [Google Scholar] [CrossRef]
- Baker, T.; White, S. The effects of G.I.S. on students’ attitudes, self-efficacy, and achievement in middle school science classrooms. J. Geogr. 2003, 102, 243–254. [Google Scholar] [CrossRef]
- Loudon, B. Jump-starting GIS: Youth and teachers as co-learners. In GIS in Schools; Audet, R.H., Ludwig, G.S., Eds.; ESRI Press: Redlands, CA, USA, 2000; pp. 31–38. [Google Scholar]
- Zanelli, E.K.; Feaster, L.S. Mapping of noxious weeds. In Community Geography; Zanelli, E.K., Feaster, L.S., Eds.; ESRI Press: Redlands, CA, USA, 2003; pp. 55–66. [Google Scholar]
- Paul, W.; Hamilton, W. Hazmat. In GIS in Schools; Audet, R.H., Ludwig, G.S., Eds.; ESRI Press: Redlands, CA, USA, 2000; pp. 12–13. [Google Scholar]
- Li, J.; Xia, H.; Qin, Y.; Fu, P.; Guo, X.; Li, R.; Zhao, X. Web GIS for Sustainable Education: Towards Natural Disaster Education for High School Students. Sustainability 2022, 14, 2694. [Google Scholar] [CrossRef]
- Phantuwongraj, S.; Chenrai, P.; Assawincharoenkij, T. Pilot Study Using ArcGIS Online to Enhance Students’ Learning Experience in Fieldwork. Geosciences 2021, 11, 357. [Google Scholar] [CrossRef]
- Duarte, L.; Teodoro, A.C.; Gonçalves, H. Evaluation of Spatial Thinking Ability Based on Exposure to Geographical Information Systems (GIS) Concepts in the Context of Higher Education. ISPRS Int. J. Geo-Inf. 2022, 11, 417. [Google Scholar] [CrossRef]
- Lee, J.; Bednarz, R. Effect of GIS learning on spatial thinking. J. Geogr. High. Educ. 2009, 33, 183–198. [Google Scholar] [CrossRef]
- National Statistics Bureau. Publication of the Seventh National Census (in Chinese). Available online: http://www.stats.gov.cn/tjsj/tjgb/rkpcgb/qgrkpcgb/202106/t20210628_1818826.html (accessed on 15 June 2022).
- Burgess, E.W. Residential segregation in American cities. Ann. Am. Acad. Political Soc. Sci. 1928, 140, 105–115. [Google Scholar] [CrossRef]
- Hoyt, H. The structure of American cities in the post-war era. Am. J. Sociol. 1943, 48, 475–481. [Google Scholar] [CrossRef]
- Harris, C.D.; Ullman, E.L. The nature of cities. Ann. Am. Acad. Political Soc. Sci. 1945, 242, 7–17. [Google Scholar] [CrossRef]
- Curriculum and Textbook Research Institute. Geography (Compulsory Book Two); People’s Education Press: Beijing, China, 2019. [Google Scholar]
- Lianjia. Online Second-Hand Apartments (in Chinese). Available online: https://hf.lianjia.com/ershoufang/ (accessed on 1 June 2022).
- Krippendorff, K. Content Analysis: An Introduction to Its Methodology; Sage Publications: Thousand Oaks, CA, USA, 2004. [Google Scholar]
- The First Affiliated Hospital of Anhui Medical University. An Introduction to the Hospital (in Chinese). Available online: https://www.ayfy.com/yyjs.htm (accessed on 16 June 2022).
- Anhui Provincial Hospital. An Introduction to the Hospital (in Chinese). Available online: https://www.ahslyy.com.cn/cn/About/index_87.html (accessed on 16 June 2022).
- Hefei Statistics Bureau. Publication of the Seventh National Census of Hefei City (in Chinese). Available online: http://tjj.hefei.gov.cn/tjyw/tjgb/14735557.html (accessed on 21 June 2022).
- Kinniburgh, J. A constructivist approach to using GIS in the New Zealand classroom. N. Z. Geogr. 2010, 66, 74–84. [Google Scholar] [CrossRef]
- McClurg, P.A.; Buss, A. Professional development: Teachers use of GIS to enhance student learning. J. Geogr. 2007, 106, 79–87. [Google Scholar] [CrossRef]
- Demirci, A. The effectiveness of geospatial practices in education. In Geospatial Technologies and Geography Education in a Changing World; Solari, O.M., Demirci, A., Schee, J., Eds.; Springer: Tokyo, Japan, 2015; pp. 141–153. [Google Scholar]
- Hong, J.E.; Melville, A. Training social studies teachers to develop inquiry-based GIS lessons. J. Geogr. 2018, 117, 229–244. [Google Scholar] [CrossRef]
- De Miguel González, R.; De Lázaro Torres, M.L. WebGIS implementation and effectiveness in secondary education using the digital atlas for schools. J. Geogr. 2020, 119, 74–85. [Google Scholar] [CrossRef]
- Liu, S.; Zhu, X. Designing a structured and interactive learning environment based on GIS for secondary geography education. J. Geogr. 2008, 107, 12–19. [Google Scholar] [CrossRef]
- Akerson, V.L.; Dickinson, L.E. Using GIS technology to support K-8 scientific inquiry teaching and learning. Sci. Educr. 2003, 12, 41–47. [Google Scholar]
- Favier, T.T.; Van der Schee, J. Exploring the characteristics of an optimal design for inquiry-based geography education with Geographic Information Systems. Comput. Educ. 2012, 58, 666–677. [Google Scholar] [CrossRef]
| Publisher’s Note: MDPI stays neutral with regard to jurisdictional claims in published maps and institutional affiliations. |
© 2022 by the authors. Licensee MDPI, Basel, Switzerland. This article is an open access article distributed under the terms and conditions of the Creative Commons Attribution (CC BY) license (https://creativecommons.org/licenses/by/4.0/).


