
Learners’ Performance in a MOOC on Programming


Abstract
:1. Introduction
1.1. Literature Review
1.1.1. The Effect of Multiple Attempts on Success
1.1.2. Engagement Styles and Performance
1.1.3. Difficulty-Resolving and Performance
- RQ 1: To what extent do the performances in assessments between non-completers and completers differ?
- RQ 2: To what extent do the performances in assessments between completers grouped into engagement clusters differ?
- RQ 3: To what extent do the performances in assessments between completers grouped into clusters of difficulty-resolvers differ?
2. Methodology
2.1. Context of Study
2.2. Sample
- Engagement clusters [16]:
- ○
- active knowledge collectors (N = 170) engaged with most provided activities, except reading forum posts and using troubleshooters. They were predominantly older completers with higher education;
- ○
- for minimum knowledge collectors (N = 95), the main sources used were learning materials on programming, self-assessment questions, and provided demos. This cluster had a higher share of males and younger persons with lower education who had studied programming before;
- ○
- pragmatic knowledge collectors (N = 201) concentrated mainly on the activities needed to complete the MOOC on programming. No distinctive differences by demographic and social characteristics were found;
- ○
- support-required knowledge collectors (N = 114) engaged with all available course activities and were more active in using provided support mechanisms. Most of them had no previous experience in studying programming
- Difficulty-resolvers’ clusters [17]:
- ○
- bounded resolvers (N = 172) tended to re-read learning materials and were least likely to search for additional materials on the Internet. In this cluster, those who had studied programming before occupied a large portion;
- ○
- moderate resolvers (N = 74) usually re-read learning materials and tried to find information on the Internet, forums, or troubleshooters. For most of them, this course was their first experience with a web-based course;
- ○
- step-by-step resolvers (N = 124) coped with difficulties by using learning materials and troubleshooters. The members of this cluster were mostly inexperienced in studying programming;
- ○
- social resolvers (N = 42) had the highest activity levels in re-reading the learning materials, using troubleshooters, and seeking help from forums and helpdesk. This cluster had the highest share of female learners, who had never studied programming nor participated in a web-based course before;
- ○
- self-supporting resolvers (N = 168) used learning materials and were the most active in searching for additional materials on the Internet. Most of them were male and experienced in studying programming but had never participated in a web-based course.
2.3. Data Collection
2.4. Data Analysis
3. Results
3.1. Performance in Assessments by Non-Completers and Completers
3.2. Performance in Assessments by Completers with Different Engagement Styles
3.3. Performance in Assessments by Completers with Different Difficulty-Resolving Patterns
4. Discussion
4.1. Performance in Assessments by Non-Completers and Completers
4.2. Performance in Assessments by Completers with Different Engagement Styles
4.3. Performance in Assessments by Completers with Different Difficulty-Resolving Patterns
5. Conclusions
Author Contributions
Funding
Institutional Review Board Statement
Informed Consent Statement
Data Availability Statement
Conflicts of Interest
References
- Janakiraman, S.; Watson, S.L.; Watson, W.R. Adult learners use of self-directed learning strategies in a massive open online course. J. Ethnogr. Qual. Res. 2018, 13, 122–133. [Google Scholar]
- Hannafin, M.J.; Hannafin, K.M. Cognition and Student-Centered, Web-Based Learning: Issues and Implications for Research and Theory. In Learning and Instruction in the Digital Age; Spector, J.M., Ifenthaler, D., Isaias, P., Kinshuk-Sampson, D., Eds.; Springer: Boston, MA, USA, 2010; pp. 11–23. [Google Scholar] [CrossRef]
- Brooker, A.; Corrin, L.; de Barba, P.; Lodge, J.; Kennedy, G. A tale of two MOOCs: How student motivation and participation predict learning outcomes in different MOOCs. Australas. J. Educ. Technol. 2018, 34, 73–87. [Google Scholar] [CrossRef] [Green Version]
- Soffer, T.; Cohen, A. Students’ engagement characteristics predict success and completion of online courses. J. Comput. Assist. Learn. 2019, 35, 378–389. [Google Scholar] [CrossRef]
- Hadi, S.M.; Rawson, R. Driving Learner Engagement and Completion within MOOCs: A Case for Structured Learning Support. In Proceedings of the European Stakeholder Summit on Experiences and Best Practices In and Around MOOCs, Graz, Austria, 22–24 February 2016; pp. 81–93. [Google Scholar]
- Lepp, M.; Palts, T.; Luik, P.; Papli, K.; Suviste, R.; Säde, M.; Hollo, K.; Vaherpuu, V.; Tõnisson, E. Troubleshooters for Tasks of Introductory Programming MOOCs. Int. Rev. Res. Open Dis. 2018, 19, 56–75. [Google Scholar] [CrossRef]
- Kizilcec, R.F.; Piech, C.; Schneider, E. Deconstructing Disengagement: Analyzing Learner Subpopulations in Massive Open Online Courses. In Proceedings of the Third International Conference on Learning Analytics and Knowledge, Leuven, Belgium, 8–13 April 2013; pp. 170–179. [Google Scholar] [CrossRef]
- DeBoer, J.; Breslow, L. Tracking Progress: Predictors of Students’ Weekly Achievement During a Circuits and Electronics MOOC. In Proceedings of the First ACM Conference on Learning @ Scale Conference, Atlanta, GA, USA, 4–5 March 2014; pp. 169–170. [Google Scholar] [CrossRef]
- Do, C.B.; Chen, Z.; Brandman, R.; Koller, D. Self-driven mastery in massive open online courses. MOOCs Forum 2013, 1, 14–16. [Google Scholar] [CrossRef]
- Auvinen, T. Harmful Study Habits in Online Learning Environments with Automatic Assessment. In Proceedings of the 2015 International Conference on Learning and Teaching in Computing and Engineering, Taipei, Taiwan, 9–12 April 2015; pp. 50–57. [Google Scholar] [CrossRef]
- Pereira, F.; Oliveira, E.; Fernandes, D.; Carvalho, L.S.G.; Junior, H. Otimização e Automação da Predição Precoce do Desempenho de Alunos Que Utilizam Juízes Online: Uma Abordagem Com Algoritmo Genético. In Proceedings of the Simpósio Brasileiro De Informática Na Educação, Brasília, DF, Brasil, 11–14 November 2019; pp. 1451–1460. [Google Scholar]
- Chen, Y.; Zhang, M. MOOC Student Dropout: Pattern and Prevention. In Proceedings of the ACM Turing 50th Celebration Conference, Shanghai, China, 12–14 May 2017; pp. 1–6. [Google Scholar] [CrossRef]
- Chang, R.I.; Hung, Y.H.; Lin, C.F. Survey of learning experiences and influence of learning style preferences on user intentions regarding MOOCs. Br. J. Educ. Technol. 2015, 46, 528–541. [Google Scholar] [CrossRef]
- Zheng, S.; Rosson, M.B.; Shih, P.C.; Carroll, J.M. Understanding Student Motivation, Behaviors and Perceptions in MOOCs. In Proceedings of the 18th ACM Conference on Computer Supported Cooperative Work & Social Computing, Vancouver, BC, Canada, 14–18 March 2015; pp. 1882–1895. [Google Scholar] [CrossRef]
- Hew, K.F.; Cheung, W.S. Students’ and instructors’ use of massive open online courses (MOOCs); motivations and challenges. Educ. Res. Rev. 2014, 12, 45–58. [Google Scholar] [CrossRef]
- Feklistova, L.; Lepp, M.; Luik, P. Completers’ Engagement Clusters in Programming MOOC: The Case of Estonia. In Proceedings of the 12th Annual International Conference of Education, Research and Innovation, Seville, Spain, 11–13 November 2019; pp. 1119–1126. [Google Scholar] [CrossRef]
- Feklistova, L.; Luik, P.; Lepp, M. Clusters of Programming Exercises Difficulties Resolvers in a MOOC. In Proceedings of the 19th European Conference on e-Learning, Berlin, Germany, 28–30 October 2020; pp. 563–569. [Google Scholar] [CrossRef]
- Soderstrom, N.; Bjork, R. Learning versus performance: An integrative review. Perspect. Psychol. Sci. 2015, 10, 176–199. [Google Scholar] [CrossRef]
- Cristea, A.; Alshehri, M.; Alamri, A.; Kayama, M.; Stewart, C.; Shi, L. How Is Learning Fluctuating? FutureLearn MOOCs Fine-Grained Temporal Analysis and Feedback to Teachers and Designers. In Proceedings of the 27th International Conference on Information System Development, Lund, Sweden, 22–24 August 2018; Available online: https://dro.dur.ac.uk/25775/1/25775.pdf (accessed on 25 May 2021).
- Chen, C.; Sonnert, G.; Sadler, P.M.; Malan, D.J. Computational thinking and assignment resubmission predict persistence in a computer science MOOC. J. Comput. Assist. Learn. 2020, 36, 581–594. [Google Scholar] [CrossRef]
- de Barba, P.G.; Kennedy, G.E.; Ainley, M.D. The role of students’ motivation and participation in predicting performance in a MOOC. J. Comput. Assist. Learn. 2016, 32, 218–231. [Google Scholar] [CrossRef]
- Abbakumov, D.; Desmet, P.; Van den Noortgate, W. Measuring student’s proficiency in MOOCs: Multiple attempts extensions for the Rasch model. Heliyon 2018, 4, 1–15. [Google Scholar] [CrossRef] [Green Version]
- Rushkin, I.; Chuang, I.; Tingley, D. Modelling and using response times in online courses. J. Learn. Anal. 2019, 6, 76–89. [Google Scholar] [CrossRef] [Green Version]
- Karavirta, V.; Korhonen, A.; Malmi, L. On the use of resubmissions in automatic assessment systems. Comput. Sci. Educ. 2006, 16, 229–240. [Google Scholar] [CrossRef]
- Malekian, D.; Bailey, J.; Kennedy, G. Prediction of Students’ Assessment Readiness in Online Learning Environments: The Sequence Matters. In Proceedings of the Tenth International Conference on Learning Analytics and Knowledge, Frankfurt, Germany, 23–27 March 2020; pp. 382–391. [Google Scholar] [CrossRef] [Green Version]
- Sharma, K.; Kidzinski, Ł.; Jermann, P.; Dillenbourg, P. Towards Predicting Success in MOOCs: Programming Assignments. In Proceedings of the European Stakeholder Summit on Experiences and Best Practices in and around MOOCs, Graz, Austria, 22–24 February 2016; pp. 135–147. [Google Scholar]
- Edwards, S.H.; Snyder, J.; Pérez-Quiñones, M.A.; Allevato, A.; Kim, D.; Tretola, B. Comparing Effective and Ineffective Behaviors of Student Programmers. In Proceedings of the Fifth International Workshop on Computing Education Research Workshop, Berkeley, CA, USA, 10–11 August 2009; pp. 3–14. [Google Scholar] [CrossRef]
- Kennedy, G.; Coffrin, C.; de Barba, P.; Corrin, L. Predicting Success: How Learners’ Prior Knowledge, Skills and Activities Predict MOOC Performance. In Proceedings of the Fifth International Conference on Learning Analytics and Knowledge, Poughkeepsie, NY, USA, 16–20 March 2015; pp. 136–140. [Google Scholar] [CrossRef]
- Pereira, F.D.; Oliveira, E.H.T.; Oliveira, D.B.F.; Cristea, A.I.; Carvalho, L.S.G.; Fonseca, S.C.; Toda, A.; Isotani, S. Using learning analytics in the Amazonas: Understanding students’ behaviour in introductory programming. Br. J. Educ. Technol. 2020, 51, 955–972. [Google Scholar] [CrossRef]
- Anderson, A.; Huttenlocher, D.; Kleinberg, J.; Leskovec, J. Engaging with Massive Online Courses. In Proceedings of the 23rd International Conference on World Wide Web, Seoul, Korea, 7–11 April 2014; pp. 687–698. [Google Scholar] [CrossRef] [Green Version]
- Byrne, P.; Lyons, G. The Effect of Student Attributes on Success in Programming. In Proceedings of the 6th Annual SIGCSE Conference on Innovation and Technology in Computer Science Education, Canterbury, UK, 25–27 June 2001; pp. 49–52. [Google Scholar] [CrossRef]
- Deng, R.; Benckendorff, P.; Gannaway, D. Linking learner factors, teaching context, and engagement patterns with MOOC learning outcomes. J. Comput. Assist. Learn. 2020, 36, 688–708. [Google Scholar] [CrossRef]
- Tseng, S.; Tsao, Y.-W.; Yu, L.-C.; Chan, C.-L.; Lai, K.R. Who will pass? Analyzing learner behaviors in MOOCs. Res. Pract. Technol. Enhanc. Learn. 2016, 11, 1–11. [Google Scholar] [CrossRef] [Green Version]
- Shi, L.; Cristea, A. In-depth exploration of engagement patterns in MOOCs. In Web Information Systems Engineering—WISE 2018; Hacid, H., Cellary, W., Wang, H., Paik, H.Y., Zhou, R., Eds.; Springer: Cham, Switzerland, 2018; Volume 11234, pp. 395–409. [Google Scholar] [CrossRef] [Green Version]
- Arora, S.; Goel, M.; Sabitha, A.S.; Mehrotra, D. Learner groups in massive open online courses. Am. J. Distance Educ. 2017, 31, 80–97. [Google Scholar] [CrossRef]
- Koedinger, K.R.; Kim, J.; Jia, J.Z.; McLaughlin, E.A.; Bier, N.L. Learning Is Not a Spectator Sport: Doing Is Better Than Watching for Learning From a MOOC. In Proceedings of the Second (2015) ACM Conference on Learning @ Scale, Vancouver, BC, Canada, 14–18 March 2015; pp. 111–120. [Google Scholar] [CrossRef] [Green Version]
- Kahan, T.; Soffer, T.; Nachmias, R. Types of participant behavior in a massive open online course. Int. Rev. Res. Open Dis. 2017, 18, 1–18. [Google Scholar] [CrossRef] [Green Version]
- Khalil, M.; Ebner, M. Clustering patterns of engagement in massive open online courses (MOOCs): The use of learning analytics to reveal student categories. J. Comput. High. 2017, 29, 114–132. [Google Scholar] [CrossRef]
- Wilkowski, J.; Deutsch, A.; Russell, D.M. Student Skill and Goal Achievement in the Mapping with Google MOOC. In Proceedings of the First ACM Conference on Learning @ Scale Conference, Atlanta, GA, USA, 4–5 March 2014; pp. 3–10. [Google Scholar] [CrossRef] [Green Version]
- Murphy, C.; Kaiser, G.; Loveland, K.; Hasan, S. Retina: Helping Students and Instructors Based on Observed Programming Activities. In Proceedings of the 40th ACM Technical Symposium on Computer Science Education, Chattanooga, TN, USA, 4–7 March 2009; pp. 178–182. [Google Scholar] [CrossRef] [Green Version]
- Nelimarkka, M.; Hellas, A. Social Help-Seeking Strategies in a Programming MOOC. In Proceedings of the 49th ACM Technical Symposium on Computer Science Education, Baltimore, MD, USA, 21–24 February 2018; pp. 116–121. [Google Scholar] [CrossRef] [Green Version]
- Carter, J.; Dewan, P.; Pichiliani, M. Towards Incremental Separation of Surmountable and Insurmountable Programming Difficulties. In Proceedings of the 46th ACM Technical Symposium on Computer Science, Kansas City, MO, USA, 4–7 March 2015; pp. 241–246. [Google Scholar] [CrossRef]
- Estey, A.; Coady, Y. Can Interaction Patterns with Supplemental Study Tools Predict Outcomes in CS1? In Proceedings of the 2016 ACM Conference on Innovation and Technology in Computer Science Education, Arequipa, Peru, 11–13 July 2016; pp. 236–241. [Google Scholar] [CrossRef]
- Thomas, L.; Ratcliffe, M.; Woodbury, J.; Jarman, E. Learning Styles and Performance in the Introductory Programming Sequence. In Proceedings of the 33rd SIGCSE Technical Symposium on Computer Science Education, Cincinnati, KY, USA,, 27 February–3 March 2002; pp. 33–37. [Google Scholar] [CrossRef] [Green Version]
- Lepp, M.; Luik, P.; Palts, T.; Papli, K.; Suviste, R.; Säde, M.; Tõnisson, E. MOOC in Programming: A Success Story. In Proceedings of the 12th International Conference on e-Learning, Orlando, FL, USA, 1–2 June 2017; pp. 138–147. [Google Scholar]
- Luik, P.; Feklistova, L.; Lepp, M.; Tõnisson, E.; Suviste, R.; Gaiduk, M.; Säde, M.; Palts, T. Participants and Completers in Programming MOOCs. Educ. Inf. Technol. 2019, 24, 3689–3706. [Google Scholar] [CrossRef]
- Luik, P.; Suviste, R.; Lepp, M.; Palts, T.; Tõnisson, E.; Säde, M.; Papli, K. What Motivates Enrolment in Programming MOOCs? Br. J. Educ. Technol. 2019, 50, 153–165. [Google Scholar] [CrossRef] [Green Version]
- Thonny. Python IDE for Beginners. Available online: https://thonny.org/ (accessed on 25 August 2021).
- Frost, J. Guidelines for Removing and Handling Outliers in Data. Available online: https://statisticsbyjim.com/basics/remove-outliers/ (accessed on 25 August 2021).
- Rõõm, M.; Luik, P.; Lepp, M. Learners’ Sequence of Course Activities During Computer Programming MOOC. In Proceedings of the 19th European Conference on e-Learning, Berlin, Germany, 28–30 October 2020; pp. 452–459. [Google Scholar] [CrossRef]
- Rõõm, M.; Luik, P.; Lepp, M. Learners’ Use of Time in MOOCs About Programming. In Proceedings of the 12th International Conference on Education and New Learning Technologies, Online Conference, 6–7 July 2020; pp. 4380–4387. [Google Scholar] [CrossRef]
- Hagan, D.; Markham, S. Does It Help to Have Some Programming Experience Before Beginning a Computing Degree Program? In Proceedings of the 5th Annual SIGCSE/SIGCUE ITiCSE Conference on Innovation and Technology in Computer Science Education, Helsinki, Finland, 11–13 July 2000; pp. 25–28. [Google Scholar] [CrossRef]
- Morrison, M.; Newman, T.S. A Study of the Impact of Student Background and Preparedness on Outcomes in CS I. In Proceedings of the Thirty-Second SIGCSE Technical Symposium on Computer Science Education, Charlotte, NC, USA, 21–25 February 2001; pp. 179–183. [Google Scholar] [CrossRef]


| All Participants | Non-Completers | Completers | |
|---|---|---|---|
| Sample size | 1065 | 292 | 773 |
| Female | 54.3% | 53.4% | 54.7% |
| Average age | 33.0 (SD = 10.81) | 36.4 (SD = 10.47) | 33.2 (SD = 10.94) |
| Age range | 10–70 | 10–60 | 10–70 |
| Non-Completers | Completers | Kruskal–Wallis H | ||
|---|---|---|---|---|
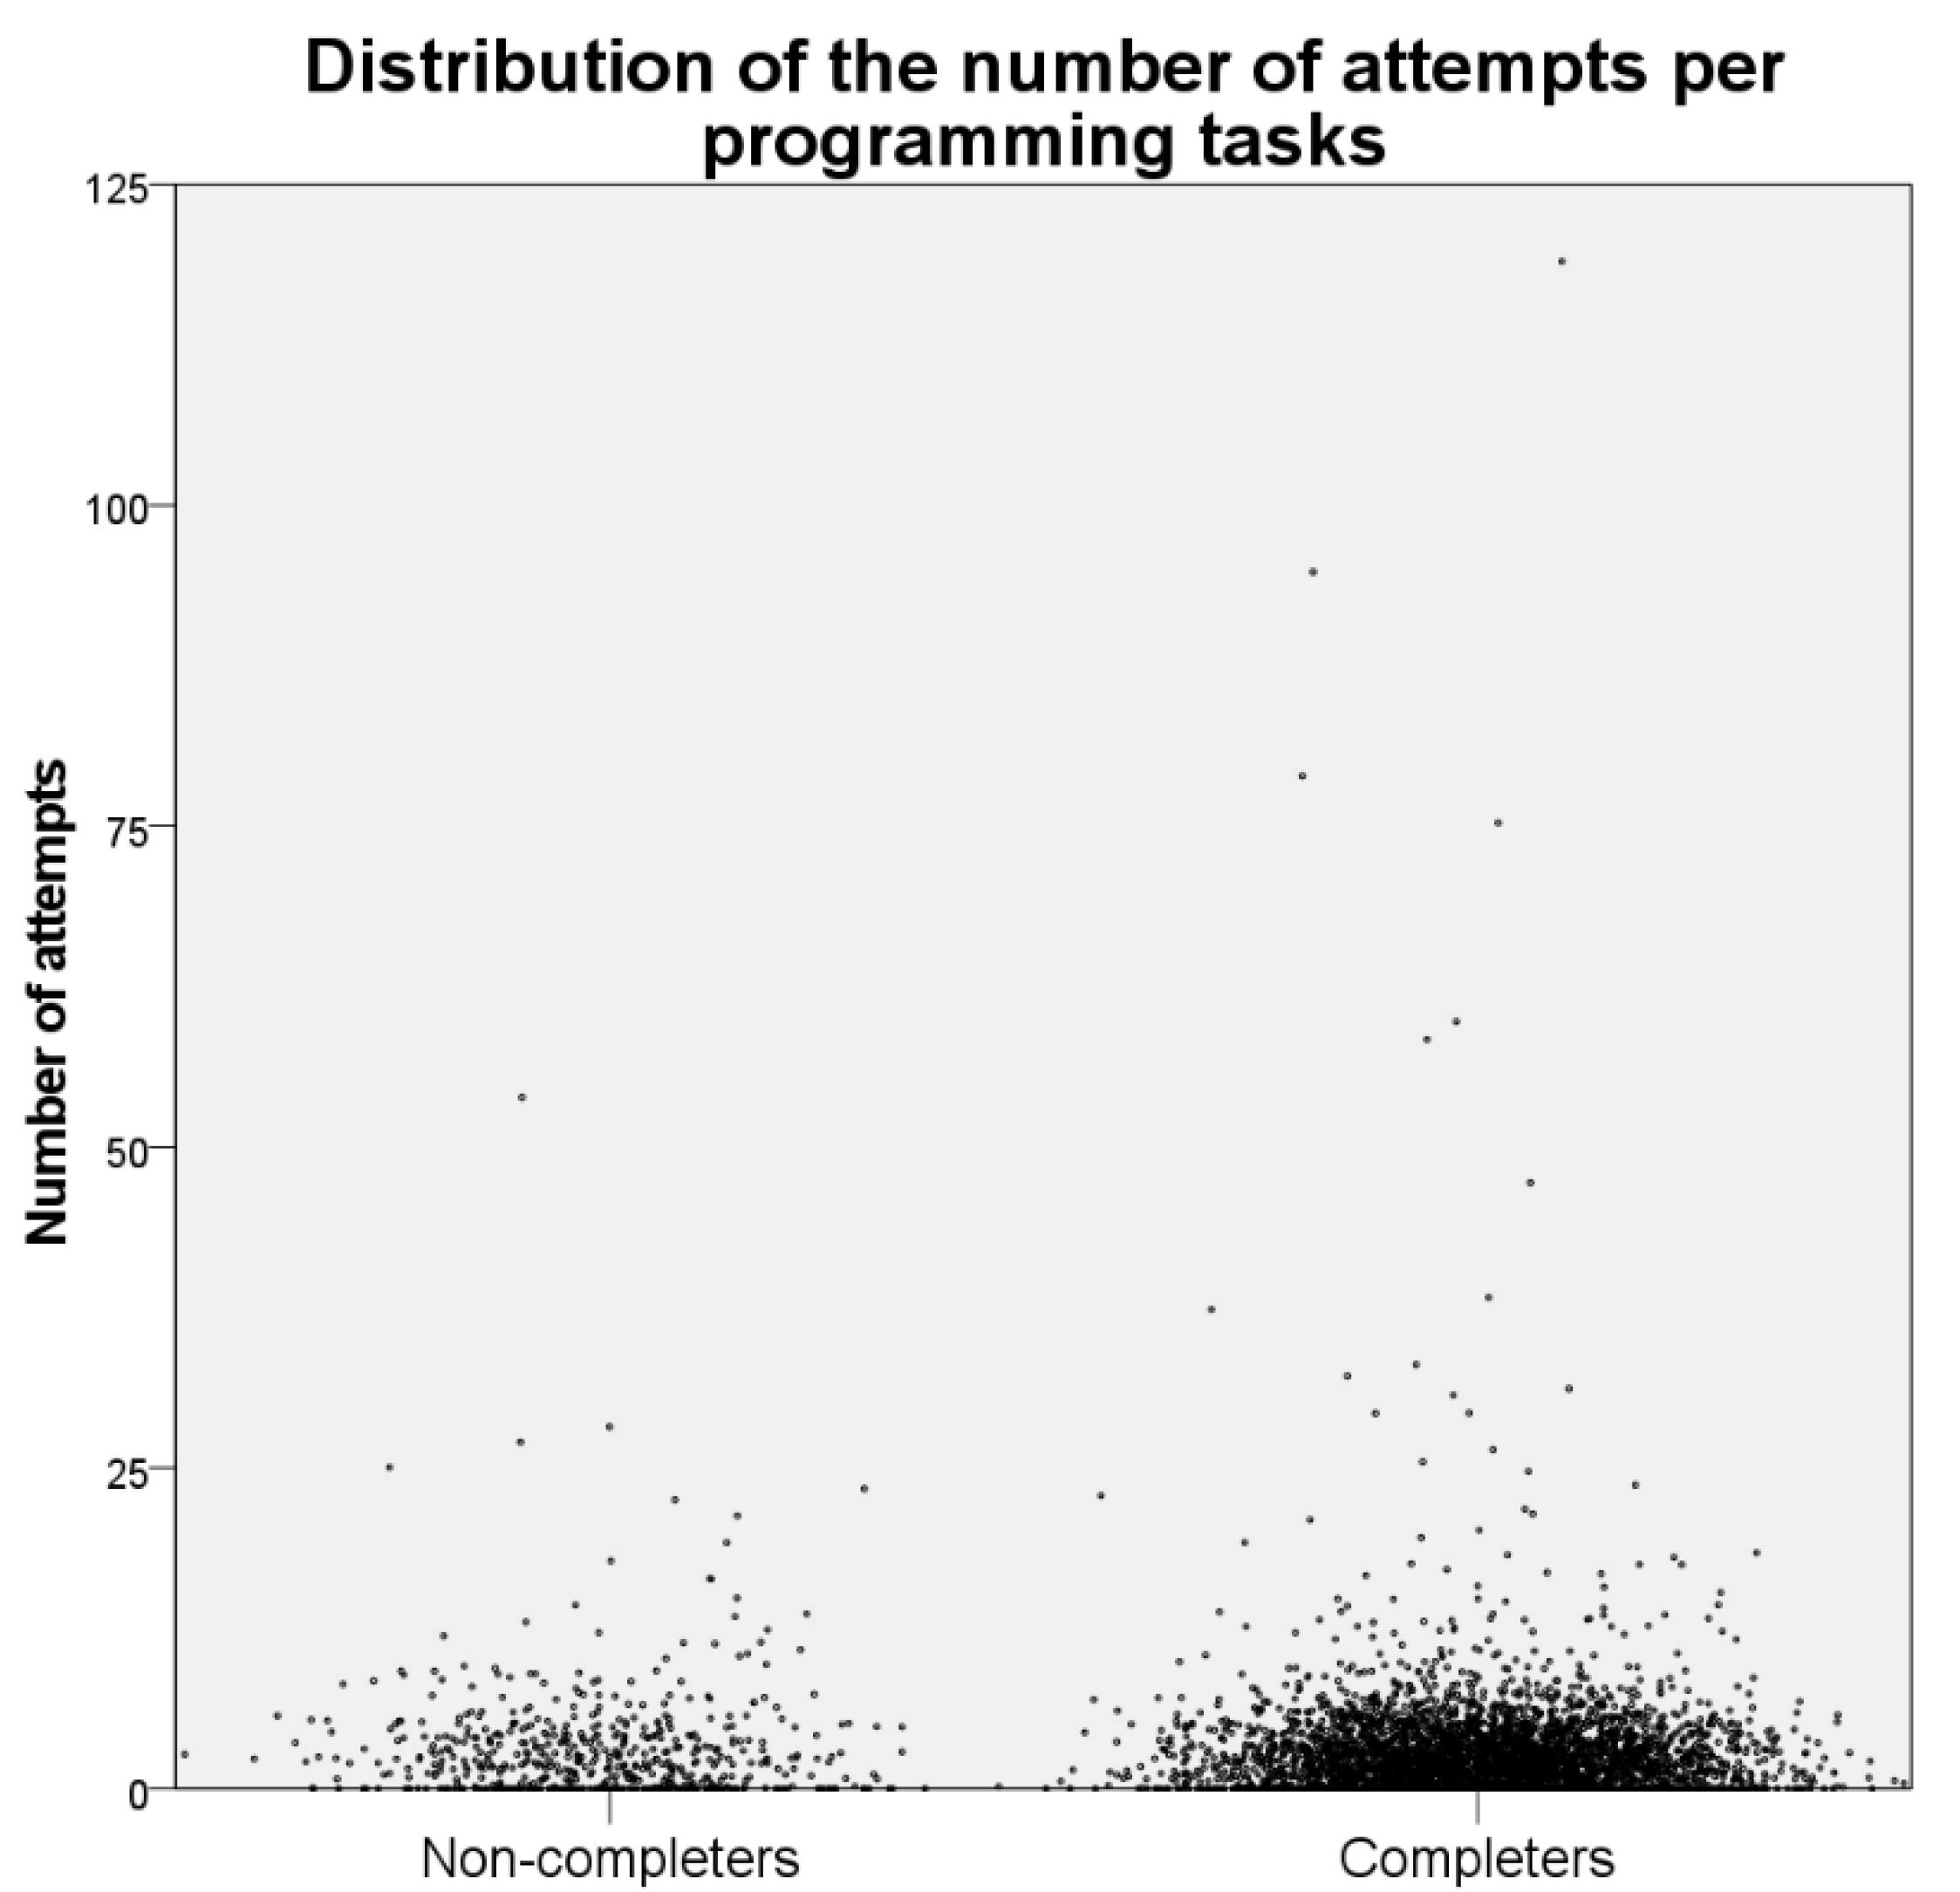
| Attempts per programming task | n | 231 | 773 | |
| range | 1−55 | 1−121 | ||
| mean (SD) | 2.67 (4.107) | 1.97 (3.902) | 46.973 *** | |
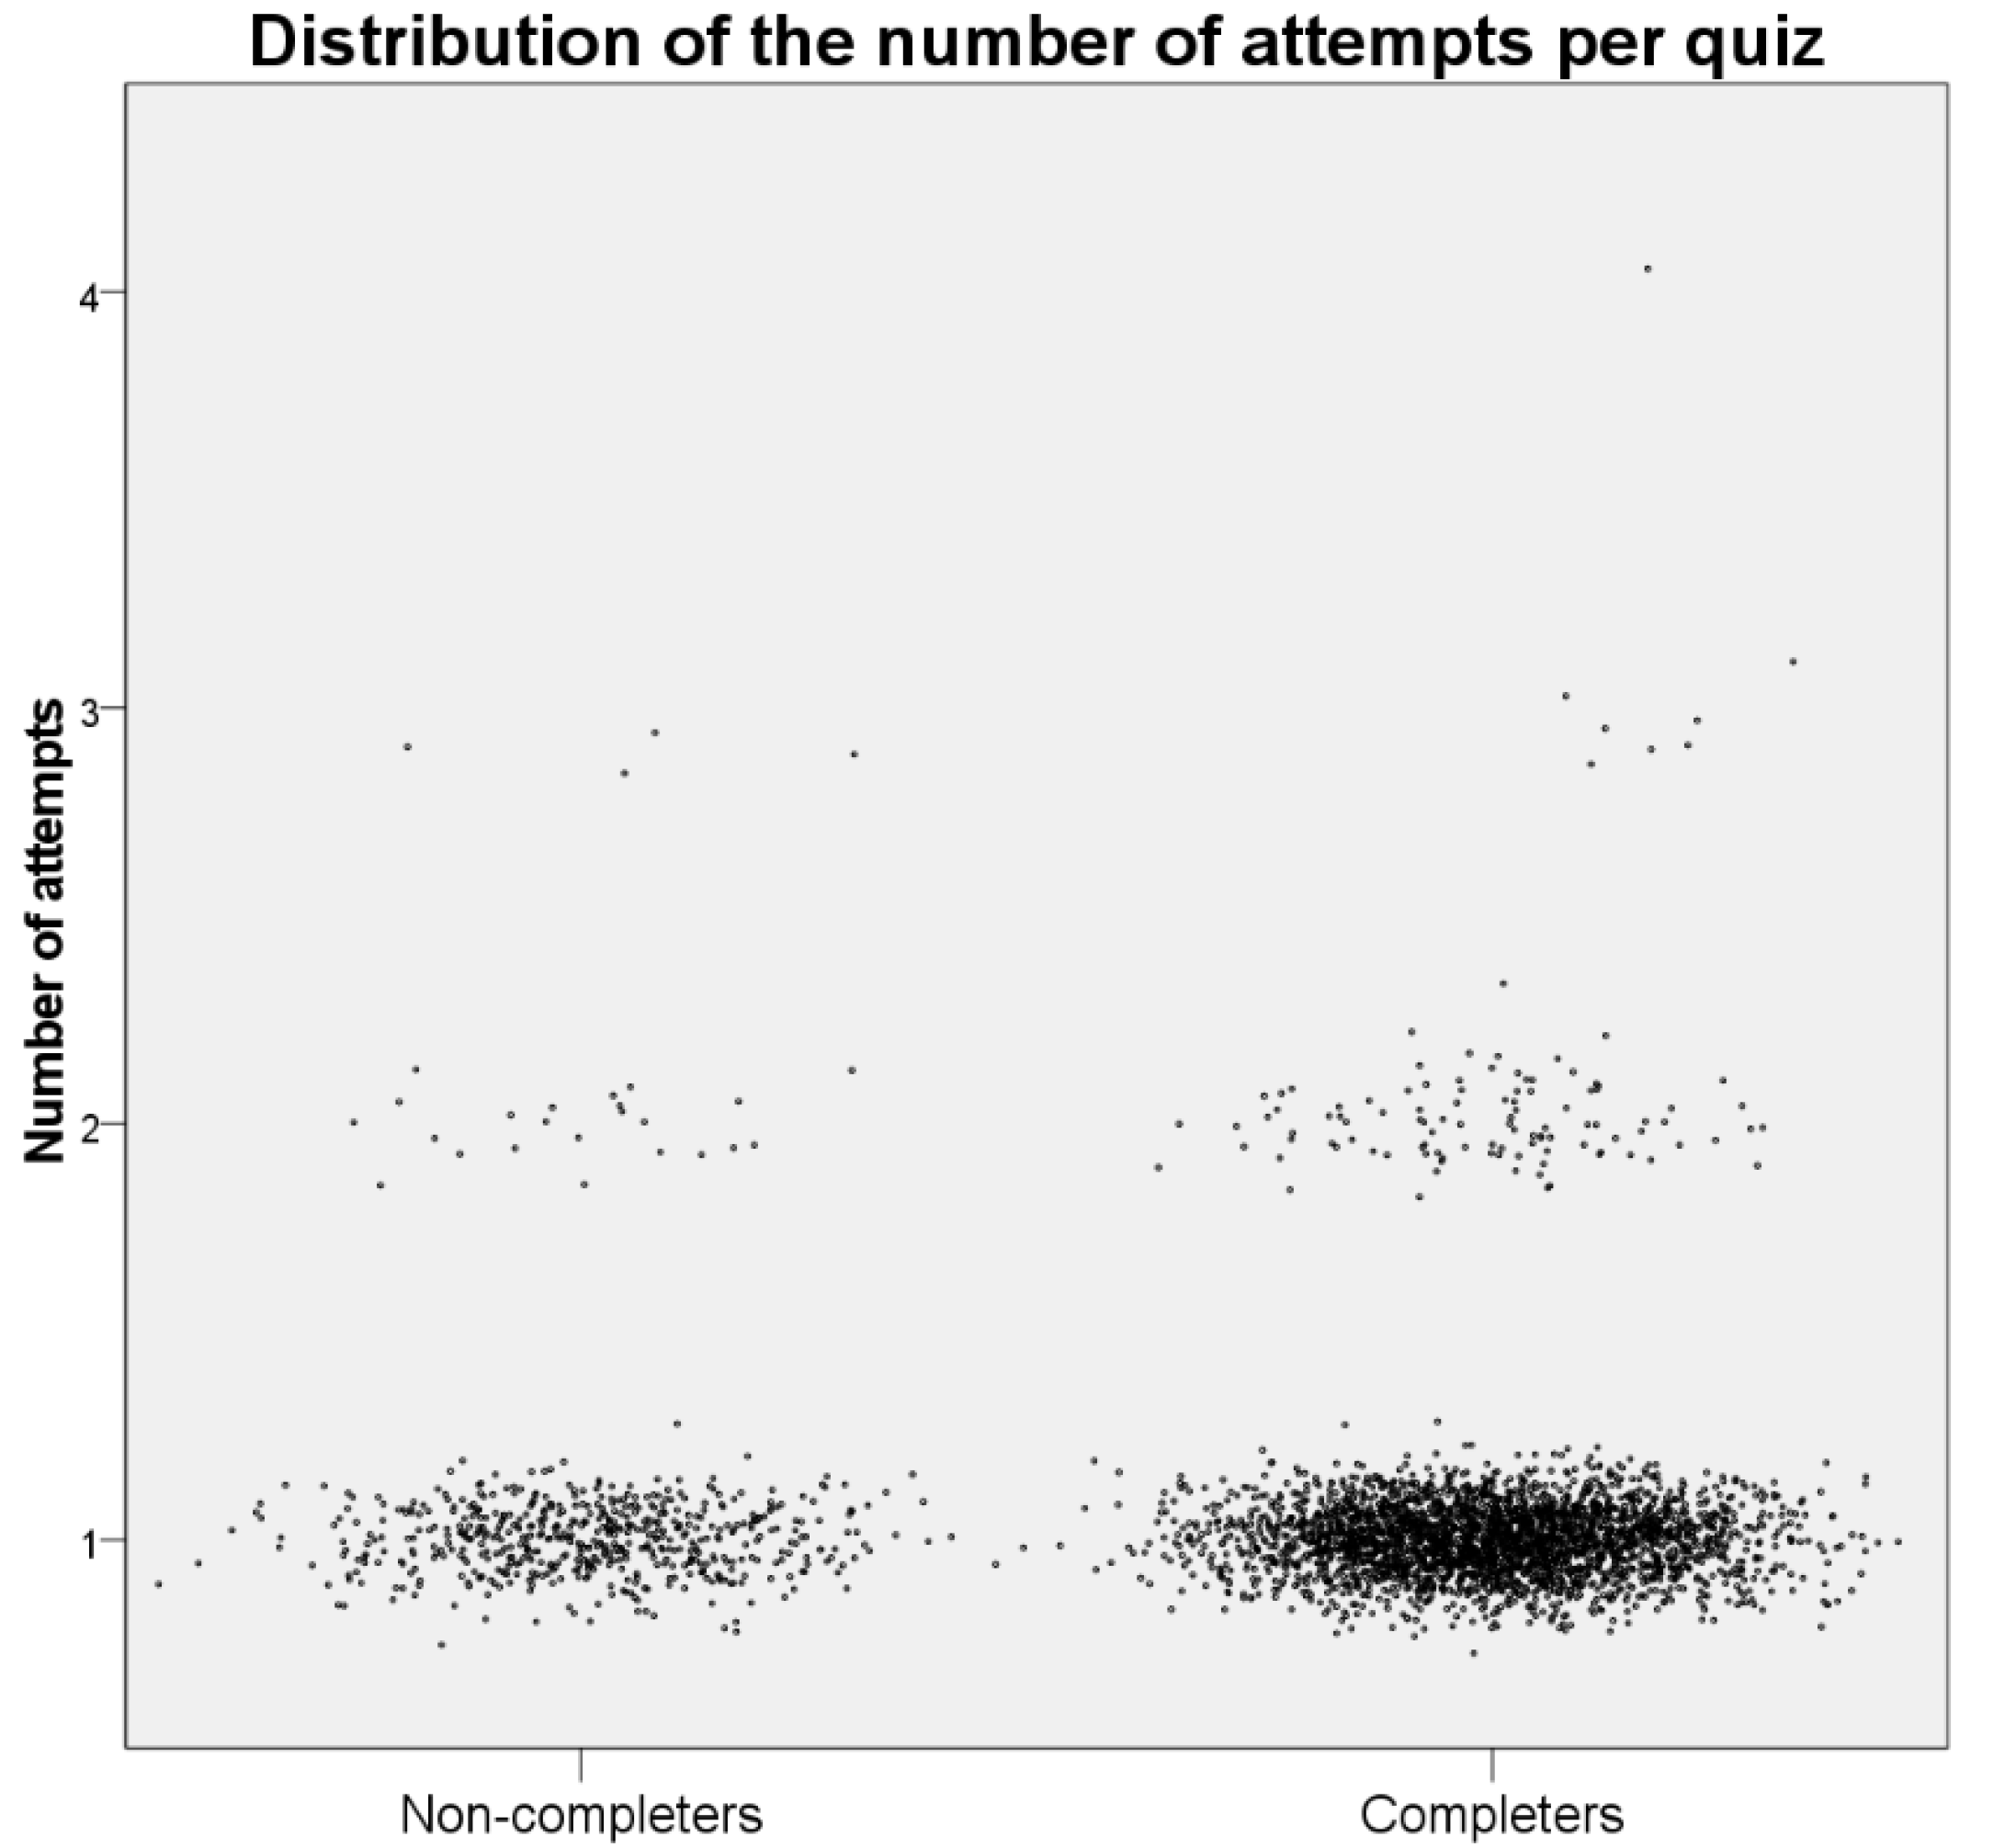
| Attempts per quiz | n | 288 | 773 | |
| range | 1−3 | 1−4 | ||
| mean (SD) | 1.05 (0.251) | 1.04 (0.211) | 1.130 | |
| Scores per quiz | n | 288 | 773 | |
| range | 0−10 | 9−10 | ||
| mean (SD) | 9.06 (2.423) | 9.86 (0.345) | 85.037 *** |
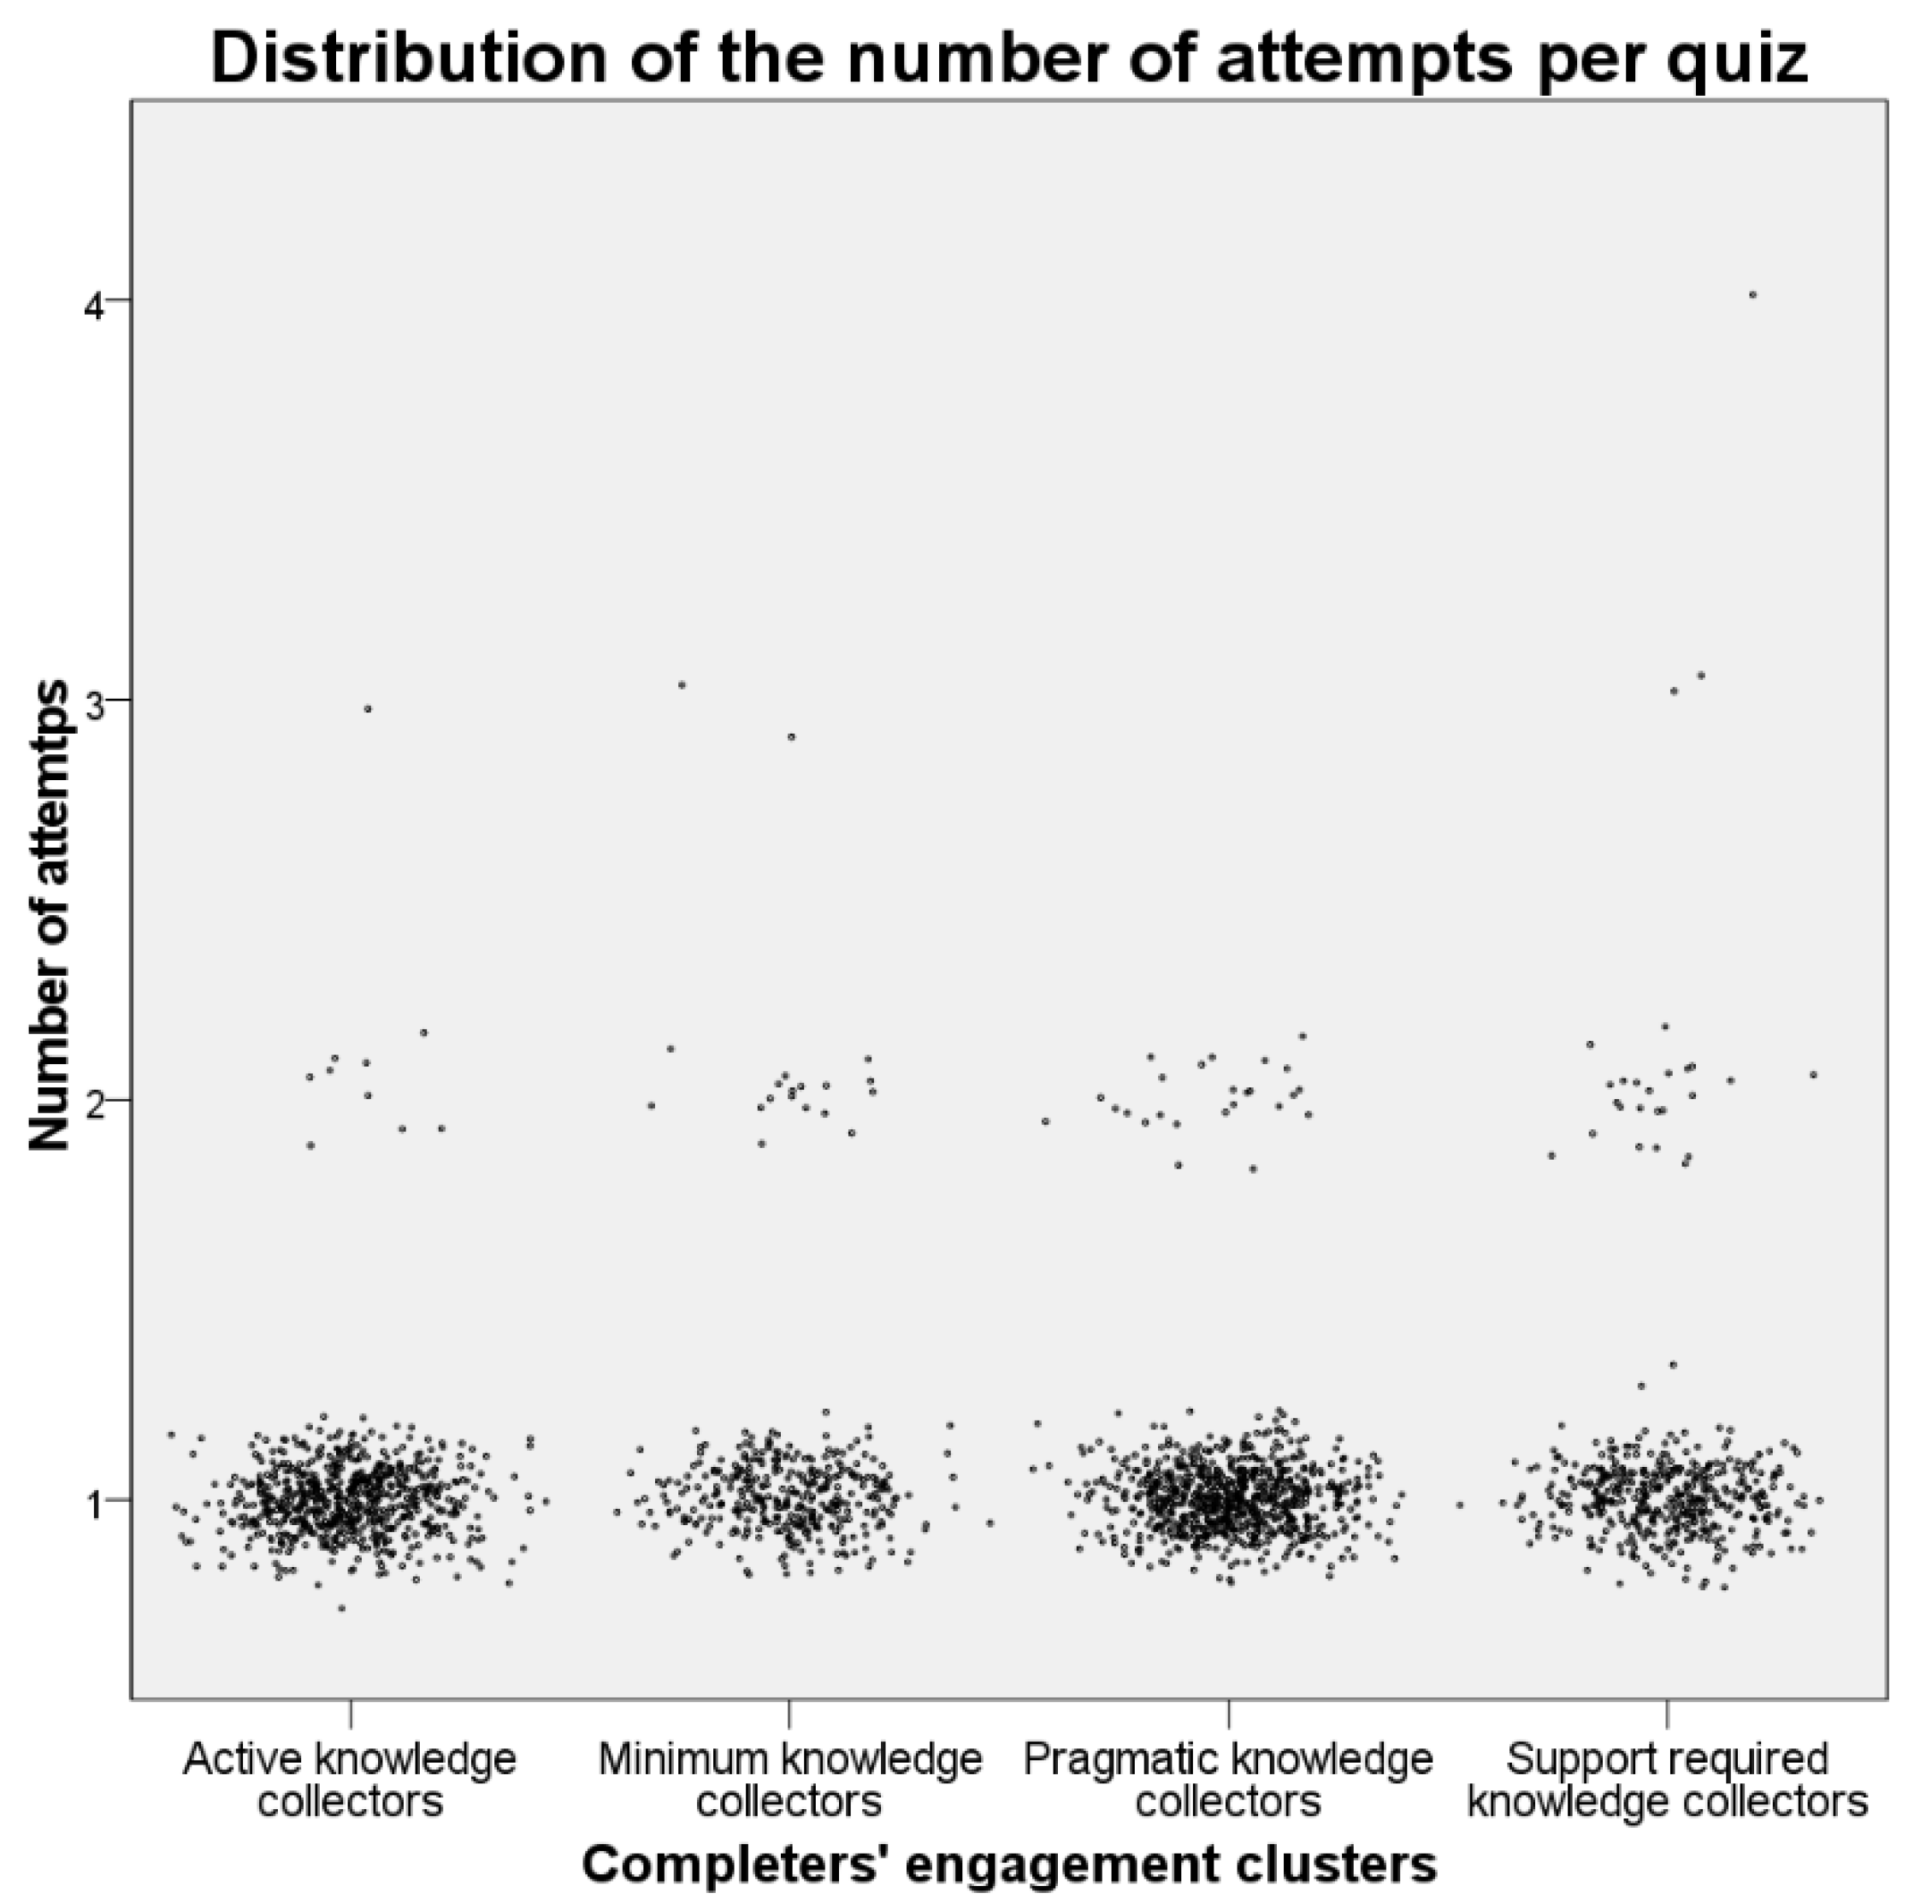
| Active Knowledge Collectors (n = 169) | Minimum Knowledge Collectors (n = 95) | Pragmatic Knowledge Collectors (n = 197) | Support-Required Knowledge Collectors (n = 114) | Kruskal–Wallis H | ||
|---|---|---|---|---|---|---|
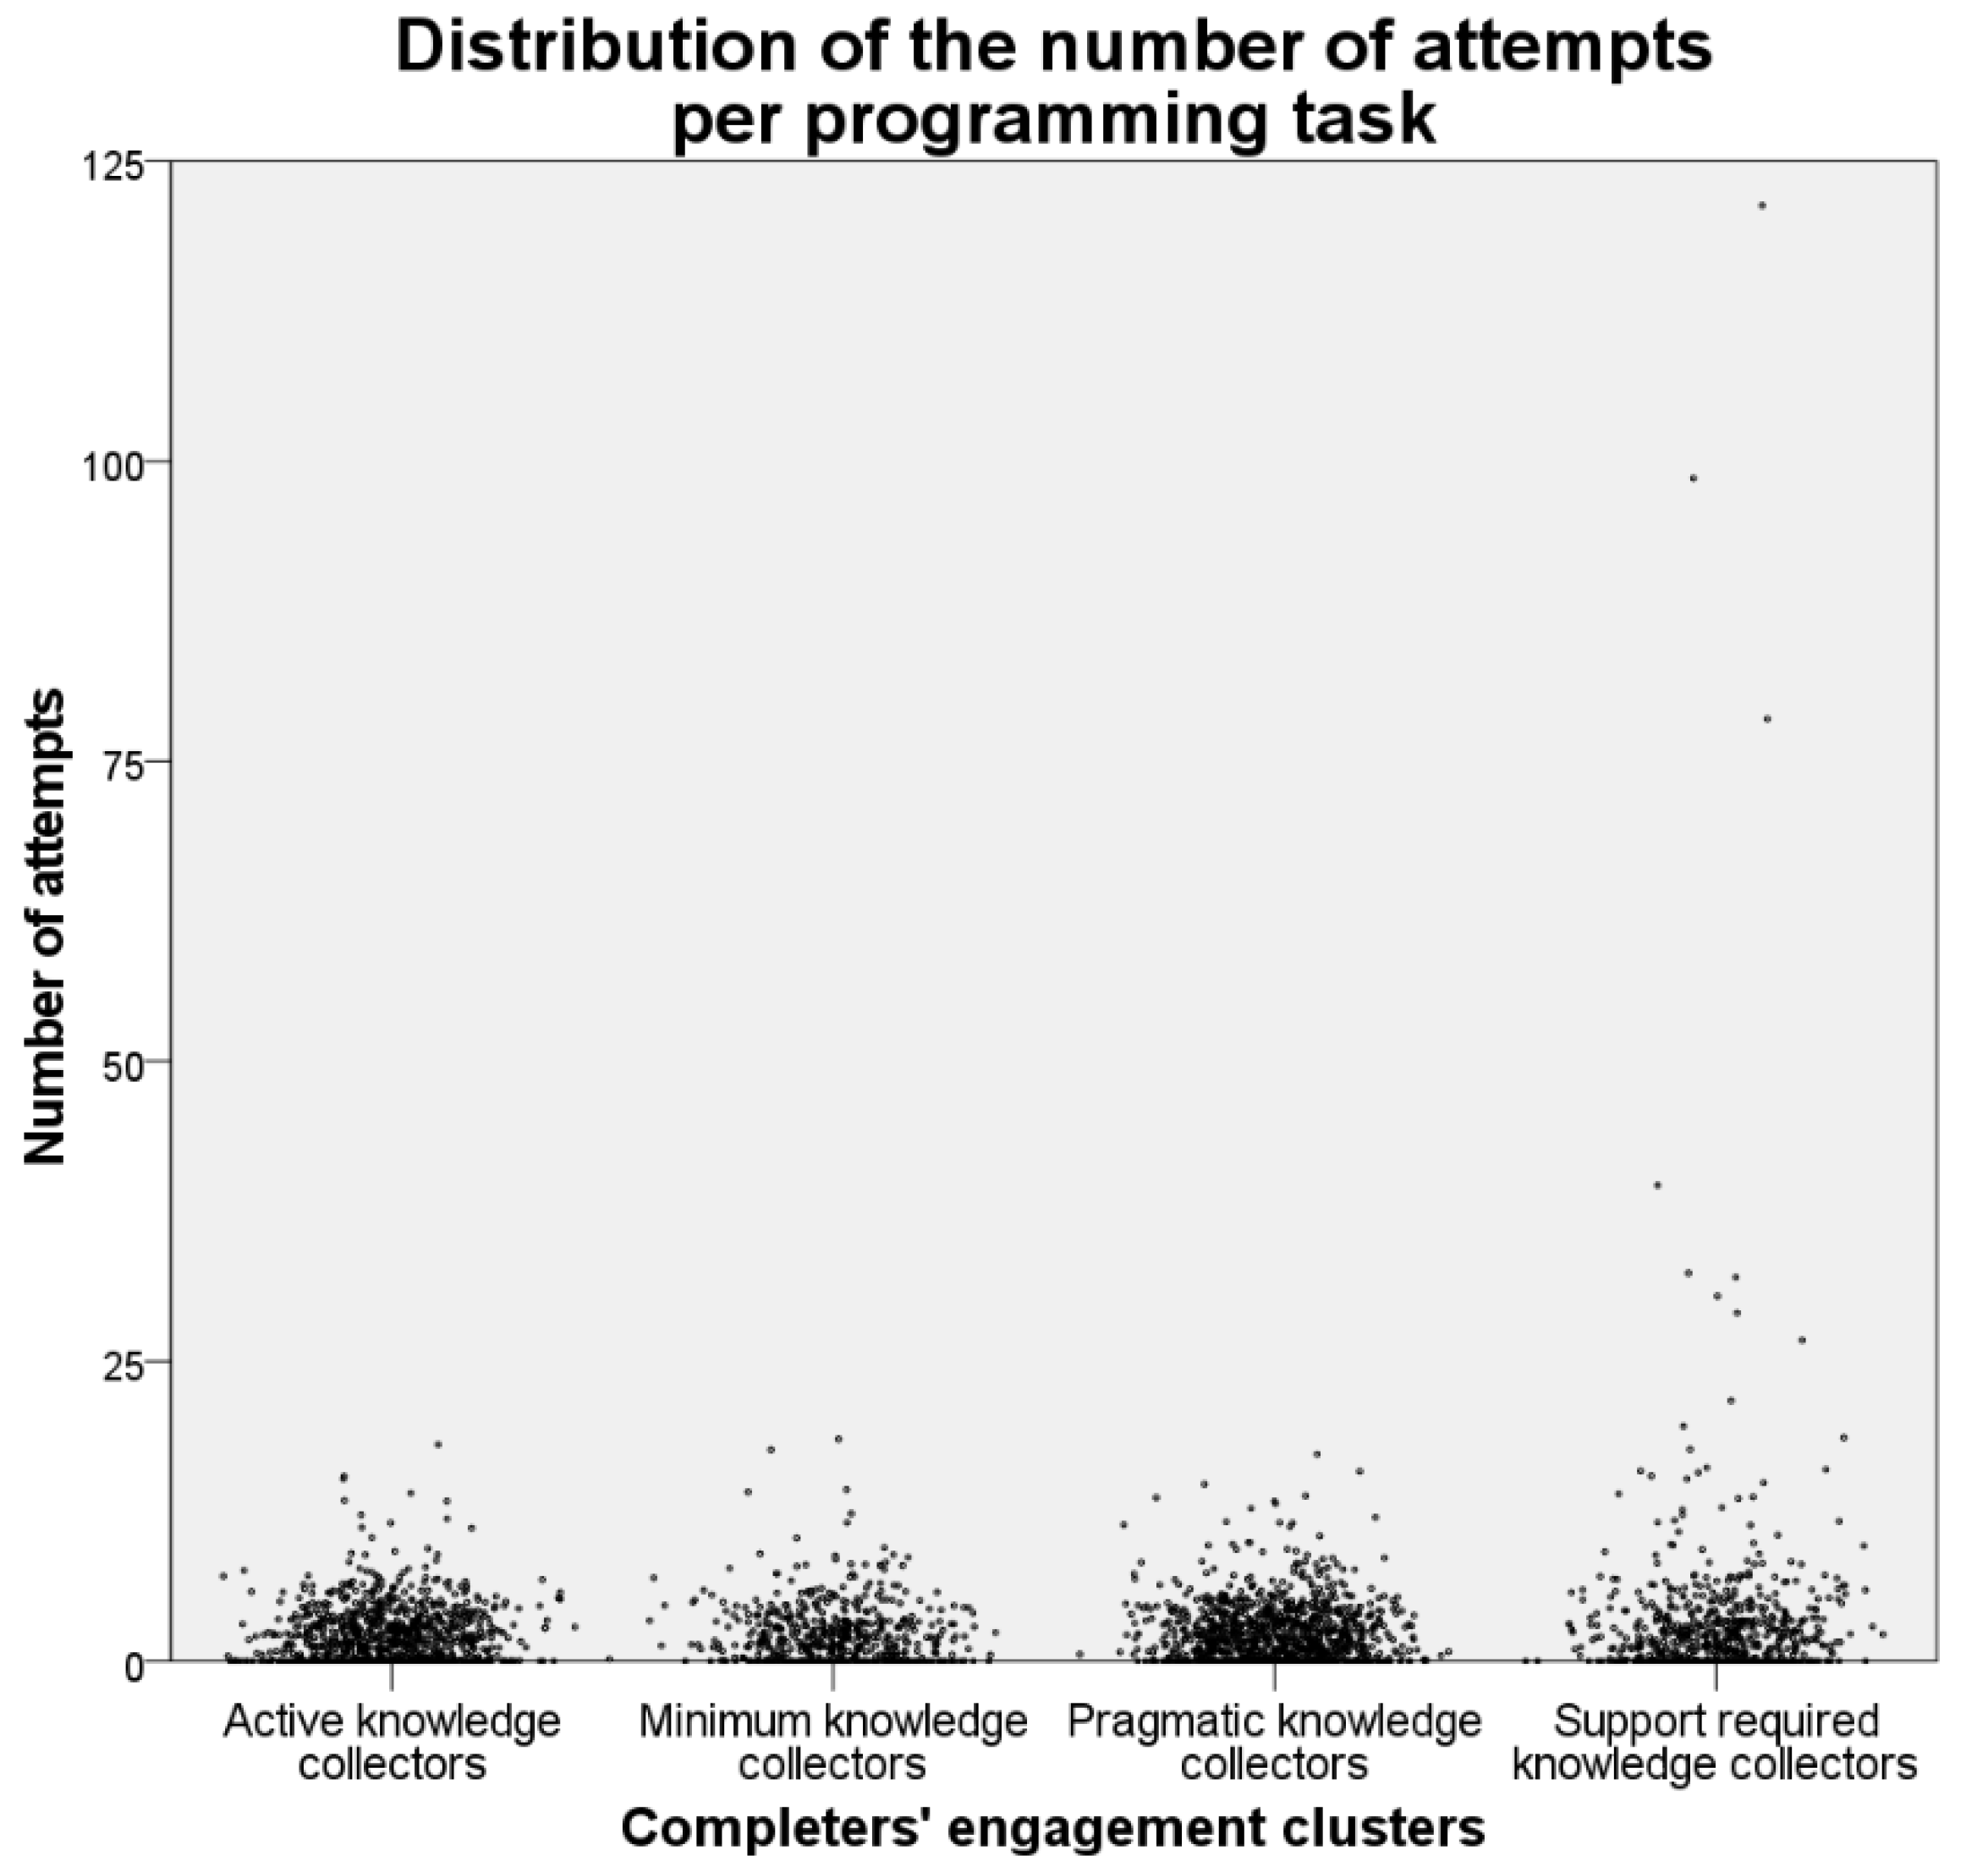
| Attempts per programming task | range | 1−19 | 1−18 | 1−15 | 1−121 | |
| mean (SD) | 1.62 (1.638) | 1.77 (1.811) | 1.63 (1.656) | 2.91 (7.514) | 45.500 *** | |
| Attempts per quiz | range | 1−3 | 1−3 | 1−2 | 1−4 | |
| mean (SD) | 1.02 (0.138) | 1.06 (0.251) | 1.03 (0.175) | 1.07 (0.289) | 17.662 *** | |
| Scores per quiz | mean (SD) | 9.92 (0.267) | 9.81 (0.394) | 9.90 (0.294) | 9.82 (0.381) | 47.774 *** |
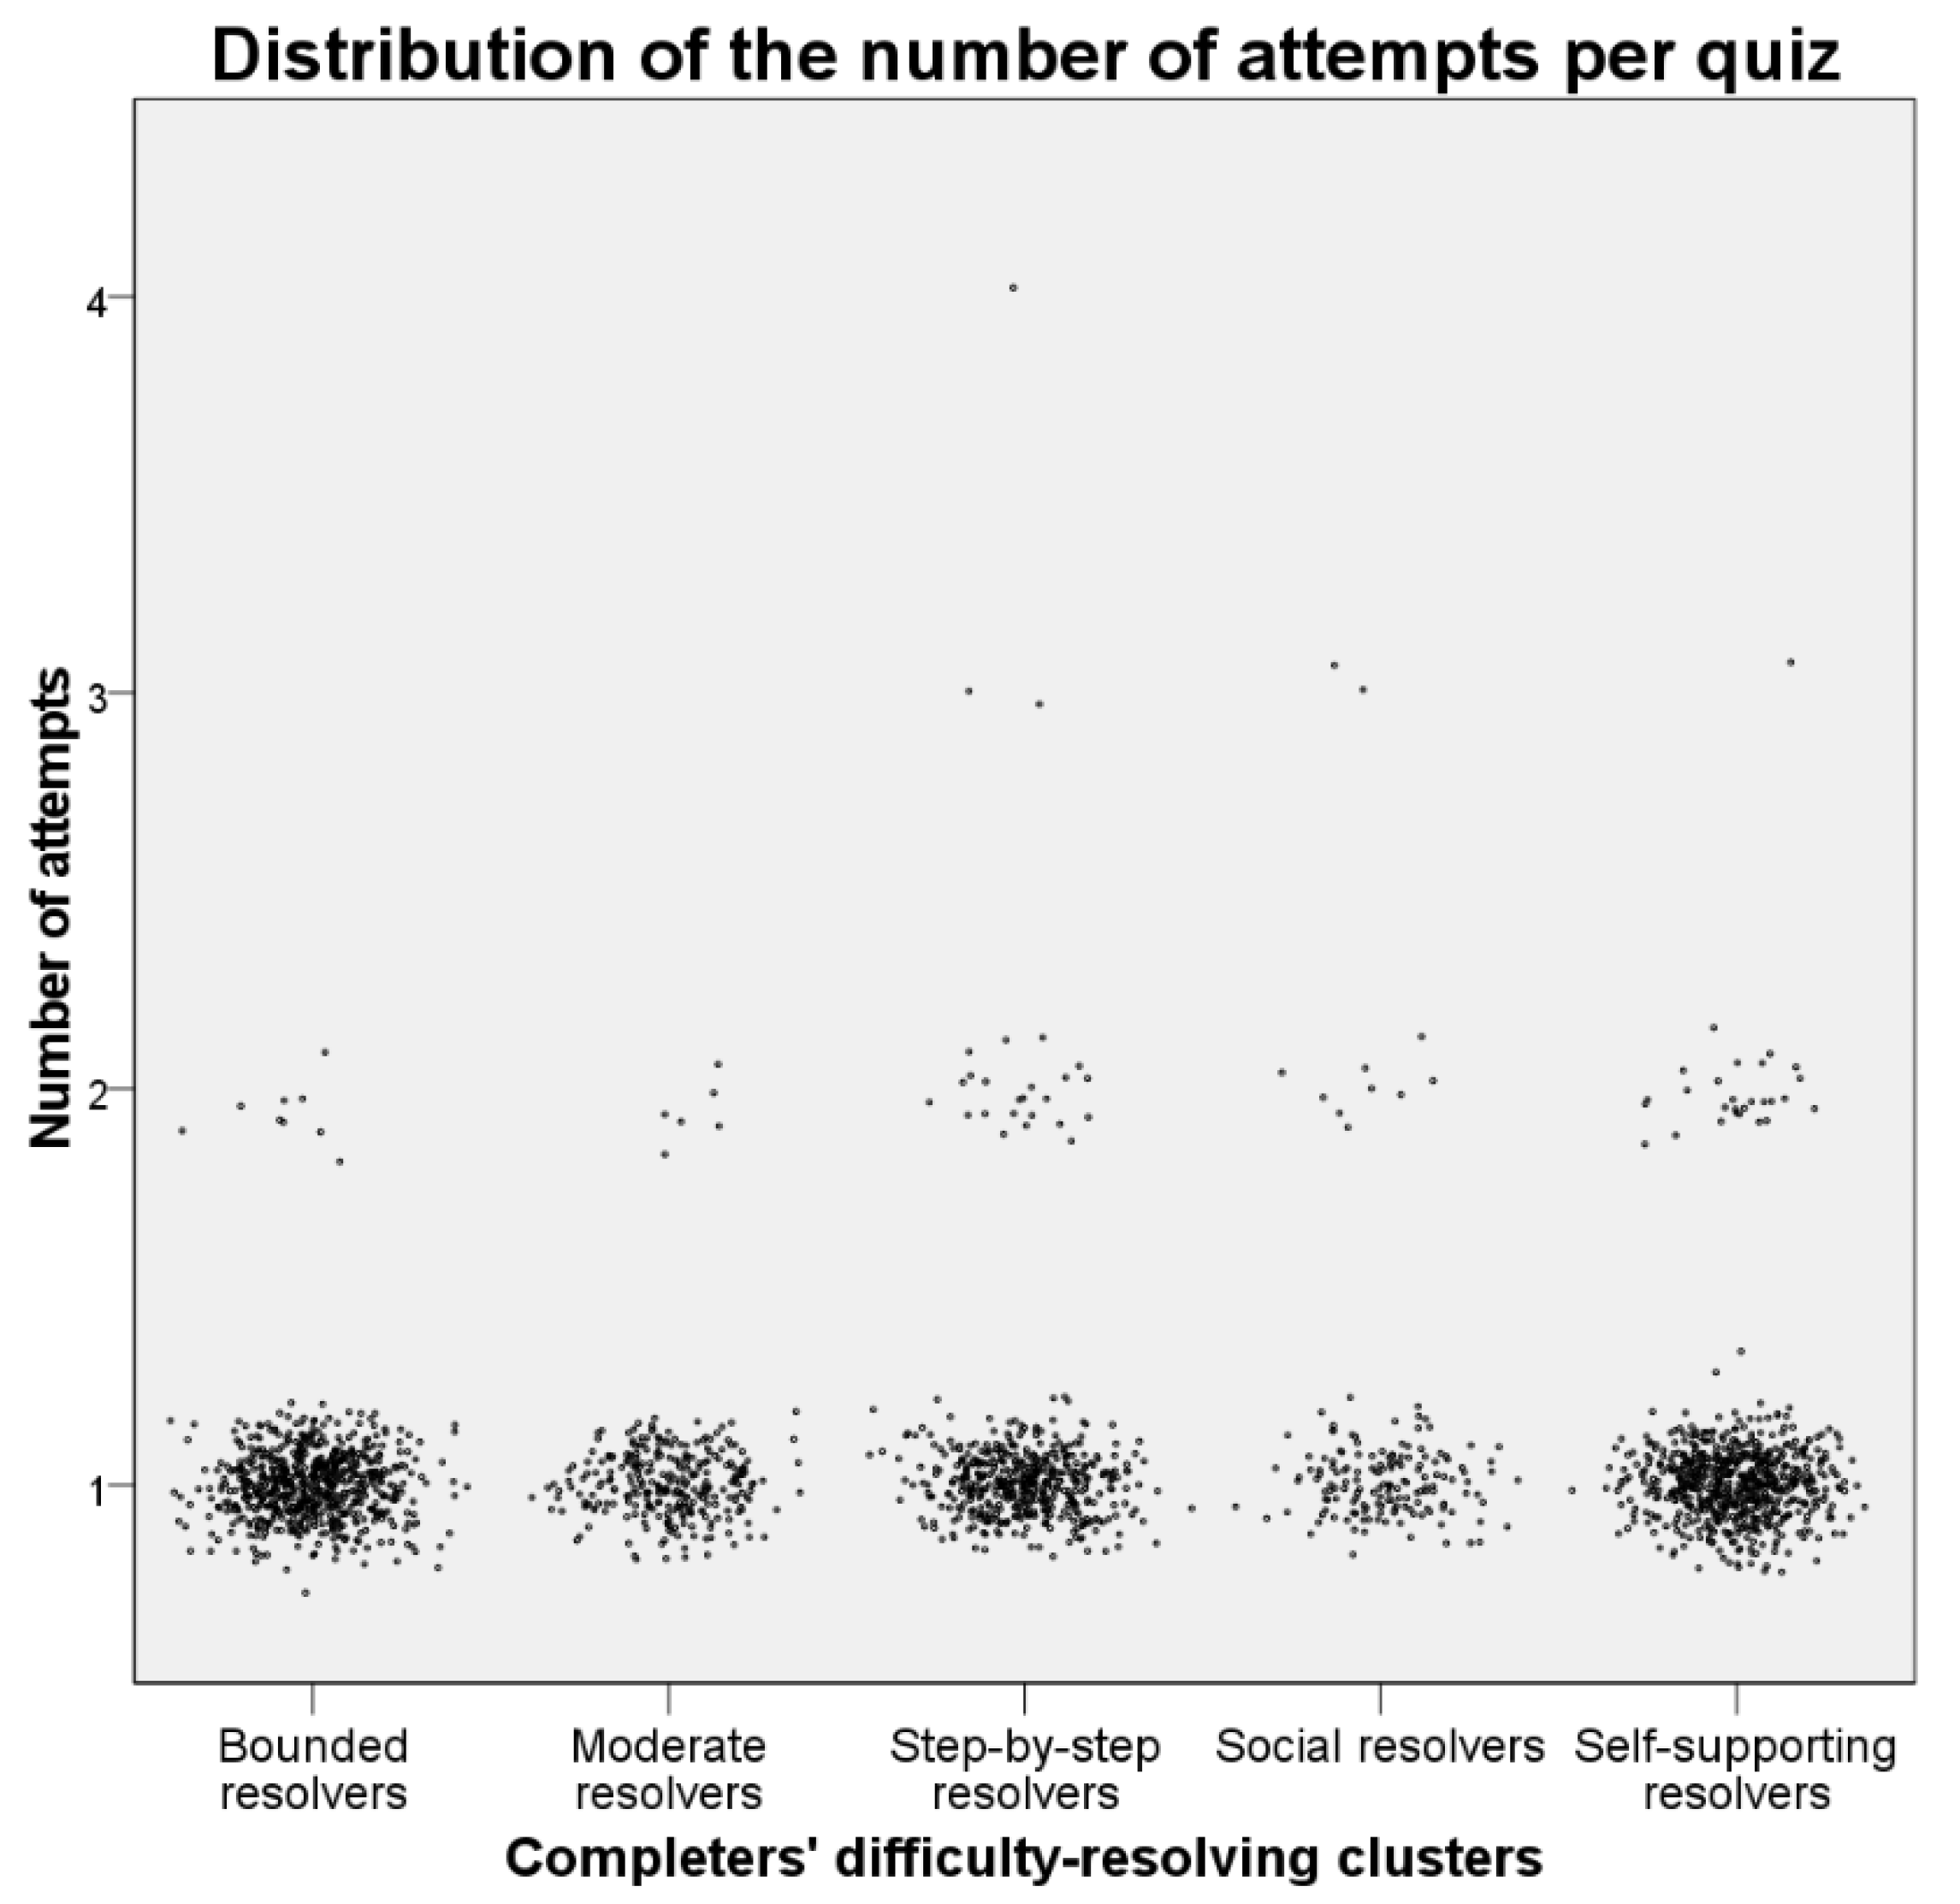
| Bounded Resolvers (n = 170) | Moderate Resolvers (n = 72) | Step-by-step Resolvers (n = 123) | Social Resolvers (n = 42) | Self-Supporting Resolvers (n = 168) | Kruskal–Wallis H | ||
|---|---|---|---|---|---|---|---|
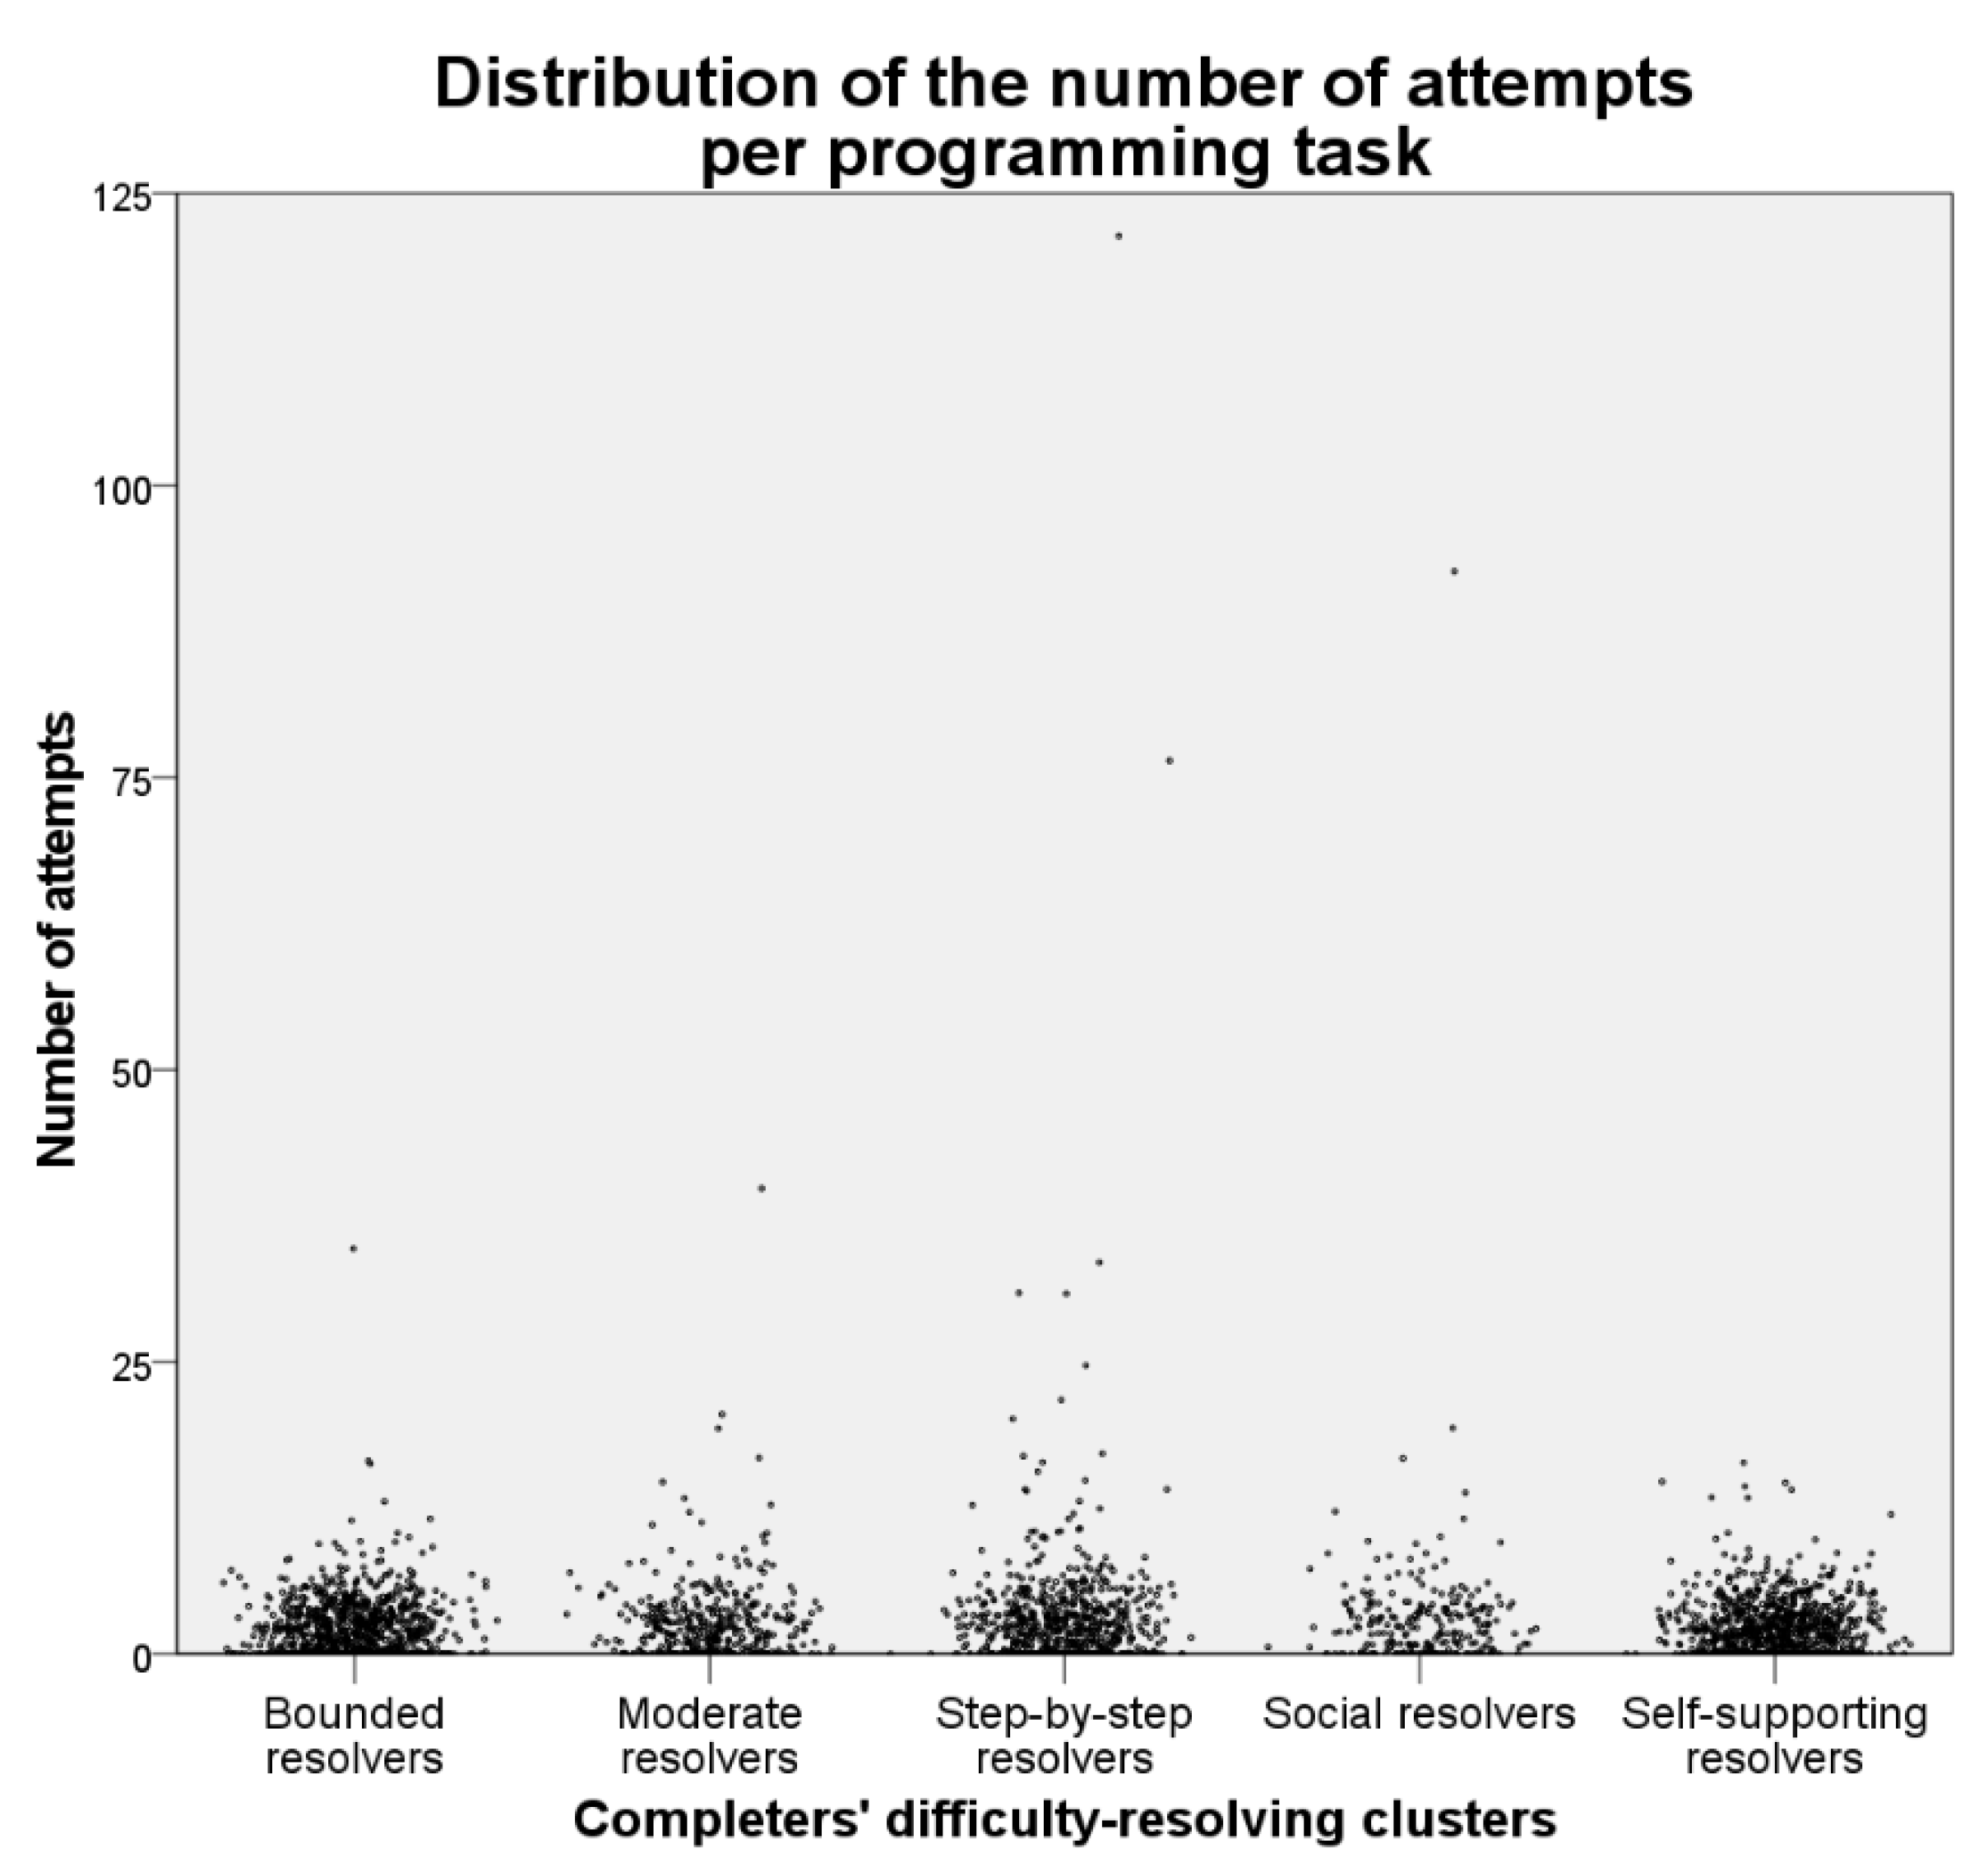
| Attempts per programming task | Range | 1−33 | 1−36 | 1−121 | 1−96 | 1−19 | |
| Mean (SD) | 1.56 (1.766) | 2.07 (2.904) | 2.44 (6.095) | 2.46 (6.330) | 1.65 (1.583) | 45.696 *** | |
| Attempts per quiz | Range | 1−2 | 1−2 | 1−4 | 1−3 | 1−3 | |
| Mean (SD) | 1.01 (0.114) | 1.02 (0.143) | 1.06 (0.279) | 1.08 (0.309) | 1.04 (0.211) | 21.648 *** | |
| Scores per quiz | Mean (SD) | 9.93 (0.259) | 9.88 (0.327) | 9.78 (0.416) | 9.87 (0.338) | 9.90 (0.296) | 65.572 *** |
Publisher’s Note: MDPI stays neutral with regard to jurisdictional claims in published maps and institutional affiliations. |
© 2021 by the authors. Licensee MDPI, Basel, Switzerland. This article is an open access article distributed under the terms and conditions of the Creative Commons Attribution (CC BY) license (https://creativecommons.org/licenses/by/4.0/).
Share and Cite
Feklistova, L.; Lepp, M.; Luik, P. Learners’ Performance in a MOOC on Programming. Educ. Sci. 2021, 11, 521. https://doi.org/10.3390/educsci11090521
Feklistova L, Lepp M, Luik P. Learners’ Performance in a MOOC on Programming. Education Sciences. 2021; 11(9):521. https://doi.org/10.3390/educsci11090521
Chicago/Turabian StyleFeklistova, Lidia, Marina Lepp, and Piret Luik. 2021. "Learners’ Performance in a MOOC on Programming" Education Sciences 11, no. 9: 521. https://doi.org/10.3390/educsci11090521
APA StyleFeklistova, L., Lepp, M., & Luik, P. (2021). Learners’ Performance in a MOOC on Programming. Education Sciences, 11(9), 521. https://doi.org/10.3390/educsci11090521