1. Introduction
Student retention continues to be an intricate problem for higher education [
1]. Approximately 40% of college students drop out before completing a four-year college program or earning a college degree [
2]. Higher drop-out rates place significant financial burden on post-secondary institutions [
3] and lead to lower graduation rates [
1]; together these create further challenges in the states where performance-based funding initiatives are implemented. Therefore, to cope with shifts in governmental funding and changes in the educational marketplace, student academic progress and retention must be continuously monitored and ensured by colleges.
Within the past five decades, a significant amount of research has been dedicated to investigating the underlying reasons why students drop out. In general, prior research in student retention has focused on psychological changes [
4,
5,
6,
7,
8], academic success [
9,
10], academic preparation practices [
11,
12,
13], and student demographics and characteristics [
3,
14,
15].
While “the student-centered research tradition” that explores the relationship between student-related attributes and retention is vast [
15,
16,
17], the empirical evidence of high-level institutional characteristics that focuses on what colleges can do to foster college attainment and retention is still meager and provides limited guidance for researchers, educators, and administrators. In the past decade, some studies have shifted their attention to emphasize the effects of institutional factors on student retention [
15,
18,
19,
20]. The institutional-level student demographic variables have been the most influential traits used to analyze collegiate persistence among other factors [
2,
21,
22,
23]. However, only a limited number of studies has considered the effect of the national level longitudinal analysis of demographic variables on student retention. For instance, Ware [
24] used the Integrated Postsecondary Education Data System (IPEDS) of the U.S. Department of Education to identify the highest increases in student retention rates (2004–2014) for research-oriented institutions. Nevertheless, the literature is insufficient with theories regarding the impact of institutional level “school selectivity” characteristics such as acceptance rate and enrollment on student persistence [
25]. When college selectivity measures are analyzed in conjunction with institutional level demographic variables, vital implications for disparities of college enrollment and retention patterns may arise.
Institutional variables are spatial-based measures; thus, it is essential to look at the institutional variable data (college characteristics) in the notion of space. To date, the literature has not shown clear indications and guidelines for the implications of spatial-geographic factors, which could be used as a milestone to get a deep understanding of critical processes in education [
26]. Recently, Cobb [
27] sees modern geospatial analysis techniques as a new opportunity that can offer unique insight into educational opportunity, access and equity.
Our preliminary study through a hot spot analysis that consisted of 438 4-year degree granting colleges in the U.S. shows that the student retention rate in metropolitan areas is higher than rural districts. Thus, we selected a geographic-spatial factor (spatial city) based on the proximity from a higher education institution to the nearest metropolitan area. Furthermore, the relationship between the proximity to coastal metropolitan area and retention rate was examined due to dense clustering of the colleges with higher retention rates in coastal regions. The inclusion of this variable is expected to provide a deeper spatial insight into the understanding of college retention rates in metropolitan and rural areas.
Overall, this research warrants further exploration on examining how selected spatial-geographic factors influence student retention rate (before and after accounting for demographics variables and school selectivity measures) in comparable 4-year degree granting public institutions in the U.S., where we used K-Means unsupervised classifier to identify groups of similarly characterized institutions for a more focused analysis and reporting purposes. The spatial patterns of student retention in urban and rural areas may reveal important clues about the current state of accessibility to higher education especially for students from different socio-economic backgrounds. We aim to address the following research questions:
Is there a relationship between the distance to the closest metropolitan area and the retention rates for the selected degree granting 4-year or above higher education institutions in the United States?
How well do the institutional level characteristics explain student retention?
Does the inclusion of the spatial variable improve the predictive power of the retention model?
What are the implications of the study findings for higher education leadership and decision-makers?
2. Literature Review
Student retention is critical to higher education institutions. Researchers and practitioners have devoted themselves to identifying student and institution-specific variables that contribute to attainment and success in post-secondary education. Demographic factors such as age, gender, and race [
10,
28]; attributes to reflect academic standing; and success [
9,
25,
29,
30] have been explored to identify whether certain kinds of students are prone to leave college. While the preponderance of the previous research focuses on individual institutions to create and understand a generic profile of student retention, an in-depth analysis of the institutional level characteristics of the similarly characterized universities in the U.S. has been neglected in the literature. Furthermore, student retention has rarely been explored within the context of spatial variables. A more thorough analysis that justifies the use of variables and data sets is carried out in the next section.
2.1. Demographics
In the literature, men and women differ in terms of their reasons for leaving college [
31]. The impacts of causes on student persistence vary based on gender. For instance, Manuel [
32] found no difference in retention rate for first-generation men and women. Dennehy and Dasgupta [
33] provided evidence that same-gender peer mentoring boosted women’s retention rates. Meanwhile, Jain [
2] focused on students adjusting to the college environment in regard to gender and suggested that males tend to adjust better in college dynamics than females. Similar findings were also echoed in a study conducted by Meyer and Strauß [
34], where women showed a higher dropout risk than male students. In a longitudinal study, the National Center for Education Statistics measured the persistence rate for the first-time post-secondary students by Spring 2017. They found that male persistence rates were higher than female at 4-year institutions [
35].
Besides, the predictive power of age has been widely researched and presented in the literature. In an early study conducted in Utah Valley State College, the first-year persistence rate was significantly greater for students under age 23 [
36]. Lately, The National Student Clearinghouse Research Center [
37] has reported first-year persistence and retention for Fall 2017 cohort. The study found that Fall 2017 entering college students whose ages were 20 or younger had a retention rate of 76.9%. This represented an increase of 23.6% points over the students who were 25 years or older. Similarly, Chen et al. [
35] found a consistent negative relationship between first-year persistence and the age factor.
Likewise, the racial climate was found to be an effective factor that influences student retention rate [
38,
39,
40,
41]. The racial climate is one of the compositional diversity aspects of a college campus. Milem et al. [
42] defined racial climate as the numerical and comparative representation of color or ethnicity on the college campus. Dropping out is significantly associated with campus climate perceptions [
38,
40]. According to an analysis performed by National Student Clearinghouse [
37], white students had a better one-year retention rate than both Black students and Hispanics, where Asian students had the highest retention rate of 85%. Diehl et al. [
38] stated that Black students’ retention considerations were constituted on the basis of racial factors. Furthermore, academic and social integration disparities explained the difference between the persistence of black and white students [
41].
2.2. School Selectivity
Due to data limitations, most prior studies that sought the relationship between retention rate and school selectivity measures were conducted in a limited pool of institutions. In the past decade, only a few studies have explored the longitudinal impact of school selectivity variables on student retention. For instance, Gansemer-Topf and Schuh [
29] conducted an analysis, sampling 466 private institutions drawing data from IPEDS, and concluded that selectivity of an institution was one of the significant predictors of student retention. Similarly, Farre [
9] indicated a positive correlation between institution selectivity and student retention rate, where it was reported that a 10% increase in the selectivity of an institution led to a 0.8% higher retention rate. Webster and Showers [
25] used a wide range of institutional data to examine the effect of acceptance and enrollment rates on student retention at four-year U.S. institutions offering undergraduate and graduate degrees. They found that institutions with higher enrollment and acceptance rates of incoming freshmen were more likely to suffer from low retention rates.
2.3. Spatial-Demographic Factors
The set of institutional-level characteristics explored in past studies lacks exploration of the impact of the spatial dimension on retention. There have been a few attempts to explore the importance of place for students and institutions, though not much attention was given to retention. According to Turk [
43], spatial accessibility measures could be used as strong predictors of student behavior and success. Franklin [
44] and Kim et al. [
45] indicated that geographic-spatial factors could influence student choices, academic performance, and student persistence.
Hillman and Weichman [
46] mapped the education deserts in the U.S. by locating the areas with zero colleges nearby or where the only public institution within close proximity is a community college, where public higher education institutions with more than a 75% acceptance rate were considered. The study findings emphasized the importance of community colleges as they enroll the majority of students in education deserts. A similar study was conducted by Beamer and Steinbaum [
47] with a slightly modified description of an education desert as a place where there was no access to higher education. Their geographic analysis showed that higher education institutions were concentrated mostly in the urban parts of the country.
Perhaps the only study which truly applied geographic analysis to understand the spatial patterns of college retention was conducted by Hanewicz [
48]. She applied Geographic Information Systems (GIS) to develop a distance-based retention model that measured the effectiveness of student locations on freshmen retention at Eastern Michigan University. While the results showed that the geographic distance did not have a significant impact on retention, living within 25 miles of the institution was found to affect the college drop-out rates.
Over the past years, the rural–nonrural distinction in postsecondary education has attracted researchers’ attention [
49]. For example, in a longitudinal study, the socioeconomic status (e.g., poverty rate and household income) was found to be a key factor that explained the rural–nonrural disparities in educational attainment and persistence [
50]. Due to lower socioeconomic status in rural areas, youth have faced challenges and obstacles in attending college and finishing a degree. The disparities in socioeconomic levels and their consequential educational inequalities can be closely attributed to the lack of rural development policies and practices including insufficient infrastructure investments. According to the report released by the W.K Kellogg Foundation [
51], “from 1994 through 2001 the federal government spent more than two times (and sometimes up to five times) as much per capita on metropolitan community development as it did on rural community development”. The limited access to services, economic opportunities, and infrastructure constitutes the leading reason behind rural–urban migration [
52].
According to U.S. Census Bureau [
53], metro area populations surge as smaller areas suffer from intense migration. Rapid urbanization increases demand for infrastructure and services in metropolitan areas, while it lessens and deteriorates rural infrastructural activities. The effect of “metropolitization” can be significant on increasing student retention. Indeed, our preliminary analysis on IPEDS 2017 Survey Materials Glossary Databases shows that metropolitan areas maintained better student retention than rural districts. For instance, the Great Lake Region that includes portions of eight U.S. states of Indiana, Illinois, Michigan, New York, Ohio, Pennsylvania, Wisconsin, and Minnesota, has the highest undergraduate student retention rate among other regions. The colleges in the metropolitan areas such as Indianapolis, Milwaukee, Toledo, Youngstown, Dayton, Grant Rapids, and Detroit offer a record number of distinct programs that cater to the specific needs of the region, where the first-year retention rate is 5.6% higher than the nation’s average based on 2017 IPEDS data. Both public and private universities have been supported by the region’s manufacturing and innovation infrastructures, which helped to maintain a higher retention rate compared to the rural areas. Such collaborations have yielded substantial productivity investments in the area; a big share of the nation’s export revenue originated from the Great Lake Region [
54]. The Region is still home of the nation’s science and engineering degrees, where more than 30% of America’s science and engineering degrees are awarded here per year. We believe that proper infrastructure practices have a strong positive effect on student retention.
While rural–metropolitan area migration is the dominant trend, we also noted that higher retention rates were clustered in the coastal metropolitan regions. The clusters of low retention rates were usually present around metropolitan areas that are mostly away from the coastlines. Considering that the population in coastline counties has exponentially grown since 1960s [
55], thus the impact of “urbanization” on student retention, it is important to look at a Spatial City Coast, a weighted average of distance to the closest coastline metropolitan area, variable to assess whether being a coastal metropolitan area would have a significant impact on retention.
Overall, there are many amenities that colleges in metropolitan areas (whether it is in coastal counties or not) can offer [
56] such as different cultures and experiences, increased internship/job opportunities, economic and innovation advancements, access to the equity of opportunities [
57], transportation, and classroom settings. However, some students may not be suited to the metropolitan college environment because of a variety of reasons such as city-life distractions, cost of living, housing problems. Due to the high variability of causes and limited access to complete data, the discrepancies of rural–metropolitan area retention rate can be explored in the context of the proximity (distance) factors. In conclusion, we formulate the following hypothesis.
Hypothesis 1 (H1). The student retention rate increases as the distance from college to the nearest metropolitan area decreases.
Hypothesis 2 (H2). Institutional level characteristics explain some of the variation in student retention that is statistically significant.
Hypothesis 3 (H3). The distance factor increases the predictive power of the retention model after account for institutional level characteristics.
3. Materials and Methods
This research uses exploratory research design, where a range of data, including institutional characteristics, enrollments, admissions, test scores, and completion, were utilized for analysis through The Integrated Postsecondary Education Data System (IPEDS). This data system was established as the core postsecondary education data collection program for the National Center for Education Statistics (NCES) of the U.S. The database is made of several files that contain directory information for all private and public institutions in the 2017 IPEDS universe.
Initially, the postsecondary institutions were filtered to focus on degree-granting 4 year or higher public universities in the U.S. (in 50 states). Colleges dependent solely on special programs, such as nursing and military, and religious teaching-based institutions were removed from the study. Due to data unavailability, postsecondary institutions that do not participate in IPEDS surveys were excluded. Then, using the K-means clustering method, which has been thoroughly discussed in the next section, the selected institutions were clustered (cluster 1 and cluster 2) based on their admission-institutional level similarities. Due to better performance matrices in terms of variance and separation values, 329 institutions in cluster 1 were included in our study.
Table 1 summarizes the variable descriptions and their statistics.
SPSS, Alteryx, end to end data analytics platforms, and ArcGis Pro software were used for data preparation and conducting spatial analysis. With the help of a primary key (UnitID), the sorted institutional characteristics data file was joined with admission and test scores, fall enrollment, and enrollments files. Then, the institutions’ map coordinates (latitudes and longitudes) were matched with GeoNames database to add the spatial variables.
3.1. K-Means Clustering
In the literature, many of the quantitative and qualitative analyses of institutions have been conducted based on the traditional classification methods, such as Carnegie or geographic area-dependent classification [
58]. While the findings of these studies are valuable, they only cater to a specific higher education community. However, grouping an institution with its peers on the basis of certain high-level institutional characteristics may reveal hidden patterns, which can be of much help when the relationship among variables is sought. Thus, it is critical to determine a set of institutions with similar academic and economic profiles so the isolated impact of the spatial variable and any other independent variable on retention can be accurately assessed.
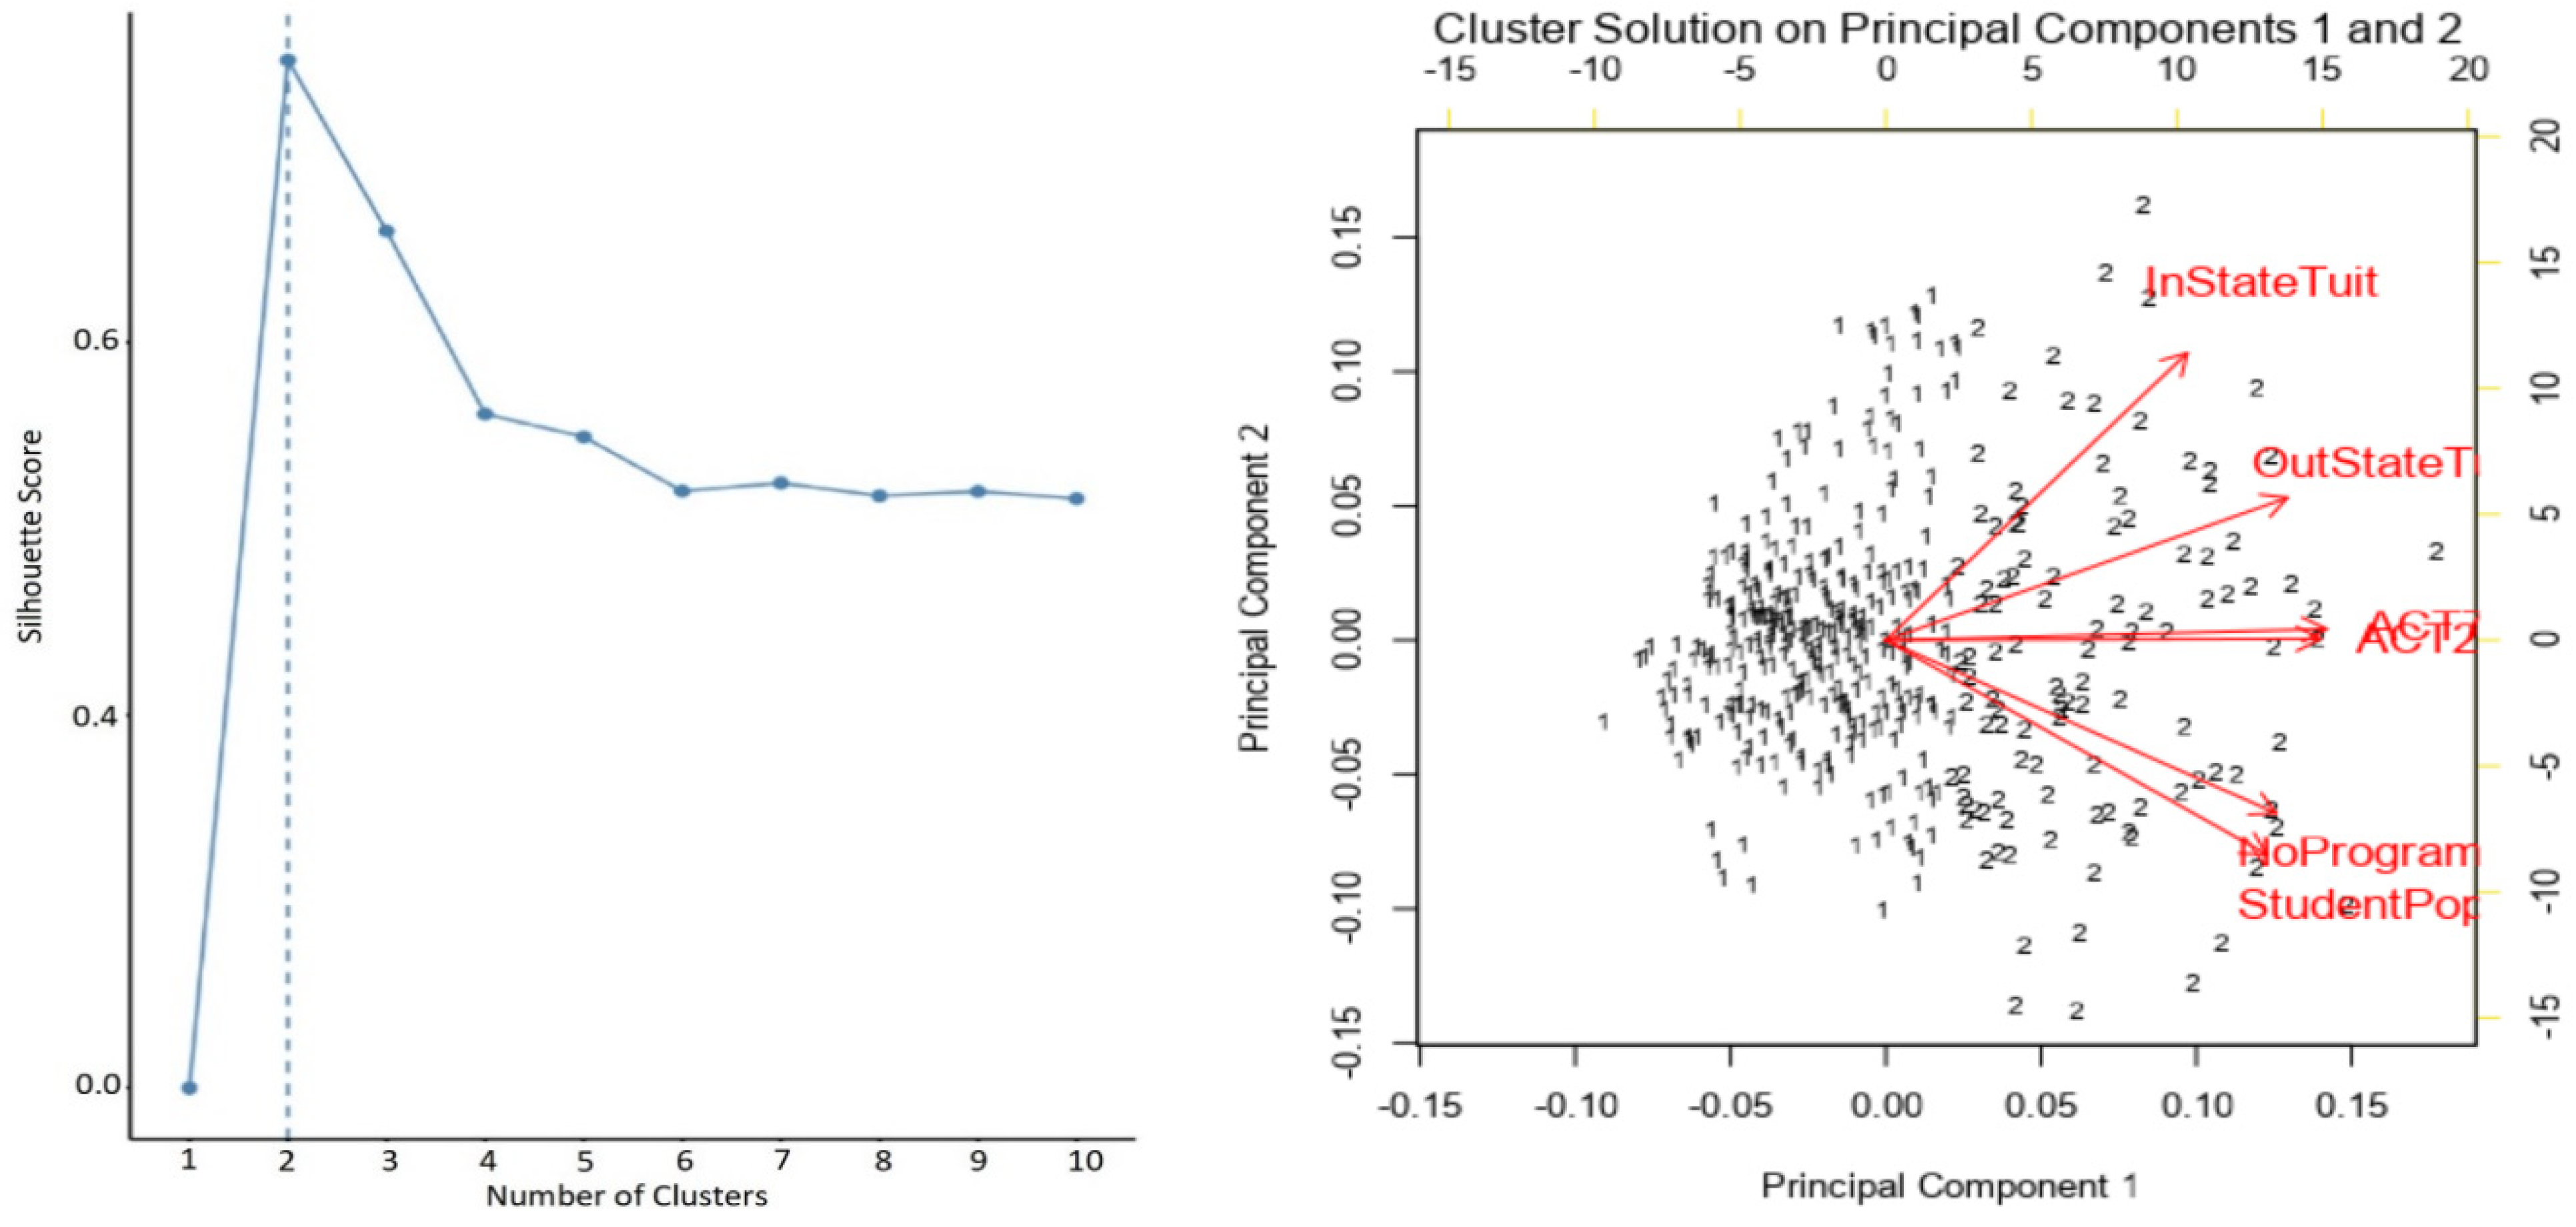
Accordingly, four high-level institutional attributes that can help to categorize the rank of an academic institution—the tuition rate (both in state and out of state), the institution’s student population, ACT scores (25th and 75th percentile), and program variabilities—were selected. Institutions were then grouped into 2 mutually exclusive clusters by the help of the K-means clustering method, which is a non-hierarchical technique that aims to find a grouping of objects that have similar attributes. We used the Silhouette method (
Figure 1) to verify the validation of consistency within a cluster of data, which examines how similar an object (institution) is to its own cohesion compared to other clusters (known as separation points). Therefore, 329 institutions were grouped into cluster 1 and 109 institutions into cluster 2. The performance analysis of each cluster, which revealed important measures such as average, maximum and separation distances standardized by z score, is presented in
Table 2.
The results in
Table 2 show that the average (1.522 for cluster 1; 2.164 for cluster 2) and maximum distances (3.292 for cluster 1; 4.787 for cluster 2) between observations in cluster 1 were less than those in cluster 2. While lower within cluster variances, average and maximum are sought, a high separation value is desired (2.122 for cluster 1 and 2.019 for cluster 2), which shows the distance from the centroid of one cluster to the nearest observation in another cluster.
Moreover, a closer look into characteristics of the clusters (
Table 3) revealed that while cluster 1 was made up of diverse institutions in terms of educational offerings (199 master’s colleges and universities, 75 doctoral universities, 55 baccalaureate colleges), the majority of cluster 2 consisted of research-oriented doctoral universities. Other statistics obtained from the tuition rates, program versatility, and the student population, also indicated that cluster 1 showed less dispersion than cluster 2.
While cluster 2 could provide important results towards the doctorate institutions that are selective and research-centered, the institutions in cluster 1 were a better fit in terms of the blend of various educational offerings and low attribute variabilities (with less dispersion and variance). Therefore, we continued our analysis based on cluster 1.
3.2. Empirical Model
The dependent variable (student retention rate) is a continuous bounded variable. Prediction of a continuous dichotomous outcome can be accomplished by various statistical models. Linear discriminant function analysis or simple ordinary least squares (OLS) regression models can be used to work with such variables. However, both methods, without doing any transformations, would fail to handle dichotomous inputs because of their statistical assumptions of linearity and normality [
59]. Therefore, a logit transformation can be applied to linearize sigmoid distributions of proportions [
60], in order to find the line of best fit through the data points. The logit transformation helps to expand the bounded domain of the explained variables to infinite
. The following logit-transformed OLS can be used to fit the model, where
s are regression coefficients and
s are predictors:
.
In addition, spatial dependency among the dependent variable and error terms needs to be investigated, as the presence of spatial autocorrelation would violate the characteristics of the OLS and lead to biased and inaccurate estimates [
61]. Moran’s I test can be implemented to check whether the observed value of a variable at one data point was independent of the values of the variable at neighboring localities. Calculations are made based on a weighted matrix, with unit
and
as follows:
where
is the number of observations,
is the sum of the weights (
), and
, where
is the value of the variable at location
and
is the average value of the variable.
4. Results
The weight matrix in this study was created using arc distance as the spatial dataset is expressed in latitudes and longitudes. The critical distance was identified as 260 miles which ensured that each university had at least one neighbor. The findings of Moran’s I test with a value of 4.42 indicated that the result was statistically significant at confirming the presence of spatial autocorrelation.
Further diagnostics tests were conducted to check whether the neighboring dependent variables (spatial lag) or the error terms (spatial error) were correlated (
Table 4). Robust Lagrange Multiplier (LM) lag and error test results were compared as the LM lag and error values were both statistically significant. Having a statistically significant Robust LM lag value while the Robust LM error was not significant, suggested that the spatial autocorrelation problem may disappear if a spatial lag model is constructed.
In addition to the spatial autocorrelation problem, the multicollinearity issue, strong correlation among independent variables, was investigated through the variance inflation factor (VIF) test. The results, presented in
Table 5, showed no signs of a multicollinearity problem as the VIF for each variable was found to be less than the threshold of 10 [
62].
In this study, we used traditional institutional level characteristics as control variables and added as a block to Model 1. Then, the test variables were entered into the analysis under Model 2. The overall goal was to examine the contribution above and beyond the first group of variables entered in Model 1.
Models 1 and 2 were run using OLS and spatial lag model specification, which adds a spatially lagged variable, spatial lag, to the existing explanatory variables. The regression results are presented in
Table 6.
The OLS regression results show that adding the spatial predictors to Model 2 resulted an increase of 3.2% in the proportion of variance () explained in student retention rate. Therefore, we accept the H3 hypothesis. However, it is more appropriate to compare the log likelihoods when spatial regression models are involved. The log likelihood of Model-1 and Model-2 increase substantially when a spatial lag variable is incorporated into both models. Statistically significant spatial lag variable indicates that universities are clustered with other institutions that have similar retention rates; thus, we should focus on the results of the spatial lag models.
Model-2 with the spatial lag specification has the highest log-likelihood (−97.24) among all four regression models. In model 2, the acceptance rate was found to be statistically significant
when explaining the variation in student retention rate. The coefficient of −0.230 indicated an inverse relationship between the acceptance rate and the retention rate which complies with the results of the studies completed by Marcus [
63], Webster and Showers [
25]. There was no statistically significant relationship between the enrollment rate and the dependent variable after accounting for spatial autocorrelation.
Black or African American, Asian, other races, and under 25 ratio were found to be significantly related to student retention rate, where a negative relationship was observed between African American or Black and other races, and the dependent variable. While Asian had the highest standardized coefficient beta of 2.554, indicating an important role for explaining the variation, under 25 ratio also affected the student retention rate positively, with a coefficient of 0.851 (thus, we accept the H2 hypothesis). These findings agree with the previous studies that emphasized the importance of demographic variables when predicting student persistence [
10,
14].
The model results showed that the spatial-geographic variable (Spatial City)—the proximity to the nearest metropolitan area from the sampled institution—was statistically significant for less than 1% chance of Type 1 error. Therefore, we accept the H1 hypothesis. The negative standardized coefficient of 0.003 indicated that student retention rate appeared to decrease as a university was located further away from the nearest metropolitan area. Even though this spatial variable was never explored prior to this research, these estimates were congruent with the findings of similar studies that examined the geographic discrepancies in education [
43,
45].
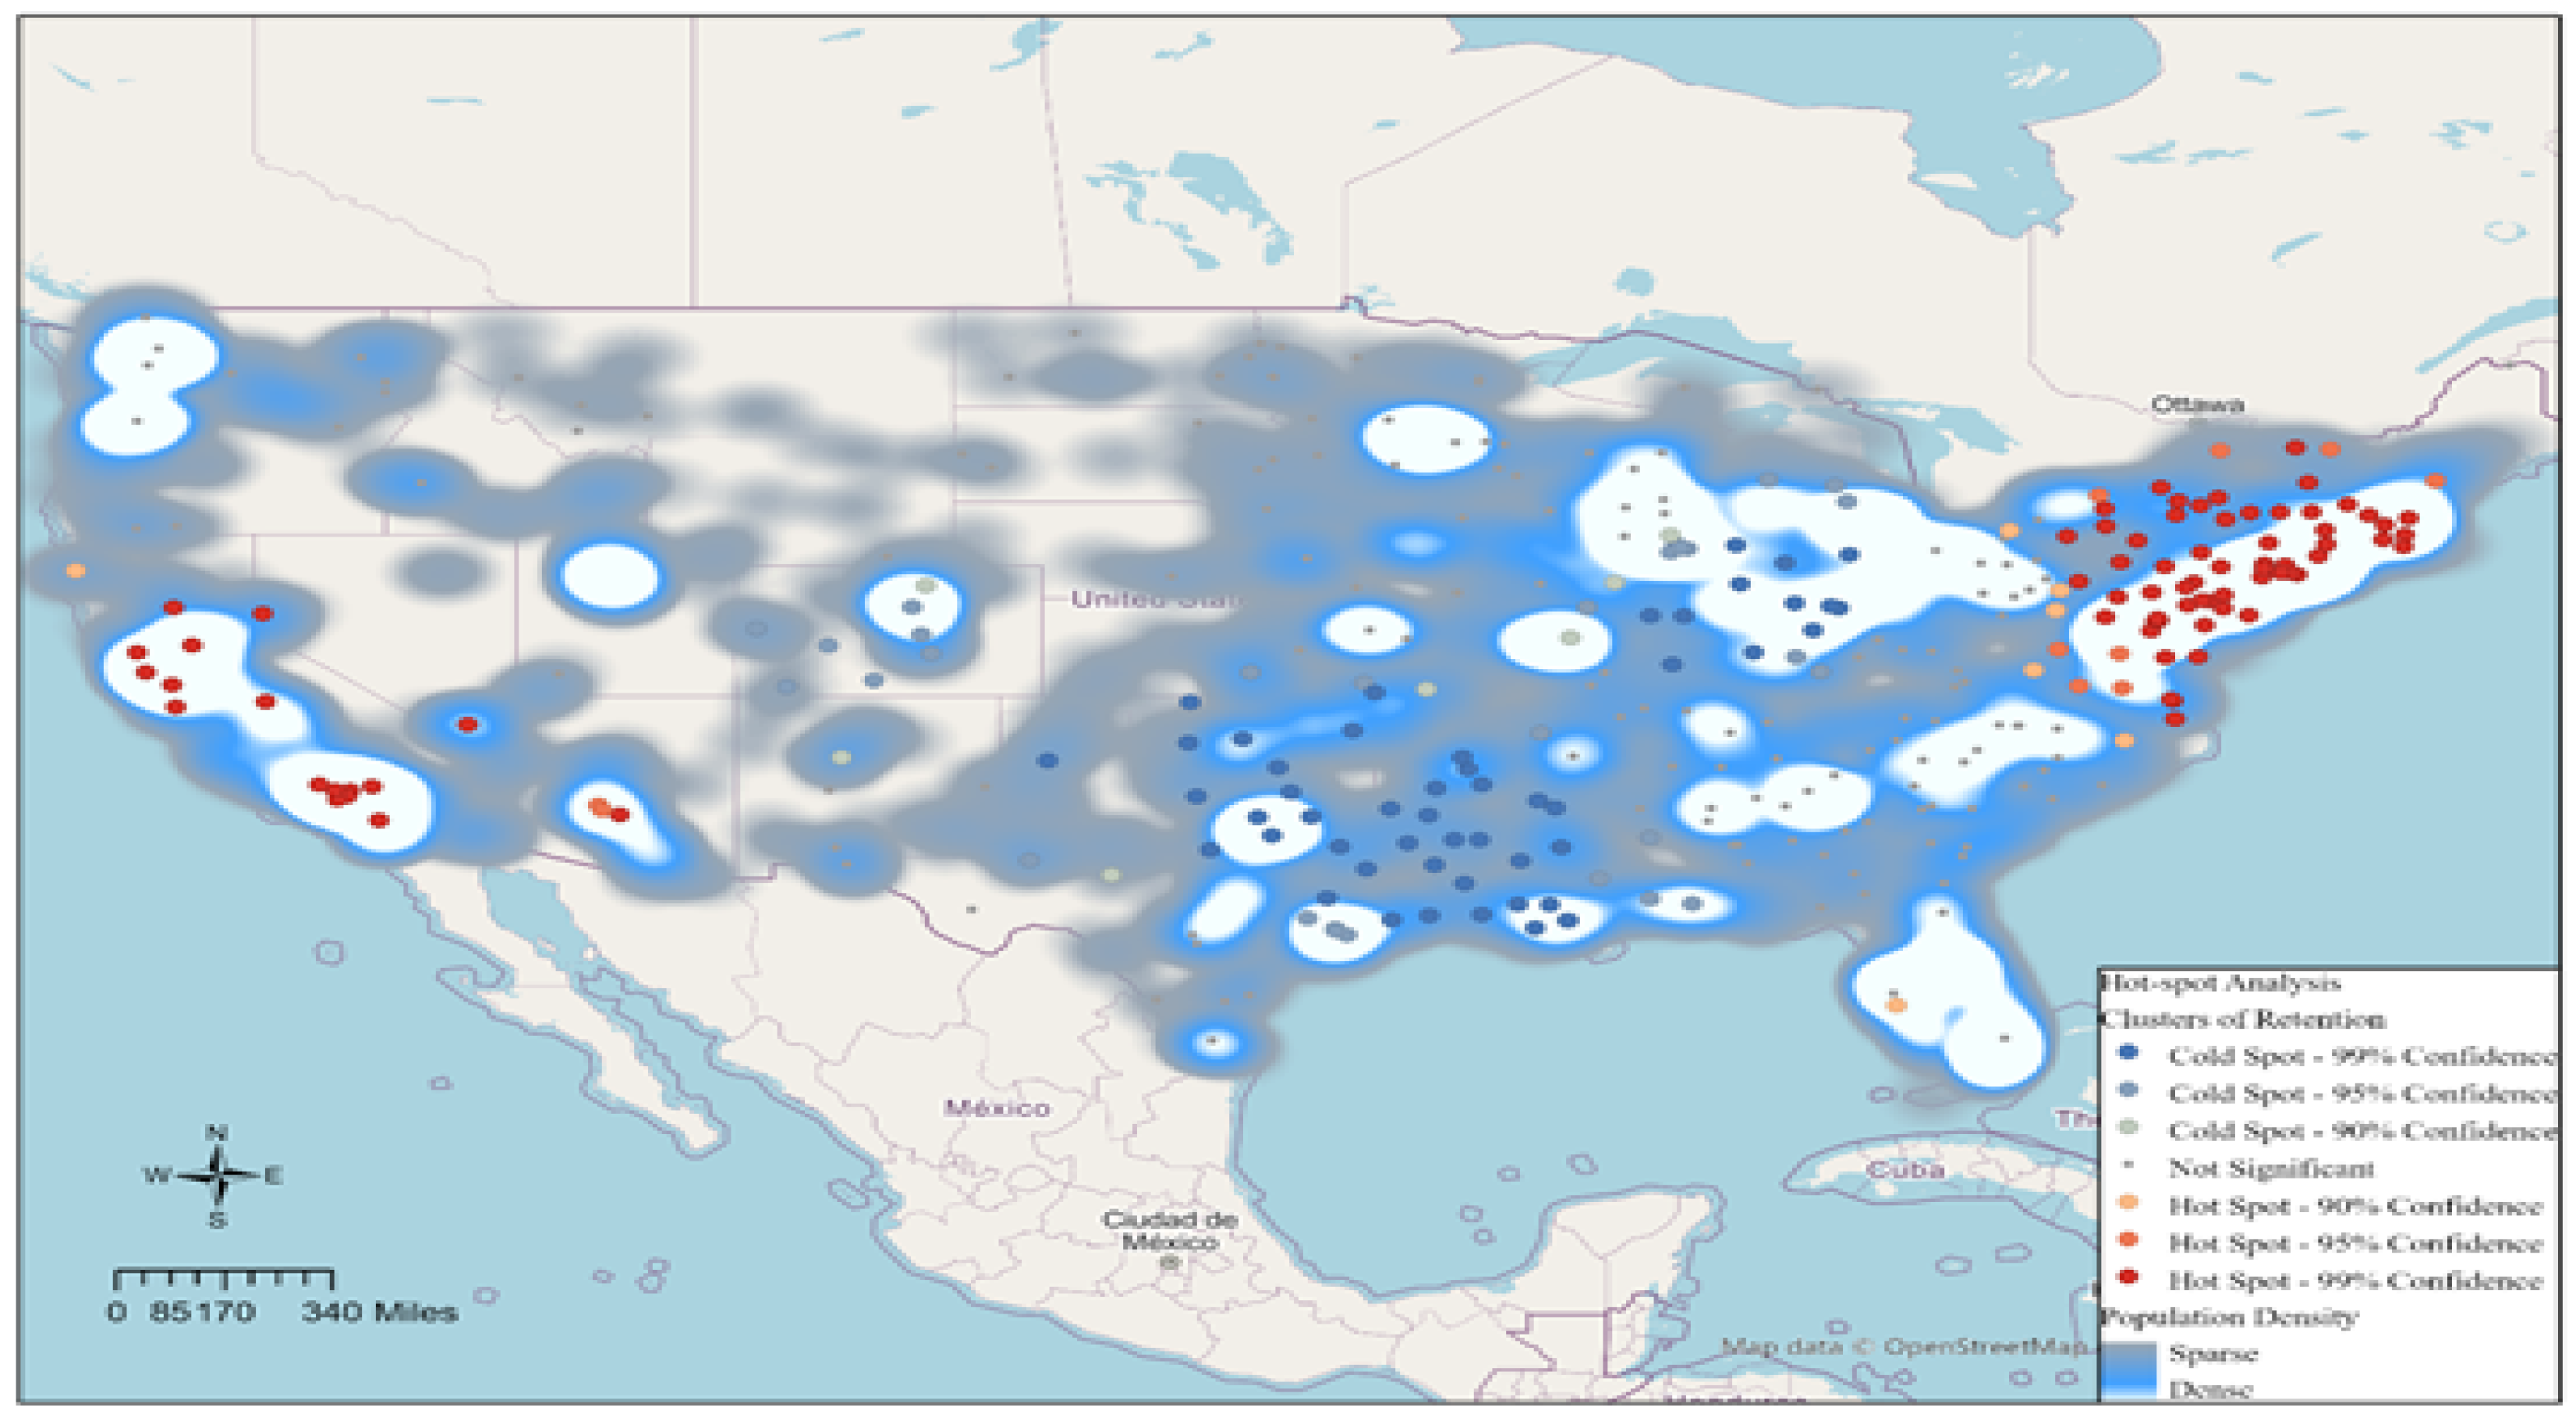
To provide a better understanding of the relationship between retention and Spatial City, further spatial analysis was performed. An optimized hot spot analysis using fixed distance band was executed using ArcGis Pro to identify the statistically significant clusters of universities with high and low retention rates.
Figure 2 shows the hot and cold spots with varying levels of statistical significance (confidence levels of 90%, 95%, and 99% can be interpreted as high, medium, and low clustering, respectively) and the heat map of the metropolitan areas.
The metropolitan areas with higher population densities are in white, while less populated regions are presented in blue. Blue and red dots represent the statistically significant clusters of universities with low and high retention rates, respectively. It can be observed that there are groups of clustered universities with higher retention rates in the coastal metropolitan regions. However, the clusters of low retention rates are also present around metropolitan areas but mostly away from the coastlines. To better distinguish whether being in a coastal metropolitan area would have a significant impact on retention, it is important to assess the impact of the Spatial City Coast variable.
Based on the results of all four models, Spatial City Coast was found to have no impact on retention. Willingness to stay in a coastal metropolitan region did not appear to be one of the contributing factors to student persistence but a more comprehensive study that accounts for higher spatiality and regional differences might reveal more in-depth results and implications.
5. Discussion
The dynamic and multidimensional nature of student retention makes it a challenging problem for university administrators and policy-makers. It requires continuous monitoring of institutional and student-based data so best management practices can be implemented to identify at-risk students. The institutions that cannot successfully address low retention issues through early intervention programs or innovative approaches may be subject to dire long-term academic and financial consequences such as lost prestige, lower tuition revenue, and a reduction in external funding. Moreover, any institutional effort that contributes to higher student retention will directly benefit the students because, as educators, we want our students to be ready in this fast-changing global environment. The regression results presented in the previous section are critical components of the collective efforts of administrators, educators, and researchers to understand the general patterns of student retention.
The negative impact of distance to metropolitan area on student retention may be interpreted in the context of geo-spatial restrictions. As universities are located away from urban regions towards more rural places, their freshman-to-sophomore persistence rates decline significantly. This is consistent with the literature that first-to-second year retention rates at rural universities are lower than those in non-rural locations [
64,
65]. The higher retention rate in metropolitan areas can be partially due to the effect of “urbanization” in cities that offer enhanced infrastructures, geographical, and social amenities. For instance, the manufacturing infrastructure developments attract students in the hope of finding an internship or a permanent position before/after graduation [
55,
66]. Similar findings were echoed by Tam and Jiang [
67], who suggested that increase in opportunities for vocational education among urban students rises urban college accession and attainment. Such opportunities continue to increase the chance of student persistence.
When a graduating high school senior decides which college to attend, place is given significant importance and in fact, may be the most important deciding factor. Not having a four-year institution in close proximity means added financial costs and travel time, both of which act as barriers to higher education access and degree attainment. According to the US Census’s 5-year income estimates between 2013 and 2017 [
53], the average median household income was 32% less in rural areas than in urban locations. The added financial and non-financial costs of living in an “education desert” combined with strong family ties lowers the likelihood of college attainment and retention for rural student population. These difficulties can be addressed by customized outreach and recruitment efforts that outline the costs of college education and any financial support programs that are readily available. For instance, the Pell Grant’s income eligibility can be altered or expanded to reduce the reliance on high interest student loans [
68]. Higher education institutions should offer academic and non-academic advising specifically tailored for rural students. Without local and federal education subsidies and adequate institutional support, place-based disadvantages make the continuation of post-secondary education challenging and difficult for rural students.
One other challenge that rural students face is the lack of academic and career guidance before graduating from high school. Some of the rural K-12 institutions lack career counselors that are vital for college readiness [
69] mainly because of their smaller budgets compared to their counterparts in more populated areas. Neale-McFall [
70] examined the services provided by rural and urban secondary school counselors across Pennsylvania. There were significant differences in spending between rural and urban districts which led to fewer rural counselors with heavier workloads mainly focusing on more administrative tasks and less on career guidance. Enacted in the 2013–2014 school year, the state of California implemented a legislation called Local Control Funding Formula (LCFF). LCFF proposes an equitable school financial system that provides more resources and support to low-income families. This education funding reform also enabled local districts to spend the allocated state funding on areas most aligned to critic needs. After the adoption of LCFF, some districts have reported greater spending progressivity on educational programs [
71]. It is critical for the state and local policy-makers to increase funding for career guidance in economically disadvantaged rural areas so that students can make informed decisions about their post-secondary education options.
Our study results also indicated a positive relationship between retention rate of urban universities and the percentage of students who are 25 years of age and over. This is not surprising as the increasing number of urban universities has transformed the average student who is traditionally younger, single and lives on campus to a more diverse, older, and working student who still depends on some sort of financial aid assistance [
72]. These students are more informed about the value of education than rural students, and they see college education as an economic necessity. In fact, the positive impact of distance to metropolitan area on student retention could be partly due to the increasing number of these “nontraditional” students despite all the challenges associated with blending work and school. It is critical for the higher education institutions to design and implement practices such as early intervention programs for part-time students, block scheduling, and broader inclusion of previously earned course credits so the persistence among these students is improved.
The results also showed that the racial disparity continuous to be a daunting challenge in higher education where the white race is predominant [
73]. Our study indicated a negative relationship between the retention rate and the ratio of Black and African American. More importantly, a higher retention rate of Black and African American students was observed in colleges in metropolitan areas as compared to the colleges in rural districts. Similar finding was also echoed in the context of programmatic barriers within by Banks and Dohy [
74]. Undoubtedly, strong socioeconomic separation (e.g., income, poverty, and race) of Black people in rural areas is a factor that influences rural-non rural Black retention rate. However, factors like racial socialization, psychological wellness and adjustments, and academic motivation could also be some of the underlying reasons that explain the racial inequality in retention. For instance, having close communication and relationships with peers of the same race was found to be important factor that improves social adjustment and academic motivation [
75]. The university administrators in collaboration with the faculty and staff should create a welcoming and supportive environment to promote sense of belonging among students. According to Sherman and Slate [
76], a supportive social system must be established to increase African-American students’ college attainment at predominantly white institutions. As a result, it may be worthwhile to investigate the college adjustment variables in the light of socioeconomic separations of rural–urban areas.
The race factor was also found to influence college selectivity measures; both acceptance and enrollment rates increase as the percentage of white student increase to total student population increases. This may echo the existence of barriers such as the inequality in K-12 preparation that led to displacement of minorities in higher education. The portion of African Americans and Hispanics who are well prepared for post-secondary education are channeled to community and open-access four-year colleges [
77].
6. Conclusions
Approaching student retention from different angles can lead to a better understanding of the issues behind college dropouts. This research aimed to enhance the understanding of student retention from a multi-institutional perspective with a focus on the geo-spatial perspective, a long-time neglected topic in the retention literature. To best of our knowledge, this is the first study that incorporates the spatial distance factor into analyzing student retention.
This study encompasses various statistical techniques including log-transformed hierarchical regression analysis and an unsupervised machine learning technique to assess the matter of student retention from a strong quantitative approach. During the first stage of this study, the impact of proximity to the nearest metropolitan area on student retention was thoroughly investigated with the help of data mining techniques. Using K-means clustering, 329 geographically dispersed higher education institutions with similar characteristics were identified in order to effectively assess the impact of each explanatory variable on retention. Spatial dependence test results suggested that incorporating a spatially lagged variable into the regression model would significantly improve its predictive power. A series of hierarchical OLS and spatial lag regression then was conducted to measure how well the spatial variables explained student retention rate after accounting for institutional level attributes.
The results of this study clearly indicated that the proximity to the nearest metropolitan area was a significant predictor of student retention rate; student retention decreased as a result of increase in distance to the metropolitan area. Furthermore, the addition of spatial city variable to the original regression model which consisted of high-level institutional characteristics and accounting for spatial autocorrelation successfully explained some of the variation in student retention rates. When distance to the nearest coastline and metropolitan area was considered together, it was found to have no impact on student retention. Other findings from this study comply with previous research linking admission related and demographics data with the student retention rate [
22,
78].
To better assess the broader effects of spatial factors, further detailed analysis must be performed. Covid-19 pandemic has impacted every aspect of life and academia is not an exception. The financial burden of this pandemic has caused many students to drop out of their current institutions. Future studies should investigate the retention patterns during and after pandemic once the data are readily available. The major limitation of this study—the lack of student specific spatial data such as the location of their hometowns—can also be addressed in future studies by collecting the relevant data via surveys. There are other limitations and cautions in the model of institutional performance and assessments in student retention rate. First, note that all variables are at the institutional level, thus individual student-level characteristics are not included in the analysis. Although IPEDS is a national multipurpose dataset for institutional data of higher education in the U.S., it has limited capacity to collect further information on individual level retention and dropout decisions. Second, this study uses a logit transformation to linearize sigmoid distributions of proportions. Alternatively, Beta regression is also useful for cases where the variable of interest is restricted to interval. While both methods have been proven to work on continues bounded variables [
60,
79], the results of this study must be analyzed and interpreted in the context of a logit model.
Author Contributions
Conceptualization, S.V. and S.C.; methodology, S.V. and S.C.; software, S.V. (Alteryx) and S.C. (ArcGis); validation, S.V. and S.C.; formal analysis, S.V. and S.C.; data curation, S.V.; writing—original draft preparation, S.V. and S.C.; writing—review and editing, S.V. and S.C.; visualization, S.C. All authors have read and agreed to the published version of the manuscript.
Funding
This research received no external funding.
Institutional Review Board Statement
Not applicable.
Informed Consent Statement
Not applicable.
Data Availability Statement
This research uses exploratory research design, where a range of data, including institutional characteristics, enrollments, admissions, test scores, and completion, were utilized for analysis through The Integrated Postsecondary Education Data System (IPEDS). This data system was established as the core postsecondary education data collection program for the National Center for Education Statistics (NCES) of the U.S. The database is made of several files that contain directory information for all private and public institutions in the 2017 IPEDS universe.
Conflicts of Interest
The authors declare no conflict of interest.
References
- Lau, L.K. Institutional factors affecting student retention. Education 2003, 124, 126–136. [Google Scholar]
- Jain, P. Adjustment among college students. Int. J. Adv. Sci. Res. Eng. 2017, 3, 10–12. [Google Scholar]
- Tinto, V. Dropout from higher education: A theoretical synthesis of recent research. Rev. Educ. Res. 1975, 45, 89–125. [Google Scholar] [CrossRef]
- Collings, R.; Swanson, V.; Watkins, R. The impact of peer mentoring on levels of student wellbeing, integration and retention: A controlled comparative evaluation of residential students in UK higher education. High. Educ. Int. J. High. Educ. Educ. Plan. 2014, 68, 927–942. [Google Scholar] [CrossRef]
- Hausmann, L.R.; Schofield, J.W.; Woods, R.L. Sense of belonging as a predictor of intentions to persist among African American and white first-year college students. Res. High. Educ. 2007, 48, 803–839. [Google Scholar] [CrossRef]
- O’Keeffe, P.A. Sense of belonging: Improving student retention. Coll. Stud. J. 2013, 47, 605–613. [Google Scholar]
- Wilson, S.B.; Mason, T.W.; Ewing, M.J. Evaluating the impact of receiving university-based counseling services on student retention. J. Couns. Psychol. 1997, 44, 316–320. [Google Scholar] [CrossRef]
- Boyd, N.; Liu, X.; Horissian, K. Impact of Community Experiences on Student Retention Perceptions and Satisfaction in Higher Education. J. Coll. Stud. Retent. Res. Theory Pract. 2020, 1521025120916433. [Google Scholar] [CrossRef]
- Farre, M. Spending Where it Matters: Exploring the Relationship between Institutional Expenditures and Student Retention rates at the California State University. Ph.D. Thesis, California State University-San Bernandino, San Bernandino, CA, USA, 2019. Available online: http://scholarworks.lib.csusb.edu/etd/802 (accessed on 17 July 2020).
- Wohlgemuth, D.; Whalen, D.; Sullivan, J.; Nading, C.; Mack, S.; Yongyi, W. Financial, academic, and environmental influences on the retention and graduation of students. J. Coll. Stud. Retent. Res. Theory Pract. 2006, 8, 457–475. [Google Scholar] [CrossRef]
- Frydenberg, J. Persistence in university continuing education online classes. Int. Rev. Res. Open Distance Learn. Knowl. 2007, 8. [Google Scholar] [CrossRef]
- Gershenfeld, S.; Hood, D.W.; Zhan, M. The role of first-semester GPA in predicting graduation rates of underrepresented students. J. Coll. Stud. Retent. Res. Theory Pract. 2015, 17, 469–488. [Google Scholar] [CrossRef]
- Venegas-Muggli, J.; Barrientos, C.; Álvarez, F. The Impact of Peer-Mentoring on the Academic Success of Underrepresented College Students. J. Coll. Stud. Retent. Res. Theory Pract. 2021, 1521025121995988. [Google Scholar] [CrossRef]
- Garza, A.N.; Fullerton, A.S. Staying close or going away: How distance to college impacts the educational attainment and academic performance of first-generation college students. Sociol. Perspect. 2017, 61, 164–185. [Google Scholar] [CrossRef]
- Perkins-Holtzclaw, K. Relationships between Institutional Characteristics and Student Retention and Graduation Rates at SACSCOC Level III Institutions. Ph.D. Thesis, East Tennessee State University, Johnson City, TN, USA, 2018. Available online: https://dc.etsu.edu/cgi/viewcontent.cgi?article=4801&context=etd (accessed on 9 August 2020).
- Chen, R. Institutional characteristics and college student dropout risks: A multilevel event history. Res. High. Educ. 2012, 53, 487–505. [Google Scholar] [CrossRef]
- Barbera, S.; Berkshire, S.; Boronat, C.; Kennedy, M. Review of Undergraduate Student Retention and Graduation Since 2010: Patterns, Predictions, and Recommendations for 2020. J. Coll. Stud. Retent. Res. Theory Pract. 2020, 22, 227–250. [Google Scholar] [CrossRef]
- Figlio, D.N.; Schapiro, M.O.; Soter, K.B. Are tenure track professors better teachers? Rev. Econ. Stat. 2013, 97, 715–724. [Google Scholar] [CrossRef]
- Wright-Kim, J.; Perna, L.W.; Ruiz, R. Institutional characteristics and bachelor’s degree completion of pell grant recipients. J. Coll. Stud. Retent. Res. Theory Pract. 2019, 1521025119892934. [Google Scholar] [CrossRef]
- Yu, H. Factors associated with student academic achievement at community colleges. J. Coll. Stud. Retent. Res. Theory Pract. 2015, 19, 224–239. [Google Scholar] [CrossRef]
- Deming, D.J.; Hasting, J.S.; Kane, T.J.; Staiger, D. School choice, school quality and postsecondary attainment. Am. Econ. Rev. 2014, 104, 991–1013. [Google Scholar] [CrossRef]
- Horowitz, J. Relative education and the advantage of a college degree. Am. Sociol. Rev. 2018, 83, 771–801. [Google Scholar] [CrossRef]
- Price, D.V.; Tovar, E. Student engagement and institutional graduation rates: Identifying high-impact educational practices for community colleges. Community Coll. J. Res. Pract. 2014, 38, 766–782. [Google Scholar] [CrossRef]
- Wade, N. Measuring, Manipulating, and Predicting Student Success: A 10-Year Assessment of Carnegie R1 Doctoral Universities Between 2004 and 2013. J. Coll. Stud. Retent. Res. Theory Pract. 2019, 21, 119–141. [Google Scholar] [CrossRef]
- Webster, A.L.; Showers, V.E. Measuring predictors of student retention rates. Am. J. Econ. Bus. Adm. 2011, 3, 301–311. [Google Scholar] [CrossRef][Green Version]
- Ferrare, J.J.; Apple, M.W. Spatializing critical education: Progress and cautions. Crit. Stud. Educ. 2010, 51, 209–221. [Google Scholar] [CrossRef]
- Cobb, C. Geospatial Analysis: A New Window Into Educational Equity, Access, and Opportunity. Rev. Res. Educ. 2020, 44, 97–129. [Google Scholar] [CrossRef]
- Friedman, B.A.; Mandel, R.G. Motivation predictors of college student academic performance and retention. J. Coll. Stud. Retent. Res. Theory Pract. 2011, 13, 1–15. [Google Scholar] [CrossRef]
- Gansemer-Topf, A.; Schuh, J. Institutional selectivity and institutional expenditures: Examining organizational factors that contribute to retention and graduation. Res. High. Educ. 2006, 47, 613–642. [Google Scholar] [CrossRef]
- Bäulke, L.; Grunschel, C.; Dresel, M. Student dropout at university: A phase-orientated view on quitting studies and changing majors. Eur. J. Psychol. Educ. 2021, 11, 1–24. [Google Scholar]
- Severiens, S.; Dam, G.T. Leaving college: A gender comparison in male and female-dominated programs. Res. High. Educ. 2012, 53, 453–570. [Google Scholar] [CrossRef]
- Manuel, R.S. Gender Differences and Retention Characteristics for First Generation College Students. Ph.D. Thesis, Indiana State University, Terre Haute, IN, USA, 2001. Available online: http://scholars.indstate.edu/bitstream/handle/10484/8114/Gender%20Differences%20and%20Retention%20Characteristics%20for%20First%20Generation%20College%20Students%20Raplh%20Stephen%20Manuel.pdf?sequence=2&isAllowed=y (accessed on 2 February 2021).
- Dennehy, T.C.; Dasgupta, N. Females peer mentors early in college increase women’s positive academic experiences and retention in engineering. Proc. Natl. Acad. Sci. USA 2017, 114, 5964–5969. [Google Scholar] [CrossRef] [PubMed]
- Meyer, J.; Strauß, S. The influence of gender composition in a field of study on students’ drop-out of higher education. Eur. J. Educ. 2019, 54, 443–456. [Google Scholar] [CrossRef]
- Chen, X.; Elliott, B.G.; Kinney, S.K.; Cooney, D.; Pretlow, J.; Bryan, M.; Wu, J.; Ramirez, N.; Campbell, T. Persistence, Retention, and Attainment of 2011–12 First-Time Beginning Postsecondary Students as of Spring 2017. U.S. Department of Education, 2019. Available online: https://nces.ed.gov/pubs2019/2019401.pdf (accessed on 16 May 2020).
- Hoyt, A.J. Remedial education and student attrition. Community Coll. Rev. 1999, 27, 51–72. [Google Scholar] [CrossRef]
- National Student Clearinghouse Research Center. National, Persistence, Postsecondary Snapshot Report. NSC Research Center, 2019. Available online: https://nscresearchcenter.org/wp-content/uploads/SnapshotReport35.pdf (accessed on 10 April 2020).
- Diehl, D.; Houseworth, J.; Grier-Reed, T. Examining the variable relationship between race and considerations of campus withdrawal. Coll. Stud. J. 2019, 53, 417–437. [Google Scholar]
- Hagedorn, L.S.; Maxwell, W.; Hampton, P. Correlates of retention for African-American males in community colleges. J. Coll. Stud. Retent. Res. Theory Pract. 2001, 3, 243–263. [Google Scholar] [CrossRef]
- Reason, R.D. Student variables that predict retention: Recent research and new developments. NASPA J. 2003, 40, 72–91. [Google Scholar] [CrossRef]
- Xu, Y.J.; Webber, K.L. College student retention on a racially diverse campus: A theoretically guided reality check. J. Coll. Stud. Retent. Res. Theory Pract. 2016, 20, 2–28. [Google Scholar] [CrossRef]
- Milem, J.F.; Chang, M.J.; Antonio, A.L. Making Diversity Work on Campus: A Research-Based Perspective. Association American Colleges and Universities, 2005. Available online: https://www.aacu.org/sites/default/files/files/mei/milem_et_al.pdf (accessed on 1 March 2020).
- Turk, U. Higher education in Italy: Spatial accessibility, participation and drop-outs. Bus. Econ. Res. 2018, 8, 38–50. [Google Scholar] [CrossRef]
- Franklin, R.S. The roles of population, place, and institution in student diversity in American Higher Education. Growth Chang. A J. Urban Reg. Policy 2013, 44, 30–53. [Google Scholar] [CrossRef] [PubMed]
- Kim, E.; Newton, F.; Downey, R.; Benton, S. Personal factors impacting college student success: Constructing College Learning Effectiveness Inventory (CLEI). Coll. Stud. J. 2010, 44, 112–125. [Google Scholar]
- Hillman, N.; Weichman, T. Education Deserts: The Continued Significance of “Place” in the Twenty-First Century. American Council on Education, Center for Policy Research and Strategy, 2016. Available online: https://www.acenet.edu/Documents/Education-Deserts-The-Continued-Significance-of-Place-in-the-Twenty-First-Century.pdf (accessed on 4 February 2020).
- Beamer, L.; Steinbaum, M. Unequal and Uneven: The Geography of Higher Education Access. Phenomenal World, 2019. Available online: http://phenomenalworld.org/analysis/geography-of-higher-ed (accessed on 1 March 2020).
- Hanewicz, C. Using Geographic Information Systems to Identify Student Retention Pattern. Ph.D. Thesis, Eastern Michigan University, Ypsilanti, MI, USA, 2007. Available online: https://commons.emich.edu/cgi/viewcontent.cgi?article=1890&context=theses (accessed on 11 March 2021).
- Tieken, M.C. College talk and the rural economy: Shaping the educational aspirations of rural, first-generation students. Peabody J. Educ. 2016, 91, 203–223. [Google Scholar] [CrossRef]
- Byun, S.; Meece, J.L.; Irvin, M.J.; Hutchins, B.C. The role of social capital in educational aspirations of rural youth. Rural Sociol. 2012, 77, 355–379. [Google Scholar] [CrossRef]
- W.K Kellogg Foundation. Federal Investment in Rural America Falls Behind. n.d. W.K Kellogg Foundation. Available online: https://www.wkkf.org/~/media/BBDB12471BCA4802898B80658C283442.ashx (accessed on 4 March 2020).
- World Economic Forum. Migration and its Impact on Cities. Word Economic Forum, 2017. Available online: http://www3.weforum.org/docs/Migration_Impact_Cities_report_2017_low.pdf (accessed on 15 March 2020).
- U.S. Census Bureau. County and Metro Area Population Estimates. U.S Census Bureau, 2018. Available online: https://www.census.gov/newsroom/press-kits/2018/metro-county-popestimates.html (accessed on 5 May 2021).
- The Vital Center. A federal-state Compact to Renew the Great Lakes Regions. The Brookings Institution Metropolitan Policy Program. 2006. Available online: https://www.brookings.edu/wp-content/uploads/2016/06/20061020_renewgreatlakes.pdf (accessed on 25 February 2021).
- Wilson, S.G.; Fischetti, T.R. Coastline Population Trends in the United States: 1960 to 2008. U.S. Department of Commerce: Suitland, MD, USA, 2010. Available online: https://www.census.gov/prod/2010pubs/p25-1139.pdf (accessed on 18 April 2020).
- Rothwell, J.; Kulkarni, S. Beyond College Rankings: A Value-Added Approach to Assessing Two-and Four-Year Schools. Metropolitan Policy Program at Brookings: A Value-Added Approach to Assessing. 2015. Available online: https://www.brookings.edu/research/beyond-college-rankings-a-value-added-approach-to-assessing-two-and-four-year-schools/sny (accessed on 18 April 2020).
- Holland, B.; Howard, T.; Seligsohn, A.J. Voices from the field. Metrop. Univ. J. 2018, 23, 5–19. [Google Scholar] [CrossRef]
- Kosar, R.; Scott, D.W. Examining the Carnegie Classification Methodology for Research Universities. Stat. Public Policy 2019, 5, 1–12. [Google Scholar] [CrossRef]
- Peng, C.-Y.J.; Lee, K.L.; Ingersoll, G.M. An introduction to logistic regression analysis and reporting. J. Educ. Res. 2002, 96, 3–14. [Google Scholar] [CrossRef]
- Armitage, P.; Berry, G. Statistical Methods in Medical Research, 3rd ed.; Blackwell Scientific Publications: Hoboken, NJ, USA, 1994; pp. 487–490. [Google Scholar]
- Anselin, L.; Lozano-Gracia, N. Spatial hedonic models. In Palgrave Handbook of Econometrics; Palgrave McMillan: New York, NY, USA, 2009; pp. 1213–1251. [Google Scholar]
- Lin, F.J. Solving multicollinearity in the process of fitting regression model using the nested estimate procedure. Qual. Quant. 2008, 42, 417–426. [Google Scholar] [CrossRef]
- Marcus, R.D. Freshman retention rates at U.S. private colleges: Results from aggregated data. J. Econ. Soc. Meas. 1989, 15, 37–55. [Google Scholar] [CrossRef]
- Johnson, J.; Showalter, D.; Klein, R.; Lester, C. Why Rural Matters 2013–2014: The Condition of Rural Education in the 50 States. Rural School and Community Trust, 2014. Available online: https://ruraledu.org/user_uploads/file/2013-2014-Why-Rural-Matters.pdf (accessed on 25 September 2020).
- Pierson, A.; Hanson, H. Comparing Postsecondary Enrollment and Persistence among Rural and Nonrural Students in Oregon, 2015; U.S. Department of Education, Institute of Education Sciences, National Center for Education Evaluation and Regional Assistance, Regional Educational Laboratory Northwest, Eds.; Institute of Education Sciences: Washington, DC, USA, 2015. [Google Scholar]
- Welsh, R.; Swain, W. (Re) Defining Urban Education: A Conceptual Review and Empirical Exploration of the Definition of Urban Education. Educ. Res. 2020, 49, 90–100. [Google Scholar] [CrossRef]
- Tam, T.; Jiang, J. Divergent Urban-rural Trends in College Attendance: State Policy Bias and Structural Exclusion in China. Sociol. Educ. 2015, 88, 160–180. [Google Scholar] [CrossRef]
- Yang, L.; Venezia, S. The Impact of Financial Aid on Associate Degree Attainment for Rural Community College Students: A Comparison of Rural, Urban, and Suburban Patterns. Community Coll. Rev. 2020, 48, 423–454. [Google Scholar] [CrossRef]
- Gilfillan, B.H. School counselors and college readiness counseling. Prof. Sch. Couns. 2018, 21, 1–10. [Google Scholar] [CrossRef]
- Neale-McFall, C.W.; Owens, E.W. A Comparison of Rural and Urban Secondary School Career Guidance Services; The Center for Rural Pennsylvania: Harrisburg, PA, USA, 2016. [Google Scholar]
- Dhaliwal., T.; Bruno, P. The Rural/Nonrural Divide? K–12 District Spending and Implications of Equity-Based School Funding. AERA Open 2021. [Google Scholar] [CrossRef]
- Riposa, G. Urban universities: Meeting the needs of students. ANNALS Am. Acad. Political Soc. Sci. 2003, 585, 51–65. [Google Scholar] [CrossRef]
- Carnevale, A.P.; Der-Werf, M.V.; Quinn, M.C.; Strohl, J.; Repnikov, D. How Public Colleges Reinforce White Racial Privilege and Marginalize Black and Latino Students. 2018. Available online: https://cew.georgetown.edu/cew-reports/sustates/ (accessed on 4 May 2021).
- Banks, T.; Dohy, J. Mitigating barriers to persistence: A review of effort to improve retention and graduation rates for students of color in Higher Education. High. Educ. Stud. 2019, 9, 118–131. [Google Scholar] [CrossRef]
- Strayhorn, T.L. Factors that influence the persistence and success of black men in urban public universities. Urban Educ. 2017, 52, 1106–1128. [Google Scholar] [CrossRef]
- Sherman, J.; Slate, J.R. Differences in graduation and persistence rates over time for African-American students at Texas 4-year universities. Athens J. Educ. 2020, 7, 353–364. [Google Scholar] [CrossRef]
- Carnevale, A.P.; Strohl, J. Separate & Unequal: How Higher Education Reinforces the Intergenerational Reproduction of White Racial Privilege; Georgetown University Center on Education and the Workforce: Washington, DC, USA, 2013. [Google Scholar]
- Chiyaka, E.T.; Sithole, A.; Manyanga, F.; McCarthy, P.; Bucklein, B.K. Institutional characteristics and student retention: What integrated postsecondary education data reveals about online learning. Online J. Distance Learn. Adm. 2016, 19. [Google Scholar]
- Silvia, F.; Francisco, C.-N. Beta Regression for Modelling Rates and Proportions. J. Appl. Stat. 2004, 31, 799–815. [Google Scholar]
| Publisher’s Note: MDPI stays neutral with regard to jurisdictional claims in published maps and institutional affiliations. |
© 2021 by the authors. Licensee MDPI, Basel, Switzerland. This article is an open access article distributed under the terms and conditions of the Creative Commons Attribution (CC BY) license (https://creativecommons.org/licenses/by/4.0/).


