
Temperature Measurement—Inquiry-Based Learning Activities for Third Graders


Abstract
1. Introduction
2. Materials and Methods
2.1. The Problem of Research
2.2. Methodology of Research
2.3. Sample of Research
2.4. Instrument and Procedures
2.4.1. Inquiry-Based Learning Activities of the Project Titled “Temperature Measurement” (Project Assignment for EG)
2.4.2. Learning Activities of the Topic “Temperature Measurement” for CG
2.5. Data Analysis
3. Results of Research
3.1. Fisher—Snedecor’s F-Test for Pre-Test
3.2. Student’s t-Test for Pre-Test
3.3. Fisher—Snedecor’s F-Test for Post-Test
3.4. Student’s t-Test for Post-Test
4. Discussion
5. Conclusions
Author Contributions
Funding
Institutional Review Board Statement
Informed Consent Statement
Data Availability Statement
Conflicts of Interest
Appendix A

| Question no. | Definition |
|---|---|
| 1 | Fill in the correct word in the next sentence. A thermometer is used to measure……………………………… (a) heat (b) temperature |
| 2 | Write two types of thermometers you know. ……………………………. …………………………… |
| 3 | Circle the correct answer. A dimension of temperature is: (a) kilogram (b) degree Celsius (c) meter (d) liter |
| 4 | Write down the value of a person’s normal body temperature. …….. °C. |
| 5 | Fill in the correct word, either heat or temperature. A hot soup has a high ................................. From sun to frozen river a ................................... can be transported If it is cold outside, the thermometer shows a low ………… |
| 6 | Answer the following questions: What happens to liquid water if we place it in a freezer? ……………… What happens to an ice cube if it is placed in a cup of hot tea? ……… |
| 7 | What happens to liquid water when it boils? Mark the correct answer. (a) bubbles (b) changes color (c) nothing |
| 8 | Circle the correct answer: When water boils it changes to (a) an ice (b) a steam |
| 9 | Imagine that we make the following experiment: 1. We fill a transparent bowl with warm water. 2. We place a cold lid on the bowl. Write down what you would observe on the underside of the lid. ……………………………………………………………………………………………………………………………………………………………………………… |
| 10 | Of the following values, the air has the lowest temperature when the thermometer shows: (a) −3 °C (b) 0 °C (c) −15 °C |
| 11 | Arrange the following temperature values from highest to lowest. (a) 8 °C (b) −12 °C (c) 24 °C (d) −3 °C |
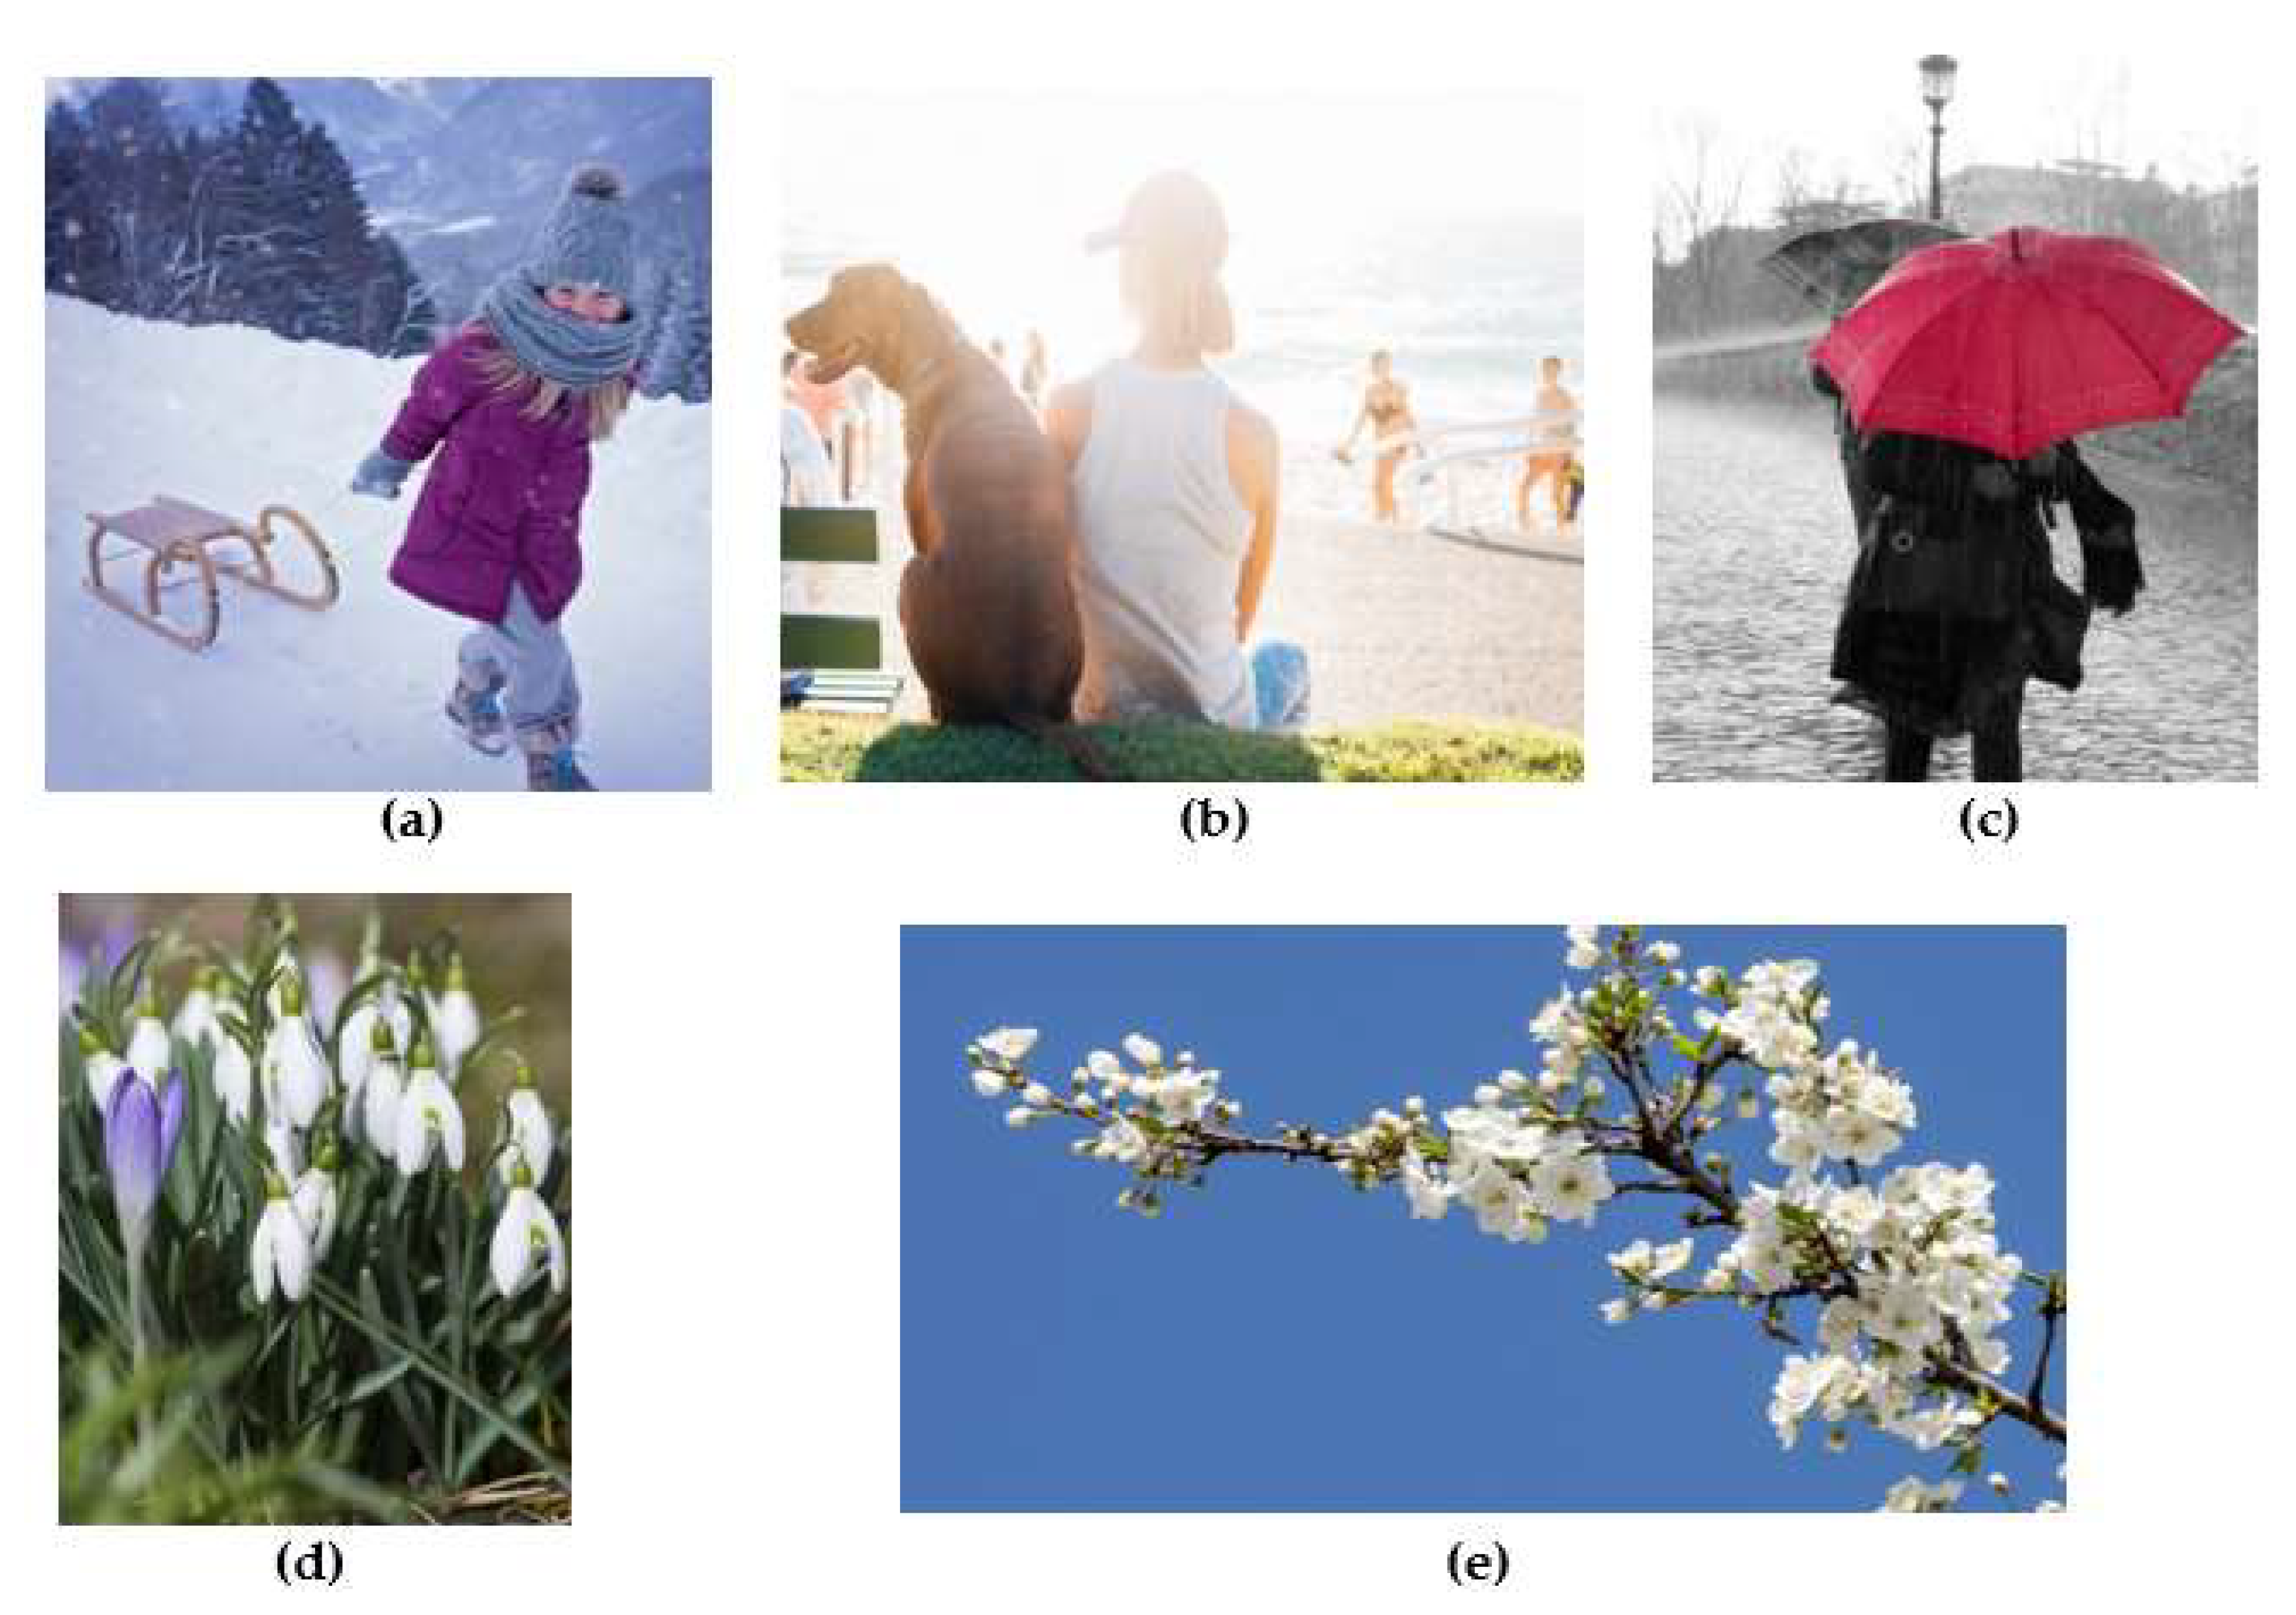
| 12 | Assign the correct characteristics of year seasons A–fruits are harvested, leaves fall off B–snow melts, trees are green C–flowers blossom, air is very hot D–water freezes, daylight is short spring: …………………………………………………… summer: ………………………………............................. autumn: ………………………………………………… winter: ………………………………………………… |
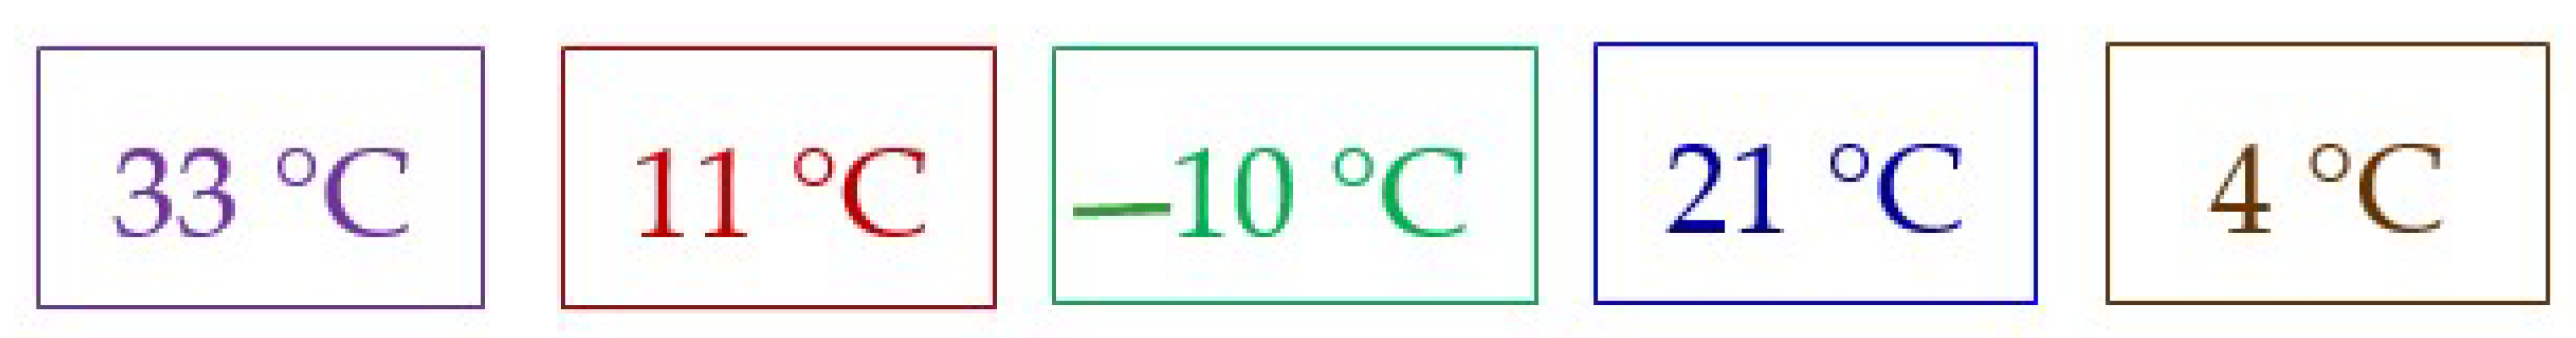
| 13 | Assign the correct temperature to each season. (a) 5 °C (b) −15 °C (c) 35 °C (d) 25 °C spring…………summer………autumn……………winter……….. |
| 14 | Circle hot objects on the following list: (a) Ice cream (b) Burning candle (c) Ice cube (d) Boiling water |
| 15 | Write down the typical temperature of the following objects |
| Question no. | Definition |
|---|---|
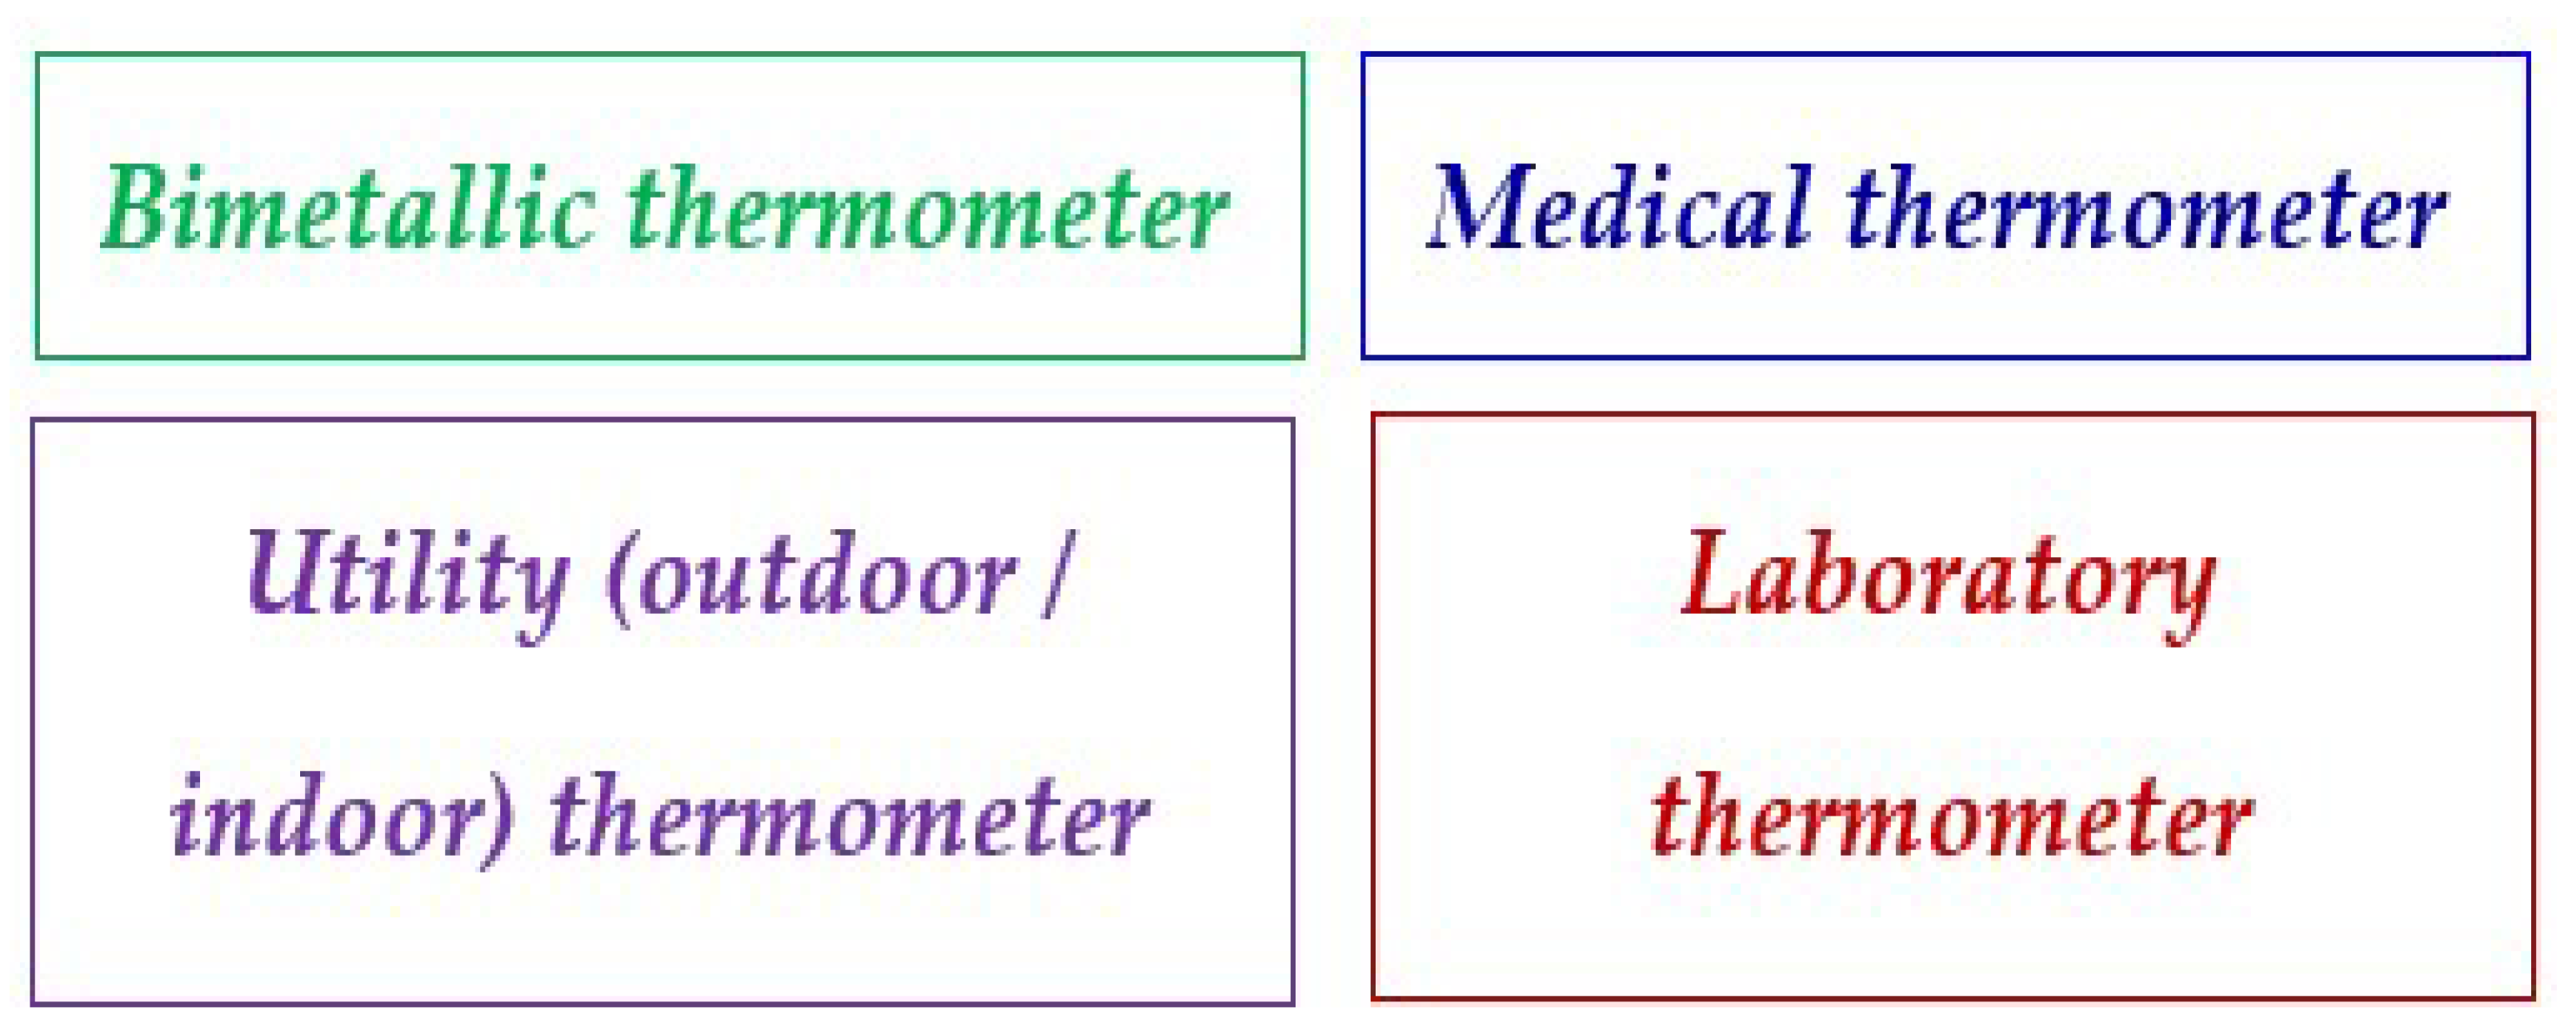
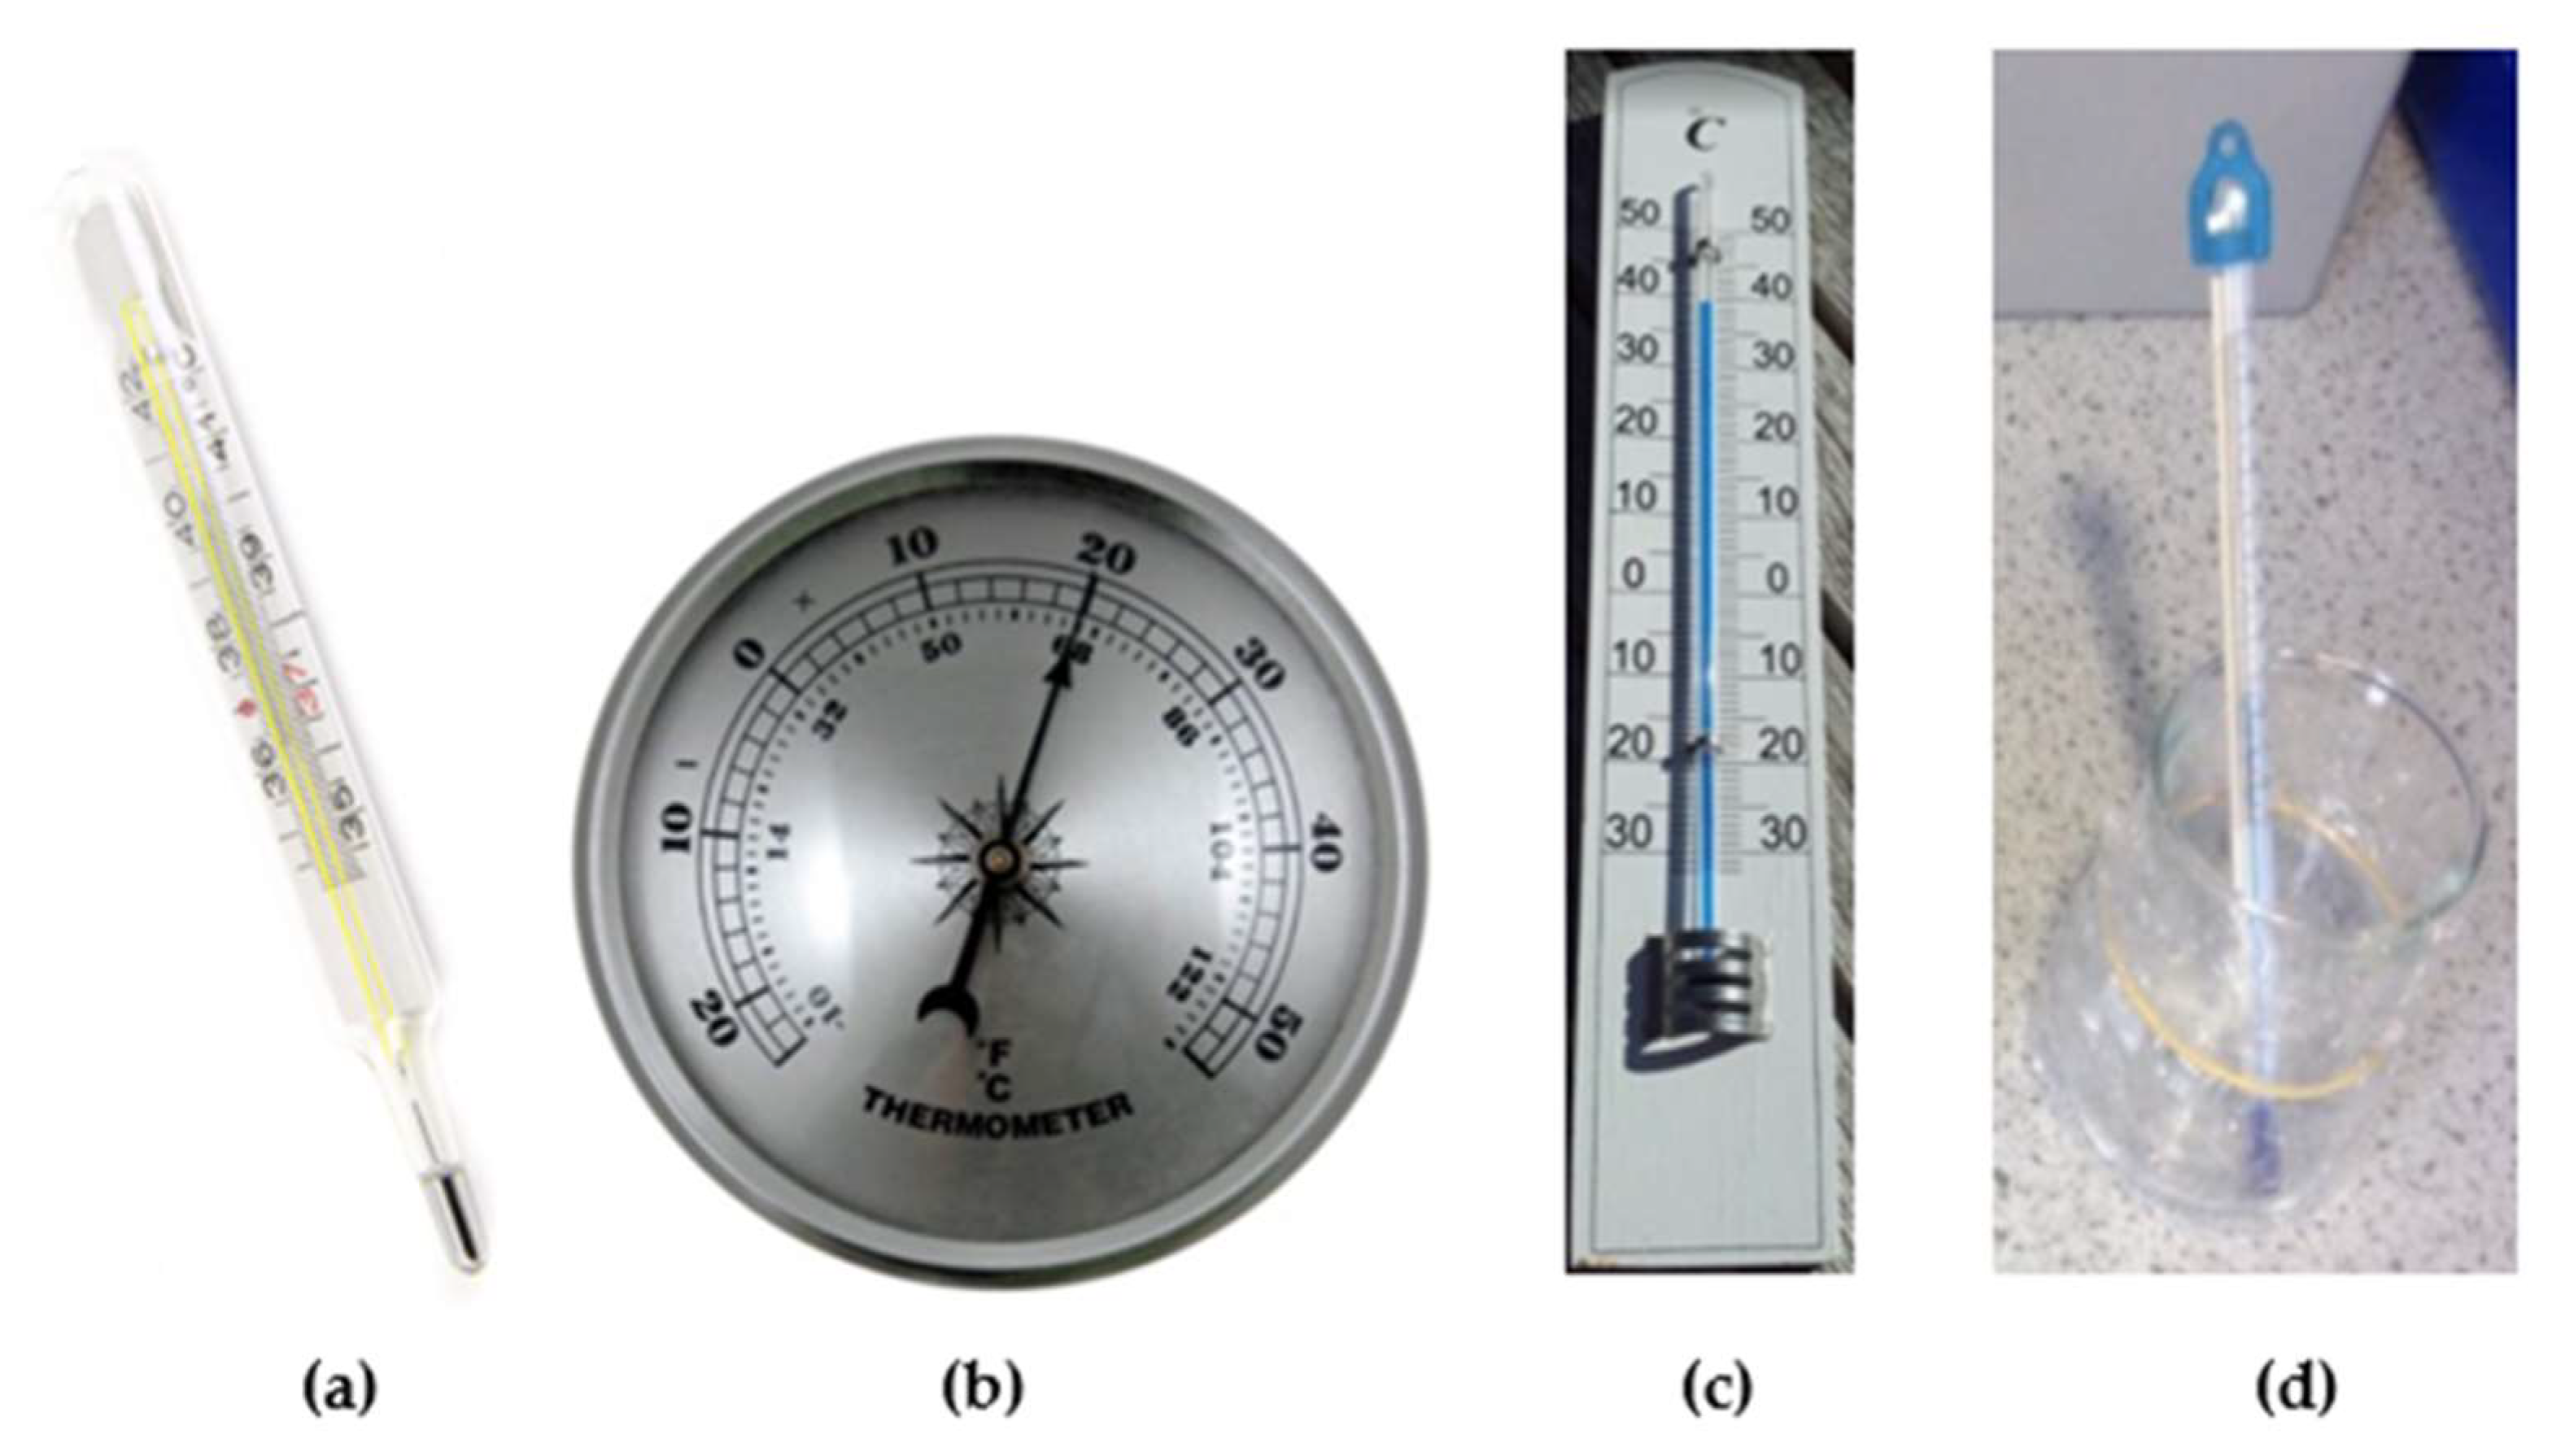
| 1 | Name 4 types of thermometers that you know. …………………………….. ……………………………….. …………………………….. ……………………………….. |
| 2 | What temperature value would a medical thermometer show if you had a fever? Underline the correct answer from the options provided. (a) 36 °C (b) 39 °C (c) 37 °C |
| 3 | Indicate an elevated human body temperature on the following picture |
| 4 | Fill in the correct answer: (a) the boiling point of water is ………………°C. (b) the melting point of ice is …………………°C. |
| 5 | Mark the measured temperature value on the scale of each thermometer. |
| 6 | What can be a temperature of a snow flake? Mark all alternatives: (a) −5 °C (b) 13 °C (c) −3 °C (d) 20 °C |
| 7 | If we mix boiling water with iced water the resulting water temperature can be: (a) 0 °C, (b) 20 °C, (c) 100 °C, (d) smaller than 100 °C, (e) higher than 0 °C Mark all possible answers. |
| 8 | Underline the correct answer: We measure the body temperature body using: (a) room thermometer, (b) medical thermometer, (c) bimetallic thermometer, (d) any thermometer, that is not damaged. |
| 9 | Write down the temperature measured by each thermometer. |
| 10 | Explain why an outdoor temperature cannot be measured by medical thermometer. ……………………………………………………………………………………………………………………………………………………………………………… |
References
- Pedaste, M.; Mitt, G.; Jürivete, T. What Is the Effect of Using Mobile Augmented Reality in K12 Inquiry-Based Learning? Educ. Sci. 2020, 10, 94. [Google Scholar] [CrossRef]
- Pedaste, M.; Mäeots, M.; Siiman, L.A.; de Jong, T.; van Riesen, S.A.N.; Kamp, E.T.; Manoli, C.C.; Zacharia, Z.C.; Tsourlidaki, E. Phases of inquiry-based learning: Definitions and the inquiry cycle. Educ. Res. Rev. 2015, 14, 47–61. [Google Scholar] [CrossRef]
- Keselman, A. Supporting inquiry learning by promoting normative understanding of multivariable causality. J. Res. Sci. Teach. 2003, 40, 898–921. [Google Scholar] [CrossRef]
- Chu, S.K.W.; Reynolds, R.B.; Tavares, N.J.; Notari, M.; Lee, C.W.Y. 21st Century Skills Development Through Inquiry-based Learning; (eBook); Springer: Singapore, 2017; pp. 3–16. [Google Scholar] [CrossRef]
- Karpudewan, M.; Zain, A.N.; Chandrasegaran, A.L. Overcoming Students’Misconceptions in Science Strategies and Perspectives from Malaysia; (eBook); Springer Nature Singapore Pte Ltd.: Singapore, 2017. [Google Scholar] [CrossRef]
- Van Uum, M.S.J.; Verhoeff, R.P.; Peeters, M. Inquiry-based science education: Towards a pedagogical framework for primary school teachers. Int. J. Sci. Educ. 2016, 38, 450–469. [Google Scholar] [CrossRef]
- Berg, C.A.R.; Bergendahl, V.C.B.; Lundberg, B.K.S.; Tibell, L.A.E. Benefiting from an open-ended experiment? A comparison of attitudes to, and outcomes of, an expository versus an open-inquiry version of the same experiment. Int. J. Sci. Educ. 2003, 25, 351–372. [Google Scholar] [CrossRef]
- Vlaardingerbroek, B.; Taylor, N.; Bale, C.; Kennedy, J. Linking the experiential, affective and cognitive domains in biology education: A case study-microscopy. J. Biol. Educ. 2017, 51, 144–150. [Google Scholar] [CrossRef]
- Bagalová, L.; Siváková, M. Activating Methods and Approaches in Natural Science Education (Application of Research Procedures in Science Teaching at Primary School)—Aktivizujúce metódy a prístupy v prírodovednom vzdelávaní (Uplatnenie bádateľských postupov vo vyučovaní prírodovedy na 1. stupni ZŠ). 2012. Available online: http://www.statpedu.sk/files/articles/dokumenty/vzdelavacie-aktivity/aktivizujuce-metody-v-prirodovede_fin.pdf (accessed on 2 July 2021). (In Slovak).
- Wenning, C. Levels of Inquiry: Hierarchies of pedagogical practices and inquiry processes. J. Phys. Teach. Educ. Online 2005, 2, 3–11. Available online: http://www.phy.ilstu.edu/pte/311content/inquiry/levels_of_inquiry.pdf (accessed on 2 July 2021).
- The ESTABLISH (European Science and Technology in Action: Building Links with Industry, Schools and Home) Project. Available online: www.establish-fp7.eu (accessed on 2 July 2021).
- Banchi, H.; Bell, R.L. Simple strategies for evaluating and scaffolding inquiry. Sci. Child. 2008, 45, 28–31. [Google Scholar]
- Trundle, K.C. Teaching Science During the Early Childhood Years. Best Practices in Science Education. National Geographic. Available online: http://ngspscience.com/profdev/Monographs/SCL22-0429A_SCI_AM_Trundle_lores.pdf (accessed on 16 August 2021).
- Kirschner, P.; Sweller, J.; Clark, R. Why minimal guidance during instruction does not work: An analysis of the failure of constructivist, discovery, problem-based, experimental, and inquiry-based teaching. Educ. Psychol. 2006, 40, 75–86. [Google Scholar] [CrossRef]
- Zion, M.; Cohen, S.; Amir, R. The spectrum of dynamic inquiry teaching practices. Res. Sci. Educ. 2007, 37, 423–447. [Google Scholar] [CrossRef]
- Hadzigeorgiou, Y. A study of the development of the concept of mechanical stability in preschool children. Res. Sci. Educ. 2002, 32, 373–391. [Google Scholar] [CrossRef]
- Eshach, H.; Fried, M.N. Should science be taught in early childhood? J. Sci. Educ. Technol. 2005, 14, 315–336. [Google Scholar] [CrossRef]
- Watters, J.J.; Diezmann, C.M.; Grieshaber, S.J.; Davis, J.M. Enhancing science education for young children: A contemporaryinitiative. Aust. J. Early Child. 2001, 26, 1–7. [Google Scholar] [CrossRef]
- Ravanis, K.; Kaliampos, G.; Pantidos, P. Preschool Children Science Mental Representations: The Sound in Space. Educ. Sci. 2021, 11, 242. [Google Scholar] [CrossRef]
- Piaget, J. Children’s Conceptions of the World; Original Work Published 1928; Tomlinson, J.A., Translator; Littlefield Adams: Lanham, MD, USA, 1972. [Google Scholar]
- Bell, B. Children’s Science, Constructivism and Learning in Science; Deakin University: Geelong, Australia, 1993. [Google Scholar]
- Duit, R.; Treagust, D.F. Students’ conceptions and constructivist teaching approaches. In Improving Science Education; Fraser, B.J., Walberg, H.J., Eds.; The University of Chicago Press: Chicago, IL, USA, 1995; pp. 46–69. [Google Scholar]
- Mbamalu, G.E. Teaching science to academically underprepared students. J. Sci. Educ. Technol. 2001, 10, 267–272. [Google Scholar] [CrossRef]
- Atkins, P.; de Paula, J. Physical Chemistry, 8th ed.; W.H. Freeman and Company: New York, NY, USA, 2006; ISBN 0-7167-8759-8. [Google Scholar]
- Tang, K.-S.; Tan, S.-C. Intertextuality and multimodal meanings in high school physics: Written and spoken language in computer-supported collaborative student discourse. Classr. Discourse 2017, 8, 19–35. [Google Scholar] [CrossRef]
- Paik, S.H.; Cho, B.K.; Go, Y.M. Korean 4- to 11-year-old student conceptions of heat and temperature. J. Res. Sci. Teach. 2007, 44, 284–302. [Google Scholar] [CrossRef]
- Jelinek, J.A. Children’s Astronomy. Development of the Shape of the Earth Concept in Polish Children between 5 and 10 Years of Age. Educ. Sci. 2021, 11, 75. [Google Scholar] [CrossRef]
- Alwan, A.A. Misconception of heat and temperature among physics students. Procedia Soc. Behav. Sci. 2011, 12, 600–614. [Google Scholar] [CrossRef]
- Prince, M.; Vigeant, M.; Nottis, K. Development of the Heat and Energy Concept Inventory: Preliminary Results on the Prevalence and Persistence of Engineering Students’ Misconceptions. J. Eng. Educ. 2012, 101, 412–438. [Google Scholar] [CrossRef]
- Sözbilir, M. A Review of Selected Literature on Students’ Misconceptions of Heat and Temperature, Boğaziçi University. J. Educ. 2003, 20, 25–41. [Google Scholar]
- Thomaz, M.F.; Malaquias, I.M.; Valente, M.C.; Antunes, M.J. An attempt to overcome alternative conceptions related to heat and temperature. Phys. Educ. 1995, 30, 19–26. [Google Scholar] [CrossRef]
- Bar, V. Children’s views about the water cycle. Sci. Educ. 1989, 73, 481–500. [Google Scholar] [CrossRef]
- Kambouri-Danos, M.; Ravanis, K.; Jameau, A.; Boilevin, J.-M. The water state changes in 5-6 years old children’s thinking: The construction of a precursor model. Early Child. Educ. J. 2019, 47, 475–488. [Google Scholar] [CrossRef]
- Levins, L. Students’ understanding of concepts related to evaporation. Res. Sci. Educ. 1992, 22, 263–272. [Google Scholar] [CrossRef]
- Russell, T.; Harlen, W.; Watt, D. Children’s ideas about evaporation. Int. J. Sci. Educ. 1989, 11, 566–576. [Google Scholar] [CrossRef]
- Tytler, R. A comparison of year 1 and year 6 students’ conceptions of evaporation and condensation: Dimensions of conceptual progression. Int. J. Sci. Educ. 2000, 22, 447–467. [Google Scholar] [CrossRef]
- Bar, V.; Galili, I. Stages of children’s views about evaporation. Int. J. Sci. Educ. 1994, 16, 157–174. [Google Scholar] [CrossRef]
- Ravanis, K.; Papandreou, M.; Kampeza, M.; Vellopoulou, A. Teaching activities for the construction of a precursor model in 5–6 years old children’s thinking: The case of thermal expansion and contraction of metals. Eur. Early Child. Educ. Res. J. 2013, 21, 514–526. [Google Scholar] [CrossRef]
- Kaliampos, G.; Ravanis, K. Thermal conduction in metals: Mental representations in 5–6 years old children’s thinking. J. Ilm. Pendidik. Fis. Al-BiRuNi 2019, 8, 1–9. [Google Scholar] [CrossRef]
- Ravanis, K.; Bagakis, G. Science education in kindergarten: Sociocognitive perspective. Int. J. Early Years Educ. 1998, 6, 315–327. [Google Scholar] [CrossRef]
- Sesto, V.; García-Rodeja, I. How Do Five- to Six-Year-Old Children Interpret a Burning Candle? Educ. Sci. 2021, 11, 213. [Google Scholar] [CrossRef]
- Kampeza, M.; Vellopoulou, A.; Fragkiadaki, G.; Ravanis, K. The expansion thermometer in preschoolers’ thinking. J. Balt. Sci. Educ. 2016, 15, 185–193. [Google Scholar]
- Cruz-Guzmán, M.; García-Carmona, A.; Criado, A.M. Aprendiendo sobre los cambios de estado en educación infantil mediante secuencias de pregunta-predicción comprobación experimental [Learning about state changes in early childhood education through question-prediction sequences experimental testing]. Enseñanza De Las Cienc. 2017, 35, 175–193. [Google Scholar] [CrossRef]
- Yeo, J.; Lim, E.; Tan, K.C.H.D.; Ong, Y.S. The Efficacy of an Image-to-Writing Approach to Learning Abstract Scientific Concepts: Temperature and Heat. Int. J. Sci. Math. Educ. 2021, 19, 21–44. [Google Scholar] [CrossRef]
- Spencer, T.S.; Walker, T.M. Creating a Love for Science for Elementary Students through Inquiry-based Learning. J. Va. Sci. Educ. 2011, 4, 18–21. [Google Scholar]
- Prince, M.; Vigeant, M.; Nottis, K. Using Inquiry-Based Activities to Repair Student Misconceptions Related to Heat, Energy and Temperature. Front. Educ. Conf. Proc. 2012, 1, 1–5. [Google Scholar] [CrossRef]
- Alake-Tuenter, E.; Biemans, H.J.; Tobi, H.; Wals, A.E.; Oosterheert, I.; Mulder, M. Inquiry-Based Science Education Competencies of Primary School Teachers: A literature study and critical review of the American National Science Education Standards. Int. J. Sci. Educ. 2012, 34, 2609–2640. [Google Scholar] [CrossRef]
- Suduca, A.-M.; Bizoia, M.; Gorghiu, G. Inquiry Based Science Learning in Primary Education. Procedia—Soc. Behav. Sci. 2015, 205, 474–479. [Google Scholar] [CrossRef]
- Yoon, H.-G.; Joung, Y.J.; Kim, M. The challenges of science inquiry teaching for preservice teachers in elementary classrooms: Difficulties on and under the scene. Res. Sci. Educ. 2012, 42, 589–608. [Google Scholar] [CrossRef]
- Condliffe, B.; Quint, J.; Visher, M.G.; Bangser, M.R.; Drohojowska, S.; Saco, L.; Nelson, E. Project-Based Learning A Literature Review; Working Paper; MDRC®: New York, NY, USA, 2017. [Google Scholar]
- Gerhátová, Ž.; Perichta, P.; Palcut, M. Project-Based Teaching of the Topic “Energy Sources” in Physics via Integrated e-Learning—Pedagogical Research in the 9th Grade at Two Primary Schools in Slovakia. Education Sci. 2020, 10, 371. [Google Scholar] [CrossRef]
- Schauer, F.; Ožvoldová, M.; Lustig, F. Integrated e-Learning—New Strategy of Cognition of Real World in Teaching Physics. Available online: https://www.researchgate.net/profile/Franz-Schauer/publication/268257327_INTEGRATED_e-LEARNING_-NEW_STRATEGY_OF_THE_COGNITION_OF_REAL_WORLD_IN_TEACHING_PHYSICS/links/55db16fe08aec156b9aed09c/INTEGRATED-e-LEARNING-NEW-STRATEGY-OF-THE-COGNITION-OF-REAL-WORLD-IN-TEACHING-PHYSICS.pdf (accessed on 4 November 2020).
- Tkáč, L.; Schauer, F. Remote experiments for Integrated e-Learning in Electricity and Magnetism course. In Proceedings of the Conference REV 2011, Brasov, Romania, 28 June–1 July 2011; Kassel University Press: Brasov, Romania, 2011; pp. 262–269. [Google Scholar]
- Literature Review: Conducting & Writing; University of West Florida: Pensacola, FL, USA, 2021; Available online: https://libguides.uwf.edu/c.php?g=215199&p=1420520,%20http://ddeku.edu.in/Files/2cfa4584-5afe-43ce-aa4b-ad936cc9d3be/Custom/Methods%20of%20educational%20research.pdf (accessed on 30 August 2021).
- Showkat, R.W. Methods of Educational Research. Available online: http://ddeku.edu.in/Files/2cfa4584-5afe-43ce-aa4b-ad936cc9d3be/Custom/Methods%20of%20educational%20research.pdf (accessed on 30 August 2021).
- Koul, L.; Kumar, H.; Chawla, D.; Sondhi, N. Methodology of Educational Research. Available online: https://www.tripurauniv.ac.in/Content/pdf/StudyMaterialsDetail/MA%20Education%202nd%20Semester/EDCN-801C-Methodology%20of%20Educational%20Research.pdf (accessed on 30 August 2021).
- Lodico, M.G.; Dean, T.; Spaulding, D.T.; Voegtle, K.H. Methods in Educational Research, From Theory to Practice; Jossey-Bass: San Francisco, CA, USA, 2006. [Google Scholar]
- Cohen, L.; Manion, L.; Morrison, K. Research Methods in Education, 6th ed.; Taylor & Francis Group: Boca Raton, FL, USA, 2007. [Google Scholar]
- Hrmo, R.; Kundrátová, M.; Tináková, K.; Vašková, L’. Didaktika Technických Predmetov/Didactics of Technical Subjects/; Slovak University of Technology: Bratislava, Slovakia, 2005; ISBN 80-227-2191-3. (In Slovak) [Google Scholar]
- Žoldošová, K. Prírodoveda—štátny vzdelávací program (príloha); Science—State Educational Program (Supplement); The International Standard Classification of Education—ISCED 1; Štátny pedagogický ústav./State Pedagogical Institute: Bratislava, Slovakia, 2011; Available online: https://cloud7z.edupage.org/cloud/prirodoveda_isced1.pdf?z%3AOtsxtITQBwrv4A6XhsLldJb9r%2FKLF2rZbZvie%2BSjkD6nr7rW2cD2lnVppmurjOVw (accessed on 2 July 2021). (In Slovak)
- Acher, A.; Arca, M.; Samnarti, N. Modeling as a teaching learning process for understanding materials: A case study in primary education. Sci. Educ. 2007, 91, 398–418. [Google Scholar] [CrossRef]
- Kuhn, D.; Pease, M.A. What Needs to Develop in the Development of Inquiry Skills? Cogn. Instr. 2008, 26, 512–559. [Google Scholar] [CrossRef]
- SMART Notebook 18 Gallery—SMART Software; Smart Technologies: Calgary, AB, Canada, 2021; Available online: http://smarttech.com/kb/171185 (accessed on 2 July 2021).
- Feverish woman—Picture. Available online: https://openclipart.org/detail/154741/feverish-woman (accessed on 2 July 2021).
- Heated Milk—Picture. Available online: https://pxhere.com/sk/photo/1641470 (accessed on 2 July 2021).
- Iron—Picture. Available online: https://pxhere.com/sk/photo/1158828 (accessed on 2 July 2021).
- Ice Cream—Picture. Available online: https://pxhere.com/sk/photo/698851 (accessed on 2 July 2021).
- Hot Soup—Picture. Available online: https://pxhere.com/sk/photo/1641287 (accessed on 2 July 2021).
- Orange Juice—Picture. Available online: https://pxhere.com/sk/photo/1600418 (accessed on 2 July 2021).
- Iced water in a glass—Picture. Available online: https://openclipart.org/detail/23869/glass (accessed on 2 July 2021).
- The Interactive Simulation Entitled “Energy Forms and Changes”. Available online: http://phet.colorado.edu/en/simulation/energy-forms-and-changes (accessed on 2 July 2021).
- Medical Thermometer—Picture. Available online: https://pxhere.com/sk/photo/1159519 (accessed on 2 July 2021).
- Bimetallic Thermometer—Picture. Available online: https://pxhere.com/sk/photo/941464 (accessed on 2 July 2021).
- Utility (Outdoor/Indoor) Thermometer—Picture. Available online: https://pxhere.com/sk/photo/893472 (accessed on 2 July 2021).
- Laboratory Thermometer—Picture. Available online: https://pxhere.com/sk/photo/651822 (accessed on 2 July 2021).
- Snowfall in Winter—Picture. Available online: https://pxhere.com/sk/photo/661555 (accessed on 2 July 2021).
- Sunny in Hot Summer—Picture. Available online: https://pxhere.com/sk/photo/140294 (accessed on 2 July 2021).
- Rainy in Autumn—Picture. Available online: https://pxhere.com/sk/photo/985062 (accessed on 2 July 2021).
- Snowdrops and Crocuses in the Spring—Picture. Available online: https://pxhere.com/sk/photo/1134282 (accessed on 2 July 2021).
- Blossoming Cherry in Spring—Picture. Available online: https://pxhere.com/sk/photo/1641901 (accessed on 2 July 2021).
- Schematic of weather symbols—Picture. Available online: https://openclipart.org/detail/18414/weather-symbols (accessed on 2 July 2021).
- Weather—Current Affairs. Available online: http://pocasie.aktuality.sk/ (accessed on 2 July 2021).
- Vuković, A.-M. Exploring Integers on a Temperature Scale. 2013. Available online: https://www.geogebra.org/m/gEvAbJ6C (accessed on 2 July 2021).
- Meteorological station in Klatovy (Czech Republic)—The Real Remote Experiment. Available online: http://remote-lab.fyzika.net/experiment/12/experiment-12.php?lng=en (accessed on 2 July 2021).
- Hahs-Vaughn, D.L.; Lomax, R.G. An Introduction to Statistical Concepts, 4th ed.; First Published 2020, eBook Published 21 February 2020; Routledge: New York, NY, USA, 2020. [Google Scholar] [CrossRef]
- Kostelníková, M.; Ožvoldová, M. Inquiry in Physics Classes by means of Remote Experiments. Procedia—Soc. Behav. Sci. 2013, 89, 133–138. [Google Scholar] [CrossRef][Green Version]
- Karpudewan, M.; Ponniah, P.; Zain, A.N. Project-Based Learning: An Approach to Promote Energy Literacy Among Secondary School Students. Asia-Pac. Educ. Res. 2016, 25, 229–237. [Google Scholar] [CrossRef]
- Kilinc, A.; Stanisstreet, M.; Boyes, E. Turkish students’ ideas about global warming. Int. J. Environ. Sci. Educ. 2008, 3, 89–98. [Google Scholar]
- Baumgartner, E.; Zabin, C.J. A case study of project-based instruction in the ninth grade: A semester-long study of intertidal biodiversity. Environ. Educ. Res. 2008, 14, 97–114. [Google Scholar] [CrossRef]
- Han, S.; Capraro, R.; Capraro, M.M. How science, technology, engineering, and mathematics (STEM) project-based learning (PBL) affects high, middle, and low achievers differently: The impact of student factors on achievement. Int. J. Sci. Math. Educ. 2014, 13, 1089–1113. [Google Scholar] [CrossRef]
- Lin, K.Y.; Lu, S.C. Effects of Project-based Activities in Developing High School Students’ Energy Literacy. J. Balt. Sci. Educ. 2018, 17, 867–877. [Google Scholar] [CrossRef]
- Chang, C.C.; Kuo, C.G.; Chang, Y.H. An Assessment Tool Predicts Learning Effectiveness for Project-Based Learning in Enhancing Education of Sustainability. Sustainability 2018, 10, 3595. [Google Scholar] [CrossRef]
- Chang, S.-C.; Hwang, G.-J. Impacts of an augmented reality-based flipped learning guiding approach on students’ scientific project performance and perceptions. Comput. Educ. 2018, 125, 226–239. [Google Scholar] [CrossRef]
- Worth, K.; Duque, M.; Saltiel, E. Designing and Implementing Inquiry-Based Science Units for Primary Education; Pollen: La main à la pâte 1, rue Maurice Arnoux 92 120 Montrouge France 2009; Available online: https://www.fondation-lamap.org/sites/default/files/upload/media/Guide_Designing%20and%20implementing%20IBSE_final_light.pdf (accessed on 2 July 2021).
- Atmojo, I.R.W.; Sajidan; Sunarno, W.; Ashadi, A. Profile of Elementary School Pre-Service Teacher Based on High Order Thinking Skills (HOTS) on Natural Science Subject. Proceedings of the International Conference on Teacher Training and Education (ICTTE 2017); Faculty of Technics and Technologies of Yambol, Trakia University: Stara Zagora, Bulgaria; Volume 158, pp. 360–363. Available online: https://www.atlantis-press.com/proceedings/ictte-17/25885763 (accessed on 4 September 2021). [CrossRef]


| Statistical Variables | Pre-Test | |
|---|---|---|
| EG | CG | |
| Mean | 17.63 | 18.67 |
| Error of the Mean | 1.36 | 1.34 |
| Median | 19 | 20 |
| Modus | 20 | 27 |
| Stand. Deviation | 7.46 | 7.32 |
| Sample Variance | 55.62 | 53.61 |
| Kurtosis | −0.82 | −1.08 |
| Skewness | −0.18 | −0.17 |
| Difference max.-min. | 26 | 24 |
| Minimum | 4 | 6 |
| Maximum | 30 | 30 |
| Sum | 529 | 560 |
| Count | 30 | 30 |
| Highest score | 30 | 30 |
| Lowest score | 4 | 6 |
| Confidence Level (95.0%) | 2.78 | 2.73 |
| Statistical Variables | Post-Test | |
|---|---|---|
| EG | CG | |
| Mean | 20.17 | 16.27 |
| Error of the Mean | 1.30 | 1.26 |
| Median | 22 | 16 |
| Modus | 23 | 20 |
| Stand. Deviation | 7.14 | 6.89 |
| Sample Variance | 51.04 | 47.44 |
| Kurtosis | −0.87 | −1.18 |
| Skewness | −0.38 | −0.14 |
| Difference max.-min. | 24 | 23 |
| Minimum | 6 | 5 |
| Maximum | 30 | 28 |
| Sum | 605 | 488 |
| Count | 30 | 30 |
| Highest score | 30 | 28 |
| Lowest score | 6 | 5 |
| Confidence Level (95.0%) | 2.67 | 2.57 |
| Pre-Test | ||
|---|---|---|
| Statistical Variables | EG | CG |
| Mean | 17.63 | 18.31 |
| Variance | 55.62 | 51.58 |
| Observation | 30 | 29 |
| Difference | 29 | 28 |
| F | 1.08 | |
| P(F ≤ f) (1) | 0.42 | |
| F crit. (1) | 1.88 | |
| Statistical Variables | Pre-Test | |
|---|---|---|
| EG | CG | |
| Mean | 17.63 | 18.67 |
| Variance | 55.62 | 53.61 |
| Observation | 30 | 30 |
| Common Variance | 54.61 | |
| Hyp. difference of Means | 0 | |
| Difference | 58 | |
| t stat | −0.54 | |
| P(T ≤ t) (1) | 0.30 | |
| t crit (1) | 1.67 | |
| P(T ≤ t) (2) | 0.59 | |
| t crit (2) | 2.00 | |
| Post-Test | ||
|---|---|---|
| Statistical Variables | EG | CG |
| Mean | 20.17 | 16.27 |
| Variance | 51.04 | 47.44 |
| Observation | 30 | 30 |
| Difference | 29 | 29 |
| F | 1.08 | |
| P(F ≤ f) (1) | 0.42 | |
| F crit. (1) | 1.86 | |
| Statistical Variables | Post-Test | |
|---|---|---|
| EG | CG | |
| Mean | 20.17 | 16.27 |
| Variance | 51.04 | 47.44 |
| Observation | 30 | 30 |
| Common Variance | 49.24 | |
| Hyp. difference of Means | 0 | |
| Difference | 58 | |
| t stat | 2.15 | |
| P(T ≤ t) (1) | 0.02 | |
| t crit (1) | 1.67 | |
| P(T ≤ t) (2) | 0.036 | |
| t crit (2) | 2.00 | |
Publisher’s Note: MDPI stays neutral with regard to jurisdictional claims in published maps and institutional affiliations. |
© 2021 by the authors. Licensee MDPI, Basel, Switzerland. This article is an open access article distributed under the terms and conditions of the Creative Commons Attribution (CC BY) license (https://creativecommons.org/licenses/by/4.0/).
Share and Cite
Gerhátová, Ž.; Perichta, P.; Drienovský, M.; Palcut, M. Temperature Measurement—Inquiry-Based Learning Activities for Third Graders. Educ. Sci. 2021, 11, 506. https://doi.org/10.3390/educsci11090506
Gerhátová Ž, Perichta P, Drienovský M, Palcut M. Temperature Measurement—Inquiry-Based Learning Activities for Third Graders. Education Sciences. 2021; 11(9):506. https://doi.org/10.3390/educsci11090506
Chicago/Turabian StyleGerhátová, Žaneta, Peter Perichta, Marián Drienovský, and Marián Palcut. 2021. "Temperature Measurement—Inquiry-Based Learning Activities for Third Graders" Education Sciences 11, no. 9: 506. https://doi.org/10.3390/educsci11090506
APA StyleGerhátová, Ž., Perichta, P., Drienovský, M., & Palcut, M. (2021). Temperature Measurement—Inquiry-Based Learning Activities for Third Graders. Education Sciences, 11(9), 506. https://doi.org/10.3390/educsci11090506