Abstract
In the Next Generation Science Standards (NGSS), problem-solving skills are part of science and engineering practices for K–12 students in the United States. Evaluating these skills for the youngest learners is difficult due to the lack of established measures. This paper reports on our process of developing an observation instrument to measure preschool children’s learning and their application of problem-solving skills, namely, the steps of the engineering design process (EDP). The instrument, Engineering Preschool Children Observation Tool (EPCOT), was intended to evaluate the frequencies of problem-solving behaviors and use of EDP-related vocabulary by observing preschoolers engaged with the Seeds of STEM eight-unit curriculum in the classroom. In this paper, we describe the development process and revision of EPCOT, its current constructs, and present descriptive findings from using the tool in a pilot study with sixteen classrooms: eight intervention classrooms who received the entire curriculum, and eight comparison classrooms who received only the eighth unit of the curriculum (to enable comparison). We found that, out of 34 possible behaviors across the problem-solving process, children in all classrooms engaged in 31 unique problem-solving behaviors, suggesting that preschool children are indeed capable of meaningfully engaging in solving problems. We also observed a trend that children who were exposed to more of the curriculum (the intervention group) produced more novel vocabulary words than those in the comparison group, who tended to repeat vocabulary words. Since EPCOT was developed in alignment with state and national standards, we believe it has the potential to be used with other early childhood engineering/problem-solving curricula.
1. Introduction
Policymakers, educators, and researchers consider science, technology, engineering, and math (STEM) literacy and expertise to be critical human capital competencies for the 21st century. However, research points at persistent gaps in the United States with regard to access, opportunities, and performance in K–12 STEM education, where female students, racial minority students, and students from high poverty backgrounds lag behind their White male and Asian counterparts—a pattern demonstrated as early as kindergarten [1,2,3].
Despite promising evidence that introducing STEM/engineering ideas and practices during the early childhood years supports children’s cognitive development and positive attitudes toward learning and inquiry [4,5,6,7], there is very little STEM instruction within pre-kindergarten classrooms [8,9]. In recent years, several published reports called for investment in early childhood STEM research, curricula, and high-quality professional development programs for teachers [10,11]. However, eight years after the release of the K–12 Next Generation Science Standards (NGSS), which includes engineering practices [12], there is still a great need for a research-based and standards-aligned STEM curriculum and assessment that enables early childhood teachers to engage their young learners in STEM experiences and evaluate the development of their problem-solving and analytical skills.
The wide range of abilities at the preschool age, especially with regard to language, makes it especially challenging to assess preschool children’s problem-solving skills in an authentic setting. Our review of the literature reveals several authentic assessments focusing on math and science learning and engineering “habits of mind” [13], but does not reveal any validated measures for evaluating preschool children’s problem-solving abilities, specifically the application of the steps of the engineering design process (EDP) when solving problems.
This paper reports on our team’s process of developing an observation instrument to measure preschool children’s learning and application of the EDP steps. The instrument, which we call the Engineering Preschool Children Observation Tool (EPCOT), was intended to evaluate the frequencies of problem-solving behaviors and use of EDP-related vocabulary by observing classrooms where a federally funded, full-year STEM curriculum was implemented as part of a 16-classroom pilot study [14]. Designed to evaluate problem-solving skills as identified by the NGSS [12] and the Commonwealth of Massachusetts [15], EPCOT has the potential to be used with other early childhood engineering/problem-solving curricula.
1.1. Problem Solving in Early Childhood
Developmental researchers have long believed that children are natural tinkerers [16] who use their conceptual knowledge and reasoning skills, as well as social information, to solve problems. To succeed in solving problems, children need to encode the problem accurately, which involves identifying important aspects of the problem and building a mental representation of the problem. This is often challenging for young children [17,18]. Indeed, early accounts on children’s cognitive development, most notably Piaget’s, indicated that young children cannot engage in problem-solving processes, such as scientific reasoning [19]. However, more contemporary research has shown that with the right support, such as when problems are simplified, children can succeed in solving problems. Even 3-year-olds can form complex mental models [16], indicating their capacity to mentally represent problems.
Differences in children’s problem-solving abilities can often be explained not by cognitive-processing abilities that emerge only as they get older, but by considering the particulars of the situation: children’s success in solving problems is greatly influenced by the different ways and contexts in which problems can appear [20]. For example, infants as young as 12 months can imitate an adult solving a modified balance-scale problem [21], and even 2-year-olds can solve the balance-scale problem when it is simplified [22]. Later research showed that when provided with opportunities to practice in a non-traditional way, older children are less likely to misconceive a problem involving a commonly misunderstood concept such as equivalence in math equations [23]. Children also innovate after both successes and failures—they can generate new strategies for a familiar problem that they have previously solved using an older strategy [24].
These findings illustrate a common theme that has emerged in the cognitive developmental literature: that children are flexible problem solvers. Instead of linearly going through strategies that increase in sophistication as they get older, children show cognitive flexibility by entertaining different ways of representing and solving a problem at a given time [25,26]. Children’s tendency to entertain multiple strategies and deploy them in different ways, depending on the context, suggests that children have the capacity to brainstorm solutions. These findings suggest that we can leverage children’s conceptual understanding and problem-solving potential to teach them a systematic approach to problem solving: the engineering design process (EDP).
The National Research Council (NRC) in the United States defines engineering as “engagement in a systematic practice of design to achieve solutions to particular human problems” [27] (p. 11). The Council’s Framework for K–12 Science Education states that children are natural engineers, who build castles, dollhouses, and hamster enclosures using a variety of tools and materials. This natural interest and ability can be enhanced by asking them to test and redesign their structures and by paying attention to challenges in their design and construction efforts. The NGSS [12], developed based on the NRC’s Framework, emphasizes engineering practices starting as early as kindergarten as part of the new set of science standards. According to the NGSS developers, engineering is a context-based subject with real-life applications, which makes it applicable to a diverse group of students and therefore serves as a promising opportunity for deepening scientific knowledge [12].
Since the development of the NGSS and its emphasis on science and engineering practices, there is a growing need to engage students in problem-solving activities. In recent years, several STEM and engineering curricula were developed specifically for preschool settings [13,28,29,30]. Raven et al. (2018) designed a series of science and engineering activities to introduce the EDP to preschool-age children. Within each activity, three main practices were emphasized: Asking Questions (for science)/Defining Problems (for engineering), Planning and Carrying Out Investigations, and Constructing Explanations (for science)/Designing Solutions (for engineering). The authors claimed that, even in preschool, children can ask questions, design solutions, and improve their designs like engineers do. Lippard et al. (2018) observed nine preschool classrooms and found that in all but one classroom, children exhibited engineering “habits of mind,” such as systems thinking, collaboration, communication, ethical consideration, and optimism [13]. In a study conducted by Lottero-Perdue et al. (2015), in which preschool and kindergarten children engaged in an engineering and design lesson, the teachers reported that students were deeply engaged, enthusiastic, and had a desire to problem-solve [31]. Other observed outcomes for engineering activities include critical thinking, problem solving, collaboration, persistence, and other adaptive domain-general learning skills [32]. The increase in early childhood engineering and problem-solving activities also requires the development of age-appropriate authentic measures in order to determine the impact of the curriculum on children’s learning outcomes and help improve instruction.
1.2. Measuring Early Childhood Problem-Solving Skills
Similar to effective instruction that follows evidence-based learning trajectories, an effective assessment should measure attainment of the learning goal (i.e., mastery of content or skill), the developmental progression toward that goal (i.e., levels of cognitive processing needed to master the content or skill), and performance on the instructional activities (i.e., tasks and other problem-solving experiences) designed to support the development of these cognitive skills [33]. The assessment should also address whether the curriculum has had positive, long-term outcomes, such as continued and accurate use of terms learned (sustainability), application of knowledge gained (persistence), and innovation that continues outside of the curriculum (diffusion) [33]. An authentic classroom assessment is one that engages the student’s intrinsic interests and cognitive capacities, and is intended to measure transferrable skills and abilities [34]. In the case of preschool children’s competencies, observing them in their natural playing and learning environment is crucial for authenticity [34,35,36]. Curriculum-embedded assessments can be administered in a variety of formats, such as via observations, direct testing, and interviews [36]. Hence, the measurement of young children’s knowledge and application of problem-solving vocabulary and skills should focus on authentic observations as children engage with meaningful problems in a variety of classroom tasks.
Methods to evaluate children’s problem-solving skills and knowledge tend to fall into several categories: (1) analysis of children’s discourse during free play (i.e., [37,38]); (2) observations of children at play [39]; curriculum-specific observation protocols for researchers and teachers (i.e., [40]); (3) evaluation of engineering habits of mind ([13]); and (4) assessment of children’s science and engineering knowledge through pictorial measures [41]. Of these categories, only the last one, which doesn’t measure problem-solving skills, has been validated.
Despite the development of standards-aligned engineering and problem-solving curricula and classroom experiences, there is a lack of a valid measure to be used by teachers and researchers [41,42]. Methods for assessing science and engineering knowledge and skills are critical for both researchers and teachers who are interested in children’s learning and ways to improve science and engineering teaching efficacy [33,42]. The lack of established measures has led researchers to develop ad hoc tools for their projects, making it difficult to build upon previous work and replicate studies [43]. Hence, there is a need for an observation protocol that is aligned with national standards and that could be used with multiple curricula to evaluate young children’s engineering/problem-solving skills.
1.3. The Current Project: Overview
Seeds of STEM was funded by the U.S. Department of Education [14] as a development project, with the goal of developing a new problem-solving curriculum for preschool classrooms serving 3- to 5-year-olds. In line with the grant structure, the developed curriculum was piloted in preschool classrooms to demonstrate feasibility and fidelity of implementation as well as potential for a larger study. The project was divided into two major parts: curriculum development and pilot study.
Curriculum Development. The development of the curriculum was conducted in partnership with Head Start, a federally funded early childhood education program developed by the United States Department of Health and Human Services, serving newborns to 5-year-old children from low-income families. Our partner Head Start program was from a large urban area serving close to 700 children in 35 classrooms. A team of six developer-teachers and twenty tester-teachers collaborated with the researchers to develop and test the multiple iterations of the curriculum’s eight units over the course of two years (see [44,45] for a detailed description of the participatory-design curriculum development process).
Pilot Study. The pilot study was designed as an underpowered randomized control trial (RCT) in 16 mixed-age classrooms serving children 3–5 years old. These classrooms were part of a different Head Start program, which did not take part in the curriculum development process, and included classrooms in urban and rural settings. Forty teachers took part in the pilot study (twenty-one teachers in eight intervention classrooms, and nineteen teachers in eight comparison classrooms). Thirty-eight teachers identified as females, and 20% of the teachers identify as a minority (non-white). The student population included 238 3- to 5-year-olds (68% identified by their parents as a minority/non-white), with 130 children in the intervention classrooms and 138 in the comparison classrooms. The pilot study lasted one school year, followed by 20 months of data coding and analysis. Classrooms were randomly assigned to intervention and comparison groups (eight classrooms in each condition), matched for teacher characteristics based on an opening survey. Twenty one intervention teachers received 10 h of training prior to and during the implementation of Units 1–7 of Seeds of STEM, as well as classroom visits by the researchers. Nineteen comparison group teachers were asked to teach their current science/STEM curriculum, and did not receive any training or support. All 40 teachers were provided with Unit 8 of Seeds of STEM (the topic was light and shadow), and were asked to follow the curriculum and teach Unit 8 over the course of two weeks. See Figure 1 for an illustration of the study design. Teachers were offered the option of videotaping their own lessons or having a research assistant help with videotaping the Unit 8 lessons. Only children whose parents signed a consent form were included in the videos. This paper describes the lessons learned from the research team’s development of an observation tool to evaluate children’s problem-solving behaviors and vocabulary. While the development of the observation tool was not among the original goals of the study, it is our hope that other researchers would benefit from the description of the development process, and would be able to include and further validate the tool in future studies.
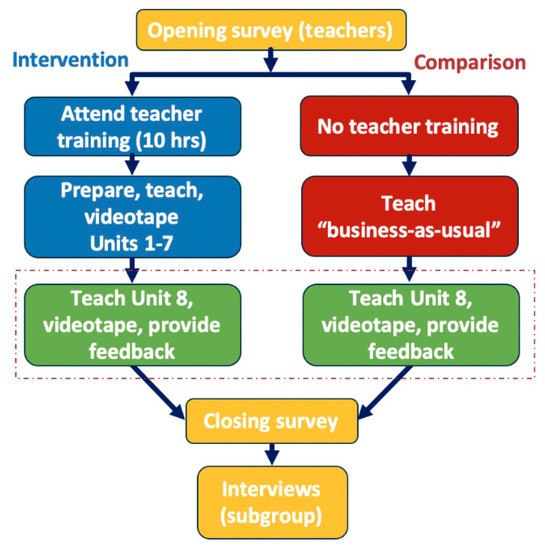
Figure 1.
Pilot study design.
1.4. The Development of the Engineering Preschool Children Observation Tool (EPCOT)
EPCOT was developed to measure preschool children’s problem-solving skills and vocabulary while engaged in Seeds of STEM activities in the classroom. The list of outcomes, for both the curriculum and observation measures, was created based on established standards and frameworks: the Engineering and Scientific Practices in the Massachusetts Science Technology/Engineering Framework for Pre-K (2014; 2019), the NRC Framework [27], and the Head Start Framework [46].
1.4.1. EPCOT Version 1
Based on the established standards and frameworks [27,46], the research team defined eight observable behaviors that are employed when solving a problem. For each one of the behaviors, the research team defined several levels based on increasing cognitive complexity (see Table 1). For example, for the first observable behavior of describing/recognizing information, the first, most basic component will be marked when a student repeats a statement about the scientific phenomenon, and the most sophisticated component will be marked when the student offers an example about the phenomenon from their own lives.

Table 1.
EPCOT (v.1) with 8 actions and 33 observable behaviors (Levels of cognitive complexity).
In addition to these dimensions of action, the EPCOT was also designed to capture indicators of problem-solving vocabulary acquisition, in terms of the frequency of children repeating the words (e.g., brainstorm, design, revise), saying them when prompted (cued vocabulary production), and spontaneously producing them appropriately (novel vocabulary production). A team of trained blind coders who were unfamiliar with the Seeds of STEM curriculum tested the first version of EPCOT by observing classroom videos and scoring the behaviors they observed. The team encountered significant challenges in defining non-verbal gestures, needing to clarify each behavior to reduce code-misinterpretation, and struggling to differentiate curricular and general classroom activities. As a result, coders were not able to reach consensus and thereby meet the expected reliability (70%) on this first version of the EPCOT.
1.4.2. EPCOT Version 2
To address the challenges in coding encountered when using version 1 of the tool, the research team engaged in a process of creating “master-coded” videos that reflected the research team’s goals for the observation tool (as recommended by the project’s expert psychometrician). During that process, the research team observed dozens of classroom videos, discussed each observed behavior, and revised the EPCOT wording to reflect the agreement among the team and reduce ambiguity. As a result of this elaborated process, EPCOT was revised and a second version was created (see Table 2). In addition, a detailed training guide was developed. The revised EPCOT includes only five main actions, but each one consists of multiple observable behaviors to capture variations and nuances of each action. Out of the five actions, three follow the steps of the EDP (Actions 2–4), one focuses on connections to the scientific phenomenon and to the desirable skills of asking questions (Action 1), while the last action (Action 5) focuses on behaviors that demonstrate recognition and understanding of the problem-solving process itself. During the video observations, the research team was challenged by cases in which the children referenced the scientific phenomenon as they were engaged in different steps of the problem-solving process. To distinguish these behaviors from the general Action 1, we added special codes to Actions 2–4, namely 2.1, 3.1, and 4.1.
Table 2.
EPCOT (v.2) with 5 actions and 33 observable behaviors.
2. Materials and Methods
The second version of EPCOT was used to assess the level of problem-solving behaviors and vocabulary as exhibited by children in 16 Head Start classrooms (8 intervention, 8 comparison). These classrooms did not take part in the curriculum development process, and the teachers were not familiar with the curriculum. Teachers in the intervention group taught all 8 units of the curriculum and received professional development training. Teachers in the comparison group followed a “business-as-usual” protocol regarding the teaching of science. Both groups taught the last unit of the curriculum (Unit 8, Light and Shadow) as an assessment, and were asked to videotape all their classroom activities associated with the curriculum (conducted over 2 weeks in whole-class and small-group settings). The first week introduced the scientific concepts of light and shadow through stories, exploration, and experimentation. The second week focused on solving a problem related to the scientific concepts. Specifically, Problem Panda (the curriculum’s main character) wants to play outside, but it is too hot and bright. The children were asked to create a solution to Panda’s problem, based on concepts related to light and shadow. Only videos from the second (engineering) week were used for the analysis. Table 3, below, illustrates the different activities during the Unit 8 engineering week.
Table 3.
Summary of Seeds of STEM weekly activities during “engineering week”.
2.1. Video Sampling
An algorithm was developed for randomly selecting videos from every classroom. The goal was to select a total of 6 classroom videos (3 videos of small group activities, 3 videos of whole class activities) out of 10 videos per class, in a way that all curriculum activities (from 6.1 to 10.2) are represented. In addition, the algorithm selected videos so that the total observable time was similar across all classrooms. The observable time of ~67 min was selected, based on the classroom with the least video recording time. This process was done to ensure equal observation time for all classrooms (In addition to standardizing videos prior to coding, we conducted robustness analyses in our main findings using linear regression to observe the association between behaviors and groups, controlling for time. These findings produced similar results to our main analyses and are available upon request). Prior to the selection, videos were trimmed for non-curricular activities, so the observation was mostly on the activities. Videos shorter than 3 min were excluded from coding.
2.2. Coder Training
Blind coders were trained using the master-coded videos. A detailed scoring guide was shared with the coders, and the document was updated during the training sessions. Coder questions about specific situations were answered by the research team after reviewing the video and agreeing on the next steps. The goal was to establish a reliability of 70% with the master codes and among coders. Two coders met the requirement and classroom videos were divided among them with a 25% overlap. Coder disagreements were reviewed and discussed by the coders and the research team.
2.3. Coding Software
The coding of problem-solving behaviors and vocabulary was done with Behavioral Observation Research Interactive Software (BORIS), a free and open-source video-coding software. BORIS’s main features include adaptability to code entry, a timestamp for each code, an easy export function, user-friendliness, and privacy of video subjects. The use of the software allowed for numbering and coding individual students—a valuable tool when coding groups of participants—enabling the coder to track the total number of participating students out of the entire class.
2.4. Coding for Behaviors and Vocabulary
As coders watched the videos, they coded for a specific behavior and marked the child(ren) who exhibited that behavior (see Table 2 for behaviors and categories). This allowed for a summary of the percentage participation of each classroom. In addition, the coders coded for expressive language of one of the designated problem-solving vocabulary words: engineering design process/engineering wheel, problem, solve/solving, solution, engineer, brainstorm/think, idea, choose, plan, design, create/build, revise, improve/make better, and share. On the coding software, the coders noted whether the vocabulary words were produced spontaneously by the children or repeated after the teacher or another child mentioned the word.
3. Results
3.1. Students’ Problem-Solving Skills and Vocabulary
Trained and reliable blind coders scored six randomly selected videos for each classroom (three small-group activities, three whole-class activities). Coding output (through BORIS) included frequency of problem-solving behaviors, frequency of expressed vocabulary words, and proportion of students exhibiting the behaviors (out of total students in the video). In total, the findings are based on 90 coded video clips across all 16 classrooms (out of the expected 96; the loss was due to technical issues with the videos or missing coded files). Among these videos, there was a representation of all 10 curricular activities that were implemented during the engineering/problem-solving week (as depicted in Table 3).
Overall, 1696 behaviors were coded, of which 19% were coded under category 1 (unpacking the scientific phenomenon or process), 11% under category 2 (identifying and researching the problem), 26% under category 3 (brainstorming-planning-choosing solutions), 34% under category 4 (creating-testing-revising solutions), and 9% under category 5 (the problem-solving process), as depicted in Figure 2.
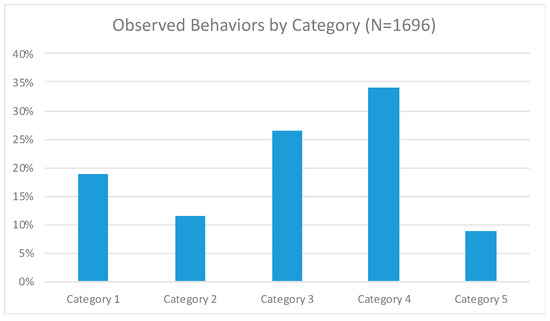
Figure 2.
Observed behaviors by coding category.
The six most frequently observed behaviors account for 53% of all observed behaviors. These behaviors include 1b (Describe/reference/acknowledge materials/activities shared by the teacher related to a scientific phenomenon), for example, when a child points out a shadow in the picture made by the sun and the trees; 3b (Propose/state a solution to a problem). For example, one of the children proposed to make a “house out of leaves so he can’t burn”; 3c (Draw/explain/share a solution plan/idea), where a child was observed explaining how an umbrella works during the planning process; 4a (Discuss/explore/state what materials are needed/available while building or testing), for example, when a child explained “you would need glue to stick the cups together”; 4g (Revise/propose revisions (to) the solution/model), for example, when a child holds up a piece of cardboard and says “this can be the roof”; and 5c (State past or future activities/steps in the engineering design process (regardless of accuracy) or name/recognize the process itself without describing the steps), for example, saying that, at the beginning, we need to find out “what the problem is.”
Interestingly, three behaviors were not observed at all in all 90 videos: category 3e (Classify solutions as testable versus non-testable), 5e (Describe the entire process, including all the steps from problem to solution), and 5f (Spontaneously explore/reference the EDP poster to guide problem solving). Figure 3, below, shows the distribution of observed behaviors.
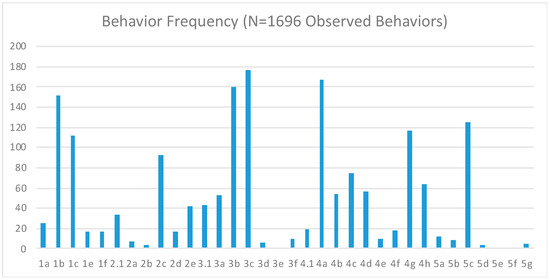
Figure 3.
Behavior frequency.
We analyzed differences in observed child behaviors across specific areas of the EPCOT, small- and whole-class settings, and intervention and comparison groups. We hypothesized that some behaviors would be more likely to occur than others, for example, that students repeat vocabulary words rather than propose a solution or revise initial plans. Further, some behaviors would be easier for students in small groups versus a whole class, for example, having more opportunities to engage in testing solutions (category 4). Additionally, we expected to see more higher-level behaviors (category 5) in the intervention group than in the comparison group, since teachers and students had more practice and engagement in the intervention group and it would be easier to demonstrate higher-order processing. We present the results of our hypotheses testing here, acknowledging, however, that this is an exploratory study focused on the development of EPCOT as a rubric. The study was therefore conducted in a smaller number of classrooms, focusing resources on the use of curriculum and the EPCOT rubric in each classroom. We do not necessarily have the power required to detect statistically significant differences across groups. Still, the observation of trends is important and can set a baseline for expected results in larger settings.
We found that behaviors were evenly divided between small-group and whole-class activities (see Figure 4) in category 2 (6% and 6%), category 3 (14% and 13%), and category 5 (4% and 5%). However, more category 1 behaviors occurred during whole-class activities (12% vs. 7%), and significantly more category 4 behaviors occurred during small-group activities (31% vs. 3%). These findings were expected, as the children were revisiting science concepts discussed in the previous week during the first whole-class circle of the week, and engaged in creating their solutions in small groups. Behaviors of categories 2, 3, and 5 were discussed throughout the week in both small-group and whole-class settings.
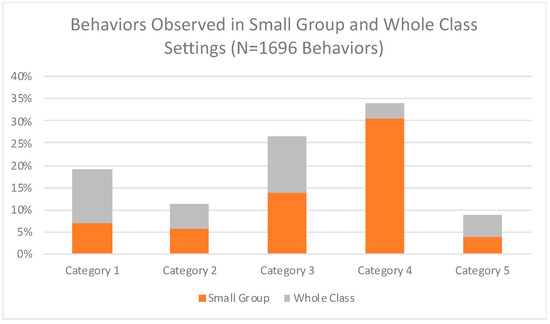
Figure 4.
Behaviors observed in small-group and whole-class settings.
An analysis of children’s vocabulary captured a total of 436 vocabulary words related to problem solving, of which 312 words were produced spontaneously by the children, and 124 words were repeated after they were first mentioned by the teacher or by another child. The majority of the captured vocabulary words (73%) fell into five categories: brainstorm/think (22%), problem (15%), idea (14%), plan (12%), and create (10%). The rest of captured vocabulary words (27%) included the words: solution, share, solve, design, engineer, build, test/testing, improve/improving, creation, and choose. Figure 5 shows the distribution of vocabulary frequencies.
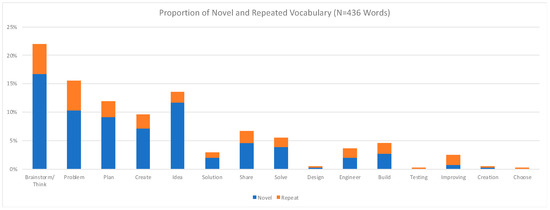
Figure 5.
Proportion of novel and repeated vocabulary words.
3.2. Differences across Groups
No significant difference was detected between the intervention and comparison groups in terms of frequency of behaviors (Figure 6) and problem-solving vocabulary (such as problem, solution, brainstorming, and planning): 53% of behaviors were observed in intervention classrooms, and 47% of behaviors were observed in comparison classrooms. Although we expected to see differences in student behavior in the intervention and comparison groups, these differences were not statistically significant. This may be due to the lack of statistical power (sample size) to detect effects. Another unexpected finding was related to category 5 behaviors that address the problem-solving process and its steps, where observed behaviors were evenly divided between the groups.
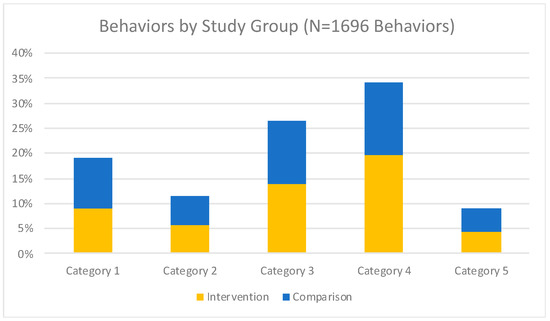
Figure 6.
Behaviors by study group.
In order to analyze differences between groups, we tested (using a one-tailed, two-sample t-test) the difference in small-group and whole-class activities, and intervention and comparison group activities, across the five coding categories. As shown in Table 4, there were statistically significant differences between small-group and whole-class activities in category 4. As expected, creating-testing-revising solutions (category 4) occurred more often in small groups. The differences in findings across the whole-class and small-group settings may suggest that some activities are better geared toward particular classroom arrangements.
Table 4.
Behavior and vocabulary frequencies by coding category.
Similarly, a vocabulary group analysis did not reveal significant differences between the intervention and comparison groups in terms of overall frequencies. A total of 215 words were captured in videos from intervention classrooms, and 221 words were captured in videos from comparison classrooms (see Figure 7).
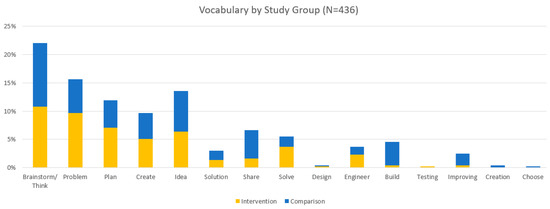
Figure 7.
Proportion of vocabulary words by study group.
An additional analysis revealed an interesting trend such that children in the intervention group produced a slightly larger percentage of novel than repeated words (75% novel vs. 25% repeated) compared to those in the comparison group (68% novel vs. 32% repeated; see Figure 8 and Figure 9).
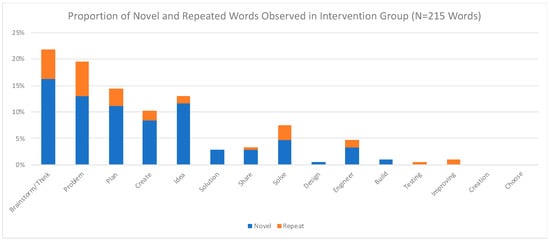
Figure 8.
Proportion of novel and repeated words in the intervention group.
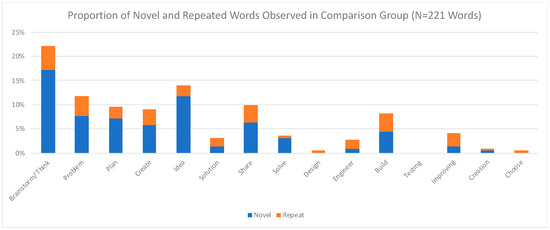
Figure 9.
Proportion of novel and repeated words in the comparison group.
To further analyze the vocabulary data, we defined a threshold of at least 50% more vocabulary words than the other group for any difference to be meaningful. Based on this criterion, the intervention group had substantially more novel vocabulary words under the categories problem, plan, solution, design, and engineer, and more repeated vocabulary words under the categories think, problem, solve, and testing, compared to the comparison group (see Table 5). This pattern may suggest that children who were exposed to more of the curriculum (the intervention group) produced more novel vocabulary words than the comparison group, who were exposed to just one unit of the curriculum. The children in the comparison group seemed to be more engaged in repeating vocabulary than the intervention group. There were also categories where the two groups were comparable: brainstorm, think (novel), plan (repeat), create (novel), idea (novel), solve (novel), engineer (repeat), testing (novel), and choose (novel). There were no vocabulary words in either group for testing or choose.
Table 5.
Differences in vocabulary use across groups.
Thus far, our findings suggest that the Seeds of STEM curriculum engaged children in all steps of the EDP, and elicited vocabularies and behaviors associated with the process. Although we expected to see differences in student behavior in the intervention and comparison groups, these differences were not statistically significant, which may be due to the lack of statistical power (sample size) to detect effects. However, the intervention group showed, on average, 24.1 behaviors in category 4, compared to 15.8 behaviors in the comparison group (see Table 5). These differences are substantively meaningful and are trending in the expected direction; however, a lack of precision due to the small sample size obscures our ability to detect statistical differences (In addition to using a t-test to assess differences between groups, we also used hierarchical linear modeling to test differences across groups while accounting for clustering of teachers and students in classrooms. Similar to the findings we present here, we found some trends, but nothing statistically significant).
4. Discussion
EPCOT was developed to observe preschool children’s problem-solving behaviors and vocabularies in classrooms that tested the Seeds of STEM curriculum. A total of 1696 behaviors were observed in videos taken from 16 preschool classrooms. Out of 34 possible behaviors across the problem-solving process, the children in these classrooms engaged in 31 unique problem-solving behaviors, implying that preschool children are, indeed, capable of meaningfully engaging in solving problems.
The process of establishing EPCOT was long and required dozens of hours of video observations, discussions of ambiguous situations, and resolving disagreements between coders and the research team. However, the process resulted in a detailed training guide that enabled the training of reliable coders.
The high correlations between behavior category and curricular activities were expected, as both EPCOT and the Seeds of STEM activities followed the problem-solving process from identifying problems to sharing the revised solutions. However, we have observed behaviors from all categories in the different steps. For example, during a video clip of children planning the solution to Panda’s problem, the children were observed talking about the problem (e.g., “it’s getting too hot and Panda needs some shade”—category 2), discussing criteria and constraints (e.g., “solution needs to be able to make Panda cool” and “solution needs to be kind of large for Panda”—category 2), planning the solution and connecting the solution to a scientific phenomenon (e.g., “he planned a large tower, and it will block the sun”—category 3), stating the next step in the problem-solving process (e.g., “we need to create the solution”—category 5), engaging in building their solution (category 4), and explaining their solution (e.g., “I will make a tunnel for Problem Panda”—category 4). Other observations include children discussing the problem, sharing and testing their solutions, and accepting suggestions from other children about improving their solutions. In other words, the children demonstrated that the process of solving problems is not linear, but requires repetitions and connections to the different steps throughout the process [25,26].
To our surprise, no significant differences were detected between the intervention and comparison groups in the frequencies of observed behavior. It is possible that our sample was simply too small to detect a difference between the groups. Further, we should note that the assessment unit was the eighth Seeds of STEM unit that the intervention classrooms experienced, while for the comparison classrooms it was the first one. One explanation could be that even one unit was enough to generate observable behaviors and vocabulary among the children, which speaks to the potential strength of the curriculum. Finally, a third possible explanation came from observing the teachers. The comparison teachers, being recorded for the first time and teaching a new unit without training, relied more closely on the curriculum and followed the instructions and activities provided in the unit plan as written. The intervention teachers, on the other hand, were less reliant on the written instructions and improvised some changes to the unit. They might have been more comfortable and confident in their teaching, having taught seven previous units. While we did find more problem-solving behaviors and vocabulary in the intervention group, we also found evidence for problem-solving behaviors and vocabulary in the comparison group. This is, of course, good news from the curriculum development perspective; however, it reduces the possibility of detecting a difference between the groups.
In addition to these limitations, it is important to note that the EPCOT was not yet validated against other preschool learning measures. The research team is planning to validate the observation tool against other video observation instruments as well as the average of classroom assessment scores. In addition, the findings were only based on post-curriculum data. Future studies comparing intervention classrooms with “business-as-usual” (i.e., true control) classrooms without any overlap in unit coverage, and using pre- and post-test measures, would help shine light on the effectiveness of the tool in detecting the impact of the curriculum. The research team is also interested in exploring the teachers and classrooms that elicited the most behaviors to learn more about characteristics that contribute to successful problem-solving in early childhood.
Author Contributions
Conceptualization, M.D. and F.K.A.; methodology, M.D. and F.K.A.; data analysis, M.D. and S.K.; writing—original draft preparation, F.K.A.; writing—review and editing, M.D., S.K., and F.K.A.; project administration, M.D.; funding acquisition, M.D. and F.K.A. All authors have read and agreed to the published version of the manuscript.
Funding
This research was funded by the Institute of Education Sciences, grant number R305A150571.
Institutional Review Board Statement
This research was approved by the Institutional Review Board at Worcester Polytechnic Institute (protocol number IRB-15-204).
Informed Consent Statement
Informed consent was obtained from participating classroom teachers, as well as from the parents or legal guardians of all children involved in the study.
Data Availability Statement
Data are available upon request.
Acknowledgments
The authors would like to thank the following individuals for their assistance in data preparation and analysis, as well as for their overall contribution to the project: Sarah Burns, Natalie Evans, Melissa Sue John, Laura O’Dwyer, Bernadette Sibuma, Fay Whittall, and Susmitha Wunnava.
Conflicts of Interest
The authors declare no conflict of interest.
References
- Gonzalez, H.B.; Kuenzi, J.J. Science, Technology, Engineering, and Mathematics (STEM) Education: A Primer; Congressional Research Service, Library of Congress: Washington, DC, USA, 2012. [Google Scholar]
- Morgan, P.L.; Farkas, G.; Hillemeier, M.M.; Maczuga, S. Science achievement gaps begin very early, persist, and are largely explained by modifiable factors. Educ. Res. 2016, 45, 18–35. [Google Scholar] [CrossRef] [Green Version]
- Tanenbaum, C. STEM 2026: A Vision for Innovation In STEM Education; US Department of Education: Washington, DC, USA, 2016.
- Eshach, H. Science Literacy in Primary Schools and Pre-Schools; Springer Science & Business Media: Berlin/Heidelberg, Germany, 2006; Volume 1. [Google Scholar]
- Evangelou, D. Child development perspective in engineering education: Why STEM now. Early Child. Res. Pract. 2010, 12, n2. [Google Scholar]
- Katz, L.G. STEM in the early years. Early Child. Res. Pract. 2010, 12, 11–19. [Google Scholar]
- Van Meeteren, B.; Zan, B. Revealing the work of young engineers in early childhood education. Early Child. Res. Pract. 2010, 17, 1–19. [Google Scholar]
- Diamond, K.E.; Justice, L.M.; Siegler, R.S.; Snyder, P.A. Synthesis of IES Research on Early Intervention and Early Childhood Education (NCSER 2013-3001); National Center for Special Education Research, Institute of Education Sciences, U.S. Department of Education: Washington, DC, USA, 2013.
- Ginsburg, H.P.; Lee, J.S.; Boyd, J.S. Mathematics education for young children: What it is and how to promote it. Soc. Pol. Rep. 2008, 22, 1. [Google Scholar] [CrossRef]
- McClure, E.R.; Guernsey, L.; Clements, D.H.; Bales, S.N.; Nichols, J.; Kendall-Taylor, N.; .Levine, M.H. STEM Starts Early: Grounding Science, Technology, Engineering, and Math Education in Early Childhood; The Joan Ganz Cooney Center at Sesame Workshop: New York, NY, USA, 2017. [Google Scholar]
- Sarama, J.; Clements, D.; Nielsen, N.; Blanton, M.; Romance, N.; Hoover, M.; Staudt, C.; Baroody, A.; McWayne, C.; and McCulloch, C. Considerations for STEM Education from PreK through Grade 3; Education Development Center, Inc.: Waltham, MA, USA, 2018. [Google Scholar]
- NGSS Lead States. Next Generation Science Standards: For States, By States; The National Academies Press: Washington, DC, USA, 2013. [Google Scholar]
- Lippard, C.N.; Lamm, M.H.; Tank, K.M.; Choi, J.Y. Pre-engineering Thinking and the Engineering Habits of Mind in Preschool Classroom. Early Child. Educ. J. 2018, 47, 187–198. [Google Scholar] [CrossRef]
- Dubosarsky, M.; John, M.; Anggoro, F. Seeds of STEM: The Development of An Innovative Early Childhood STEM Curriculum; Institute of Education Sciences, U.S. Department of Education: Washington, DC, USA, 2015; R305A150571.
- Massachusetts Department of Elementary and Secondary Education. Science and Technology/Engineering Curriculum Framework for Grades PK-12. 2019. Available online: https://www.doe.mass.edu/frameworks/scitech/2016-04.pdf (accessed on 18 April 2021).
- DeLoache, J.S.; Miller, K.F.; Pierroutsakos, S.L. Reasoning and problem solving. In Handbook of child psychology: Cognition, Perception, Language, 5th ed.; Kuhn, D., Siegler, R.S., Eds.; Wiley: New York, NY, USA, 1998; Volume 2. [Google Scholar]
- Alibali, M.W.; Crooks, N.M.; McNeil, N.M. Perceptual support promotes strategy generation: Evidence from equation solving. Brit. J. Dev. Psych. 2017, 36, 153–168. [Google Scholar] [CrossRef]
- Siegler, R.S.; Chen, Z. Differentiation and integration: Guiding principles for analyzing cognitive change. Dev. Sci. 2008, 11, 433–448. [Google Scholar] [CrossRef] [PubMed]
- Piaget, J. Science of Education and the Psychology of the Child; Coltman, D., Ed.; Orion Press: New York, NY, USA, 1970. [Google Scholar]
- Siegler, R.; Alibali, M. Children’s Thinking, 5th ed.; Pearson: London, UK, 2020. [Google Scholar]
- Case, R. Intellectual Development: Birth to Adulthood; Academic Press: Orlando, TO, USA, 1985. [Google Scholar]
- Halford, G.S.; Andrews, G.; Dalton, C.; Boag, C.; Zielinski, T. Young children’s performance on the balance scale: The influence of relational complexity. J. Exp. Child Psych. 2002, 81, 417–445. [Google Scholar] [CrossRef] [PubMed]
- McNeil, N.M.; Fyfe, E.R.; Petersen, L.A.; Dunwiddie, A.E.; Brletic-Shipley, H. Benefits of practicing 4 = 2 + 2: Nontraditional problem formats facilitate children’s understanding of mathematical equivalence. Child Dev. 2011, 82, 1620–1633. [Google Scholar] [CrossRef]
- Siegler, R.S.; Jenkins, E.A. How Children Discover New Strategies; Lawrence Erlbaum Associates. Inc.: Hillsdale, NJ, USA, 1989. [Google Scholar]
- Alibali, M.W.; Goldin-Meadow, S. Modeling learning using evidence from speech and gesture. In Proceedings of the Seventeenth Annual Conference of the Cognitive Science Society; Erlbaum: Hillsdale, NJ, USA, 1993; pp. 203–208. [Google Scholar]
- Alibali, M.W.; Sidney, P.G. The role of intraindividual variability in learning and cognitive development. In Handbook of Intraindividual Variability across the Life Span; Diehl, M., Hooker, K., Sliwinski, M.J., Eds.; Routledge/Taylor Francis Group: Abingdon, UK, 2015; pp. 84–102. [Google Scholar]
- National Research Council. A Framework For K-12 Science Education: Practices, Crosscutting Concepts, and Core Ideas; National Academies Press: Washington, DC, USA, 2012. [Google Scholar]
- Bagiati, A.; Evangelou, D. Engineering curriculum in the preschool classroom: The teacher’s experience. Eur. Early Child Educ. Res. J. 2015, 23, 112–128. [Google Scholar] [CrossRef]
- Davis, M.E.; Cunningham, C.M.; Lachapelle, C.P. They Can’t Spell “Engineering” but They Can Do It: Designing an Engineering Curriculum for the Preschool Classroom. Zero Three 2017, 37, 4–11. [Google Scholar]
- Raven, S.; Al Husseini, D.; Cevik, E. We Are Engineers! Engineering Design Activities for Preschoolers Introduce Practices and Encourage Scientific Habits of Mind. Sci. Child. 2018, 56, 55–61. [Google Scholar]
- Lottero-Perdue, P.; Bolotin, S.; Benyameen, R.; Brock, E.; Metzger, E. THE EDP-5E. Sci. Child. 2015, 53, 60–66. [Google Scholar] [CrossRef]
- Bustamante, A.; Greenfield, D.; Nayfeld, I. Early childhood science and engineering: Engaging platforms for fostering domain-general learning skills. Educ. Sci. 2018, 8, 144. [Google Scholar] [CrossRef] [Green Version]
- Clements, D.H.; Sarama, J. Math, science, and technology in the early grades. Fut. Child 2016, 26, 75–94. [Google Scholar] [CrossRef]
- Frey, B.B.; Schmitt, V.L.; Allen, J.P. Defining authentic classroom assessment. Pract. Assess. Res. Eval. 2012, 17, 2. [Google Scholar]
- Bagnato, S.J. The authentic alternative for assessment in early intervention: An emerging evidence-based practice. J. Early Interv. 2005, 28, 17–22. [Google Scholar] [CrossRef]
- Grisham-Brown, J.; Hallam, R.; Brookshire, R. Using authentic assessment to evidence children’s progress toward early learning standards. Early Child. Educ. J. 2006, 34, 45–51. [Google Scholar] [CrossRef]
- Convertini, J. What is the task about? Exploring the issues discussed by preschool children in engineering activities at kindergarten. Rev. Sci. Math. ICT Educ. 2020, 14, 85–104. [Google Scholar]
- Gold, Z.S.; Elicker, J.; Beaulieu, B.A. Learning engineering through block play. Young Child. 2020, 75, 24–29. [Google Scholar]
- Bagiati, A.; Evangelou, D. Practicing engineering while building with blocks: Identifying engineering thinking. Euro. Early Child. Educ. Res. J. 2016, 24, 67–85. [Google Scholar] [CrossRef]
- Lottero-Perdue, P.; Bowditch, M.; Kagan, M.; Robinson-Cheek, L.; Webb, T.; Meller, M.; Nosek, T. An engineering design process for early childhood: Trying (again) to engineer an egg package. Sci. Child. 2016, 54, 70–77. [Google Scholar] [CrossRef]
- Zucker, T.A.; Williams, J.M.; Bell, E.R.; Assel, M.A.; Landry, S.H.; Monsegue-Bailey, P.; Crawford, A.; Bhavsar, V. Validation of a brief, screening measure of low-income pre-kindergarteners’ science and engineering knowledge. Early Child. Res. Q 2016, 36, 345–357. [Google Scholar] [CrossRef]
- Brenneman, K. Assessment for Preschool Science Learning and Learning Environments. Early Child. Res. Pract. 2011, 13, n1. [Google Scholar]
- Lippard, C.N.; Lamm, M.H.; Riley, K.L. Engineering thinking in prekindergarten children: A systematic literature review. J. Eng. Educ. 2017, 106, 454–474. [Google Scholar] [CrossRef]
- Dubosarsky, M.; John, M.S.; Anggoro, F.; Wunnava, S.; Celik, U. Seeds of STEM: The Development of a Problem-Based STEM Curriculum for Early Childhood Classrooms. In Early Eng Learn; Springer: Singapore, 2018; pp. 249–269. [Google Scholar]
- John, M.; Sibuma, B.; Wunnava, S.; Anggoro, F.; Dubosarsky, M. An iterative participatory approach to developing an early childhood problem-based STEM curriculum. Euro. J. STEM Ed. 2018, 3, 7. [Google Scholar] [CrossRef]
- Office of Head Start. Head Start Early Learning Outcomes Framework: Ages Birth to Five; Administration for Children and Families, Office of Head Star: Washington, DC, USA, 2015.
Publisher’s Note: MDPI stays neutral with regard to jurisdictional claims in published maps and institutional affiliations. |
© 2021 by the authors. Licensee MDPI, Basel, Switzerland. This article is an open access article distributed under the terms and conditions of the Creative Commons Attribution (CC BY) license (https://creativecommons.org/licenses/by/4.0/).