Article

A Self-Adaptive Centrality Measure for Asset Correlation Networks

by
Paolo Bartesaghi
1,
Gian Paolo Clemente
2 and
Rosanna Grassi
1,*
1
Department of Statistics and Quantitative Methods, University of Milano-Bicocca, Via Bicocca degli Arcimboldi 8, 20126 Milan, Italy
2
Department of Mathematics for Economic, Financial and Actuarial Sciences, Università Cattolica del Sacro Cuore, Largo Gemelli 1, 20123 Milan, Italy
*
Author to whom correspondence should be addressed.
Economies 2024, 12(7), 164; https://doi.org/10.3390/economies12070164
Submission received: 30 April 2024 / Revised: 18 June 2024 / Accepted: 24 June 2024 / Published: 27 June 2024

Abstract

:
We propose a new centrality measure based on a self-adaptive epidemic model characterized by an endogenous reinforcement mechanism in the transmission of information between nodes. We provide a strategy to assign to nodes a centrality score that depends, in an eigenvector centrality scheme, on that of all the elements of the network, nodes and edges, connected to it. We parameterize this score as a function of a reinforcement factor, which for the first time implements the intensity of the interaction between the network of nodes and that of the edges. In this proposal, a local centrality measure representing the steady state of a diffusion process incorporates the global information encoded in the whole network. This measure proves effective in identifying the most influential nodes in the propagation of rumors/shocks/behaviors in a social network. In the context of financial networks, it allows us to highlight strategic assets on correlation networks. The dependence on a coupling factor between graph and line graph also enables the different asset responses in terms of ranking, especially on scale-free networks obtained as minimum spanning trees from correlation networks.

1. Introduction

Firms, companies, and economic institutions are nowadays highly interconnected in networks of different kinds. The role or the ranking of a firm within such networks can be evaluated in several ways.
There is a variety of indicators that allow us to assess the ranking, exposure and reliability of a company in the national and international context (see, e.g., Tosyali et al. 2021). Among them, centrality measures have assumed a prominent role in the analysis of local properties of a network (see, e.g., the following most up-to-date papers Bloch et al. 2023; Bowater and Stefanakis 2023; Cao et al. 2024; Chebotarev 2023; Raj and Bhattacharya 2023). The importance of these measures in the economic and financial network analysis is also widely supported by the most recent literature. For example, Alkan et al. (2023) compare different centrality scores for the economic policy uncertainty indices of 21 countries and Strielkowski et al. (2023) studied the role of regional innovation systems (RISs) in shaping up the national innovation systems (NISs), uncovering emerging trends, most influential agents, and domains of intensive research activity. A local perspective in financial network analysis is also adopted by Alamsyah et al. (2022), who studied the effect of shifts in the network triadic motifs on the propagation of shocks in a transaction network. Our paper fits into this research framework.
In network theory, many classical centrality measures have been introduced and used to rank institutions (see, e.g., Belik 2022; Borgatti 2005; Freeman 1978; Rajeh et al. 2021; Scott 1991; Wasserman and Faust 1994). Regardless of the nature of the ties and links that characterize the network, among the most used we mention the degree centrality, which quantifies the number or weight of these ties, the betweenness, which evaluates the key role of a company as a bridge between two or more groups of companies, the closeness (see, e.g., Bavelas 1950; Sabidussi 1966), which quantifies the proximity to other institutions and the promptness with which it is possible to reach them from the node under examination. A remarkable role is played by the well-known eigenvector centrality (Bonacich 1972), particularly in contexts where the authority of an institution or its governing bodies is to be determined. In this case, in fact, the score assigned to an institution is not defined by the internal parameters of the institution itself; rather, it is inherited from the scores of its immediate neighbors. In a sense, we can say that its reliability is established on the basis of the level of reliability of the institutions with which it cooperates. It is clear that this centrality measure, more than others, strongly weights the overall contribution of the network in which the institution is nested and from which it cannot be considered separate. Lastly, there is a broad class of centrality measures that emerge as the asymptotic result of diffusive processes internal to the network. These measures assign rankings to nodes that are updated at each step of an iterative process until it converges, under appropriate conditions, to stable final values. This is the case of PageRank (see, e.g., Brin and Page 1998; Page et al. 1999), used to define the ranking of web pages in Google, which can be considered as the stationary state of a linear conservative diffusion process. Another case is DebtRank (Battiston et al. 2012), which assesses the additional stress that each institution’s default can generate in a linear shock propagation framework, on directed networks of financial interdependence through interbank lending.
The centrality measure proposed in this paper combines two of the aspects described above. It quantifies the importance of an institution by assigning it a score resulting from nonlinear feedback between its own score and that of all the elements immediately connected to it, nodes and links. Furthermore, it emerges as the asymptotic non null steady state of an iterative process that involves two suitably coupled contagion mechanisms. In this way, we fill a gap in the literature on centrality measures, since the scheme behind the definition of eigenvector centrality has never been extended to all elements connected to a node and has never been interpreted as the steady state of an appropriate diffusive process involving both nodes and links.
To illustrate the main idea behind our proposal, consider the following example. Suppose we have a network of firms in which the ties are due to having a common director on the respective boards (see, e.g., Giglio and Lux 2021; Takes and Heemskerk 2016). This is a typical framework for analyzing corporate networks as projections of the bipartite network of companies and directors. Suppose that such a network during a period of market turbulence is the site of dissemination of important business information that may lead directors to make appropriate choices or not. Of course, we may consider two different propagation processes on the network of corporate boards (nodes) and on the network of directors (edges) and the reciprocal effect each process in one network has on the other. The processes are coupled and mutually reinforcing. The higher the likelihood that directors in common between two companies have at their disposal a given piece of information, the greater the likelihood that it will affect business choices and may determine the behavior of other companies in the network. We design a unified dynamic process that converges, under appropriate conditions, to asymptotic steady states of both firms and directors. These states are then interpreted as their centrality scores and are the result of a complex reciprocal action between nodes and edges. In this way, we can view the ranking of a node not as the consequence of mere and static local properties, but of its complex interactions arising from its deep embedding in the network.
Another example can be provided referring to a correlation network (see, e.g., Kukreti et al. 2020; Onnela et al. 2003; Mantegna 1999; Masuda et al. 2023; Gkatzoglou et al. 2024) obtained from the returns of a basket of securities in a given portfolio. Linear correlation coefficients can be interpreted as the result of a series of complex interactions and exchanges of information that have occurred in the past between these securities and that have led to their behavior being more or less correlated. As such, they can change over time and be subject to a shock that propagates from other correlations perturbations, i.e., from other neighboring links, which in turn will influence the future behavior of stock returns.
The previous examples suggest not separating the propagation of a shock on the network of actual nodes from that on the network of their edges. The idea of a reciprocal action in which node and edge attributes are mutually dependent has recently been used to propose a static nonlinear eigenvector centrality for nodes and edges in Tudisco and Higham (2021) in the wider context of hypergraphs.
The novelty of our approach is that we implement a similar idea through a specific non-conservative diffusion model on both the networks of nodes and edges and let them interact by means of a coupling coefficient, which we call the reinforcement factor. The actual dynamical system will be described by an SIS-like epidemiological model. In particular, to obtain the new centrality measure we adopt the self-adaptive model introduced in Bartesaghi et al. (2024). The node incidence, which is the instantaneous increase or decrease of the individual score, is determined by that associated with all its neighboring elements (connected edges and neighbor nodes); similarly, the edge incidence is determined by that of all its neighboring elements (adjacency edges and end nodes).
Since the edge weight generally conveys how effective that edge is in transmitting information, we are assuming that this weight is not independent of the information content of its end nodes. In other words, we assume that these weights can be updated to account for the changing information content of the nodes, just as this content depends on the edge weights themselves in any diffusion process on networks. Therefore we consider a secondary, or dual process, in which the shock propagates among edges through the nodes, that is, a process that occurs in the so-called line graph Gross et al. (2013) in which the role of nodes and edges are reversed. The two processes evolve simultaneously over time using one of the scores yielded by the other. The asymptotic non null steady state of the two coupled processes is interpreted as the new self-adaptive eigenvector centrality.
Numerical analyses have been developed to test the proposed approach on the networks built using the returns constituent of the SP100 index at the end of 2003. Specifically, we analyzed returns’ correlation spanning from the inception of 2000 to the end of 2023 and we divided the whole period in different windows. In each interval, we have compared nodes’ rankings based on traditional unweighted and weighted centrality measures with the ones obtained by the proposed approach. We noticed that the performance of non-linear centralities remains robust in identifying highly correlated assets within networks, even in periods of heightened volatility and turbulence. Consequently, these measures present themselves as promising alternatives for identifying central or diversifiable assets in optimal portfolio allocation strategies (see, e.g., Clemente et al. 2021; Olmo 2021; and Peralta and Zareei 2016). The financial and economic implications of this proposal are significant. By identifying and quantifying central nodes within financial networks, stakeholders can better understand the propagation of defaults, thereby enhancing risk management strategies. This approach provides a more nuanced view of asset interdependencies, leading to more informed investment decisions and regulatory measures. Additionally, the ability to assess the interaction intensity between nodes and edges offers insights into the systemic risk posed by highly interconnected assets, facilitating more robust financial stability assessments. Ultimately, this method can contribute to more resilient financial systems by enabling the early detection of potential vulnerabilities and the implementation of preemptive measures to mitigate systemic risks. This proposal is in line with the current literature. Recent studies (see, e.g., Raddant and Di Matteo 2023) showed that central nodes in financial networks are pivotal in understanding market dynamics and systemic risks. By leveraging these findings, we show how our analysis aligns with established research indicating that central assets can significantly influence market behavior. Additionally, Bardoscia et al. (2016) highlights the benefits of using advanced centrality measures in portfolio management. Their findings suggest that portfolios constructed with an understanding of network centrality are better diversified and exhibit lower risk. This supports our claim that identifying central assets helps in precise diversification and risk reduction.
In summary, the contributions of the present paper to the literature in this area can be identified in three different aspects. First, in having provided a strategy to assign to nodes a centrality score that depends, in an eigenvector centrality scheme, on that of all the elements of the network connected to it, nodes and edges, thus incorporating the importance of edges. Second, by parameterizing this score as a function of a reinforcement factor, which for the first time implements the intensity of the interaction between the network of nodes and that of the edges. Third, showing how this new indicator, when applied to the minimal spanning tree of a correlations network between assets, allows highlighting more central and therefore riskier assets from a financial default propagation perspective.
The paper is organized as follows. In Section 2, we recall some basic notions about centrality measures and establish the notation. In Section 3, we give a brief overview of the self-adaptive model introduced in Bartesaghi et al. (2024), from which the new centrality measure originates. In Section 4, we define the self-adaptive centrality measure. In Section 5, we apply this measure to a financial dataset, we describe the data and the procedure used to construct the networks and, finally, we compare the results obtained with other centrality measures. We conclude with some further remarks in Section 6.

2. Networks and Centrality Measures

The mathematical structures behind networks are graphs. We briefly recall here the basic graph definitions, as well as the most known vertex centrality measures. For more details the reader can refer to Brandes and Erlebach (2005); Harary (1969). From now on, we will use the words “networks” and “graphs” interchangeably.
Let G = ( V , E ) be a graph, where V is the set of n vertices, or nodes, and E is the set of m edges, or links. For undirected graphs, if ( i , j ) E then ( j , i ) E . In this case, i and j are adjacent. The degree k i of the vertex i is the number of its adjacent nodes, and we denote by k = [ k 1 , , k n ] T the whole degree vector. A ( i , j ) -path is a sequence of distinct vertices and edges between i and j. If a ( i , j ) -path exists, then i and j are connected. G is connected if every pair of vertices is connected. The shortest ( i , j ) -path is said ( i , j ) -geodesic. We define the distance d ( i , j ) between nodes i and j as the number of edges of the ( i , j ) -geodesic.
The adjacency relations between nodes are represented by a n-square binary matrix A = [ a i j ] , called adjacency matrix, whose entries a i j = 1 if ( i , j ) E , 0 otherwise. As the network G = ( V , E ) is undirected, A is symmetric and its eigenvalues are real. Let λ 1 λ 2 λ n be the eigenvalues of A , x j the eigenvector associated with λ j and ( λ j , x j ) , j = 1 , , n an eigenpair of A . Graphs considered in this work are without loops and multiple links. A network is weighted if a weight w i j > 0 is assigned to the link ( i , j ) . In the case of a weighted network, we denote the weighted adjacency matrix by W = [ w i j ] . The line graph of a graph G is a graph G D whose nodes are the edges of G and in which two nodes are connected if the corresponding edges in G have a common vertex.
Centrality is one of the key issues in network analysis. In general, any element (i.e., nodes, edges or groups of nodes) of the network can be important in terms of the overall structure, but the most studied aspect is the assignment of a centrality score to the vertices of the network, indicating their relevance and influence in terms of connections. Among the different centrality measures existing in the literature, we focus on the most well-known and used in the weighted version.
The most intuitive centrality measure is the degree centrality of a node i, which counts the number of nodes adjacent to i, and it is formally represented by the degree k i . For a weighted graph, we can consider weights defining the strength s i = j = 1 n w i j , and collecting the strength values in a vector, s = [ s 1 , , s n ] T .
As degree and strength centralities, the eigenvector centrality (Bonacich 1972) is based on the adjacency relations, but with a more refined interpretation. A node i is central if connected to nodes that are central themselves. In other words, the node i’s centrality x i is proportional to the sum of the centralities of its neighbors, that is:
x i = 1 λ j = 1 n a i j x j ,
where λ is a constant.
Using the vector of centralities x R n , this expression can be rewritten in matrix form as λ x = Ax , so that x is an eigenvector of the adjacency matrix A with eigenvalue λ . As the centralities have to be nonnegative, by the Perron–Frobenius theorem (Horn and Johnson 1985), λ must be the largest eigenvalue of A and the centrality vector is the corresponding principal eigenvector x , whose components are all positive. The normalized (with Euclidean norm) eigenvector score is x i x . Also, in this case, it is easy to generalize to weighted networks defining the vector of weighted eigenvector centralities as the vector x s.t. x = 1 λ Wx , being W the weighted adjacency matrix.
Two measures related to paths are betweenness and closeness (Freeman 1977; Sabidussi 1966). The shortest-path betweenness centrality quantifies how often a node is located on a shortest path between all other nodes. Formally, it is the percentage of geodesics between pairs of vertices j , k i , passing through i:
b ( i ) = j < k g j k i g j k ,
where g j k is the number of geodesics from node j to node k, and g j k i is the number of those geodesics that pass through i. The measure is normalized by dividing the betweenness value b ( i ) by its maximum value n 1 2 .
Closeness of a node i is defined as the reciprocal of the sum of the distance between i and all other nodes:
c ( i ) = 1 j d ( i , j ) .
The normalized version is n 1 j d ( i , j ) and it allows us to compare networks of different sizes.
Unlike degree and eigenvector centrality, which are based on the adjacency relationships, the generalization to the weighted case is not immediate for the path-based measures. A famous algorithm was proposed by Brandes (2001). It extends the betweenness centrality to the weighted case by using the Dijkstra algorithm and reverting the edge weights. We refer to this algorithm in computing the betweenness in Section 5.

3. Self-Adaptive SIS Model Overview

The self-adaptive centrality measure on which this paper focuses was introduced as a direct consequence of the nonlinear dynamic process described in Bartesaghi et al. (2024) and called the ASIS model. Here, we briefly recall the basic features of such a model and then expand on the discussion of the centrality measure.
The ASIS model is based on the continuous interaction between a graph (primal network) and its line graph (dual network). It is assumed that both the primal and dual networks are home to a dynamic process that sees the attributes or scores of the nodes evolve over time according to an iterative scheme based on an SIS-like (Susceptible–Infected–Susceptible) compartmental framework. The model provides for a step-wise update of the edge weights in one of the two networks based on the evolution of the dynamic process in its counterpart. In particular, in a discrete setting, it proves that the weights attributed to the edges in the primal network at time t are updated by the values of the scores associated with the nodes of the dual network at time t 1 . These scores, originally conceived as the probability of being infected or having adopted a certain behavior, are here interpreted as the node score and take on real values in [ 0 , 1 ] .
The ASIS centrality measure is provided by the non null asymptotic state of the probability distribution on the nodes in the two networks and is computed as the outcome of a nonlinear iterative process that allows the process to be modeled over discrete times. The interaction between the primary network and the dual one can be appropriately calibrated by a coupling factor, called the reinforcement factor, which defines the intensity with which one process influences the other. In this way, it is possible to evaluate the effect of the coupling between the processes on their asymptotic values, i.e., on the endemic stationary states, and as a consequence on the centrality measures we are interested in.
The mathematical structure of the model is the following. Let us assume that the primary network G P is represented by an undirected graph with adjacency matrix A P R n × n and incidence matrix E R n × m and the dual network G D by an adjacency matrix A D R m × m . Suppose that both the nodes and the edges of the network G P are assigned numerical attributes represented by vectors x = [ x 1 , , x n ] T and y = [ y 1 , , y m ] T , respectively. Variables x and y evolve in time and their values are used to update the entries in the adjacency matrices according to the rules
A P ( y ) = E diag y E T diag k P A D ( x ) = E T diag x E diag k D
where k P = E y , k D = E T x and diag k is the diagonal matrix having diagonal entries given by k .
The model is then entirely described by the following nonlinear system
x ˙ ( t ) = β I n diag x ( t ) A P ( t ) x ( t ) γ x ( t ) y ˙ ( t ) = β I m diag y ( t ) A D ( t ) y ( t ) γ y ( t )
where β and γ are the infection and recovery rates, assumed common to both the primary and dual networks, I n is the n-square identity matrix, and where we used A P ( t ) = A P ( y ( t ) ) and A D ( t ) = A D ( x ( t ) ) to simplify the expression. The initial conditions of the problem are set to x ( 0 ) = x 0 = p u n and y ( 0 ) = y 0 = p u m , where u n = [ 1 , 1 , , 1 ] T and p R , p ( 0 , 1 ] represents the initial probability of being infected, uniformly distributed across nodes in network G P and nodes in network G D .
Let us observe that, by the rule in Equation (4), edges in the network G P are assigned weights equal to the node probabilities in the network G D to produce an updated version of the adjacency matrix A P ( t ) at time t. Similarly, for A D ( t ) , by assigning G D to the edges of the dual network, the probabilities of the corresponding nodes in G P at time t in a non one-to-one correspondence.
The intensity of the coupling between the two processes can be modulated by an appropriate convex combination between the fully updated adjacency matrix at time t and the fixed adjacency matrix at time t = 0 :
A P ( e ) ( t ) = e A P ( t ) + ( 1 e ) A P ( 0 ) A D ( e ) ( t ) = e A D ( t ) + ( 1 e ) A D ( 0 )
where e [ 0 , 1 ] . In this way, we calibrate the weights of the adjacency matrices from the initial probabilities p ( e = 0 ) and the actual probabilities of the nodes and edges at time t ( e = 1 ). For e = 0 , the model reduces to two disentangled standard SIS processes on the primary and dual networks. For e = 1 , it returns the fully self-adaptive SIS model. For any 0 < e < 1 , we obtain the more general partially coupled model.
Finally, by introducing the variable z ( t ) : = x ( t ) , y ( t ) T R n + m , the model can be given the compact form z ˙ = H ( z ) z , where
H ( z ) : = β I n + m diag z G ( z ) γ I n + m .
and
G ( z ( t ) ) : = A P ( e ) ( t ) 0 n × m 0 m × n A D ( e ) ( t ) .

4. Self-Adaptive Eigenvector Centrality

The above model can lead to an evolution of the process towards extinction or towards endemic non-zero steady states, depending on the values of the parameters involved. In particular, when non-zero steady states exist, they can be obtained as solutions to the following system of nonlinear eigenproblems:
x = R I n diag x A P ( y ) x y = R I m diag y A D ( x ) y
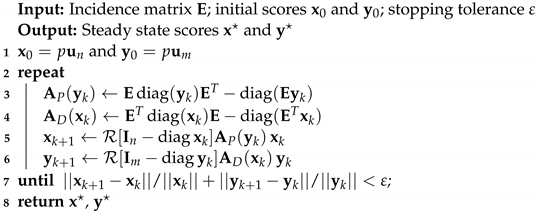
where R = β / γ is the effective infection rate. The eigenvectors x and y of the problem (9) are identified with the steady state solution of the diffusion model, when they exist. An iterative procedure to obtain the eigenvectors x and y can be summarized in the following Algorithm 1.
Algorithm 1: Self-adaptive eigenvector centrality
Economies 12 00164 i001
We stress that this algorithm, when it converges to non-null vectors, returns the final asymptotic values of the diffusive process described in Equation (5), but that the intermediate values at step k do not coincide with the time evolution of the processes x ( t ) and y ( t ) .
We call the component x i of asymptotic value x  Self-adaptive nonlinear eigenvector centrality of node i in the network G P . Specifically, we compute the Perron eigenvectors x and y of the diagonally perturbed adjacency matrices of the graph I n diag x A P ( y ) and of the line graph I m diag y A D ( x ) and interpret their positive components as eigenvector scores for the nodes and the edges, respectively.
There are two key aspects that set apart Equation (9) from a typical equation defining eigenvector centrality. Firstly, it is a nonlinear eigenproblem as it involves matrices that depend on the eigenvectors themselves. Secondly, there is a trade-off between the centralities of the nodes and the centralities of the edges. Essentially, this equation suggests that the centrality of a node is determined by both the centrality of the edges it belongs to and the centrality of its neighbors, and conversely, the centrality of an edge is influenced by the centrality of its extreme nodes and the centrality of its adjacent edges.
Let us note that in Tudisco and Higham (2021), the authors define a node and edge score such that the importance y j of an edge is a nonnegative number proportional only to the importance of the nodes in the same edge, and the importance x i of a node is a nonnegative number proportional only to the importance of the edges in which it participates. They neglect the influence of neighbors’ scores on the centrality of a node and the influence of edges adjacent to the centrality of an edge. In a sense, our centrality measure more evenly encompasses the characteristics of an ordinary eigenvector centrality and the characteristics of the measure introduced in Tudisco and Higham (2021). In fact, focusing, for instance, on the node i in the network G P , its score is proportional to j A P ( y ) i j x j , that is the sum of the products between the score of its neighboring nodes and the score of the corresponding edges connecting them to the node i. Hence, in our model, the importance of a node does not depend on the importance of neighboring nodes alone or adjacent edges individually, but on the combined impact of these factors.

5. Numerical Analysis

5.1. Data Description and Preliminary Analyses

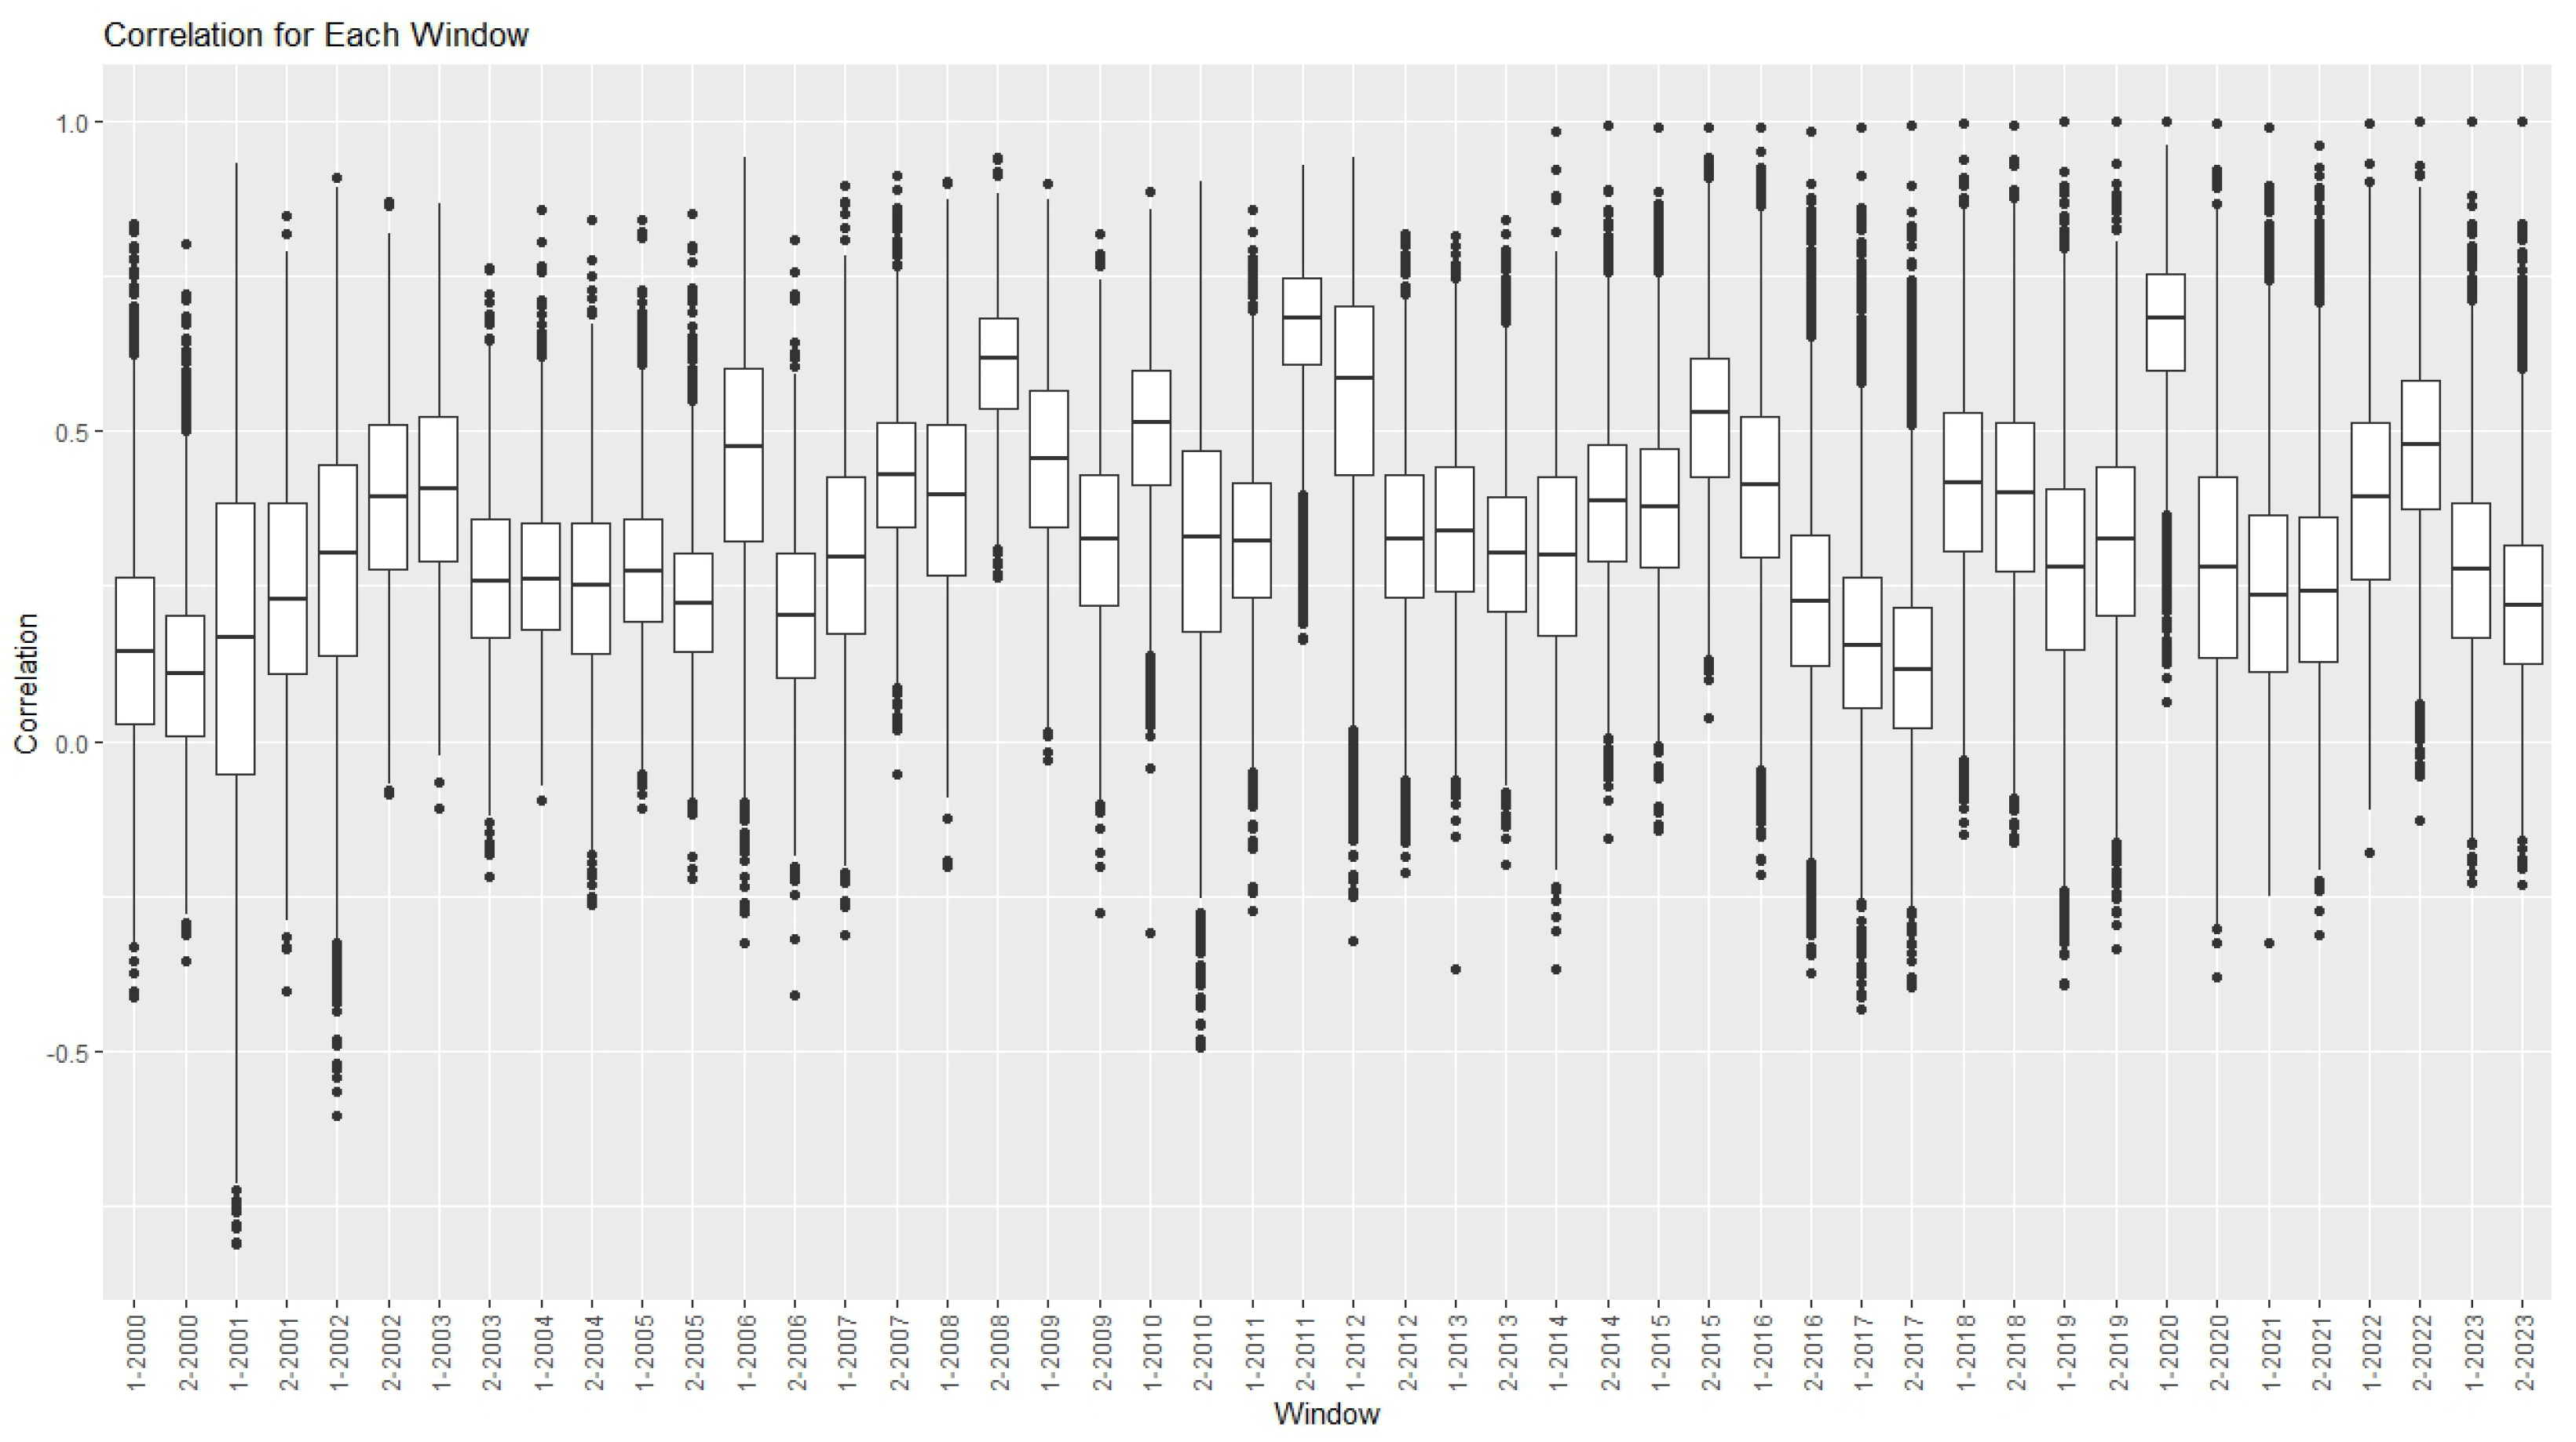
To evaluate our methodology, we implemented a numerical analysis using the returns of assets constituents of the SP100 index as of the conclusion of 2023 (see Table A1 in the Appendix A for list of stocks). Specifically, we analyzed returns spanning from the inception of 2000 to the end of 2023. This extensive time-frame was segmented into 48 windows (i.e., w = 1 , , 48 ), each spanning six months. Within each interval, we computed the sample correlation matrix1 among the returns of the assets. Figure 1 illustrates the temporal distribution of correlation coefficients. Notably, heightened interdependence is evident during periods of crisis. For example, we observed significant spikes in average correlation exceeding 50% in 2008, 2011, and 2020, attributed to diminished diversification stemming from the Lehman Brothers, sovereign debt, and COVID pandemic crises, respectively. The Lehman Brothers collapse triggered widespread financial instability and market panic, leading to a surge in correlation among asset returns as investors sought safe havens amid the turmoil. Similarly, the sovereign debt crises, notably in Europe, induced a contagion effect across financial markets, eroding diversification benefits as correlations spiked amidst concerns over sovereign default risks. The COVID-19 pandemic, with its unprecedented scale and economic disruption, further exacerbated correlations as markets grappled with uncertainty, supply chain disruptions, and government interventions. These crises underscored the importance of diversification strategies and highlighted the challenges of maintaining portfolio resilience in turbulent market conditions.
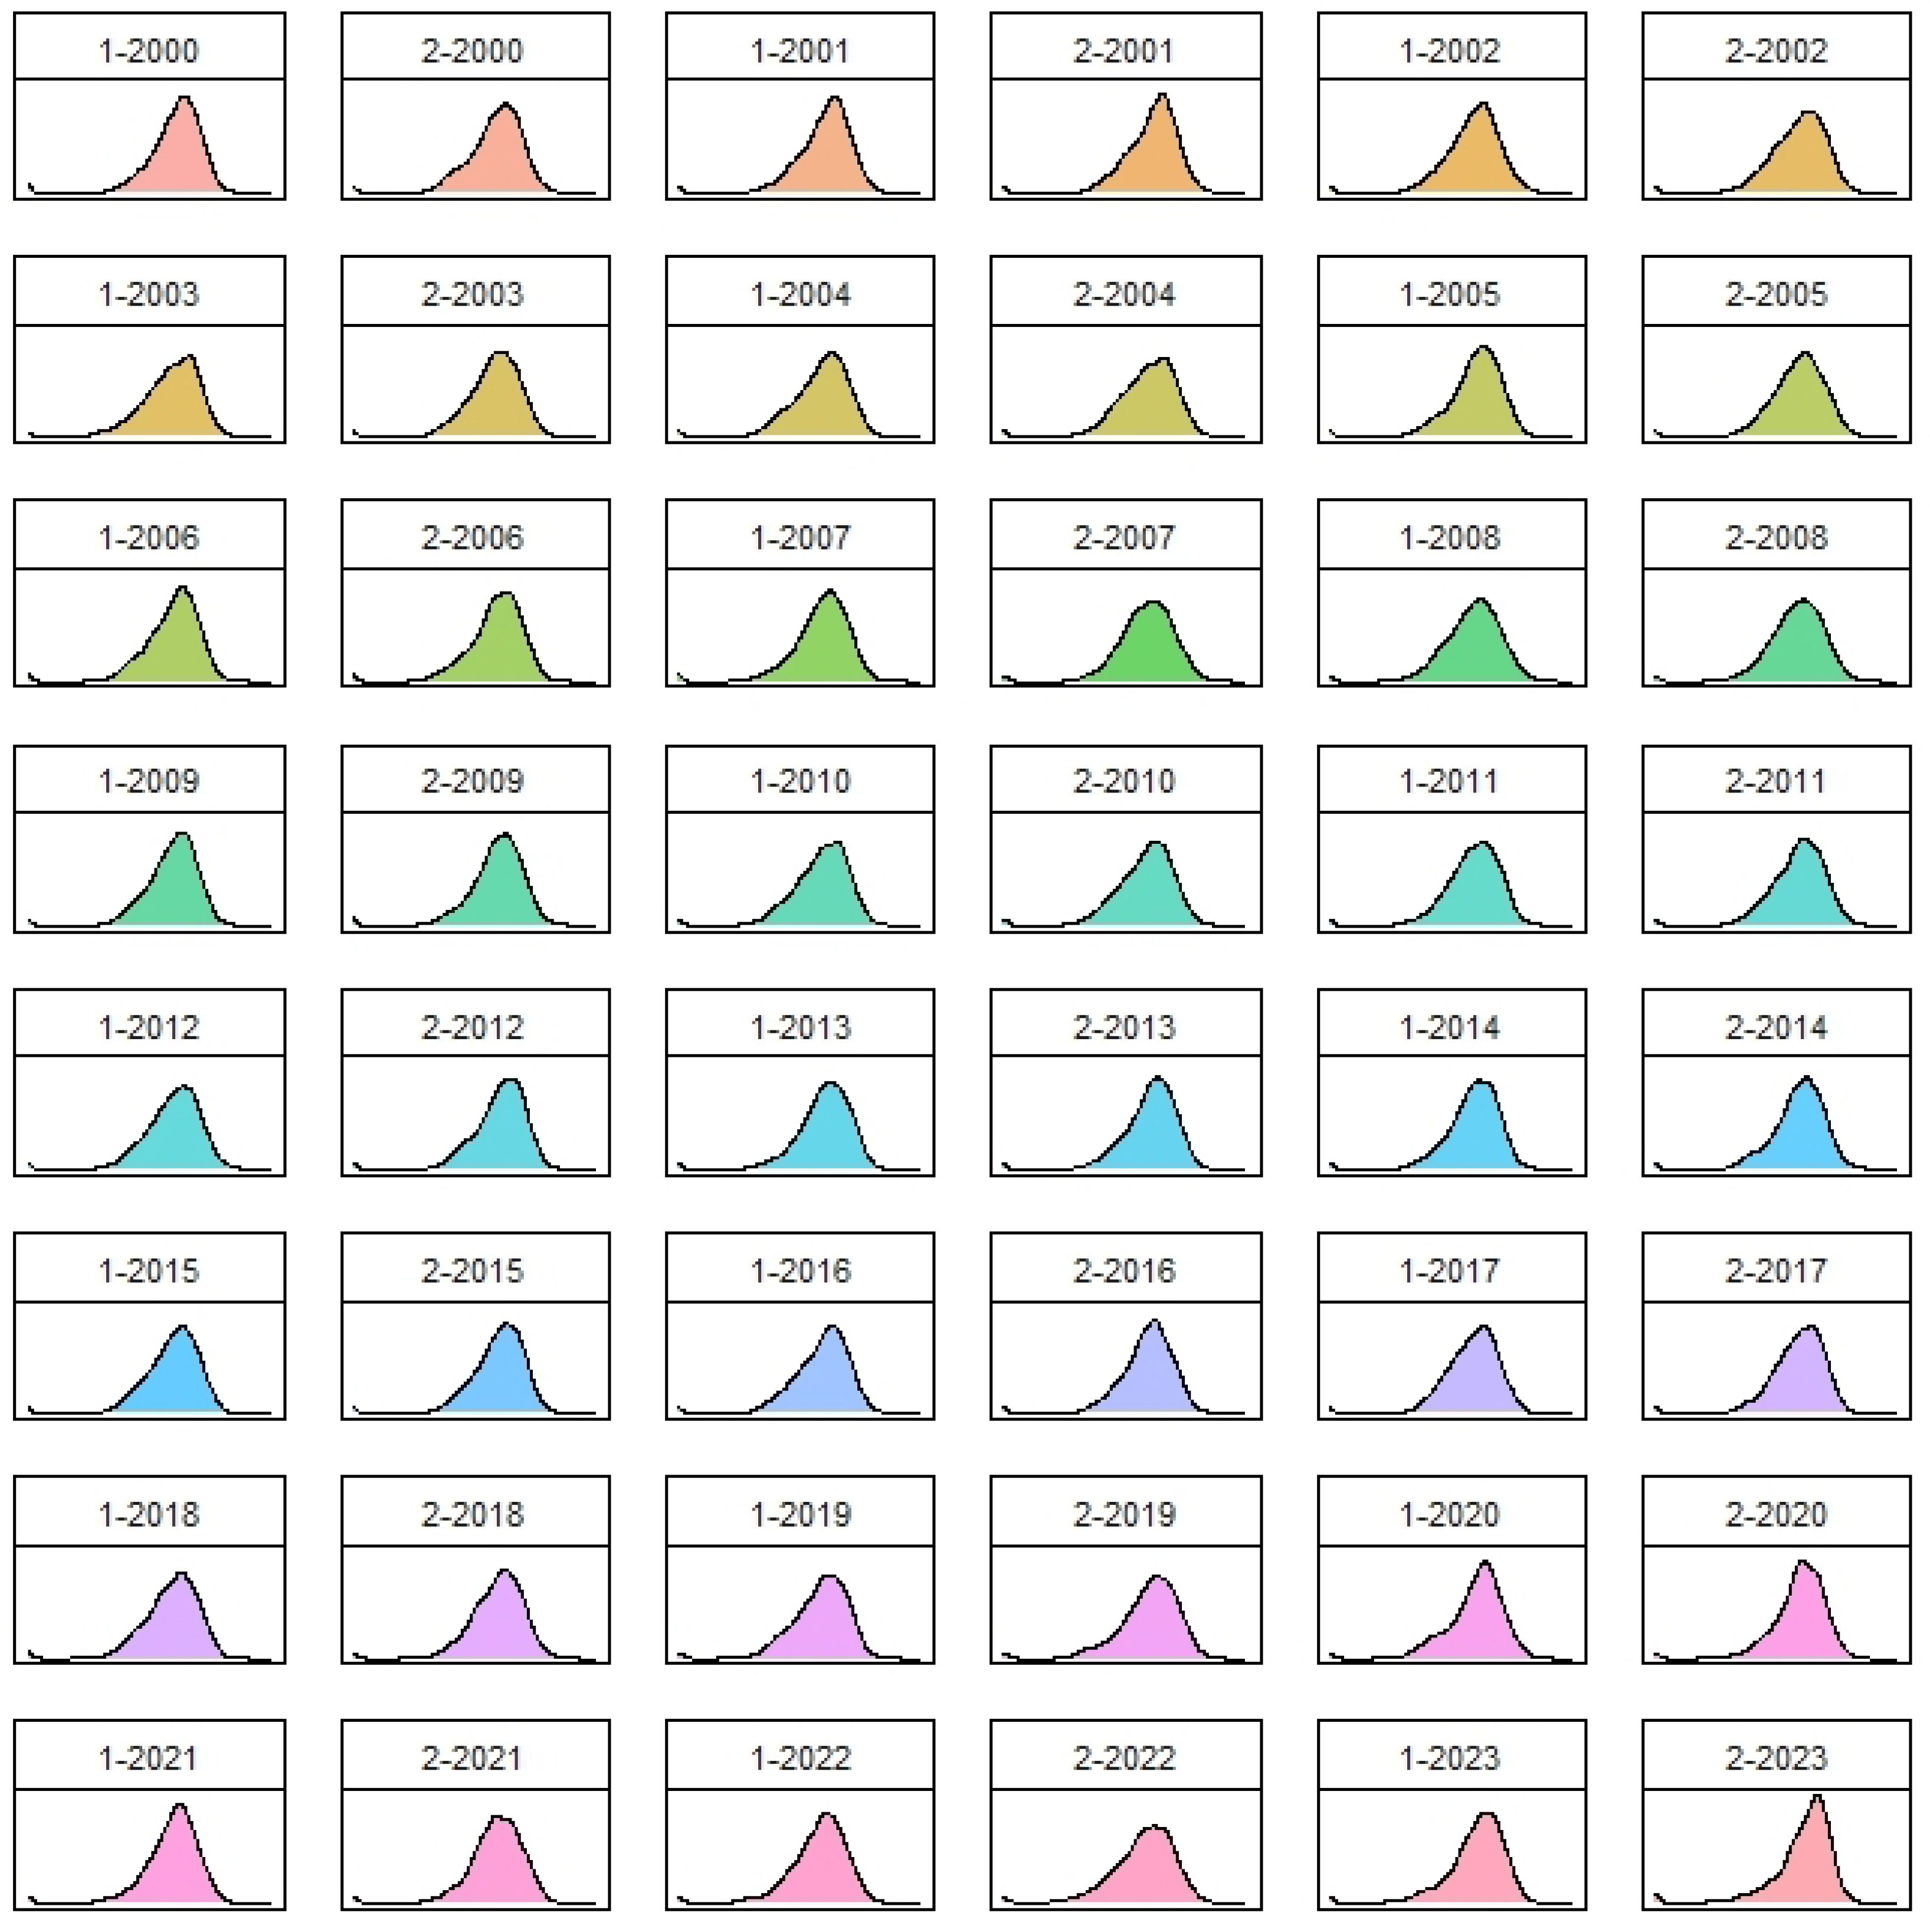
Each correlation matrix was initially used to apply the methodology proposed in Onnela et al. (2003). Specifically, correlation coefficients ρ i , j w , between assets i and j in window w, were transformed using the distance metric d i , j w = 2 1 ρ i , j w . This transformation yielded a distance matrix D w in each window, whose entries, defined in the interval 0 , 2 , are inversely proportional to the level of correlation between stocks, providing a measure of their relationships. A representation of the density functions of the distances is reported in Figure 2.
Subsequently, the distance matrix has been used as a weighted adjacency matrix to construct, in each window, an undirected and weighted graph. At this point, the methodology outlined in Mantegna (1999) has been employed to construct an asset tree. Essentially, this involves identifying the minimum spanning tree (MST) of the distances, denoted T w . The minimum spanning tree is a graph that is connected and acyclic (e.g., without cycles), linking all n w nodes (stocks) present in the window w with n w 1 edges, such that the sum of all edge weights, ( i , j ) d i j w , is minimized. We denote the minimum spanning tree at time t as T t = ( V w , E w ) , where V w represents a set of vertices and E w is a set of unordered pairs of vertices, or edges. The set of edges E w is time-dependent, reflecting the expected evolution of edge weights in the distance matrix D w .
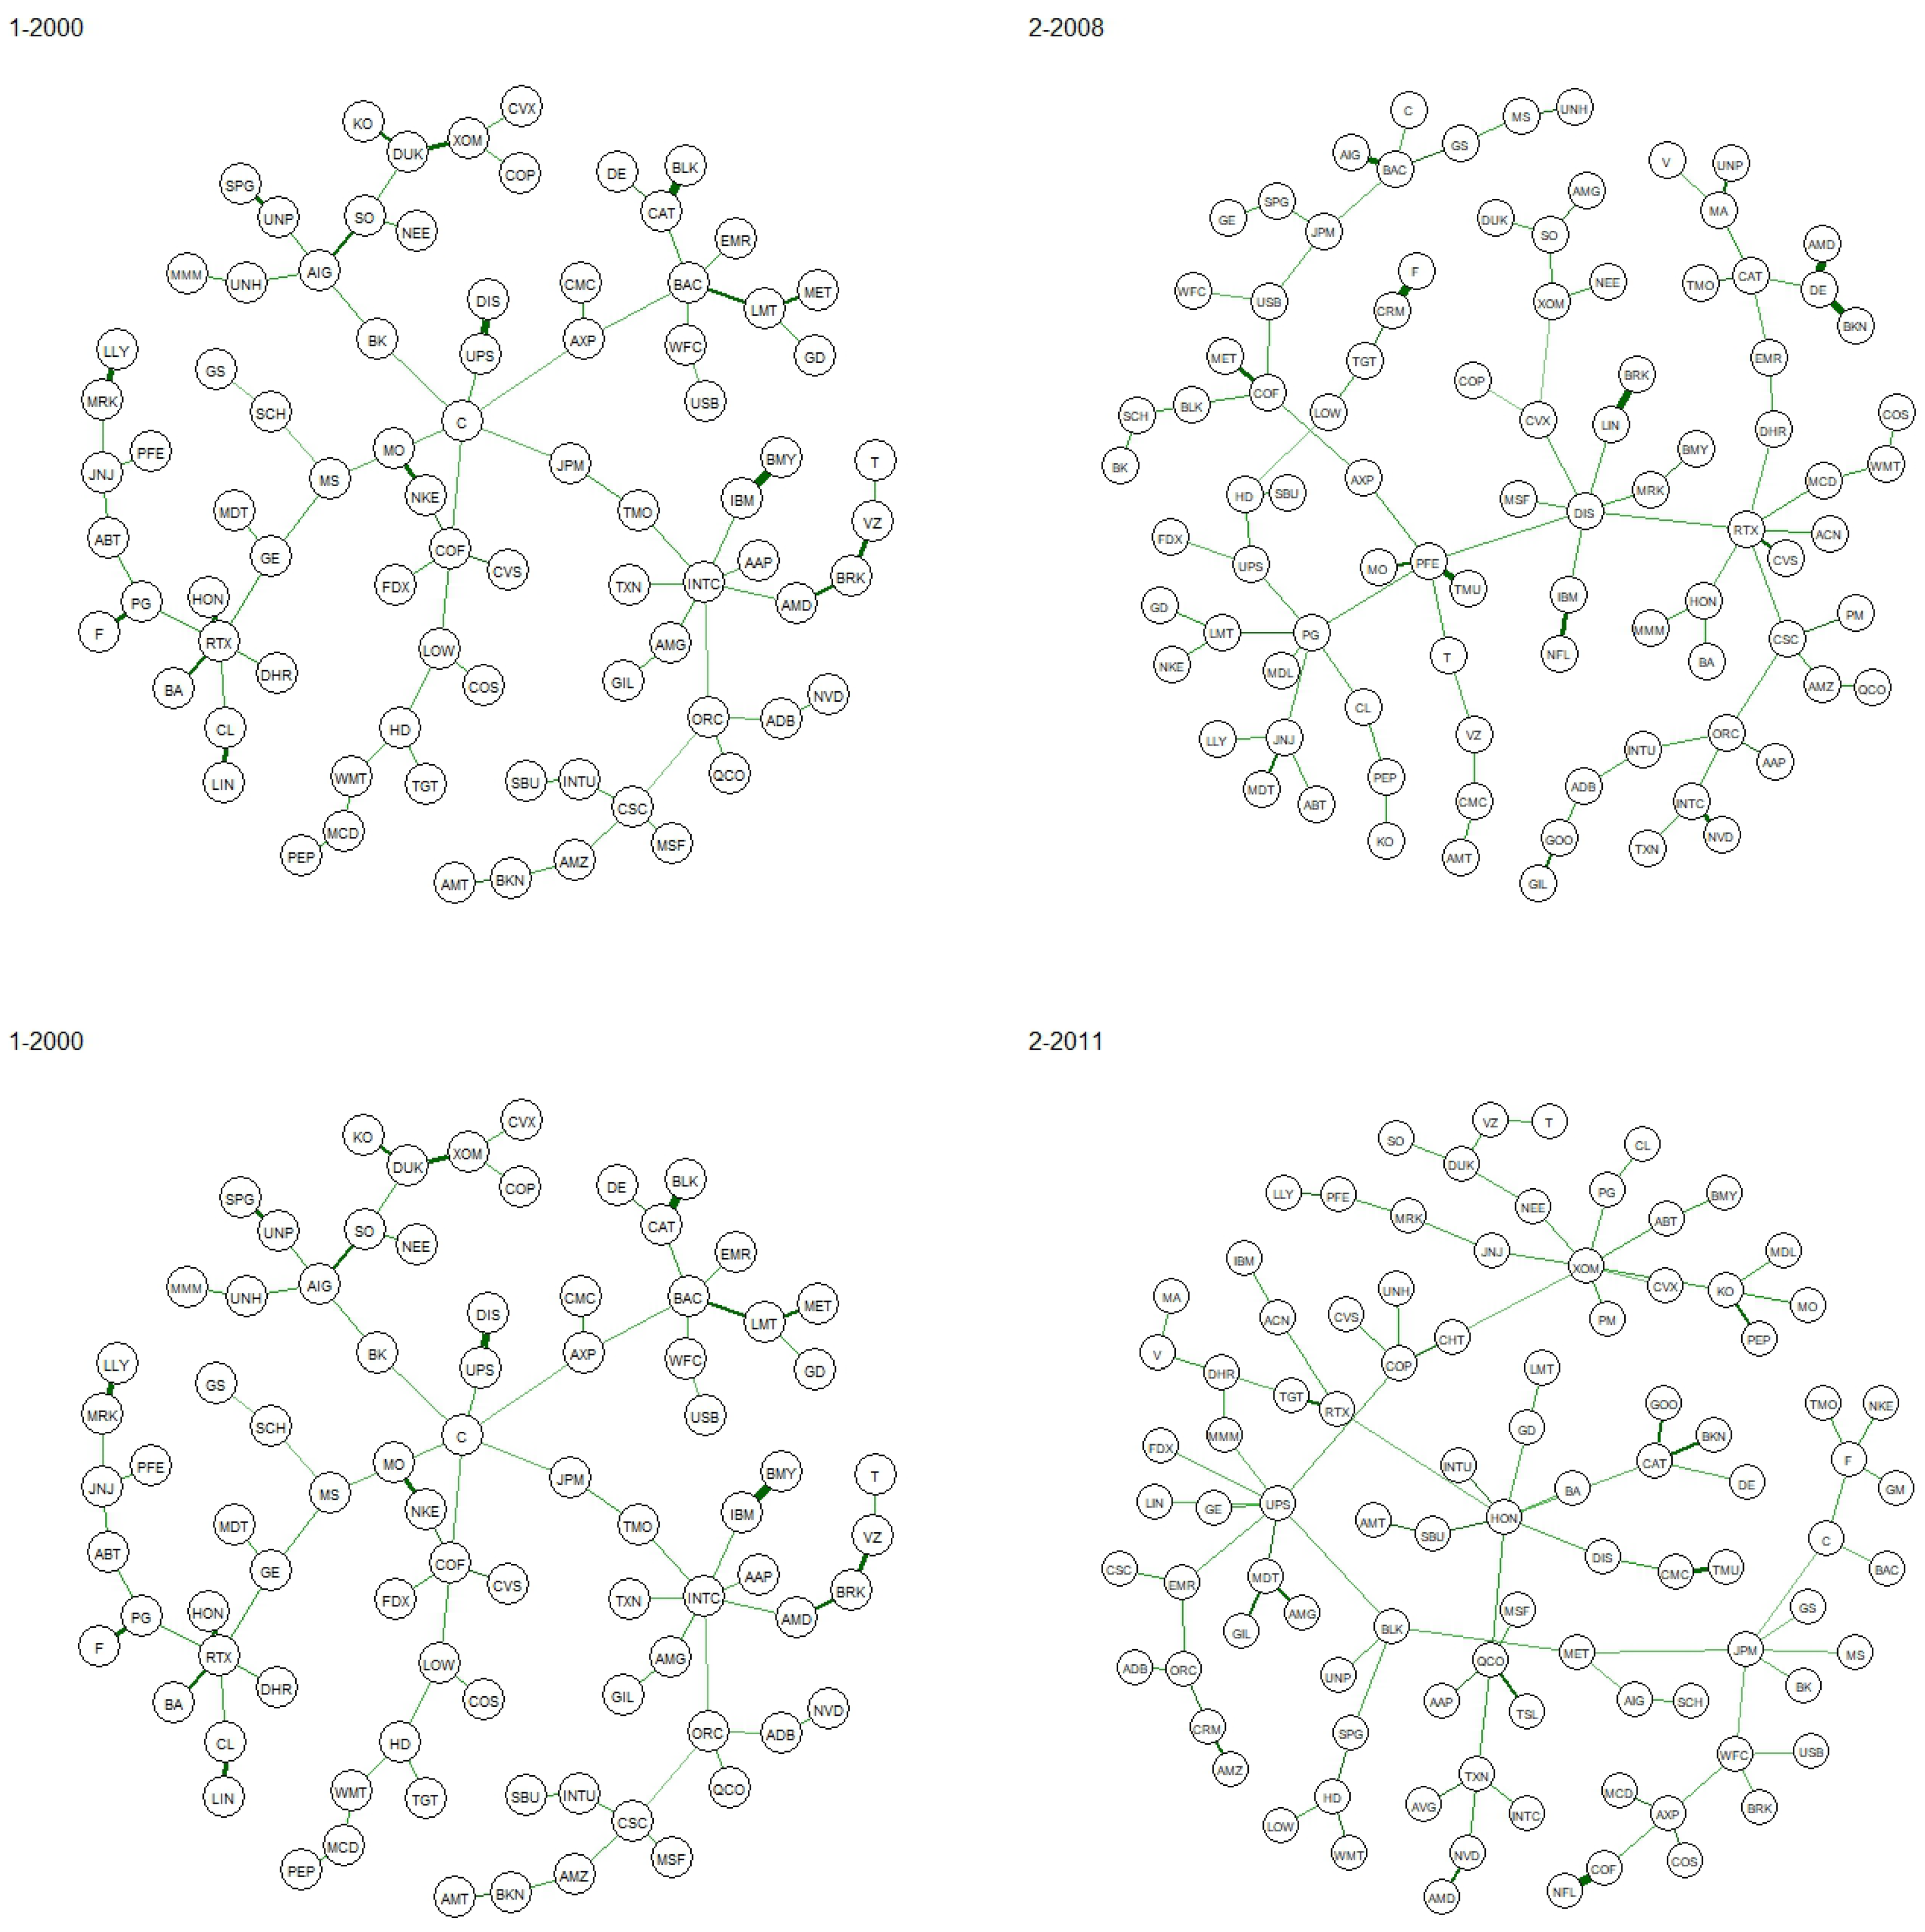
In Figure 2 we observe how the volatility of these weights changes according to the fluctuating levels of volatility and dependence during periods of financial turmoil and calm. The obtained trees, displayed in Figure 3 for specific windows, form a series through time that can be studied and they can be interpreted as the evolutionary steps of dynamic asset tree (see, e.g., Onnela et al. 2003).
The MST extracted the essential structural framework and the core connectivity patterns that capture the most significant connections among the nodes, thereby highlighting the essential relationships and pathways within the network. Indeed, it typically represents the main pathways or prominent features of the network to emphasize the most important edges or connections while reducing complexity.
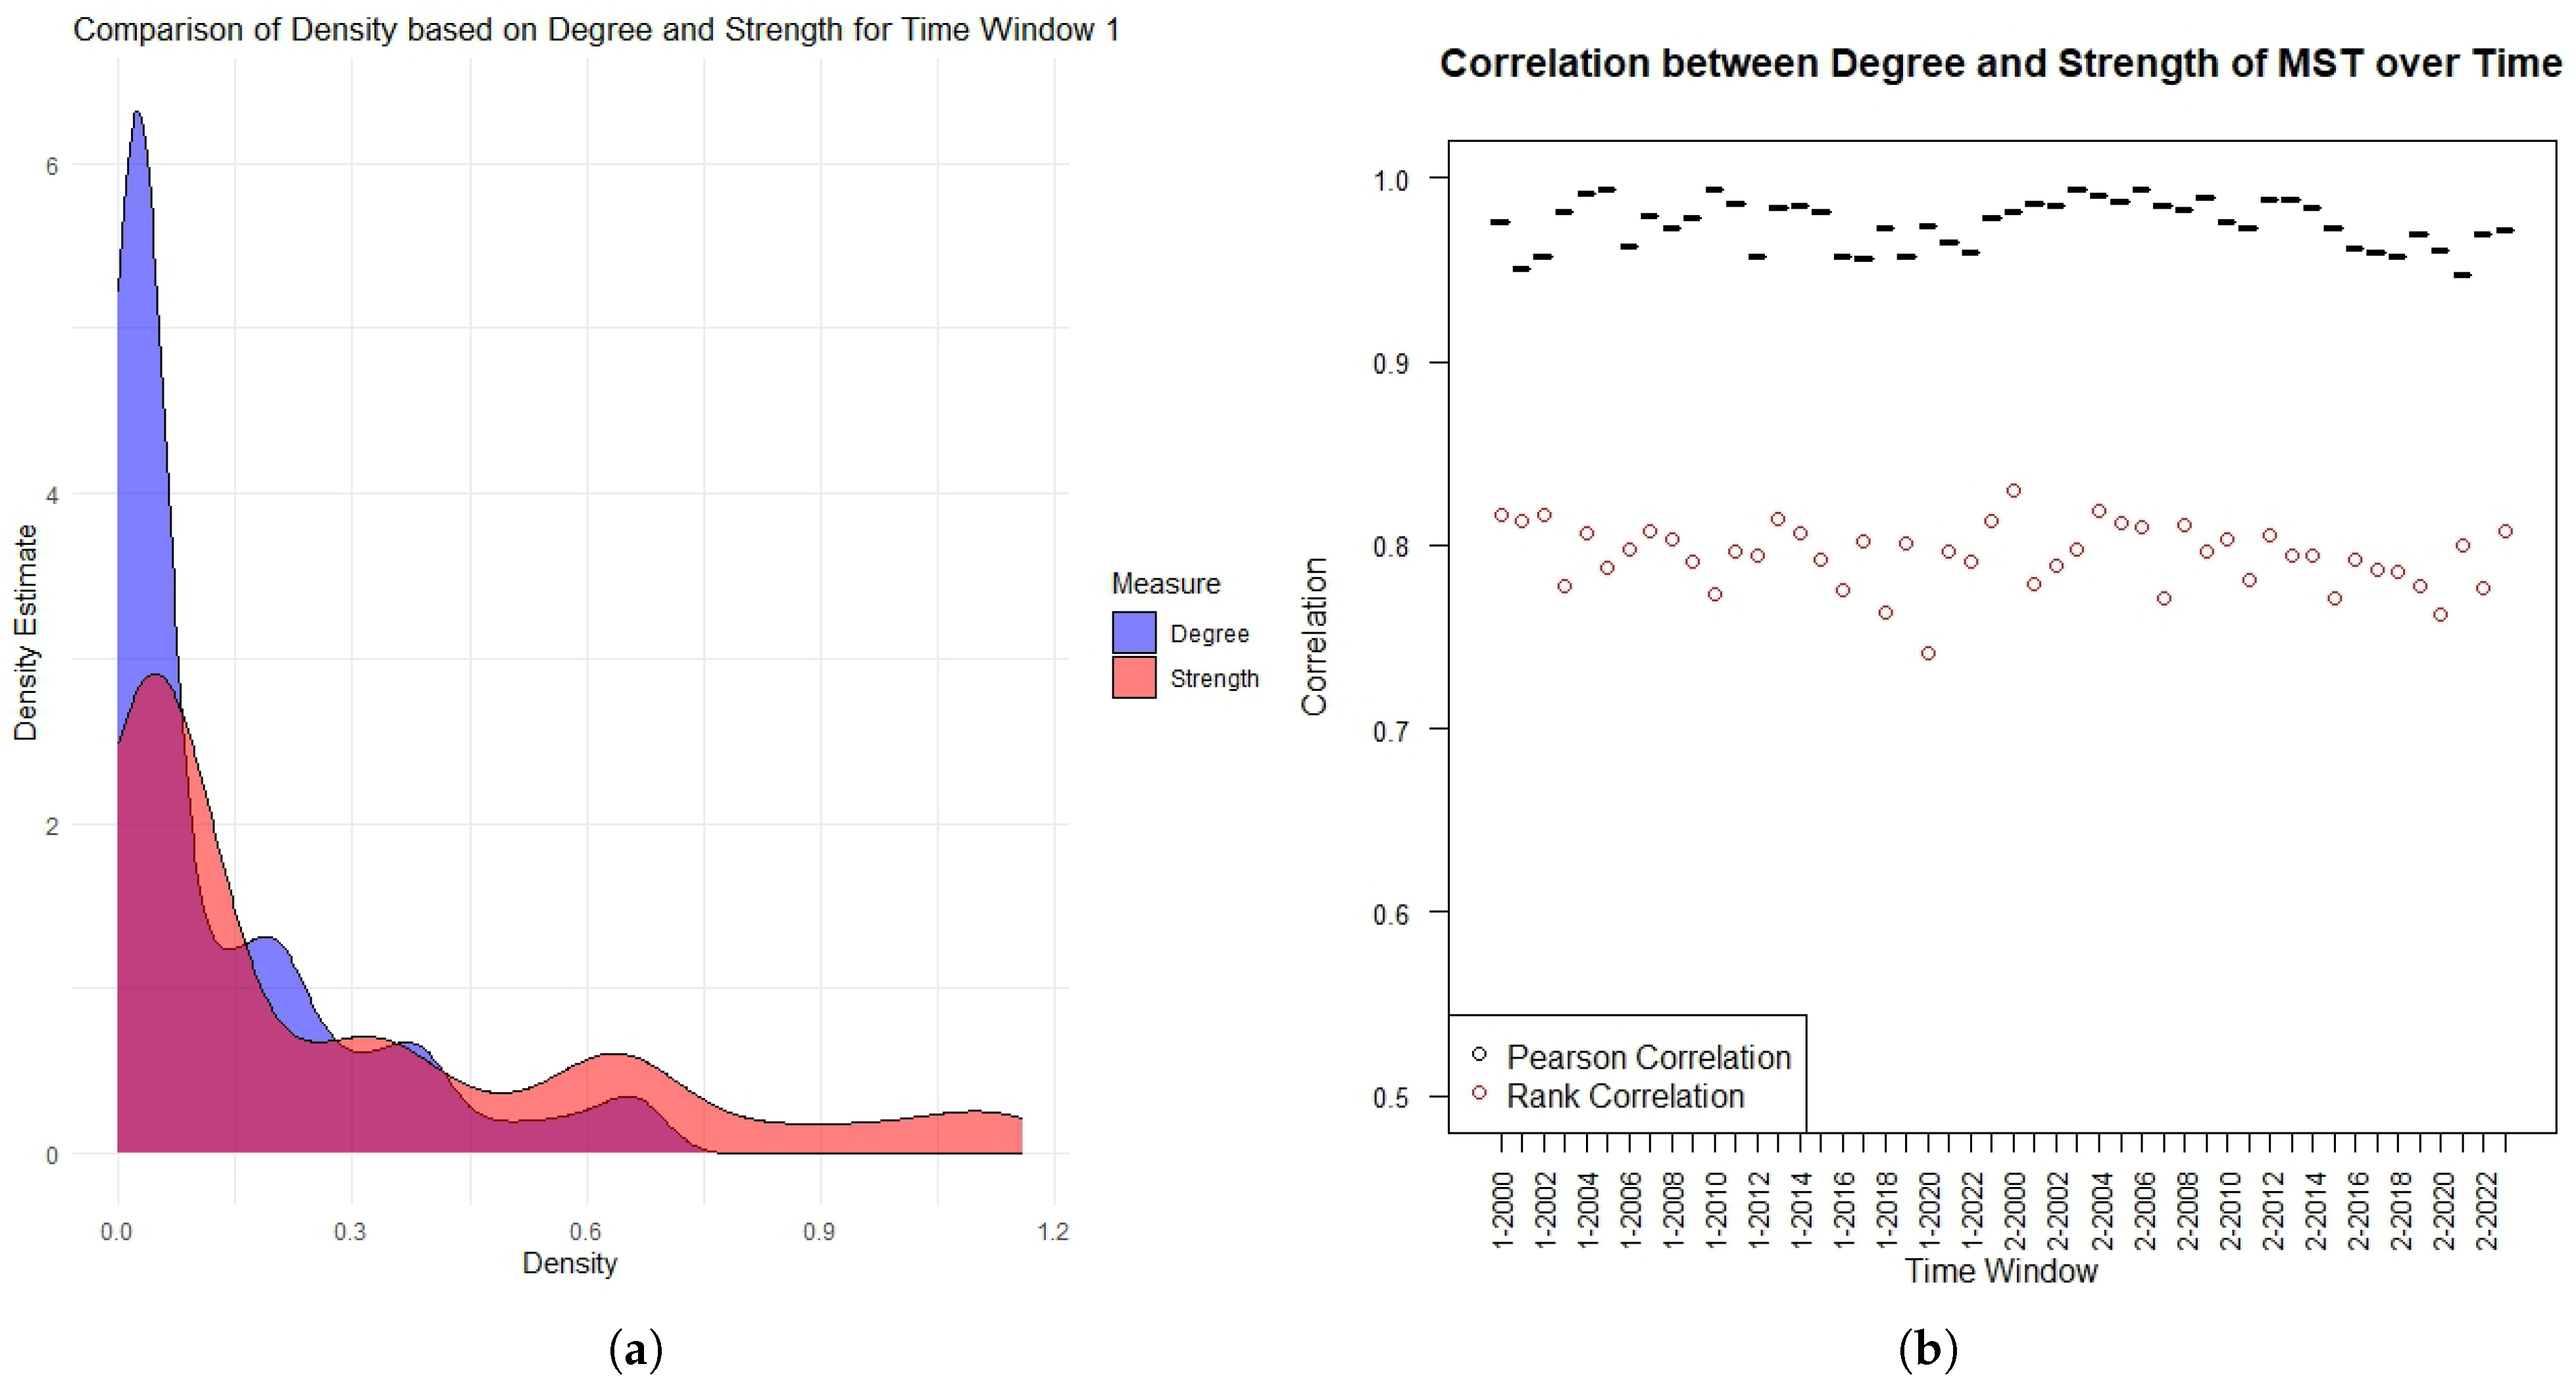
In the realm of MST, the relationship between node strength and degree serves as a crucial indicator of network structure and connectivity. To this end, we study the comparison between the degree and the strength distribution. Figure 4a displays the comparison for the first window, related to the first semester of 2000. Generally, a strong overlap between strength and degree within an MST suggests a consistent alignment between the intensity of interactions (strength) and the number of direct connections (degree) that a node possesses. This coherence implies that highly connected nodes also tend to exhibit stronger interactions, reinforcing their central role in the network. However, over time, fluctuations in market dynamics or shifts in underlying factors can introduce variations in this relationship. The fundamental correlation between strength and degree persists, as Figure 4b displays for both Pearson and Rank correlation. However, it is noteworthy that some temporal changes manifest as divergences or deviations between the two measures. Such differences may stem from evolving patterns of market behavior, the emergence of new influential nodes, or alterations in the significance of existing connections. Thus, while the overarching relationship remains robust, the dynamic nature of the financial landscape introduces nuances that underscore the importance of analyzing the behavior of both weighted and unweighted measures.
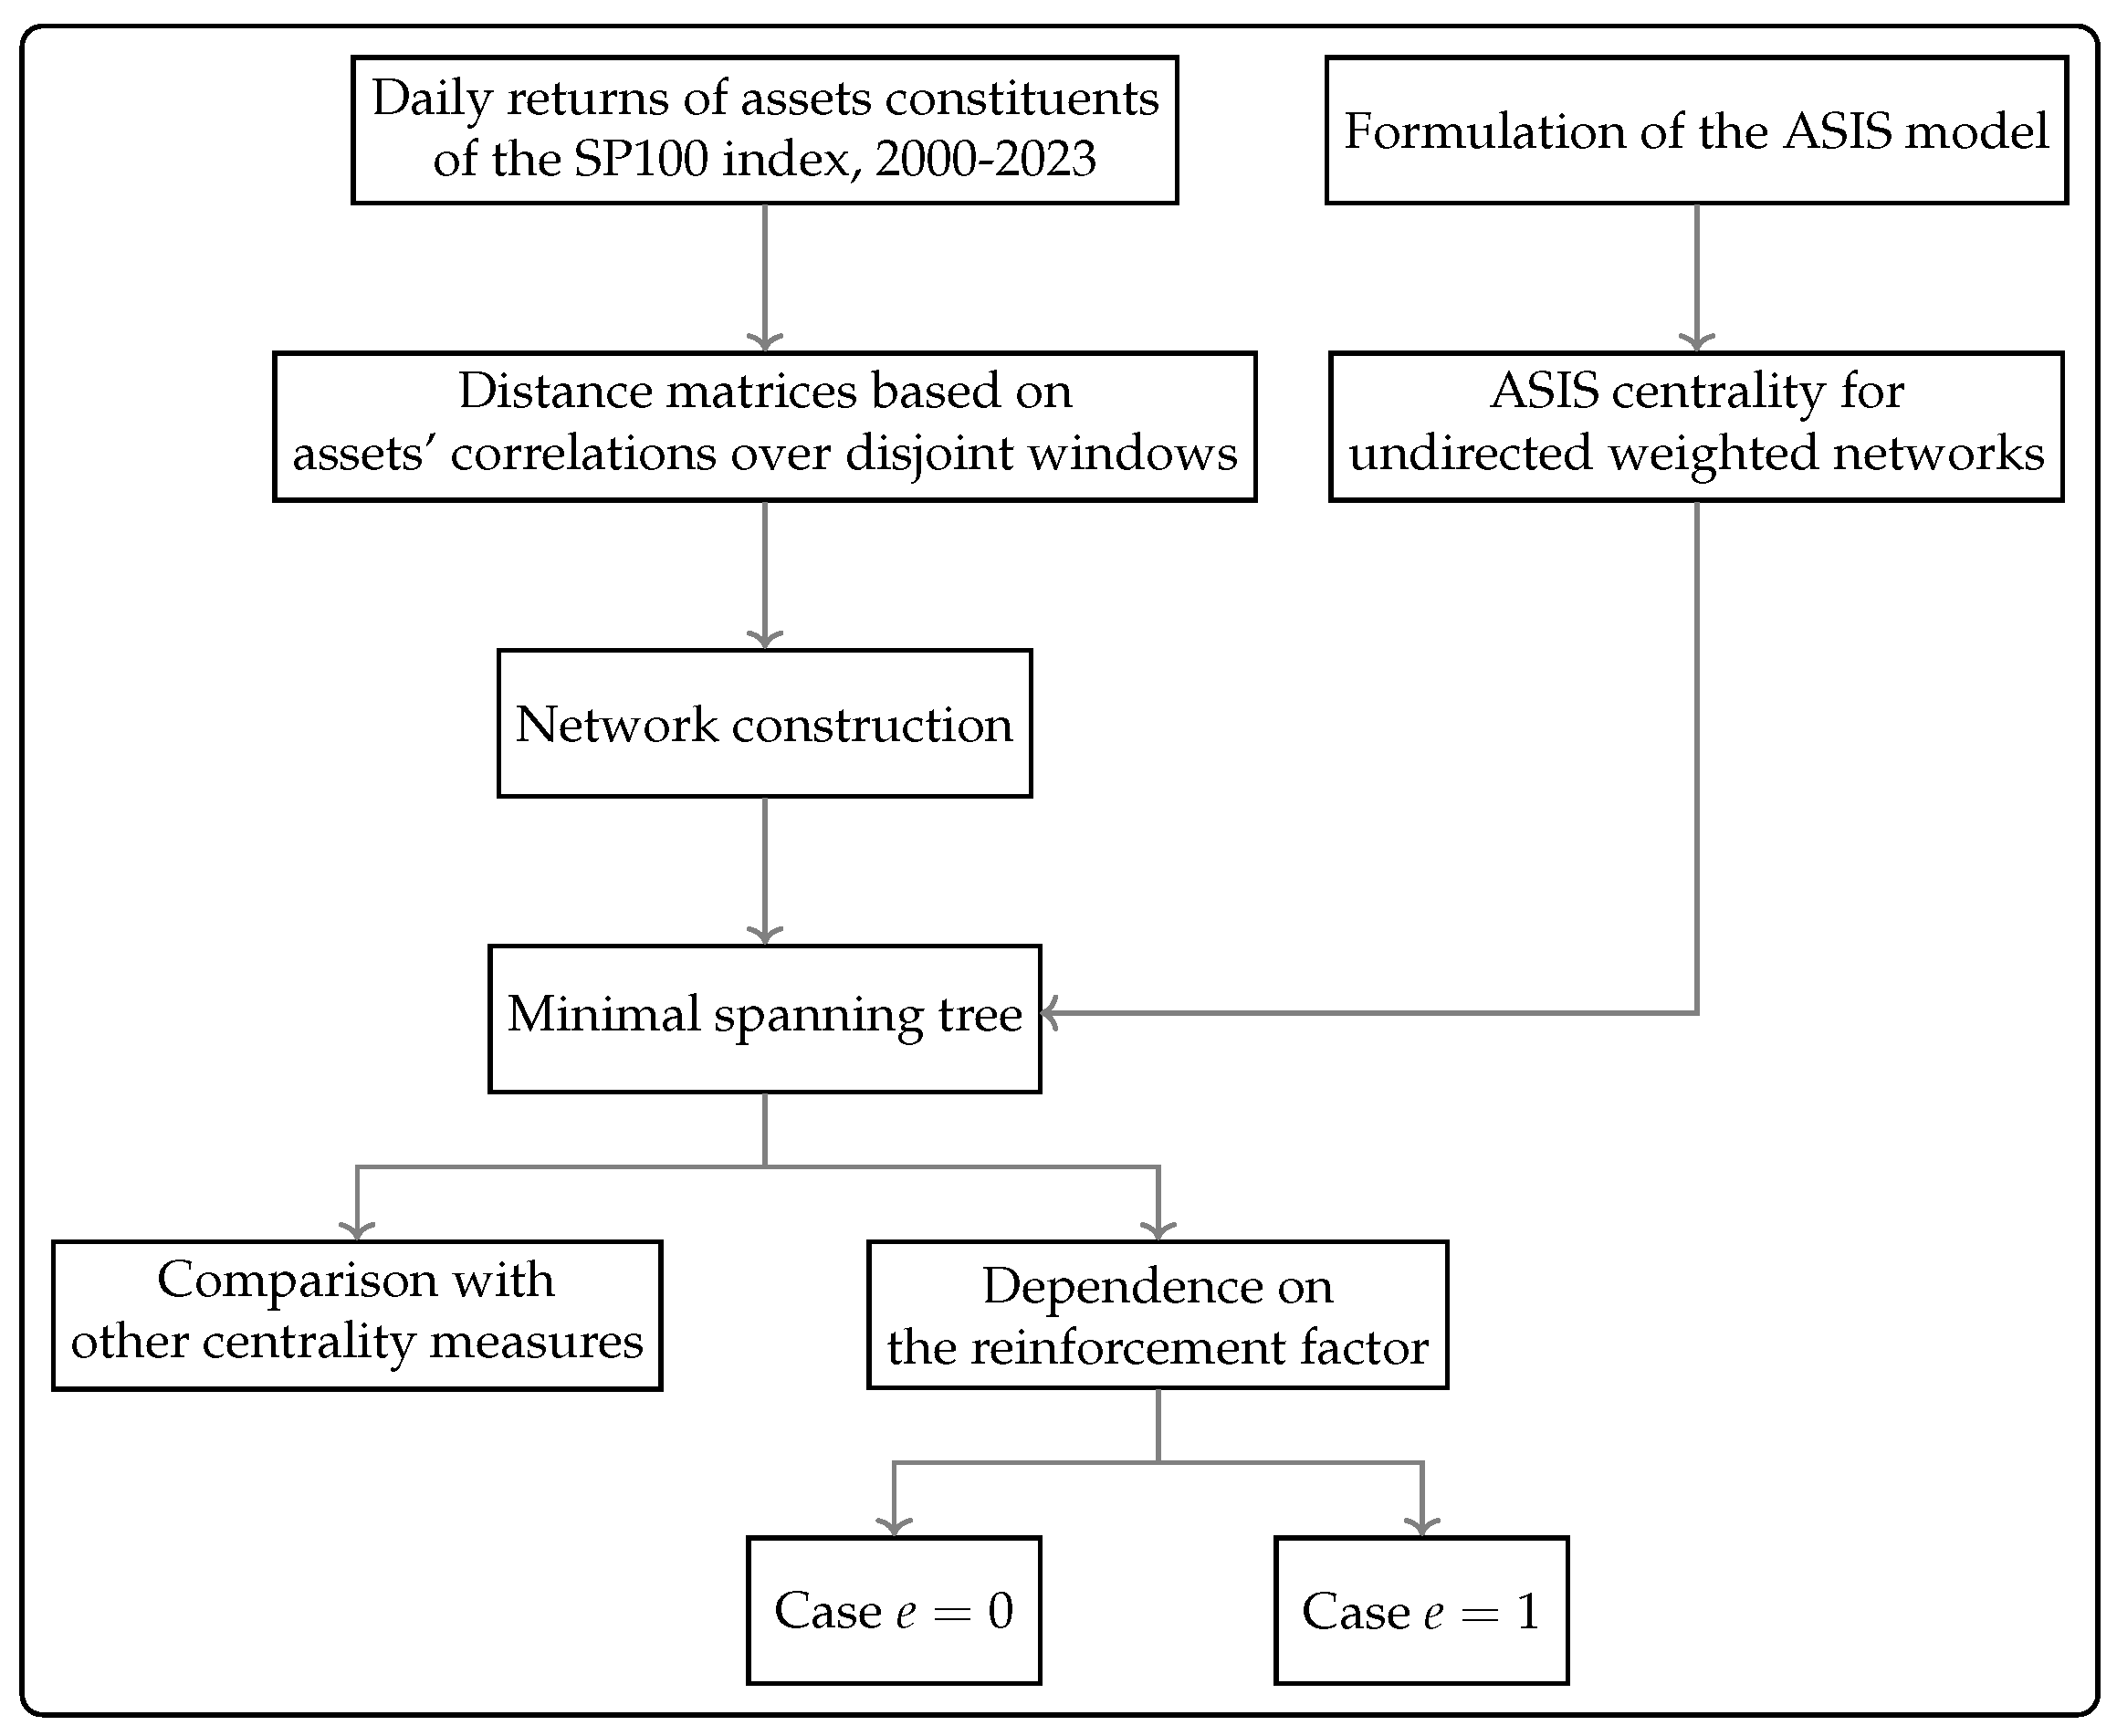
For clarity, we have summarized the research methodology described above in the workflow diagram shown in Figure 5.

5.2. Main Results and Discussion

We computed the non-linear eigenvector centrality x and y in Equation (9) using both the classical SIS model and the ASIS version, with e equal to 0 and 1, respectively, as in Equation (6). Subsequently, we ranked the centralities of nodes in descending order. To compare the results, we employed both traditional unweighted and weighted centrality measures. Specifically, we applied degree and closeness to the unweighted graph, while strength, betweenness, and eigenvector centrality were computed on the weighted graph. Again, we ranked these scores in descending order.
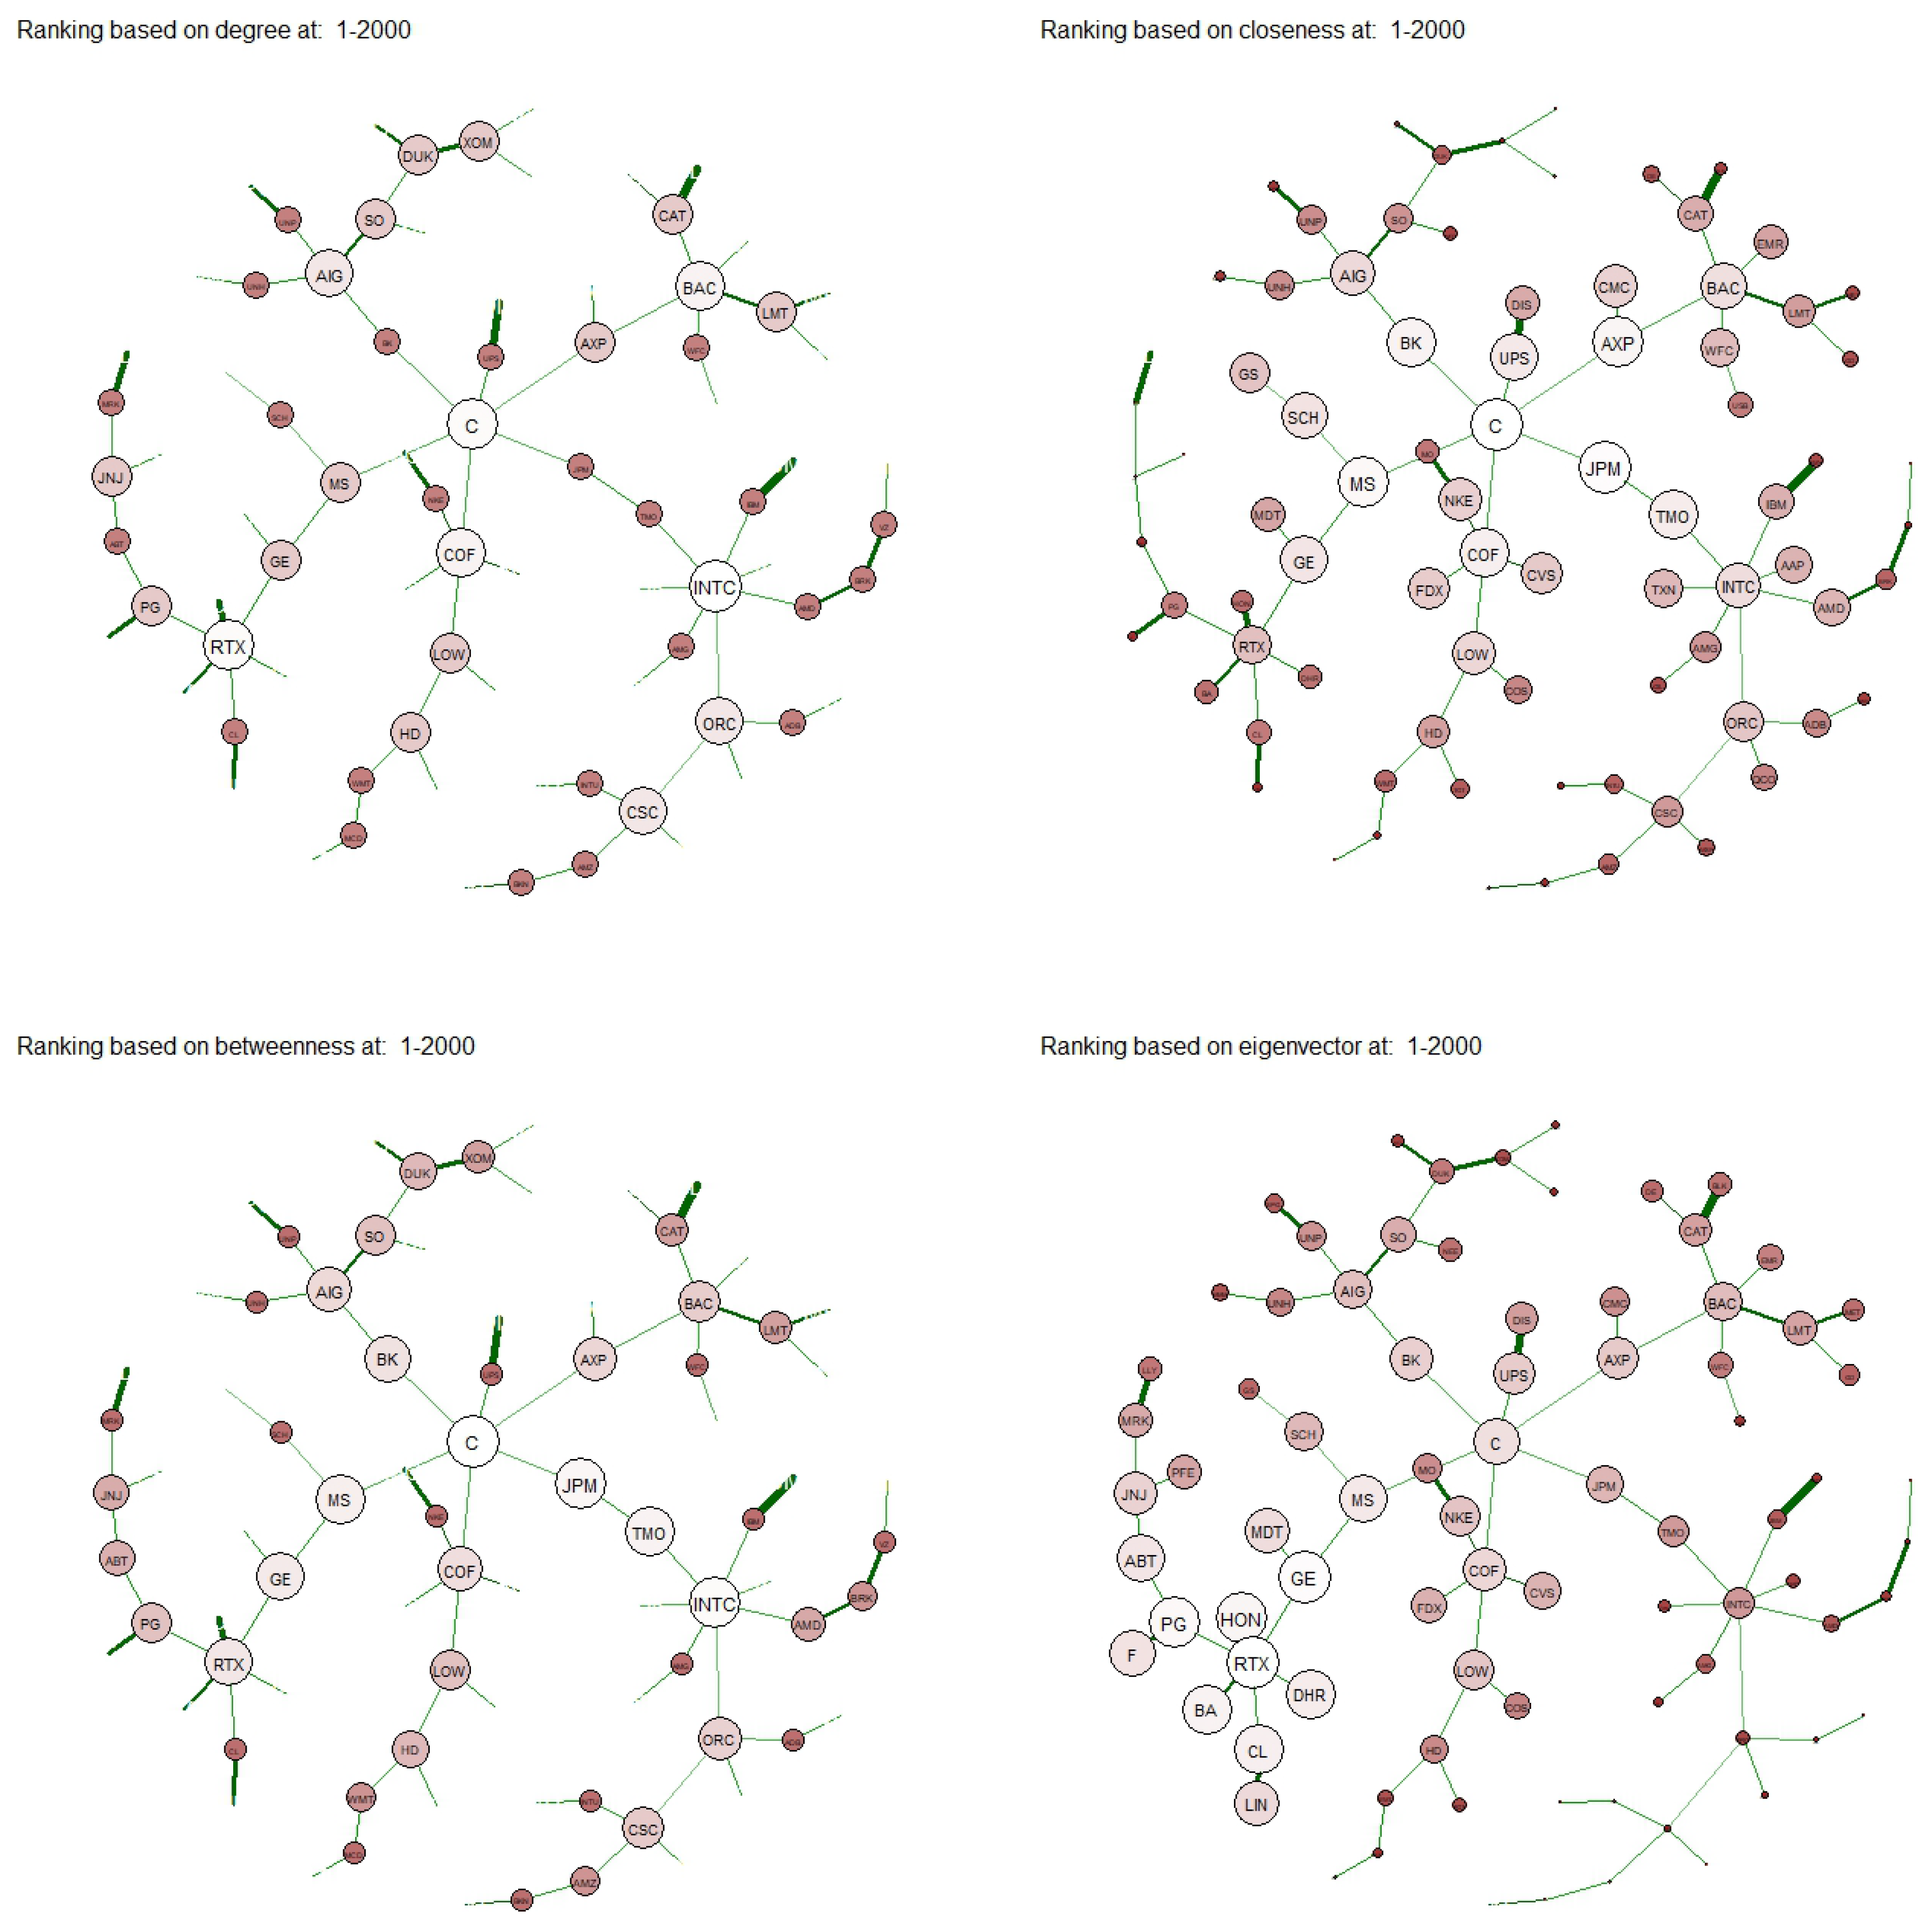
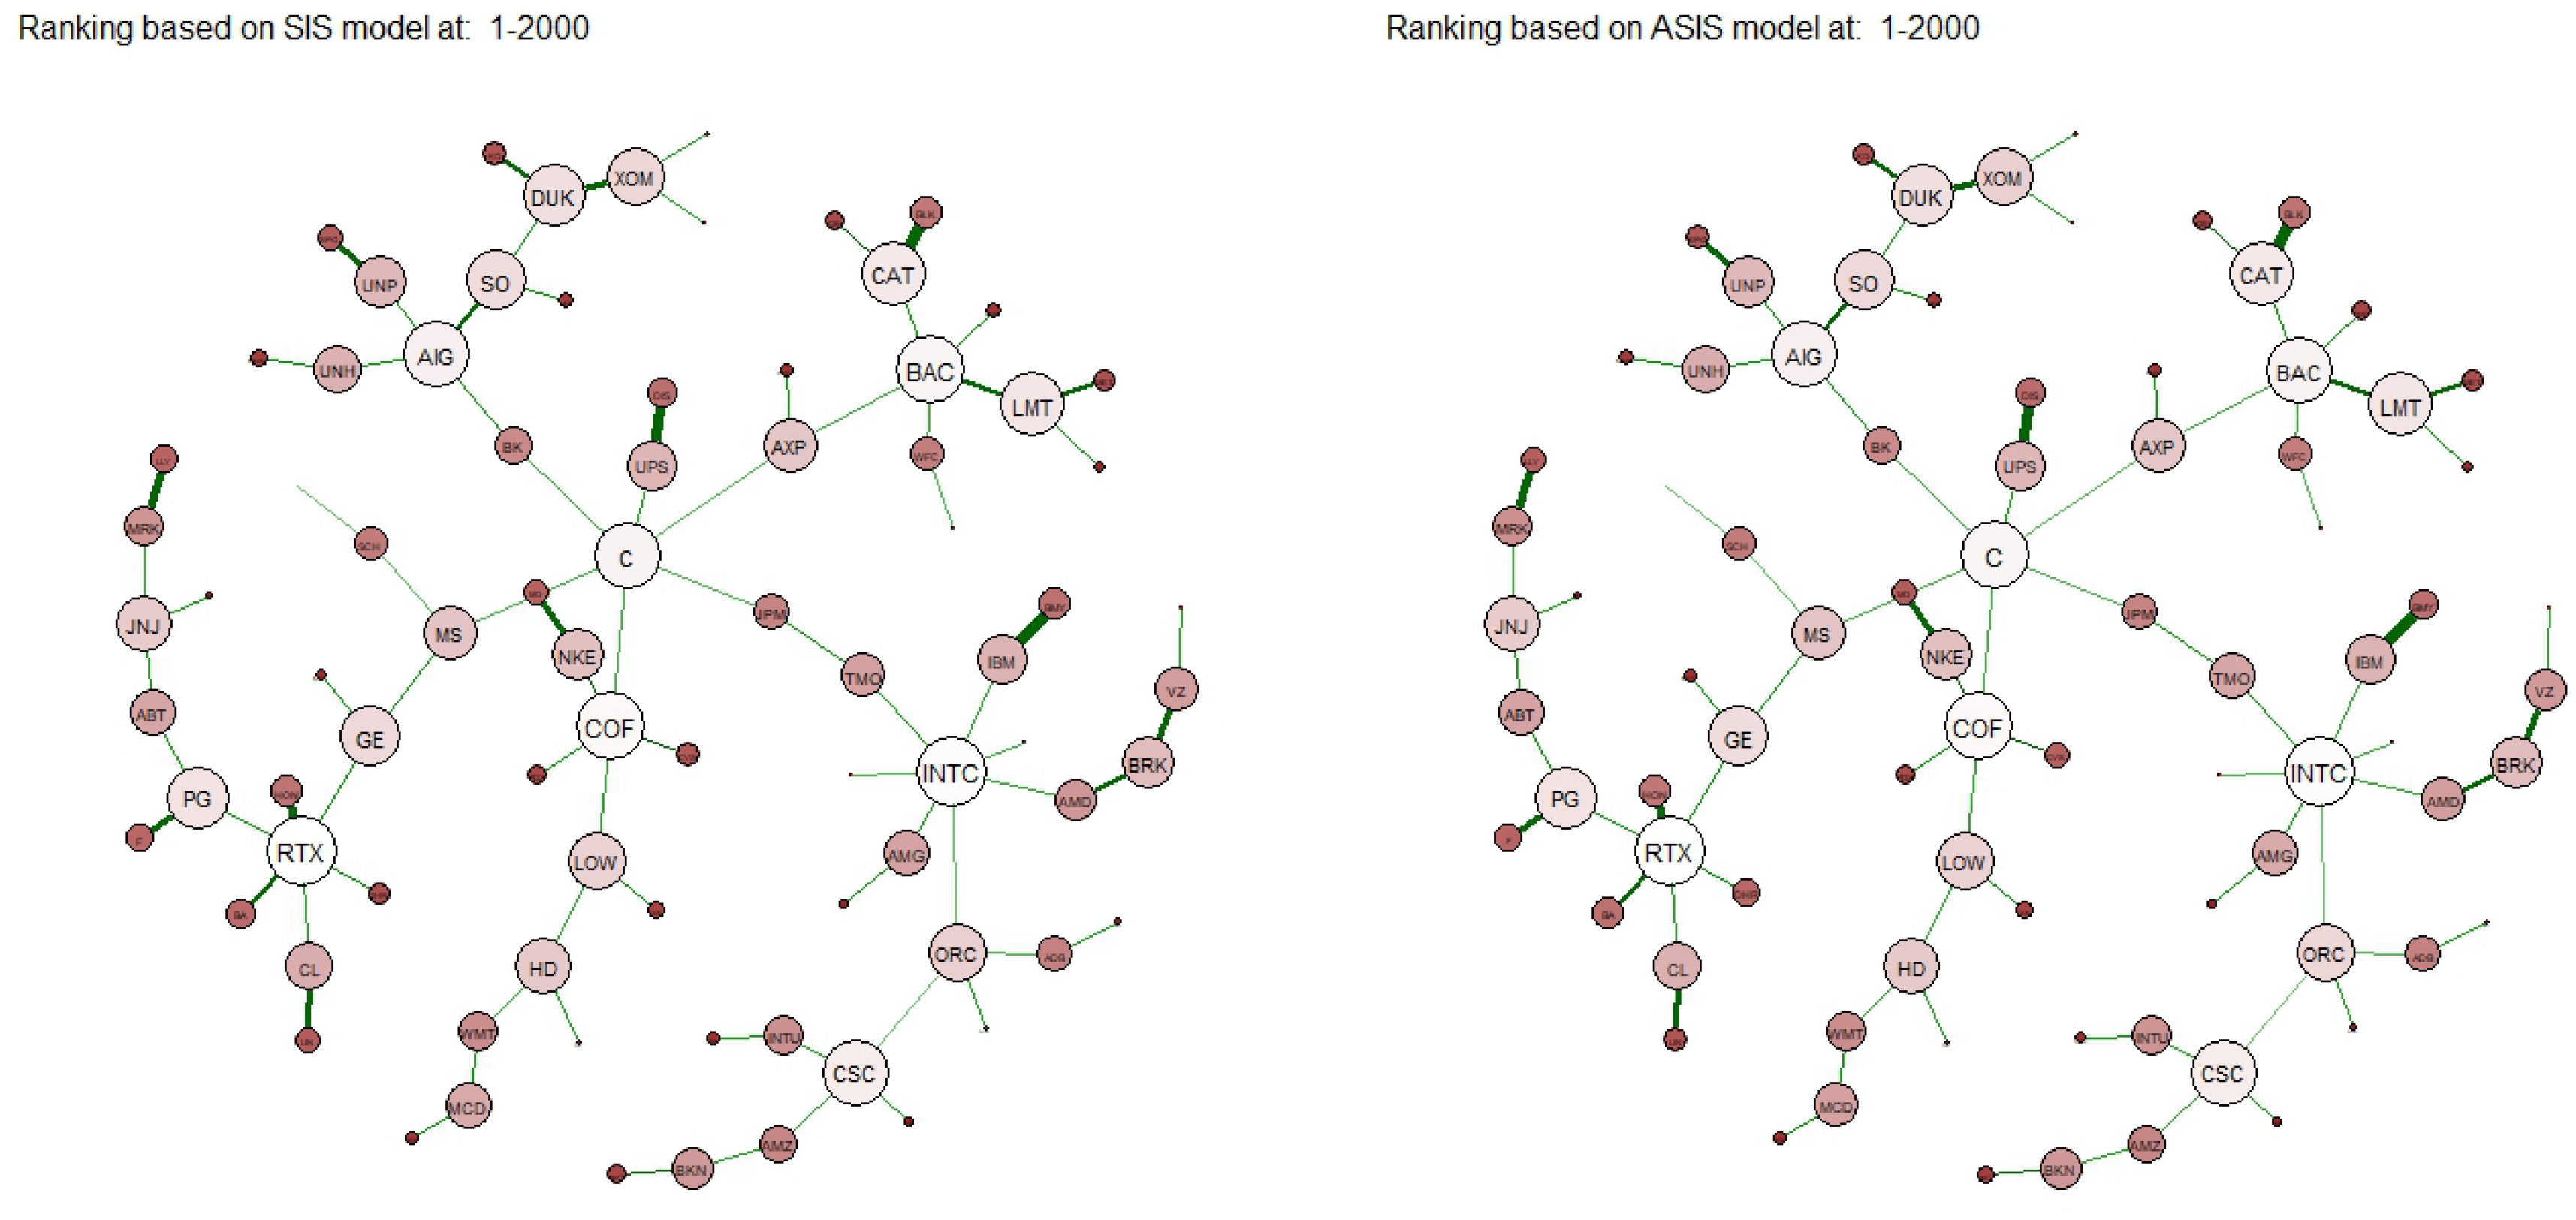
This process was repeated for each time window, and we now present the results for the initial period (first semester 2000). In particular, in Figure 6 we depict the MST structure in the first window and we compare node rankings based on alternative centrality measures. Notably, regarding classical measures, degree and betweenness centrality metrics appear to identify the main hub node of the tree, as well as all nodes located at the center of sub-trees. Conversely, eigenvector and closeness centrality metrics seem to be more inclined towards identifying specific sub-trees or the entire central portion of the whole tree itself. Regarding the non-linear centrality measures, pendant nodes are relegated to low rankings, while a high score is observed for nodes that act as the main hub in the tree or in the most relevant sub-trees.
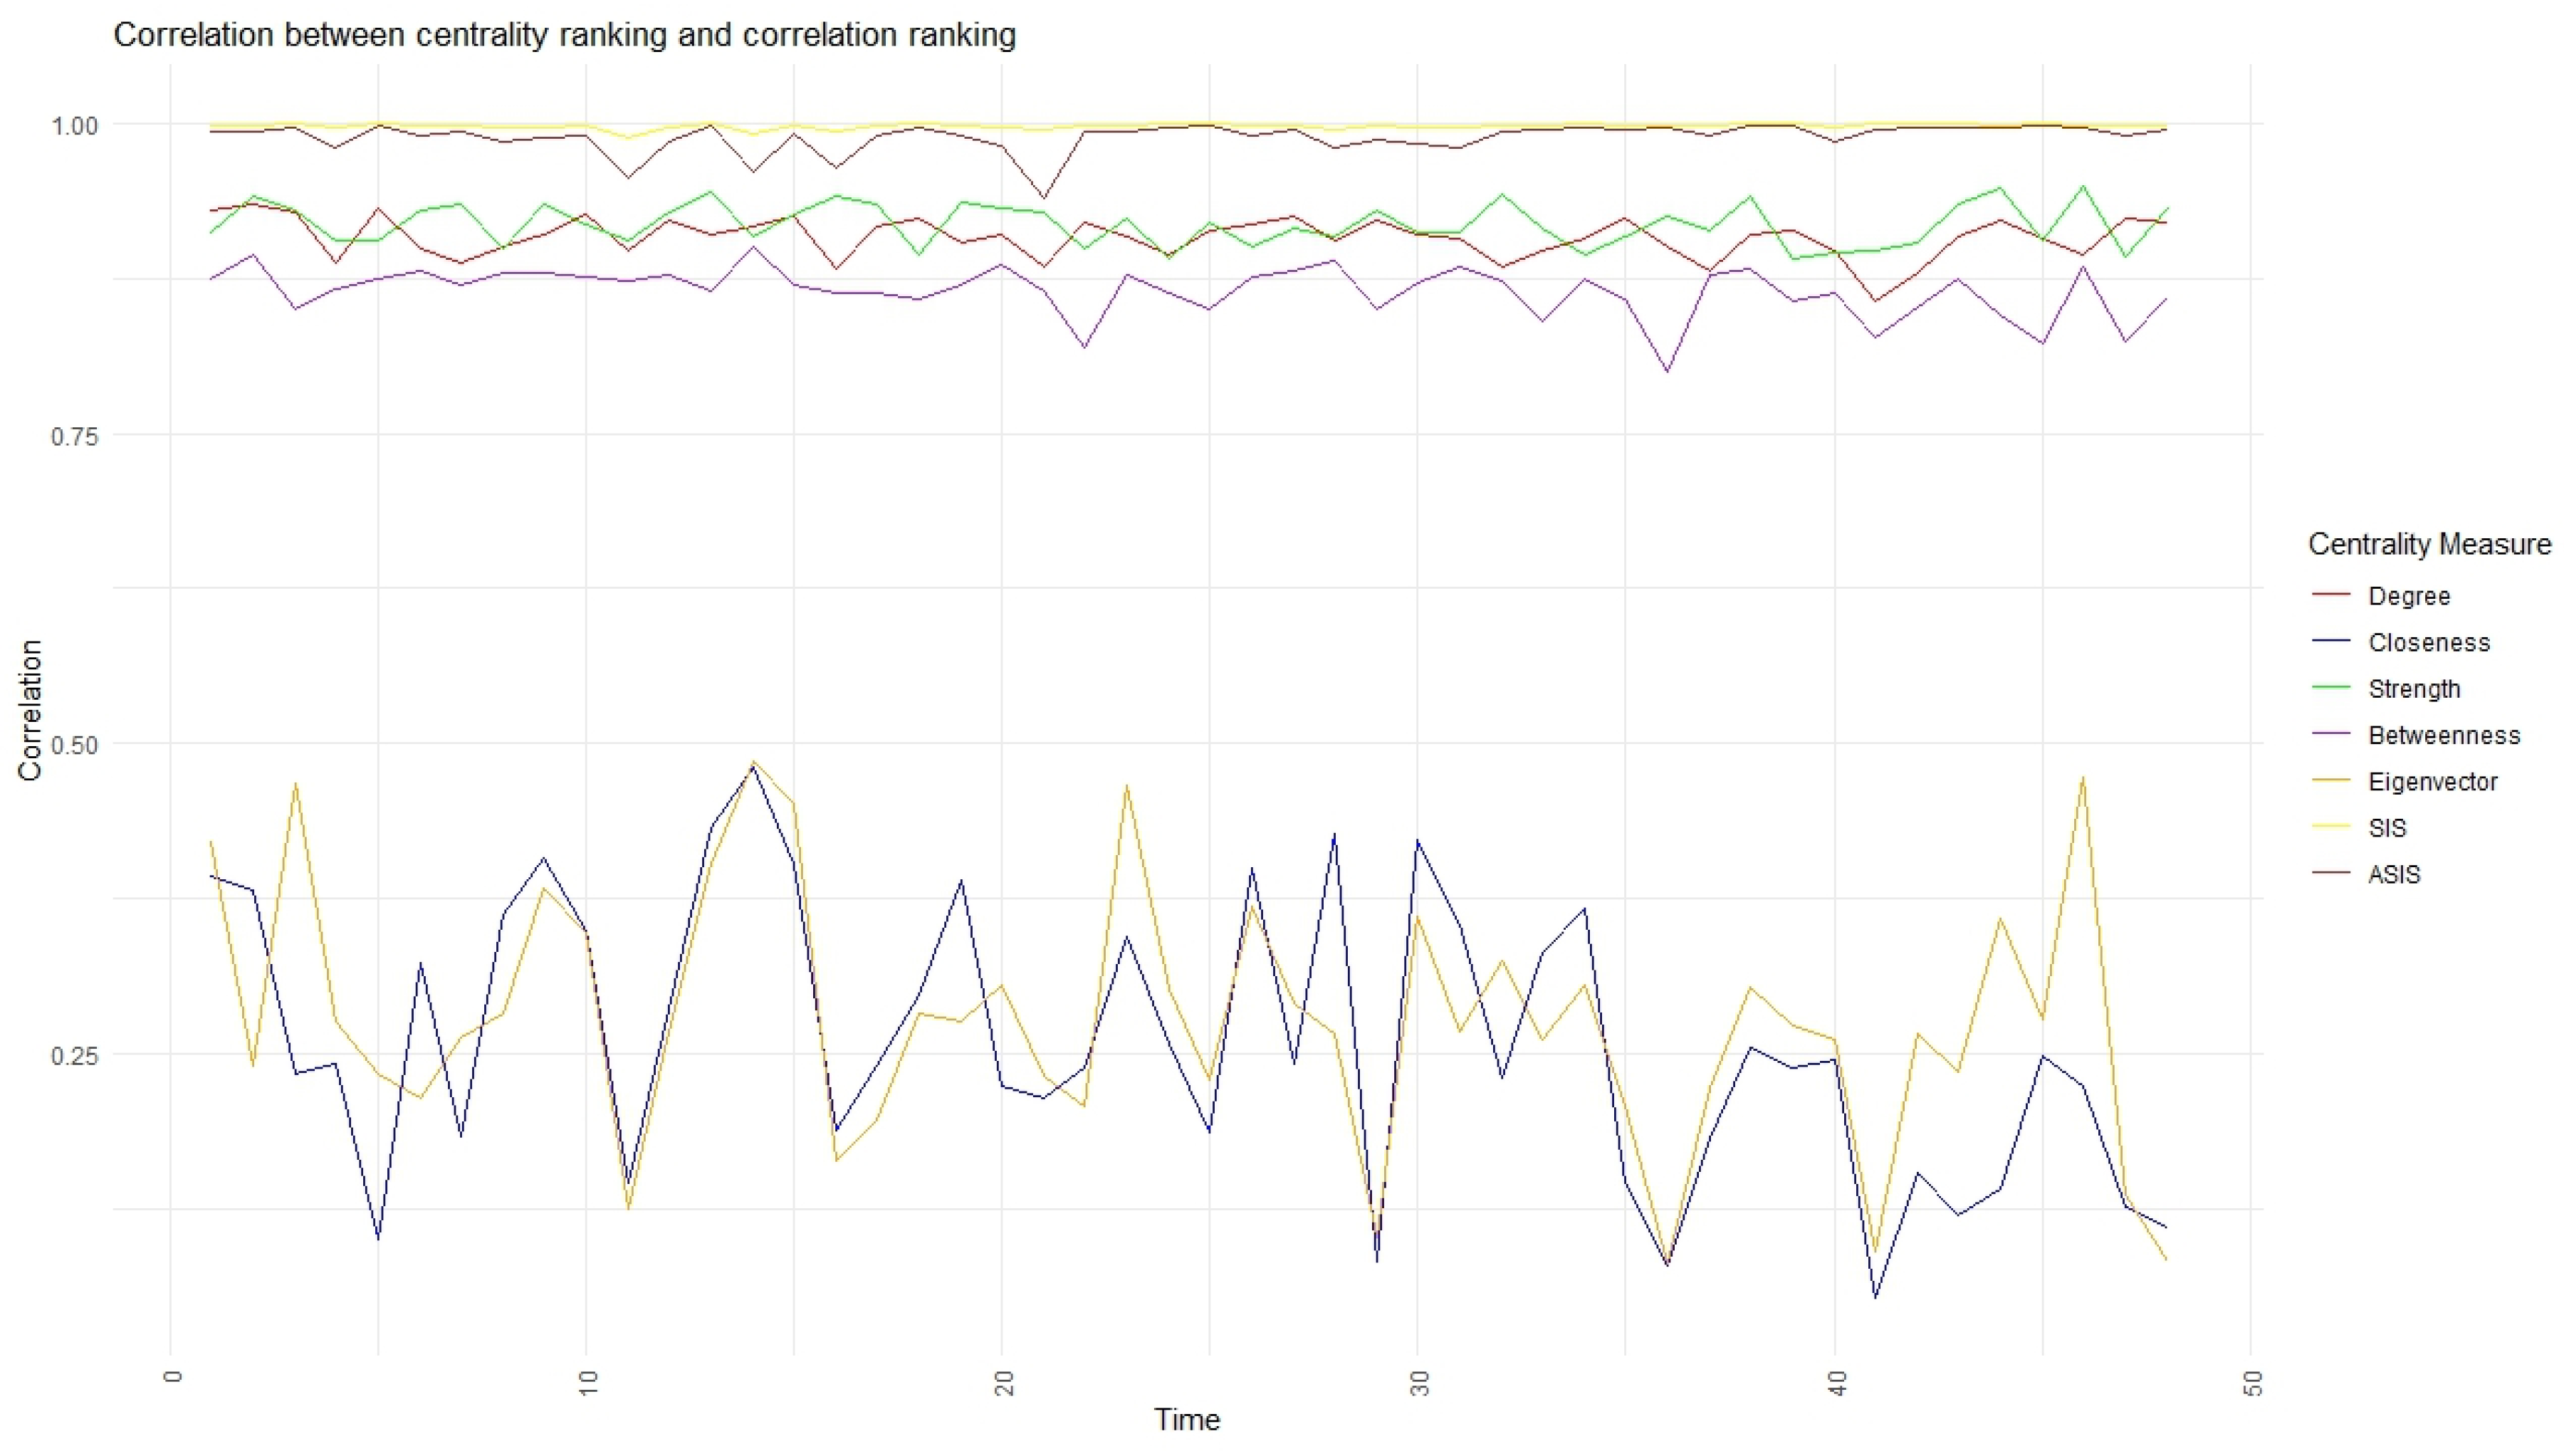
To comprehensively explore the characteristics of the alternative measures, we computed rank correlations between centrality scores and we introduced an additional ranking based on the average sample correlation between a node and all other nodes in the original graph. As depicted in Figure 7, we observe a strong correlation between betweenness and strength metrics with the ranking based on the average correlation. Also, the non-linear centrality metric shows a significant correlation with this ranking, with values exceeding 90%.
The analysis extends across multiple windows, and Figure 8 showcases the correlation between rankings based on centrality metrics and those based on sample correlation. Notably, the non-linear centralities exhibit robust performance in identifying highly correlated assets within networks, even during periods of heightened volatility and turmoil. Consequently, these measures emerge as promising alternatives for pinpointing central or diversifiable assets in optimal portfolio allocation strategies.
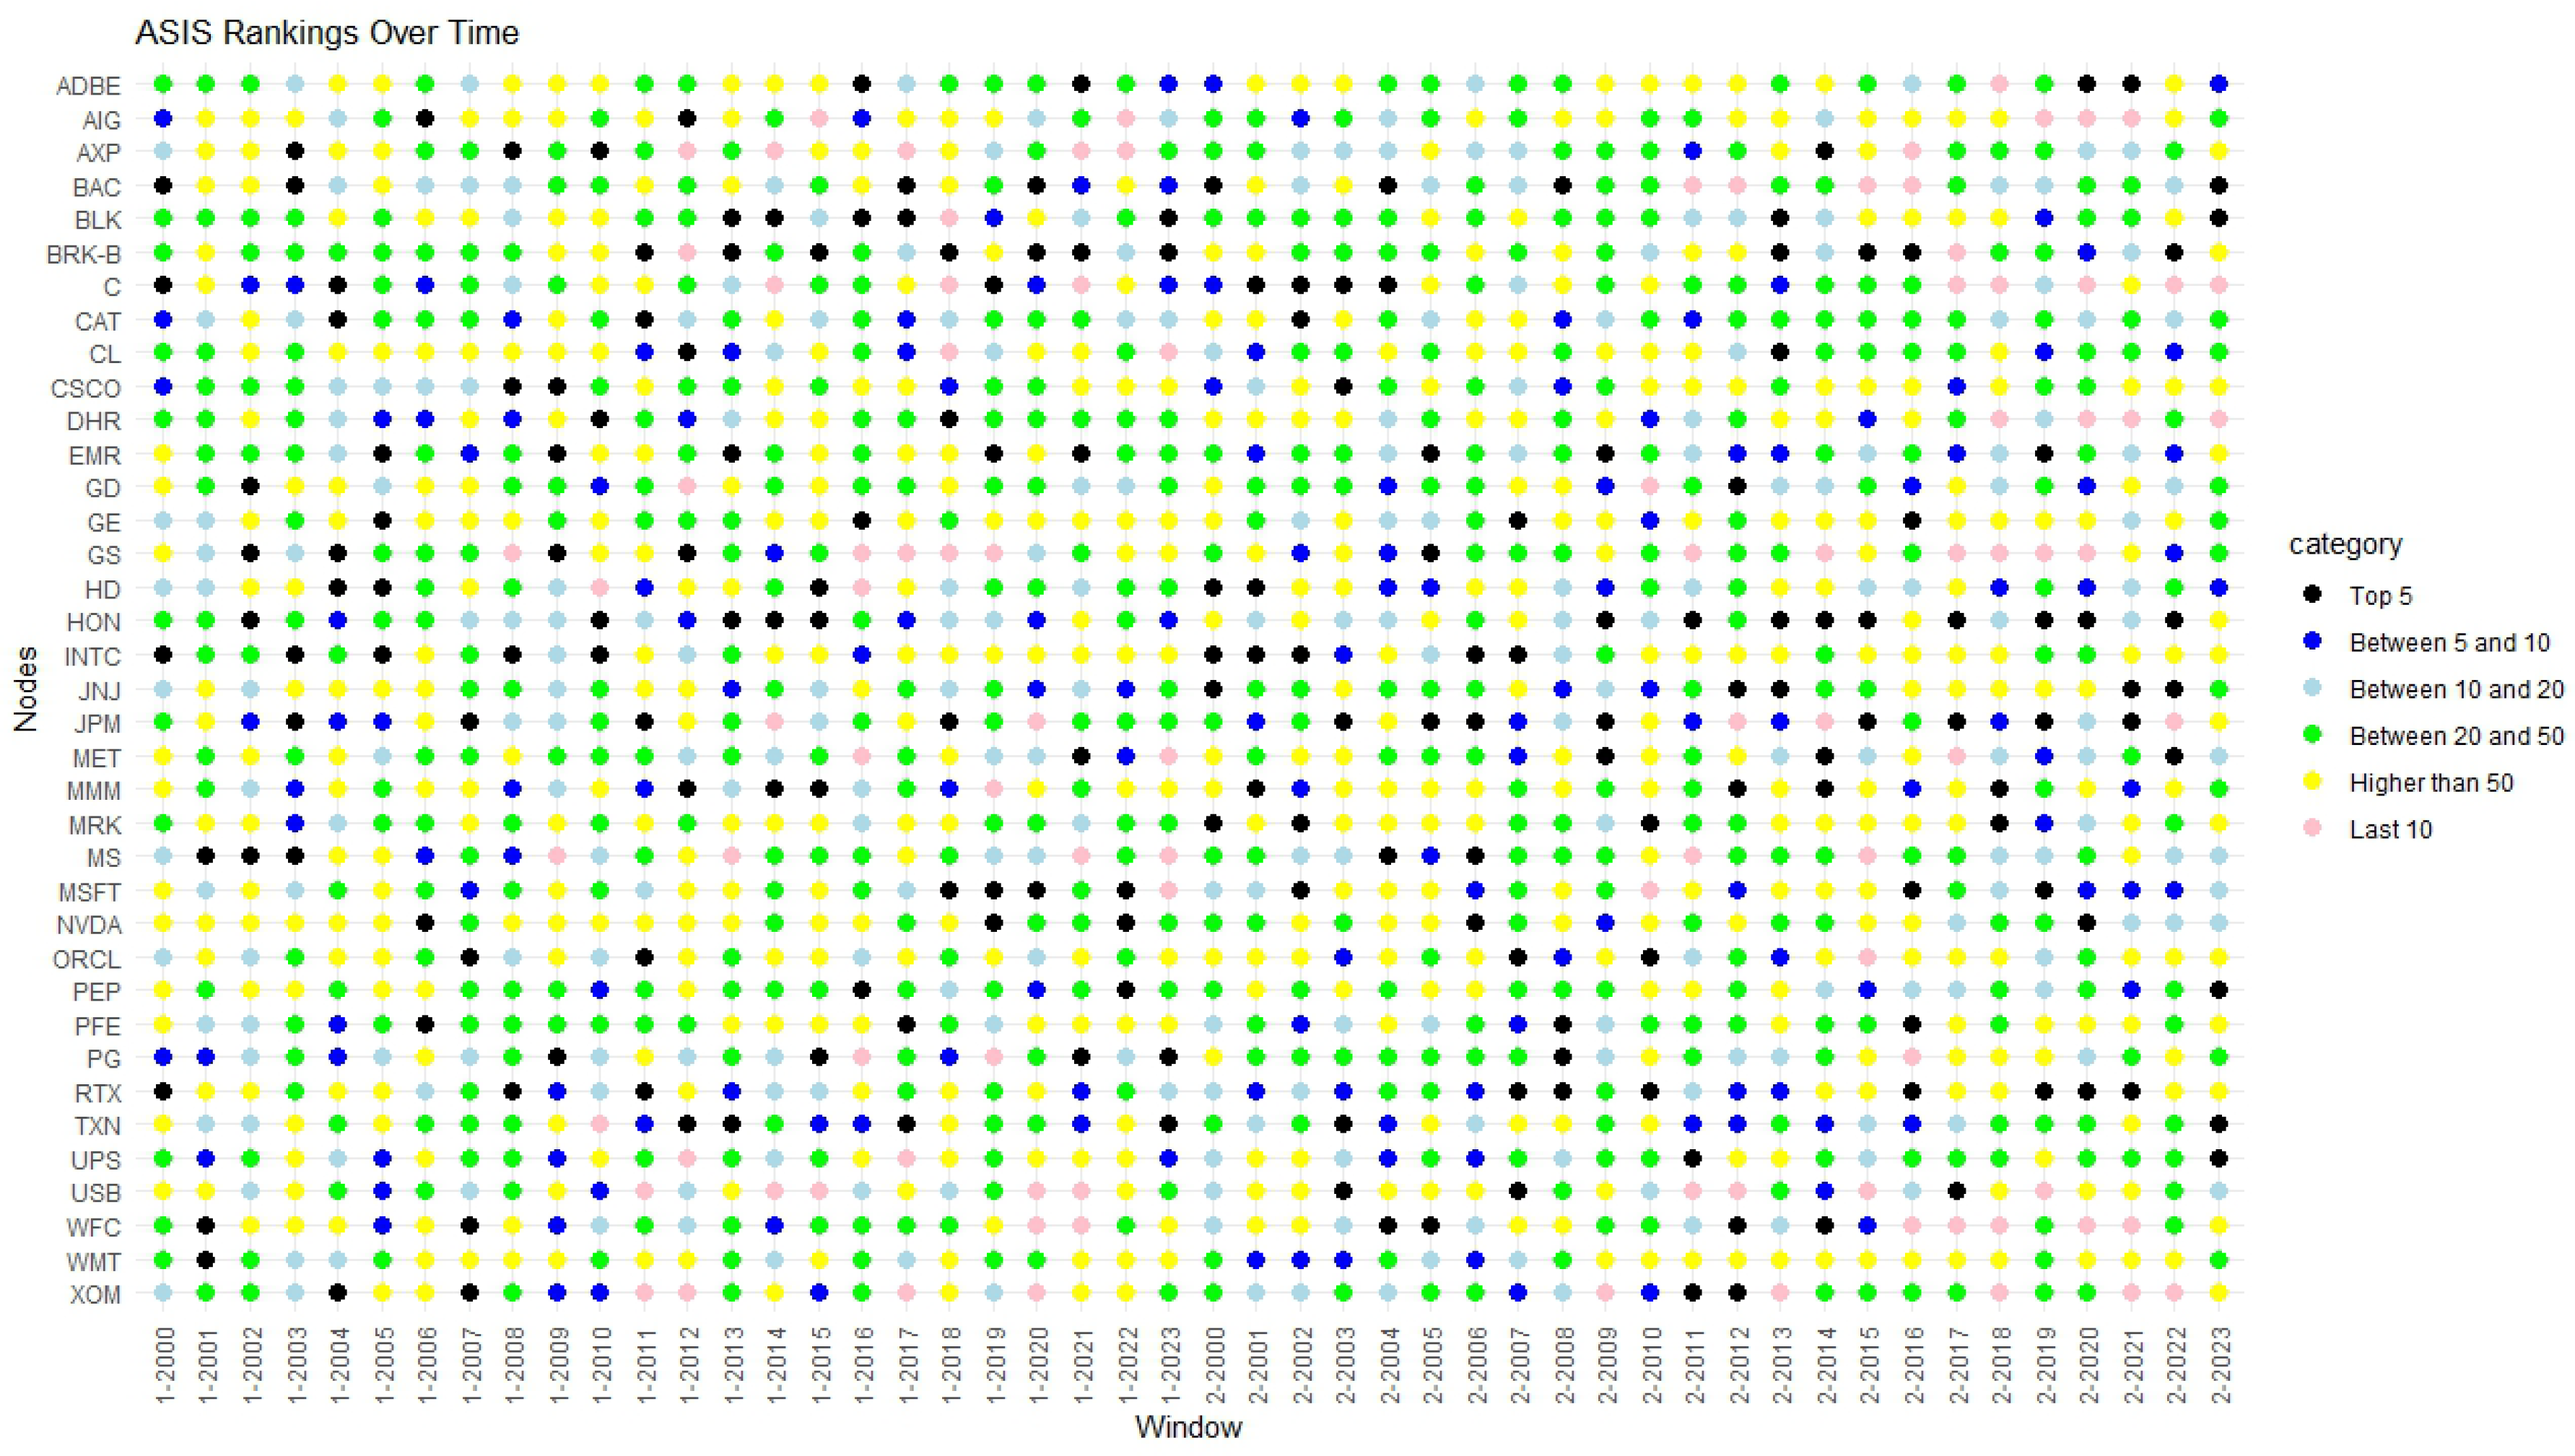
Numerous studies have underscored the significance of asset centrality in portfolio construction. For example, papers such as Clemente et al. (2021), Olmo (2021), and Peralta and Zareei (2016) highlight the pivotal role of asset centrality in asset selection. Figure 9 illustrates the temporal evolution of node rankings based on ASIS non-linear centrality. These findings can inform the selection of assets characterized by low centrality within the network, offering insights into portfolio diversification strategies. The relevance of centrality in risk management strategies and its financial implications cannot be overstated. Top centrality assets, due to their interconnectedness, pose a significant systemic risk as they can propagate financial distress more broadly throughout the network. Conversely, low-centrality assets are less likely to be impacted by such cascading failures, making them attractive candidates for portfolio diversification. By incorporating centrality measures into portfolio construction, investors can better manage risk and enhance portfolio resilience. From a financial perspective, this approach could facilitate the identification of stable investment opportunities, potentially leading to improved portfolio performance and reduced volatility.
The implications for financial regulation are equally significant. Regulators can use centrality-based analyses to monitor systemic risks within financial markets, identifying key nodes whose failure could trigger widespread disruptions. This can inform more targeted regulatory interventions aimed at enhancing market stability. In summary, the integration of centrality measures into financial analysis not only advances the theoretical understanding of financial networks but also provides practical tools for optimizing portfolio allocation, managing risk, and ensuring financial stability. This research underscores the critical importance of network-based approaches in modern finance and sets the stage for future advancements in the field.

6. Conclusions and Future Perspectives

Centrality measures hold a pivotal role in the literature of network theory, offering crucial insights into the structure, dynamics, and functionality of complex systems. By quantifying the relative importance or influence of nodes within a network, centrality measures provide a fundamental framework for understanding various real-world phenomena. Through centrality analysis, researchers can identify key actors, pathways, and vulnerabilities, facilitating targeted interventions, optimal resource allocation, and robust network design. Classical centrality measures are specifically concentrated on only one structural aspect of the network—i.e., nodes or links. In contrast, our proposal globally incorporates all structural neighbor elements at once. Moreover, it emerges as the outcome of a dynamic process taking place in the network. Indeed, the ASIS centrality measure proposed in this paper integrates peculiar characteristics of traditional indicators, taking into account the reciprocal interaction between nodes and edges in a dynamic setting. By employing a non-conservative diffusion model and a reinforcement factor, we designed a self-adaptive eigenvector centrality that reflects the complex interplay between network elements.
Numerical analyses, conducted on financial networks derived from the SP100 index returns, validate the efficacy of our approach. The proposed non-linear centrality indicators reliably identify highly correlated assets, offering valuable insights for portfolio allocation strategies. Indeed, by integrating these advanced centrality measures into financial analyses, investors and portfolio managers can enhance their decision-making processes. The ability to pinpoint highly correlated and central assets enables more precise diversification, potentially reducing portfolio risk and improving returns. Furthermore, regulators and policymakers can leverage these insights to monitor systemic risks more effectively, ensuring financial stability. The adaptability of our model to various market conditions also suggests its utility in dynamic and volatile financial environments, providing a robust tool for continuous risk assessment and strategic planning. In addition, our research could foster a more resilient financial ecosystem by equipping stakeholders with a suitable method for identifying riskier assets.
Ultimately, it is noteworthy that the centrality measure proposed in this paper is limited to the study of the interplay between nodes and edges of the same network, interpreted as two distinct graphs. However, it could be extended to general bipartite networks, assuming that the two coupled processes described above run on the two different projections. In this way, it may prove useful in the analysis of economic and financial networks of a broader nature, thus offering promising avenues for future research in portfolio optimization and risk management.
Author Contributions

Conceptualization, P.B., G.P.C. and R.G.; methodology, P.B., G.P.C. and R.G.; formal analysis, P.B., G.P.C. and R.G.; investigation, P.B., G.P.C. and R.G.; data curation, P.B., G.P.C. and R.G.; writing—original draft preparation, P.B., G.P.C. and R.G.; writing—review and editing, P.B., G.P.C. and R.G. All authors have read and agreed to the published version of the manuscript.

Funding

This research received no external funding.

Institutional Review Board Statement

Not applicable.

Informed Consent Statement

Not applicable.

Data Availability Statement

Assets returns used in this article have been downloaded from Yahoo finance.

Acknowledgments

The authors deeply thank the anonymous referees whose precise and insightful comments have allowed us to enhance the work. Gian Paolo Clemente acknowledges funding by the European Union—Next Generation EU. Project PRIN 2022 “Building resilience to emerging risks in financial and insurance markets”. Project code: 2022FWZ2CR—CUP J53D23004560008. Rosanna Grassi acknowledges financial support by the European Union—NextGenerationEU. Project PRIN 2022 “Networks: decomposition, clustering and community detection” code: 2022NAZ0365—CUP H53D23002510006. Rosanna Grassi and Paolo Bartesaghi are members of GNAMPA-INdAM. The views and opinions expressed are only those of the authors and do not necessarily reflect those of the European Union or the European Commission. Neither the European Union nor the European Commission can be held responsible for them.

Conflicts of Interest

The authors declare no conflict of interest.

Appendix A

Table A1. Stock Information.
TickerCompany NameSector
AAPLAppleInformation Technology
ABBVAbbVieHealth Care
ABTAbbott LaboratoriesHealth Care
ACNAccentureInformation Technology
ADBEAdobeInformation Technology
AIGAmerican International GroupFinancials
AMDAMDInformation Technology
AMGNAmgenHealth Care
AMTAmerican TowerReal Estate
AMZNAmazonConsumer Discretionary
AVGOBroadcomInformation Technology
AXPAmerican ExpressFinancials
BABoeingIndustrials
BACBank of AmericaFinancials
BKBNY MellonFinancials
BKNGBooking HoldingsConsumer Discretionary
BLKBlackRockFinancials
BMYBristol Myers SquibbHealth Care
BRK.BBerkshire Hathaway (Class B)Financials
CCitigroupFinancials
CATCaterpillarIndustrials
CHTRCharter CommunicationsCommunication Services
CLColgate-PalmoliveConsumer Staples
CMCSAComcastCommunication Services
COFCapital OneFinancials
COPConocoPhillipsEnergy
COSTCostcoConsumer Staples
CRMSalesforceInformation Technology
CSCOCiscoInformation Technology
CVSCVS HealthHealth Care
CVXChevronEnergy
DEDeere & CompanyIndustrials
DHRDanaherHealth Care
DISDisneyCommunication Services
DOWDowMaterials
DUKDuke EnergyUtilities
EMREmersonIndustrials
FFordConsumer Discretionary
FDXFedExIndustrials
GDGeneral DynamicsIndustrials
GEGE AerospaceIndustrials
GILDGileadHealth Care
GMGeneral MotorsConsumer Discretionary
GOOGAlphabet (Class C)Communication Services
GOOGLAlphabet (Class A)Communication Services
GSGoldman SachsFinancials
HDHome DepotConsumer Discretionary
HONHoneywellIndustrials
IBMIBMInformation Technology
INTCIntelInformation Technology
INTUIntuitInformation Technology
JNJJohnson & JohnsonHealth Care
JPMJPMorgan ChaseFinancials
KHCKraft HeinzConsumer Staples
KOCoca-ColaConsumer Staples
LINLindeMaterials
LLYLillyHealth Care
LMTLockheed MartinIndustrials
LOWLowe’sConsumer Discretionary
MAMastercardInformation Technology
MCDMcDonald’sConsumer Discretionary
MDLZMondelēz InternationalConsumer Staples
MDTMedtronicHealth Care
METMetLifeFinancials
METAMetaCommunication Services
MMM3MIndustrials
MOAltriaConsumer Staples
MRKMerckHealth Care
MSMorgan StanleyFinancials
MSFTMicrosoftInformation Technology
NEENextEra EnergyUtilities
NFLXNetflixCommunication Services
NKENikeConsumer Discretionary
NVDANvidiaInformation Technology
ORCLOracleInformation Technology
PEPPepsiCoConsumer Staples
PFEPfizerHealth Care
PGProcter & GambleConsumer Staples
PMPhilip Morris InternationalConsumer Staples
PYPLPayPalInformation Technology
QCOMQualcommInformation Technology
RTXRTX CorporationIndustrials
SBUXStarbucksConsumer Discretionary
SCHWCharles SchwabFinancials
SOSouthern CompanyUtilities
SPGSimon Property GroupReal Estate
TAT&TCommunication Services
TGTTargetConsumer Discretionary
TMOThermo Fisher ScientificHealth Care
TMUST-Mobile USCommunication Services
TSLATeslaConsumer Discretionary
TXNTexas InstrumentsInformation Technology
UNHUnitedHealth GroupHealth Care
UNPUnion PacificIndustrials
UPSUnited Parcel ServiceIndustrials
USBU.S. BankFinancials
VVisaInformation Technology
VZVerizonCommunication Services
WFCWells FargoFinancials
WMTWalmartConsumer Staples
XOMExxonMEnergy

Note

1
While this paper does not primarily aim to offer alternative estimations of the correlation matrix, it is worth noting that alternative approaches enhancing estimation for large samples have been proposed in the literature (for example, see Ledoit and Wolf 2003).

References

  1. Alamsyah, Andry, Dian Puteri Ramadhani, Farida Titik Kristanti, and Khairunnisa Khairunnisa. 2022. Transaction network structural shift under crisis: Macro and micro perspectives. Economies 10: 56. [Google Scholar] [CrossRef]
  2. Alkan, Serkan, Saffet Akdağ, and Andrew Adewale Alola. 2023. Evaluating the hierarchical contagion of economic policy uncertainty among the leading developed and developing economies. Economies 11: 201. [Google Scholar] [CrossRef]
  3. Bardoscia, Marco, Fabio Caccioli, Juan Ignacio Perotti, Giovanni Vivaldo, and Guido Caldarelli. 2016. Distress propagation in complex networks: The case of non-linear debtrank. PLoS ONE 11: e0163825. [Google Scholar] [CrossRef]
  4. Bartesaghi, Paolo, Gian Paolo Clemente, and Rosanna Grassi. 2024. A novel self-adaptive SIS model based on the mutual interaction between a graph and its line graph. Chaos: An Interdisciplinary Journal of Nonlinear Science 34: 023117. [Google Scholar] [CrossRef]
  5. Battiston, Stefano, Michelangelo Puliga, Rahul Kaushik, Paolo Tasca, and Guido Caldarelli. 2012. Debtrank: Too central to fail? financial networks, the fed and systemic risk. Scientific Reports 2: 541. [Google Scholar] [CrossRef]
  6. Bavelas, Alex. 1950. Communication patterns in task-oriented groups. Journal of the Acoustical Society of America 22: 725–30. [Google Scholar] [CrossRef]
  7. Belik, Ivan. 2022. Which centralities fit the best? network centralities’ ranking based on the f-measure. Cybernetics and Systems 54: 454–73. [Google Scholar] [CrossRef]
  8. Bloch, Francis, Matthew O. Jackson, and Pietro Tebaldi. 2023. Centrality measures in networks. Social Choice and Welfare 61: 413–53. [Google Scholar] [CrossRef]
  9. Bonacich, Phillip. 1972. Factoring and weighting approaches to status scores and clique identification. Journal of Mathematical Sociology 2: 113–20. [Google Scholar] [CrossRef]
  10. Borgatti, Stephen P. 2005. Centrality and network flow. Social Networks 27: 55–71. [Google Scholar] [CrossRef]
  11. Bowater, David, and Emmanuel Stefanakis. 2023. PageRank centrality with non-local random walk-based teleportation. Journal of Complex Networks 11: cnad024. [Google Scholar] [CrossRef]
  12. Brandes, Ulrik. 2001. A faster algorithm for betweenness centrality. Journal of Mathematical Sociology 25: 163–77. [Google Scholar] [CrossRef]
  13. Brandes, Ulrik, and Thomas Erlebach. 2005. Network Analysis. New York and Berlin/Heidelberg: Springer. [Google Scholar]
  14. Brin, Sergey, and Lawrence Page. 1998. The anatomy of a large-scale hypertextual web search engine. Computer Networks and ISDN Systems 30: 107–17. [Google Scholar] [CrossRef]
  15. Cao, Mengchuan, Dan Wu, Pengxuan Du, Ting Zhang, and Sina Ahmadi. 2024. Dynamic identification of important nodes in complex networks by considering local and global characteristics. Journal of Complex Networks 12: cnae015. [Google Scholar] [CrossRef]
  16. Chebotarev, Pavel. 2023. Selection of centrality measures using Self-consistency and Bridge axioms. Journal of Complex Networks 11: cnad035. [Google Scholar] [CrossRef]
  17. Clemente, Gian Paolo, Rosanna Grassi, and Asmerilda Hitaj. 2021. Asset allocation: New evidence through network approaches. Annals of Operations Research 299: 61–80. [Google Scholar] [CrossRef]
  18. Freeman, Linton C. 1977. A set of measures of centrality based on betweenness. Sociometry 40: 35–41. [Google Scholar] [CrossRef]
  19. Freeman, Linton C. 1978. Centrality in social networks conceptual clarification. Social Networks 1: 215–39. [Google Scholar] [CrossRef]
  20. Giglio, Ricardo, and Thomas Lux. 2021. The core of the global corporate network. Networks and Spatial Economics 21: 681–705. [Google Scholar] [CrossRef]
  21. Gkatzoglou, Fotios, Theophilos Papadimitriou, and Periklis Gogas. 2024. Fuel price networks in the eu. Economies 12: 102. [Google Scholar] [CrossRef]
  22. Gross, Jonathan L., Jay Yellen, and Ping Zhang. 2013. Handbook of Graph Theory, 2nd. ed. Boca Raton: CRC Press. [Google Scholar]
  23. Harary, Frank. 1969. Graph Theory. Reading: Addison-Wesley. [Google Scholar]
  24. Horn, Roger A., and Charles R. Johnson. 1985. Matrix Analysis. Cambridge: Cambridge University Press. [Google Scholar]
  25. Kukreti, Vishwas, Hirdesh K. Pharasi, Priya Gupta, and Sunil Kumar. 2020. A perspective on correlation-based financial networks and entropy measures. Frontiers in Physics 8: 323. [Google Scholar] [CrossRef]
  26. Ledoit, Olivier, and Michael Wolf. 2003. Improved estimation of the covariance matrix of stock returns with an application to portfolio selection. Journal of Empirical Finance 10: 603–21. [Google Scholar] [CrossRef]
  27. Mantegna, Rosario N. 1999. Hierarchical structure in financial markets. The European Physical Journal B—Condensed Matter and Complex Systems 11: 193–97. [Google Scholar] [CrossRef]
  28. Masuda, Naoki, Zachary M. Boyd, Diego Garlaschelli, and Peter J. Mucha. 2023. Correlation networks: Interdisciplinary approaches beyond thresholding. arXiv arXiv:2311.09536. [Google Scholar]
  29. Olmo, Jose. 2021. Optimal portfolio allocation and asset centrality revisited. Quantitative Finance 21: 1475–90. [Google Scholar] [CrossRef]
  30. Onnela, Jukka-Pekka, Anirban Chakraborti, Kimmo Kaski, Janos Kertesz, and Antti Kanto. 2003. Asset trees and asset graphs in financial markets. Physica Scripta 2003: 48. [Google Scholar] [CrossRef]
  31. Page, Lawrence, Sergey Brin, Rajeev Motwani, and Terry Winograd. 1999. The pagerank citation ranking: Bringing order to the web. Paper presented at 7th International World Wide Web Conference, Brisbane, Australia, April 14–18. [Google Scholar]
  32. Peralta, Gustavo, and Abalfazl Zareei. 2016. A network approach to portfolio selection. Journal of Empirical Finance 38: 157–80. [Google Scholar] [CrossRef]
  33. Raddant, Matthias, and Tiziana Di Matteo. 2023. A look at financial dependencies by means of econophysics and financial economics. Journal of Economic Interaction and Coordination 18: 701–34. [Google Scholar] [CrossRef]
  34. Rajeh, Stephany, Marinette Savonnet, Eric Leclercq, and Hocine Cherifi. 2021. Characterizing the interactions between classical and community-aware centrality measures in complex networks. Scientific Reports 11: 10088. [Google Scholar] [CrossRef]
  35. Raj, Udit, and Sudeepto Bhattacharya. 2023. Some generalized centralities in higher-order networks represented by simplicial complexes. Journal of Complex Networks 11: cnad032. [Google Scholar] [CrossRef]
  36. Sabidussi, Gert. 1966. The centrality index of a graph. Psychometrika 31: 581–603. [Google Scholar] [CrossRef] [PubMed]
  37. Scott, John. 1991. Social Network Analysis: A Handbook. Thousand Oaks: Sage Publications, Inc. [Google Scholar]
  38. Strielkowski, Wadim, Svetlana Kalyugina, Victor Fursov, and Oxana Mukhoryanova. 2023. Improving the system of indicators for assessing the effectiveness of modern regional innovation systems. Economies 11: 228. [Google Scholar] [CrossRef]
  39. Takes, Frank W., and Eelke M. Heemskerk. 2016. Centrality in the global network of corporate control. Social Network Analysis and Mining 6: 97. [Google Scholar] [CrossRef]
  40. Tosyali, Ali, Jeongsub Choi, Byunghoon Kim, Hoshin Lee, and Myong K. Jeong. 2021. A dynamic graph-based approach to ranking firms for identifying key players using inter-firm transactions. Annals of Operations Research 303: 5–27. [Google Scholar] [CrossRef]
  41. Tudisco, Francesco, and Desmond J. Higham. 2021. Node and edge nonlinear eigenvector centrality for hypergraphs. Communications Physics 4: 201. [Google Scholar] [CrossRef]
  42. Wasserman, Stanley, and Katherine Faust. 1994. Social Network Analysis: Methods and Applications. Cambridge: Cambridge University Press. [Google Scholar] [CrossRef]
Figure 1. Boxplots of the distributions of returns’ correlations in different windows.
Economies 12 00164 g001
Figure 2. Density functions of distances in different windows.
Economies 12 00164 g002
Figure 3. Minimum spanning tree in four different windows. The thickness of the edges’ weights is proportional to the inverse of the distance.
Economies 12 00164 g003
Figure 4. (a) Comparison between distributions based on degree and strength in the first window (first semester 2000) and (b) correlation and rank correlation between degree and strength over time.
Economies 12 00164 g004
Figure 5. The analytical framework of this study.
Economies 12 00164 g005
Figure 6. MSTs derived from returns during the period of January–June 2000. Each plot showcases nodes whose size and color are determined by their ranking according to a specific centrality metric. Nodes with higher centrality scores are depicted as larger in size and tend toward a lighter color (from red to white). The depicted centrality metrics are degree, closeness, betweenness, eigenvector, as well as non-linear SIS and ASIS centralities. The edge color is proportional to the weight.
Economies 12 00164 g006aEconomies 12 00164 g006b
Figure 7. Correlations among rankings based on alternative centrality measures or the average correlation of a node with other nodes in the network.
Economies 12 00164 g007
Figure 8. Correlations over time among rankings based on alternative centrality measures or the average correlation of a node with other nodes in the network.
Economies 12 00164 g008
Figure 9. Ranking of nodes based on ASIS non-linear centrality only for nodes that belong at least five times to the top 10.
Economies 12 00164 g009
Disclaimer/Publisher’s Note: The statements, opinions and data contained in all publications are solely those of the individual author(s) and contributor(s) and not of MDPI and/or the editor(s). MDPI and/or the editor(s) disclaim responsibility for any injury to people or property resulting from any ideas, methods, instructions or products referred to in the content.