1. Introduction
Exchange Traded Funds, or ETFs, are an innovative way to invest in several real economy sectors, whether related to commodities, industrial production, or services. They are financial instruments that facilitate and expand investor access, allowing flexibility in asset diversification that would be practically impossible to obtain if they did not exist. These products have been developed since 1993. They emerged in the USA with the code or ticker SPY (Spider), created to track the S&P 500, the main index of the American stock market. In the USA, this investment vehicle has already been a part of a developed market for over 30 years.
ETFs, also called index funds, are growing in importance in global markets as they allow small investors to enter markets that would previously only be accessible through the wholesale market. It generates advantages for these small and medium investors, being an investment alternative for those who want to diversify or leverage their portfolio, both in asset classes and geographic terms. ETFs have experienced double-digit asset growth under management (
Filippou et al. 2024). According to the
Investment Company Institute (
2024), ETF assets have increased by USD 2.83 trillion, or 39.7 percent, since September 2023. The surge in popularity might be ascribed to the perception that these are financial instruments and the most effective means of making diversified forms of investments (
Tucci 2024).
These types of assets allow investors to diversify their portfolios and achieve various goals based on their investing profile. That is precisely why the advantages of ETFs stand out. In particular, this strategy is especially welcome for new investors, who generally do not have accumulated experience and knowledge in the financial sector. As for volatility, these assets are slightly less volatile than most stocks, even with a wide range of ETFs. Thus, understanding the interconnection between markets and their volatility dynamics is essential to developing investment and risk management strategies that are informed and adaptable to evolving scenarios (
Watkins and McAleer 2008).
Precious metal ETFs, in particular, are often sought after during economic instability for their resilience, providing investors with a means to hedge against market downturns and inflation. Specifically, this research aims to identify the direction, intensity, and clustering of volatility transmissions among the primary NYSE mineral ETFs, providing their interdependence and role as hedging instruments. Daily series of closing prices of ETFs for platinum, silver, copper, lead, nickel, gold, and a diversified basket of precious metals from 2019 to 2023 are considered to calculate the
Diebold and Yilmaz (
2012) spillover index and, subsequently, the metrics of complex networks that show the intensity of the interrelationships and the clustering of this market. The period from 2019 to 2023 was selected to encompass pre-pandemic, pandemic, and post-pandemic phases, providing a comprehensive view of volatility behavior across economic cycles. The findings suggest the significance of precious metals as both industrial commodities and secure investment options during periods of economic instability.
This work innovates in several aspects. First, this is the first empirical study that applies Diebold–Yilmaz Indices to the dataset for the seven primary NYSE mineral ETFs. Second, it contributes significantly to the industry by offering volatility measurements for the years before, during, and following the COVID-19 epidemic. Additionally, applying robust, complex network methods examines the intensity of the spillover effects between the various mineral markets. We believe that our results can be helpful to various agents that directly or indirectly participate in the metal commodity market, such as the mineral extraction, metallurgical, steel, and metal goods industries, mineral demanders, metal commodity derivatives traders, companies related to the mineral sector, whether ferrous, non-ferrous, or precious, and market regulators.
In addition to this introduction, this paper has four more sections. The
Section 2 briefly reviews the literature, and the
Section 3 explains the data and methodologies considered.
Section 4 presents and discusses the results; finally,
Section 5 concludes.
2. Literature Review
2.1. About ETFs and Metallic Assets
Recent financial transformations linked to financial globalization in recent decades have brought greater complexity and inherent risks to the world of finance. The interconnection between financial institutions, assets, and markets has been the subject of study with increasingly improved methods (
Li et al. 2020). Financial markets are highly complex systems in which participants face unequal access challenges and variable information quality. Decisions are not always strictly rational and occur at different market layers. The aggregate impact of these decisions is significant on the economy (
Tang et al. 2019).
Fluctuations in asset prices are interconnected and strongly correlate with the real economy sectors to which they are linked. It can be understood as a network in which assets are represented as nodes, and their connections, called links or edges, reflect the volatility relationships between them. We assessed the degree of significance of these volatility connections (
Tse et al. 2010).
ETFs are suitable for hedging inevitable fluctuations in asset prices and changes in macro- and microeconomic variables. It has already been exemplified in the American market, where ETFs impact the liquidity of underlying portfolios, especially in times of tension or increased uncertainty. It could lead us to assume that this financial product is already used as one of the main investment options. Moreover, hedges potentially influence portfolios managed individually by individuals or investment fund managers (
Itzhak et al. 2017).
Tessmann et al. (
2024a) evaluated the volatility transmissions that occurred (inter and intra) regarding metals and energy commodities from October 1998 to October 2018, and their results showed that total connectivity was 53%. In addition, through network analysis, they showed that the largest interactions involved the oil/nickel and gold/silver binomials. The paper confirmed the findings of
Arouri et al. (
2013), who argued that most precious metals can be a good hedge option in stock portfolios and other assets. It is especially true when there is increased economic uncertainty caused by crises or shocks in international financial markets, and these results also confirm the conclusion of
Papenfuß et al. (
2021).
Papenfuß et al. (
2021) individually forecasted 26 metal prices one month in advance and outperformed a predefined benchmark model, a (biased) random walk, in 18 cases. Their forecasts were based on many potential predictors for mineral commodities. This set was obtained from other studies that considered only a selection of attributes and applied them to forecast specific commodities or commodity indices. They preselected the most important individual commodity-specific factors through a correlation analysis and a regression selection based on Bayesian BIC information criteria.
These authors arrived at out-of-sample, one-month-ahead forecast results showing significant outperformance for 18 of the 26 commodities considered, emphasizing the minor metals sector. The differences in predictability between the metal groups were considerable, given that the authors predicted 13 of the 17 minor metals and five of the six industrial metals but no precious metals. It is evidence of the heterogeneity in metal commodity markets. They also showed that, among the influential factors, the value factor had a dominant and highly significant negative effect on price prediction and determination.
Chiale et al. (
2017) investigated the correlation in commodity returns at the international level. They analyzed a broad set of global market commodities, using a dynamic factor model with a block structure to decompose each commodity price series into a global component and specific block components related to specific commodity markets. In addition, they identified the phenomenon called idiosyncratic shock. This term refers to specific changes or events that affect an individual commodity or market in isolation without necessarily influencing other markets or commodities.
Various factors, such as extreme weather conditions, unexpected political events, or region-specific production problems, can cause such shocks. In short, while global shocks affect all markets broadly, idiosyncratic shocks have a more localized and specific impact. The authors concluded that despite these idiosyncratic shocks, a single global factor influences most variations in commodity prices: the major booms and busts of the international economic cycle (
Chiale et al. 2017).
Considering the impact of different indicators and news on minerals,
Rohan et al. (
2000) provide a detailed analysis of how different items of macroeconomic news impact gold and silver prices, explaining variations in the influences of specific indicators. The research demonstrated empirically that macroeconomic indicators, such as unemployment data, affect gold and silver prices, indicating a shared sensitivity between these metals to volatility associated with economic factors.
In addition, the work revealed that other indicators, such as Gross Domestic Product (GDP) and interest rates, exert different influences on gold and silver, providing a more precise understanding of how different macroeconomic news can shape the prices of these precious metals. Contextualizing these results to the mineral market, especially considering commodities such as those studied in this work, suggests that the varied impact of macroeconomic indicators is not limited to gold and silver alone. This analysis can be linked to countries with similar mineral markets, where different economic indicators can influence commodity price volatility in specific ways.
According to the research conducted by
Watkins and McAleer (
2008), the idea drawn is that over the period analyzed, there was a substantial change in the volatility of metals markets. The transformations in volatility patterns reflect the complex interaction between global events, changes in demand, and economic shocks. The work highlights that price fluctuations in precious metals markets were influenced by intrinsic factors and exogenous elements that affect the world economy.
Regarding the use of metal ETFs to protect an investment portfolio,
Conover et al. (
2009) provide a comprehensive analysis of the role of precious metals in optimizing investment portfolios. Their contributions directly affect the minerals market, offering relevant insights to improve investment strategies in this sector. The contributions highlighted by the author include that diversification is improved with the inclusion of precious metals such as gold and silver in portfolios, reducing overall risk and protecting against adverse fluctuations in financial markets.
As we know, and as quantified by
de Oliveira Passos et al. (
2022),
Harry Markowitz’s seminal article (
1952) is among the most influential in finance and asset allocation. Markowitz introduced Modern Portfolio Theory, which establishes the basis for asset diversification aimed at maximizing risk-adjusted returns. This article is essential to understanding efficient asset allocation, as it demonstrates how it is possible to build a portfolio that minimizes risk for a given level of expected return through diversification among assets that are not perfectly correlated with each other.
To the extent that
Markowitz (
1952) argued that by combining assets that are not perfectly correlated, an investor could obtain a portfolio with lower risk than the weighted average of the risks of the individual assets, we consider that metal ETFs, especially precious metals, meet the criteria well for protecting an investment portfolio in critical times. These assets are generally uncorrelated with stocks in many economic sectors, such as government bonds, commodity derivatives, and other investments. We believe that this is empirical evidence that supports Markowitz’s thesis.
In addition, precious metals, especially gold, can hedge against inflationary pressures, preserving their value in periods of inflation. This active participation in global geopolitical and economic events becomes a haven in scenarios of uncertainty. Their varied correlations with other assets, such as stocks and bonds, can offer portfolio diversification and risk reduction benefits. The strategic allocation of precious metals, considering their specific characteristics, can optimize the risk–return relationship of a portfolio. Thus, the findings of the study by
Conover et al. (
2009) provide valuable guidance on the positive impact of including precious metals in portfolios, with direct implications for the minerals market and its various commodities.
Arouri et al. (
2013) conducted a study to assess the efficiency of new energy and precious metals markets over the past decades. They investigated short-term and long-term efficiency using different statistical models. The results indicated that futures prices are related to spot prices but are not good predictors of future prices. Furthermore, the work showed that market risk is not constant over time. The authors also found that futures prices are inefficient in the short term, suggesting that past behavior of future prices can help predict future spot prices.
A nonlinear model demonstrated that markets could operate in different efficiency regimes over time. The results suggest market participants can use past information about future prices to develop profitable strategies. It is especially relevant because trained commodity markets are not fully efficient. Therefore, it is important to understand how to allocate resources and self-protect against investment risks in these commodities. The authors also suggest that precious metals can be good hedging options in investment portfolios, especially during financial crises and periods of greater uncertainty in international markets, highlighting the importance of considering these assets when building and managing investment portfolios.
2.2. Asset Allocation, Diversification, and the Main Indexes and Indicators of Metal ETFs
Asset allocation is a fundamental strategy in finance aimed at optimizing risk-adjusted returns by distributing investments across different asset classes. This approach, widely applied by institutional and individual investors, aims to balance risk and return, adjusting to the investor’s profile and market conditions.
Diversification is a crucial technique within asset allocation, the objective of which is to mitigate unsystematic (or specific) risk by including assets that are not perfectly correlated with each other. Studies show that a diversified portfolio tends to present lower volatility and greater resilience in periods of financial crisis.
Markowitz (
1952), when developing modern portfolio theory, was one of the pioneers in mathematically formalizing the benefits of diversification, showing that combining assets with different correlations reduces total risk without sacrificing expected returns.
Since then, new research has explored more advanced forms of allocation and diversification. For example,
Black and Litterman (
1992) introduced a model that combines Markowitz’s mean-variance model with the investor’s subjective opinion, allowing for more refined adjustments to the portfolio. More recent studies, such as those by
DeMiguel et al. (
2009), highlight that more straightforward strategies, such as equal allocation (1/N), can, in some situations, outperform optimized models in terms of risk-adjusted performance.
Metal exchange-traded Funds (ETFs), especially those focused on gold, silver, platinum, and other precious metals, are increasingly popular instruments for portfolio diversification. They offer direct exposure to the price of metals, often without the challenges associated with physical storage. It makes them an efficient option for investors who want to protect themselves against inflation and stock market volatility. Metal ETFs can act as a hedge during a financial crisis since the prices of assets such as gold tend to appreciate in times of economic uncertainty.
Some studies that highlight the importance of metal ETFs include (i)
Baur and Lucey (
2010) and
Baur and McDermott (
2010), who have shown that gold acts as a hedge against stock market shocks and is considered a “safe haven” during financial crises; (ii)
Ratner and Klein (
2019), who explored the use of precious metal ETFs as a mechanism to reduce portfolio volatility, demonstrating that the inclusion of these assets can improve the Sharpe ratio of a diversified portfolio; and (iii)
Sharma et al. (
2022), who analyzed the relationship between precious metals allocation and equity market volatility, suggesting that metal ETFs can improve the efficiency of the portfolio frontier.
Finally, the metrics most commonly used to assess the performance of metal ETFs are worth mentioning. In this sense, some of the main indexes and indicators used include:
Sharpe ratio: used to assess the risk-adjusted return of an ETF.
Tracking error: measures the difference between the return of the ETF and that of its reference index.
Sortino ratio: similar to the Sharpe ratio but focuses only on negative deviations and is more suitable for assessing assets that serve as hedges.
Beta: measures the sensitivity of the ETF concerning the general market, helping to assess whether the metal ETF is truly an effective diversifier.
Indeed, given that we do not use any of these metrics in this paper and, on the contrary, combine more recent econometric and complex network statistics approaches, we believe this work contributes some originality by approaching the connectivity of this market differently from these traditional metrics.
4. Results
The Diebold–Yilmaz spillover index ranges from zero to one hundred. Therefore, the results can be interpreted as percentages.
Table 1 explains the total market connectivity: how much volatility each asset transmits to the market, how much each asset receives from the market, and the relationship between each pair of assets.
In
Table 1, for example, the cell defined by column 3 and row 8 displays how much volatility the ETF GLD, linked to gold, transmits to the ETF JJN, related to nickel. This value is 0.63%. In cell 1 and line 3, we can see how much volatility the DBP ETF, a basket of precious minerals, transmits to the CPER, which is the Copper ETF with 3.82%. The “To” row denotes how much each of the ETFs listed in the columns transmits in volatility to the market as a whole, while the “From” column presents how much each ETF in the rows receives in volatility from the market as a whole. The intersection cell between both shows the total connectivity of the market.
Figure 1 shows the total connectivity of ETFs in the analyzed period.
The results in
Table 1 and
Figure 1 show that the commodities market is volatile in cycles; there are moments of greater and lesser volatility. Therefore, in the period analyzed, we see significant volatility during the pandemic (early 2020 to mid-2022). Moreover, we also saw movements to seek hedges in precious metals, increasing the prices of precious metal ETFs (DBP, GLD, and SLV in particular).
These points mentioned by
Chiale et al. (
2017) can be confirmed. They state that the global demand factor affects most fluctuations in commodity prices. It is evident in
Figure 1 due to the high volume of price changes and isolated peaks, which, as this study tells us, may be idiosyncratic shocks. However, none of these changes are the basis of the results of the model developed here. Regarding the considerations on certain shocks in
Figure 1, some results from
Rohan et al. (
2000) are confirmed, as relevant news and macroeconomic indicators have changed commodity prices since then, throughout this most recent period from 2020 to 2023.
The impactful news of the COVID-19 pandemic caused shocks in the prices of several variable-income assets and even the most traditional fixed-income assets. Several peculiar shocks illustrated in
Figure 1 are related to the disclosure of some of the information above, from the discovery of a vaccine for COVID-19 to the injection of money from the Chinese government to boost the silver ore trade.
Figure 2 and
Figure 3 show the volatility that each ETF transmits to the others and similarly receives.
The results show us that the findings of
Conover et al. (
2009) can be empirically verified in some of the examples above. In the case of
Figure 2, the metals considered precious, gold (GLD), platinum (PPLT), and silver (SLV), had a notable transmission to other ETFs. However, analyzing the case in
Figure 3, where each received from the market, the three assets maintain, in a certain way, low volatility, without presenting the aforementioned idiosyncratic shocks as in the L.D. and JJN figures, for example.
Thus, this corroborates the analyses that state that ETFs can function as forms of protection in periods of greater volatility, as long as we stick to commodities classified as more precious, as they do not suffer as much interference and volatility from the market. Continuing with the network analysis, we will only focus on the weighted degree, the sum of the in-degree and out-degree. When combined with PageRank™, this measure summarizes the prestige of support and influence of the asset on the network, as presented in
Table 2.
Table 2 presents the weighted degrees (entry, exit, and the sum of both, the average weighted degree), the PageRank™, and the ETFs’ modularity classes (cluster analysis). According to
Kim et al. (
2016), finding a significant correlation between the PageRank™ and weighted ranks in targeted and weighted networks is common. This correlation is considered desirable, as the two measures complement each other. Our results corroborate this relationship, demonstrating consistency with the conclusions above.
Initially, it is worth mentioning that the network created is a weighted and complete n-partite digraph. In other words, it is a graph whose vertices can be divided into two disjoint sets, U and V, so every edge connects a vertex in U to a vertex in V; U and V are independent sets. The degrees of the vertices are identical and equal to 6; that is, each of the seven vertices receives six directed edges and sends another 6 to the remaining six vertices. Thus, saying that the network is a digraph means it is directed and weighted. In this complex network model, each node (or vertex) has heavy edges for all the others except for itself.
The weights we use to weigh the edges are the values of the Diebold–Yilmaz spillover indices. They measure the strength of volatility transmission between the nodes, which are the ETFs. The weighted in- and out-degrees, which express the “weight” of the edges received and sent by each vertex, are added together and generate the weighted degree measure.
Thus, the ETFs that send the most volatility to others (highest exit degrees) are, in descending order: DBP (precious metals—diversified basket), GLD (gold), SLV (silver), PPLT (platinum), CPER (copper), L.D. (lead), and JJN (nickel). Furthermore, the ETFs that receive higher levels of volatility (higher degrees of entry) are, in descending order, the same as the previous ranking. Because the average weighted degrees represent the sum of the outgoing and incoming weighted degrees and the rankings of these degrees are identical, the ranking of the average weighted degrees is also the same as the other two. That is, we have, with absolute certainty, the representation in descending order of the ETFs most representative of the network of volatility effects described in
Figure 4.
Concerning modularity Q (modularity class), assets marked with a value of 1 are part of a group (cluster or community), and those with a value of 0 are part of another. It is noted that group 1 is made up of practically the same four most representative assets of the described ranking: DBP (precious metals—diversified basket), GLD (gold), SLV (silver), and PPLT (platinum). This cluster 1 can, therefore, be called the main cluster of the network or cluster of precious metals.
The other assets, numbered with the value zero, make up the second group of ETFs with lower degrees of centrality in the network and are cited as being the last three in the ranking: CPER (copper), L.D. (lead), and JJN (nickel). It is a group of industrial metals that are very useful but less noble and, therefore, less used for hedging purposes.
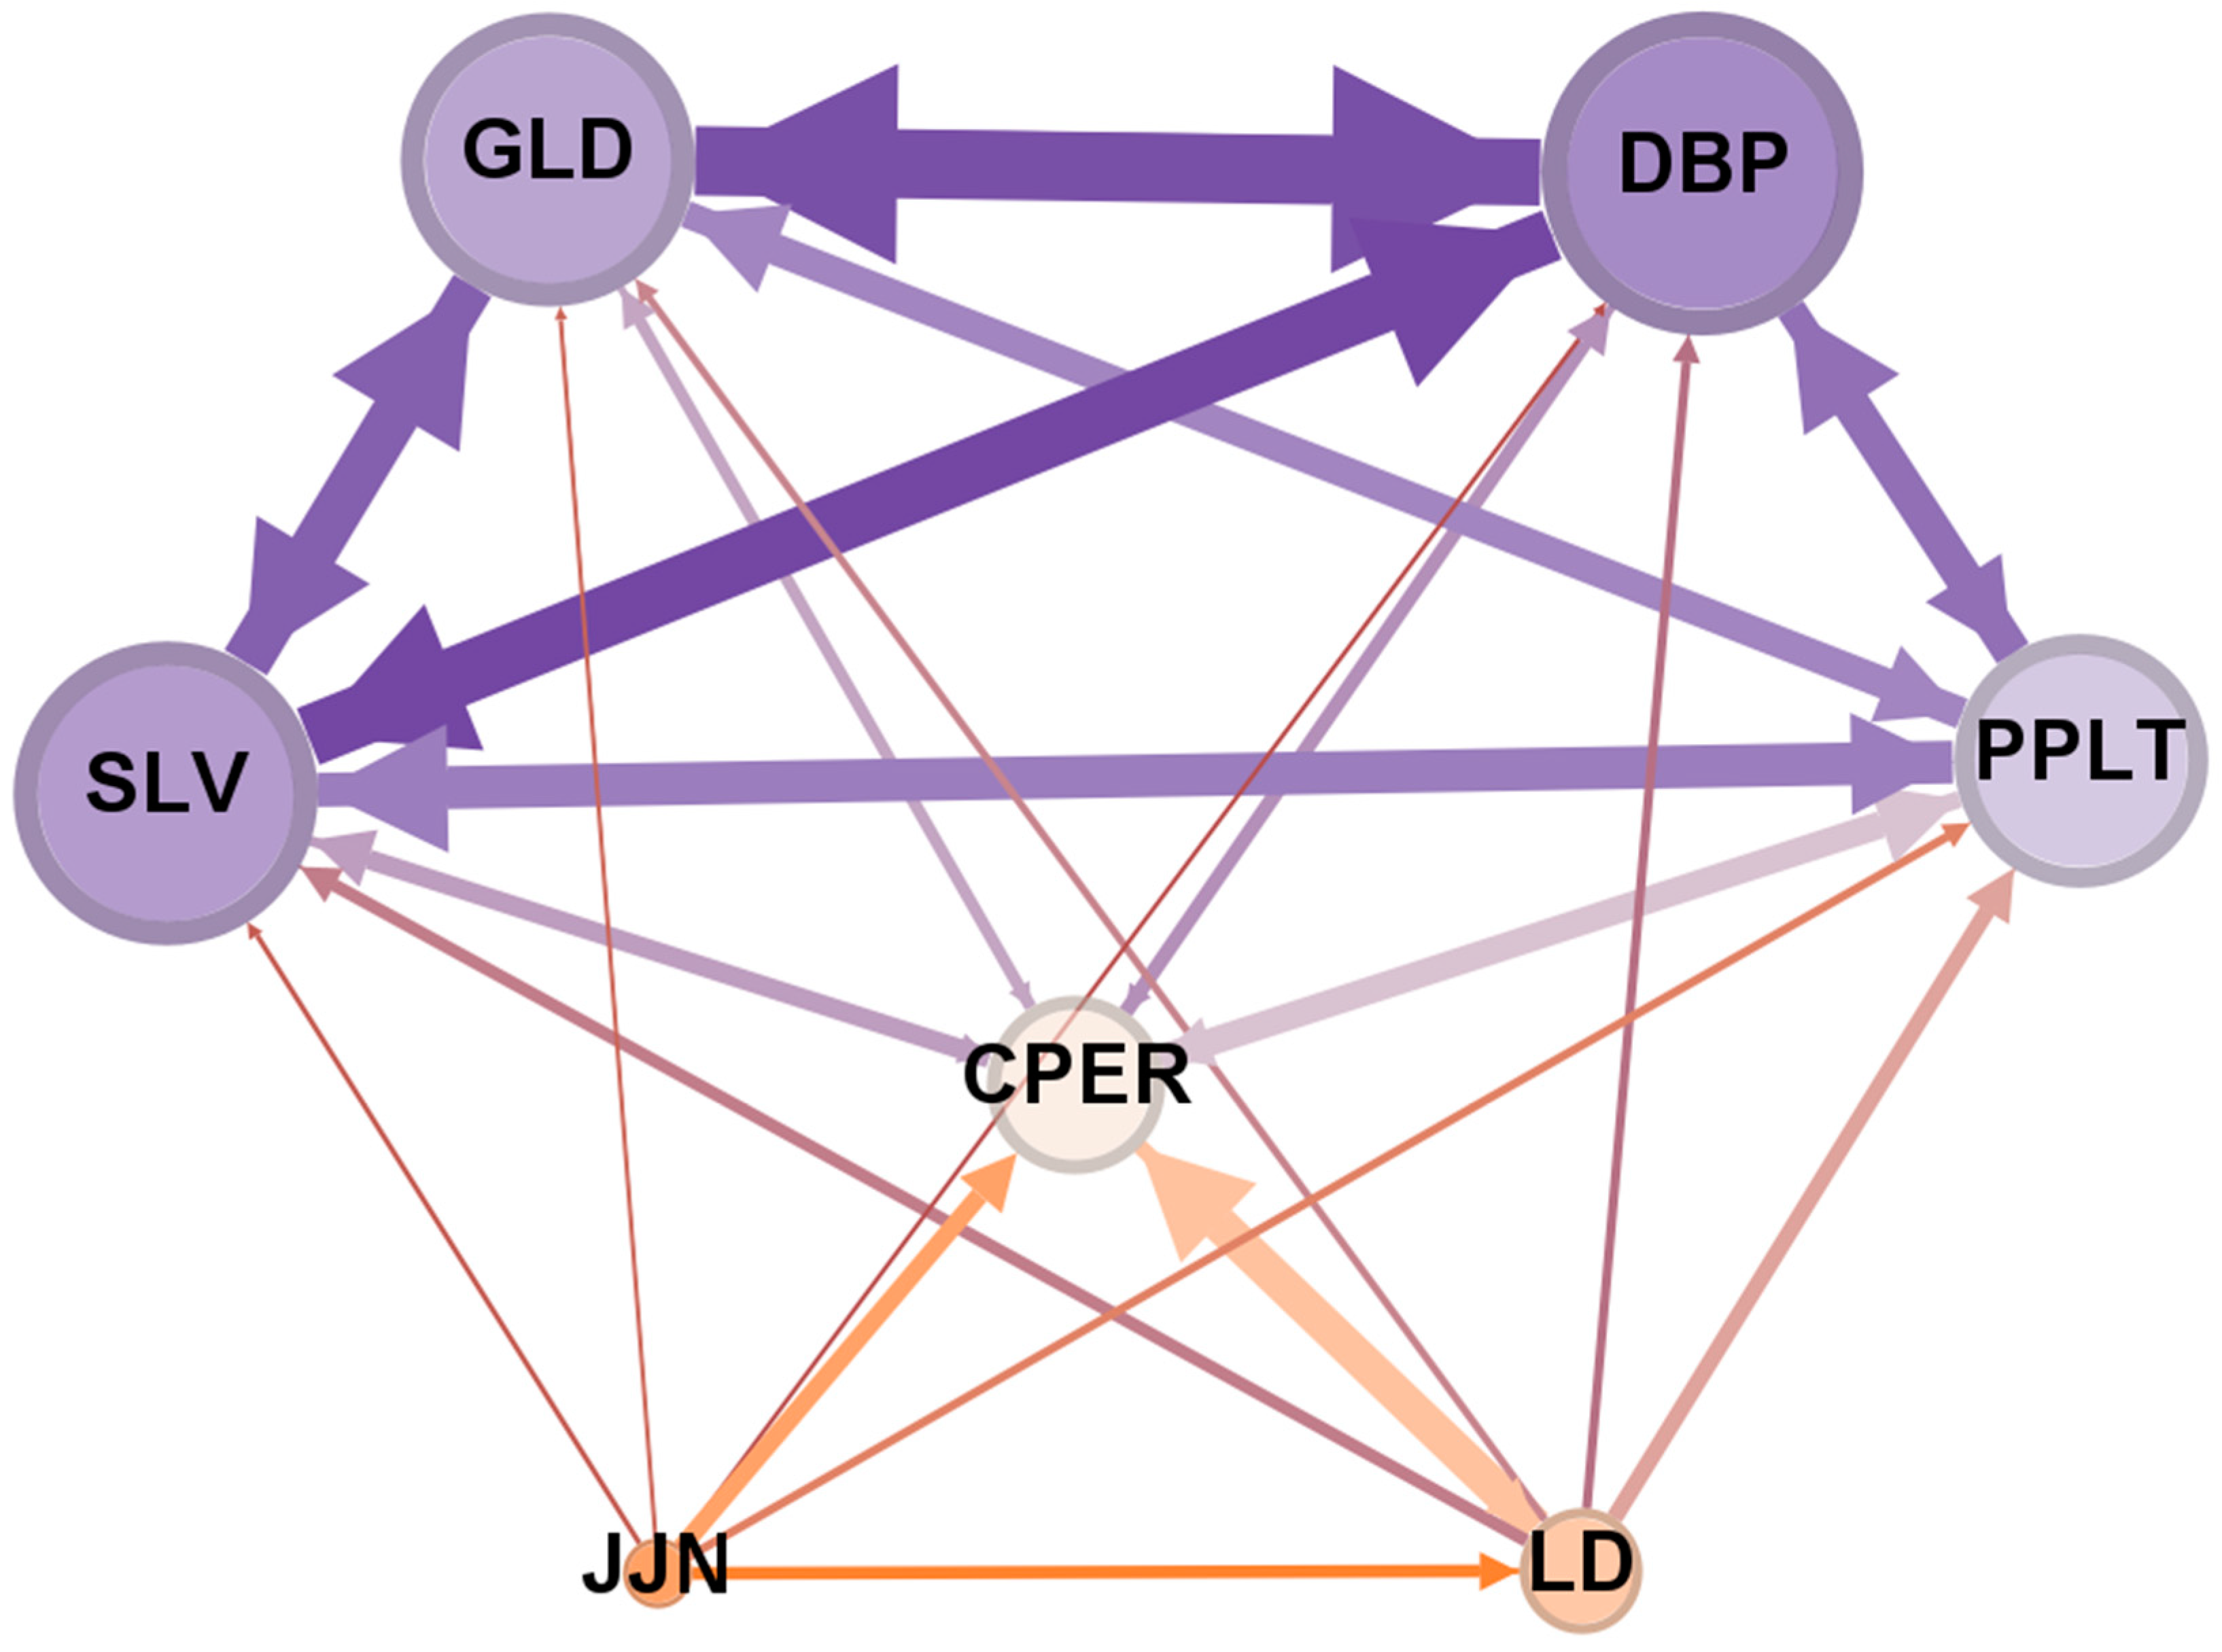
Finally, the PageRank algorithms confirm the high values of this main grouping, maintaining the descending order of the average weighted ranks we mentioned. We detail the complex network using the Force Atlas algorithm, which produces a layout arrangement suitable for segmenting the sample into the two mentioned groupings in
Figure 4.
The color scale in
Figure 4 shows that the ETFs (nodules or vertices in network science language) that transmit and receive the most volatility are colored in gradually darker shades of purple. Conversely, those that receive and transmit the least volatility are in progressively more orange tones. The size of the nodules also expresses the strength of the volatility sent and received. Thus, by observing the more purple-colored nodules of DBP, GLD, and SLV, we can see that these ETFs are more volatile than PPLT.
Arouri et al. (
2013) found that spot market investors can adjust their investment strategies considering the volatilities and returns in the commodity markets they examine. By analyzing the differences in volatilities of the groups of metals identified by the categories of class 0 and 1 (as presented in
Table 2), we confirm their suggestion that it is feasible to optimize the allocation and protection of portfolio risks through the use of instruments from both the spot market and the futures market and commodity options.
These findings also support the conclusion of these authors that most precious metals (cluster 1) can represent an effective hedging alternative in portfolios of stocks and other assets, especially in periods of crises and greater uncertainty in global financial markets.
5. Final Considerations
This work sought to investigate the metal commodities market by measuring the interdependence of metal ETFs with the highest trading volume on the New York Stock Exchange. To this end, daily closing data from September 2019 to August 2023, the
Diebold and Yilmaz (
2012) spillover index, and complex network metrics that identify the intensity of interrelations and cluster them are considered.
The results indicate a greater relevance of precious metals, to the detriment of industrial metals, due to their greater relevance as safe instruments in periods of greater economic uncertainty. The ETFs that transmit and receive the most volatility in the modeled complex network were, in ascending order, the DBP of precious metals (composed of a diversified basket), followed by GLD (gold), SLV (silver), and PPLT (platinum). They are described by the cluster analysis of the modularity optimization process as the group most used for hedging purposes in critical periods.
The other three industrial metal commodity assets, in ascending order of volatility spillovers—or weighted average degrees—are CPER (copper), L.D. (lead), and JJN (nickel). Since the weighted entry and exit degrees and the weighted average degree present identical classifications, it is possible to verify that the network accurately exposes how much each ETF received (entry degree) and sent (exit degree) volatility to the other ETFs.
These findings are useful for the scientific literature by empirically evidencing the dynamic relationships between the main metal ETFs traded on the New York Stock Exchange, as well as for the supply chain agents that use these metals and financial market professionals who use them in their investment strategies. As suggestions for future research, shocks could be simulated in the ETFs with the highest degree of centrality to verify how others behave.
Since we mainly deal with connectivity in the metal ETF market, we did not comprehensively test the presence of these assets in diversified portfolios. In this sense, this article is limited to strongly suggesting that these ETFs can be used in defensive portfolios, especially in times of heightened uncertainty, such as the COVID-19 pandemic. However, for future articles, it is recommended that this result be tested econometrically with research on diversified portfolios, à la
Markowitz (
1952), and with different participations, in different periods, of these metal ETFs in them. Only then will we have more robust empirical evidence on metal ETFs’ “defensive” or “protective” nature. Nevertheless, this article is a good starting point for future research and a contribution to portfolio theory.


 ,
, 


