Figure 1.
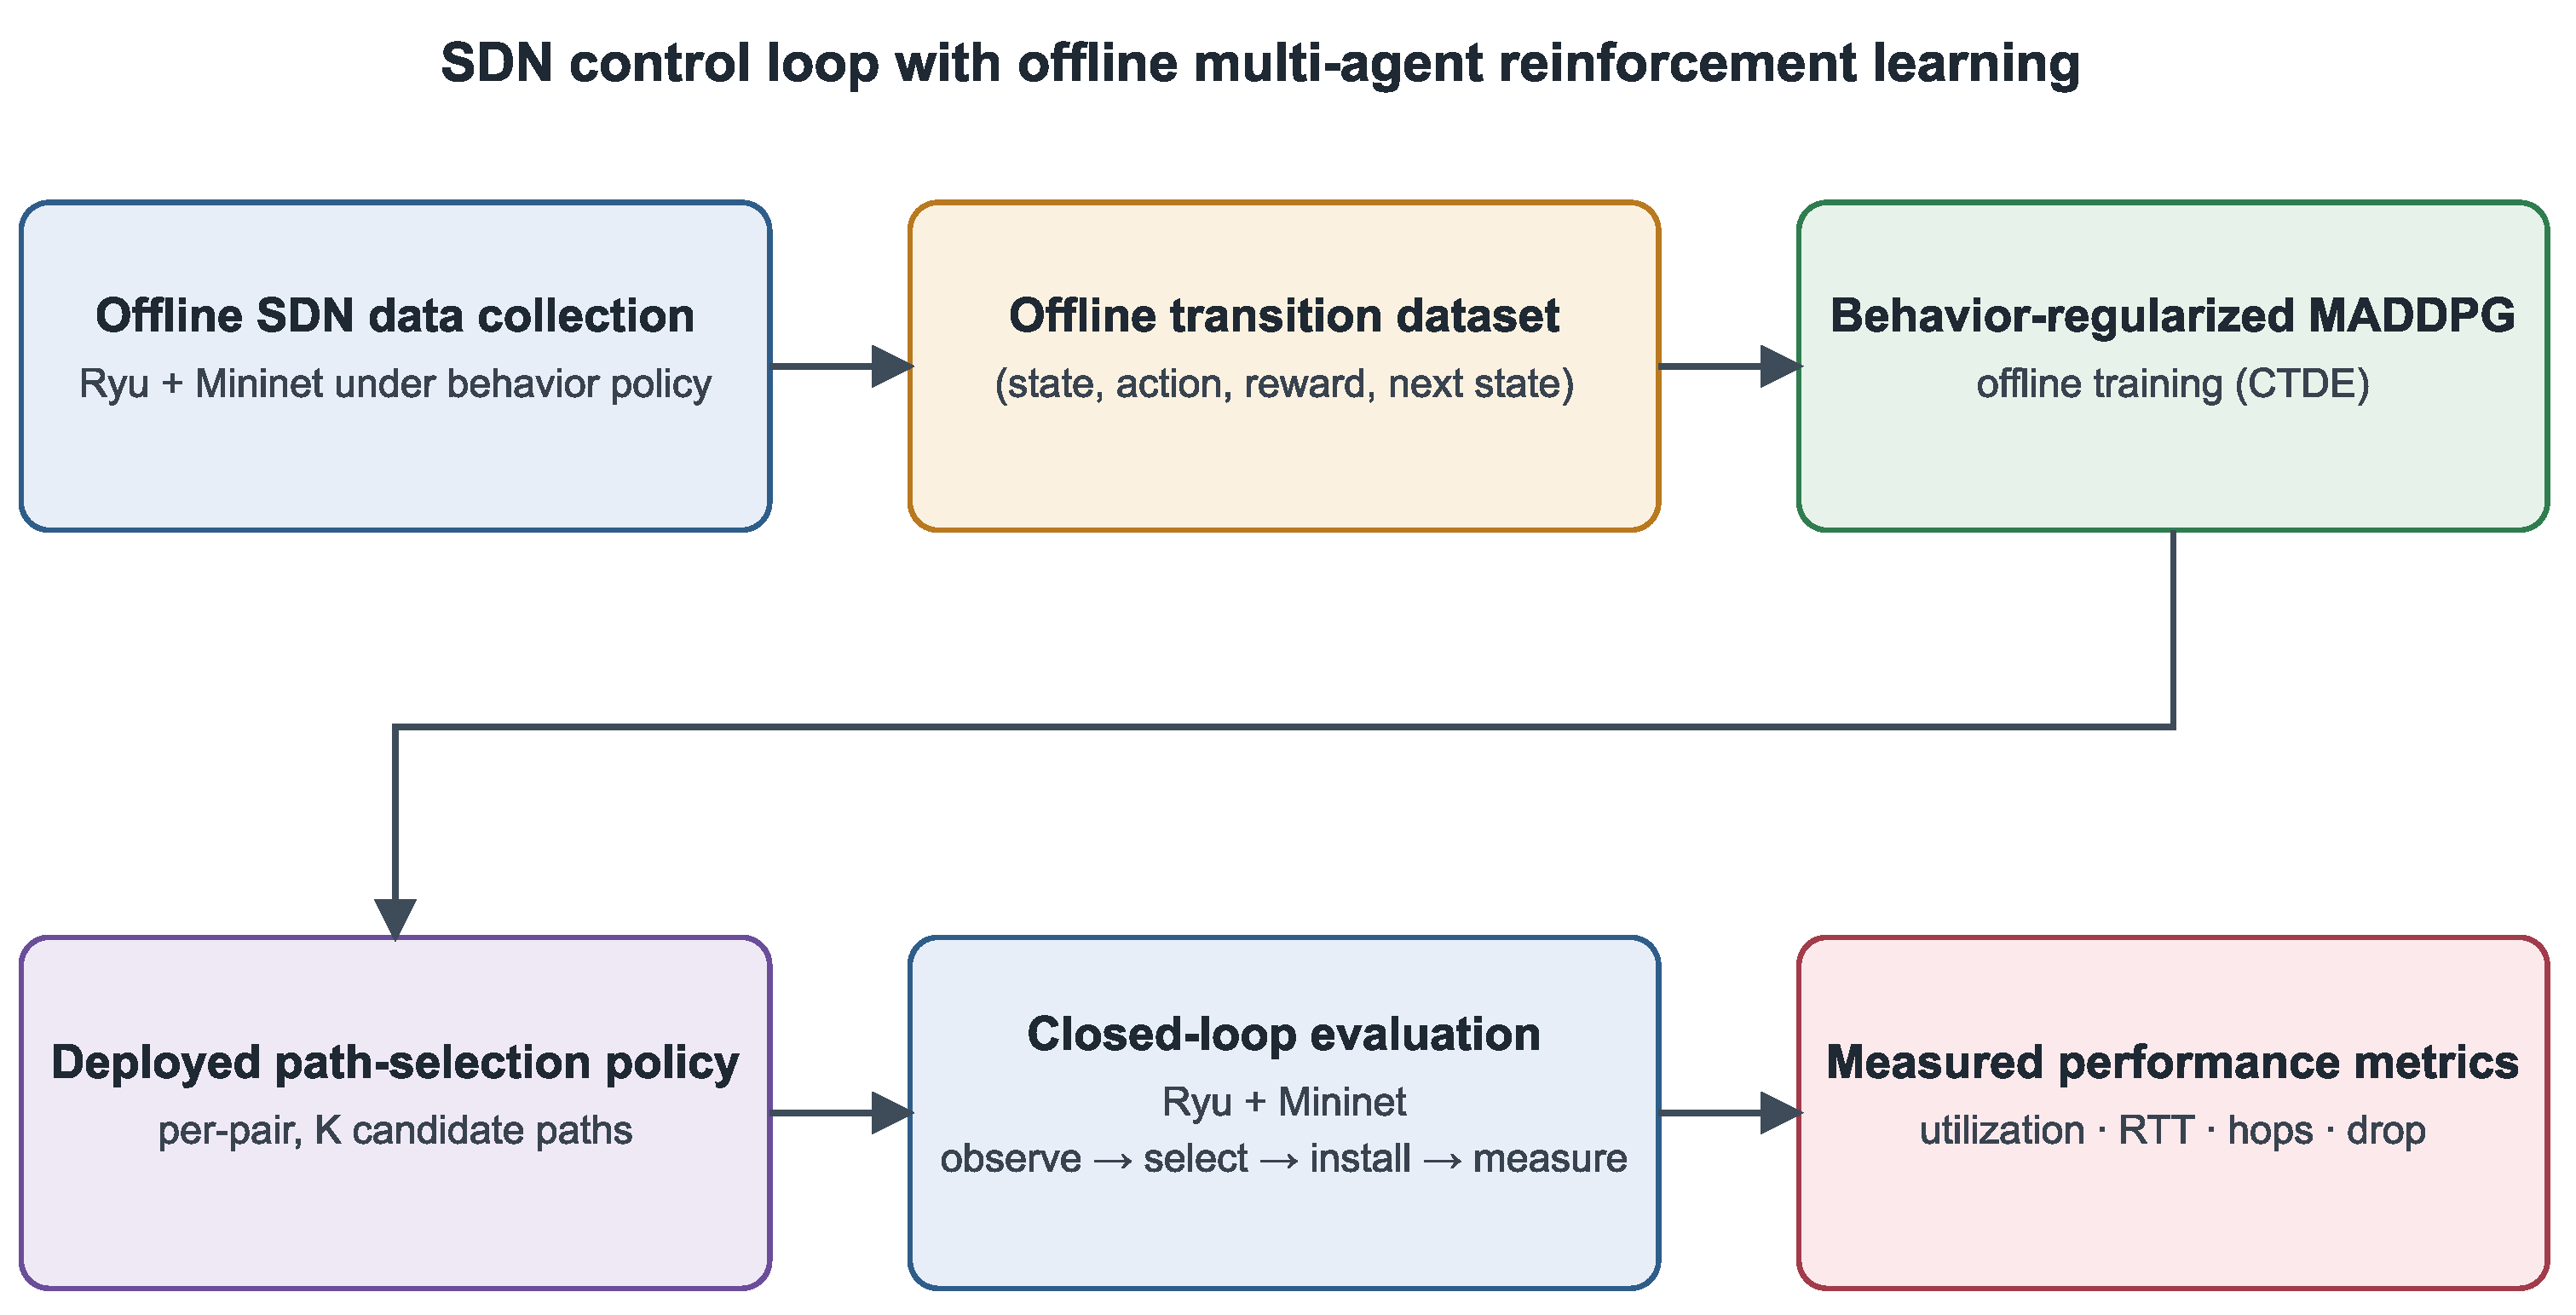
Offline training and closed-loop deployment workflow for the proposed SDN path-control policy. Logged SDN interactions are converted into an offline transition dataset, used to train an MADDPG controller with behavior-adjusted training rewards, and exported as a deterministic argmax path-selection policy for live Ryu–Mininet evaluation.
Figure 1.
Offline training and closed-loop deployment workflow for the proposed SDN path-control policy. Logged SDN interactions are converted into an offline transition dataset, used to train an MADDPG controller with behavior-adjusted training rewards, and exported as a deterministic argmax path-selection policy for live Ryu–Mininet evaluation.
Figure 2.
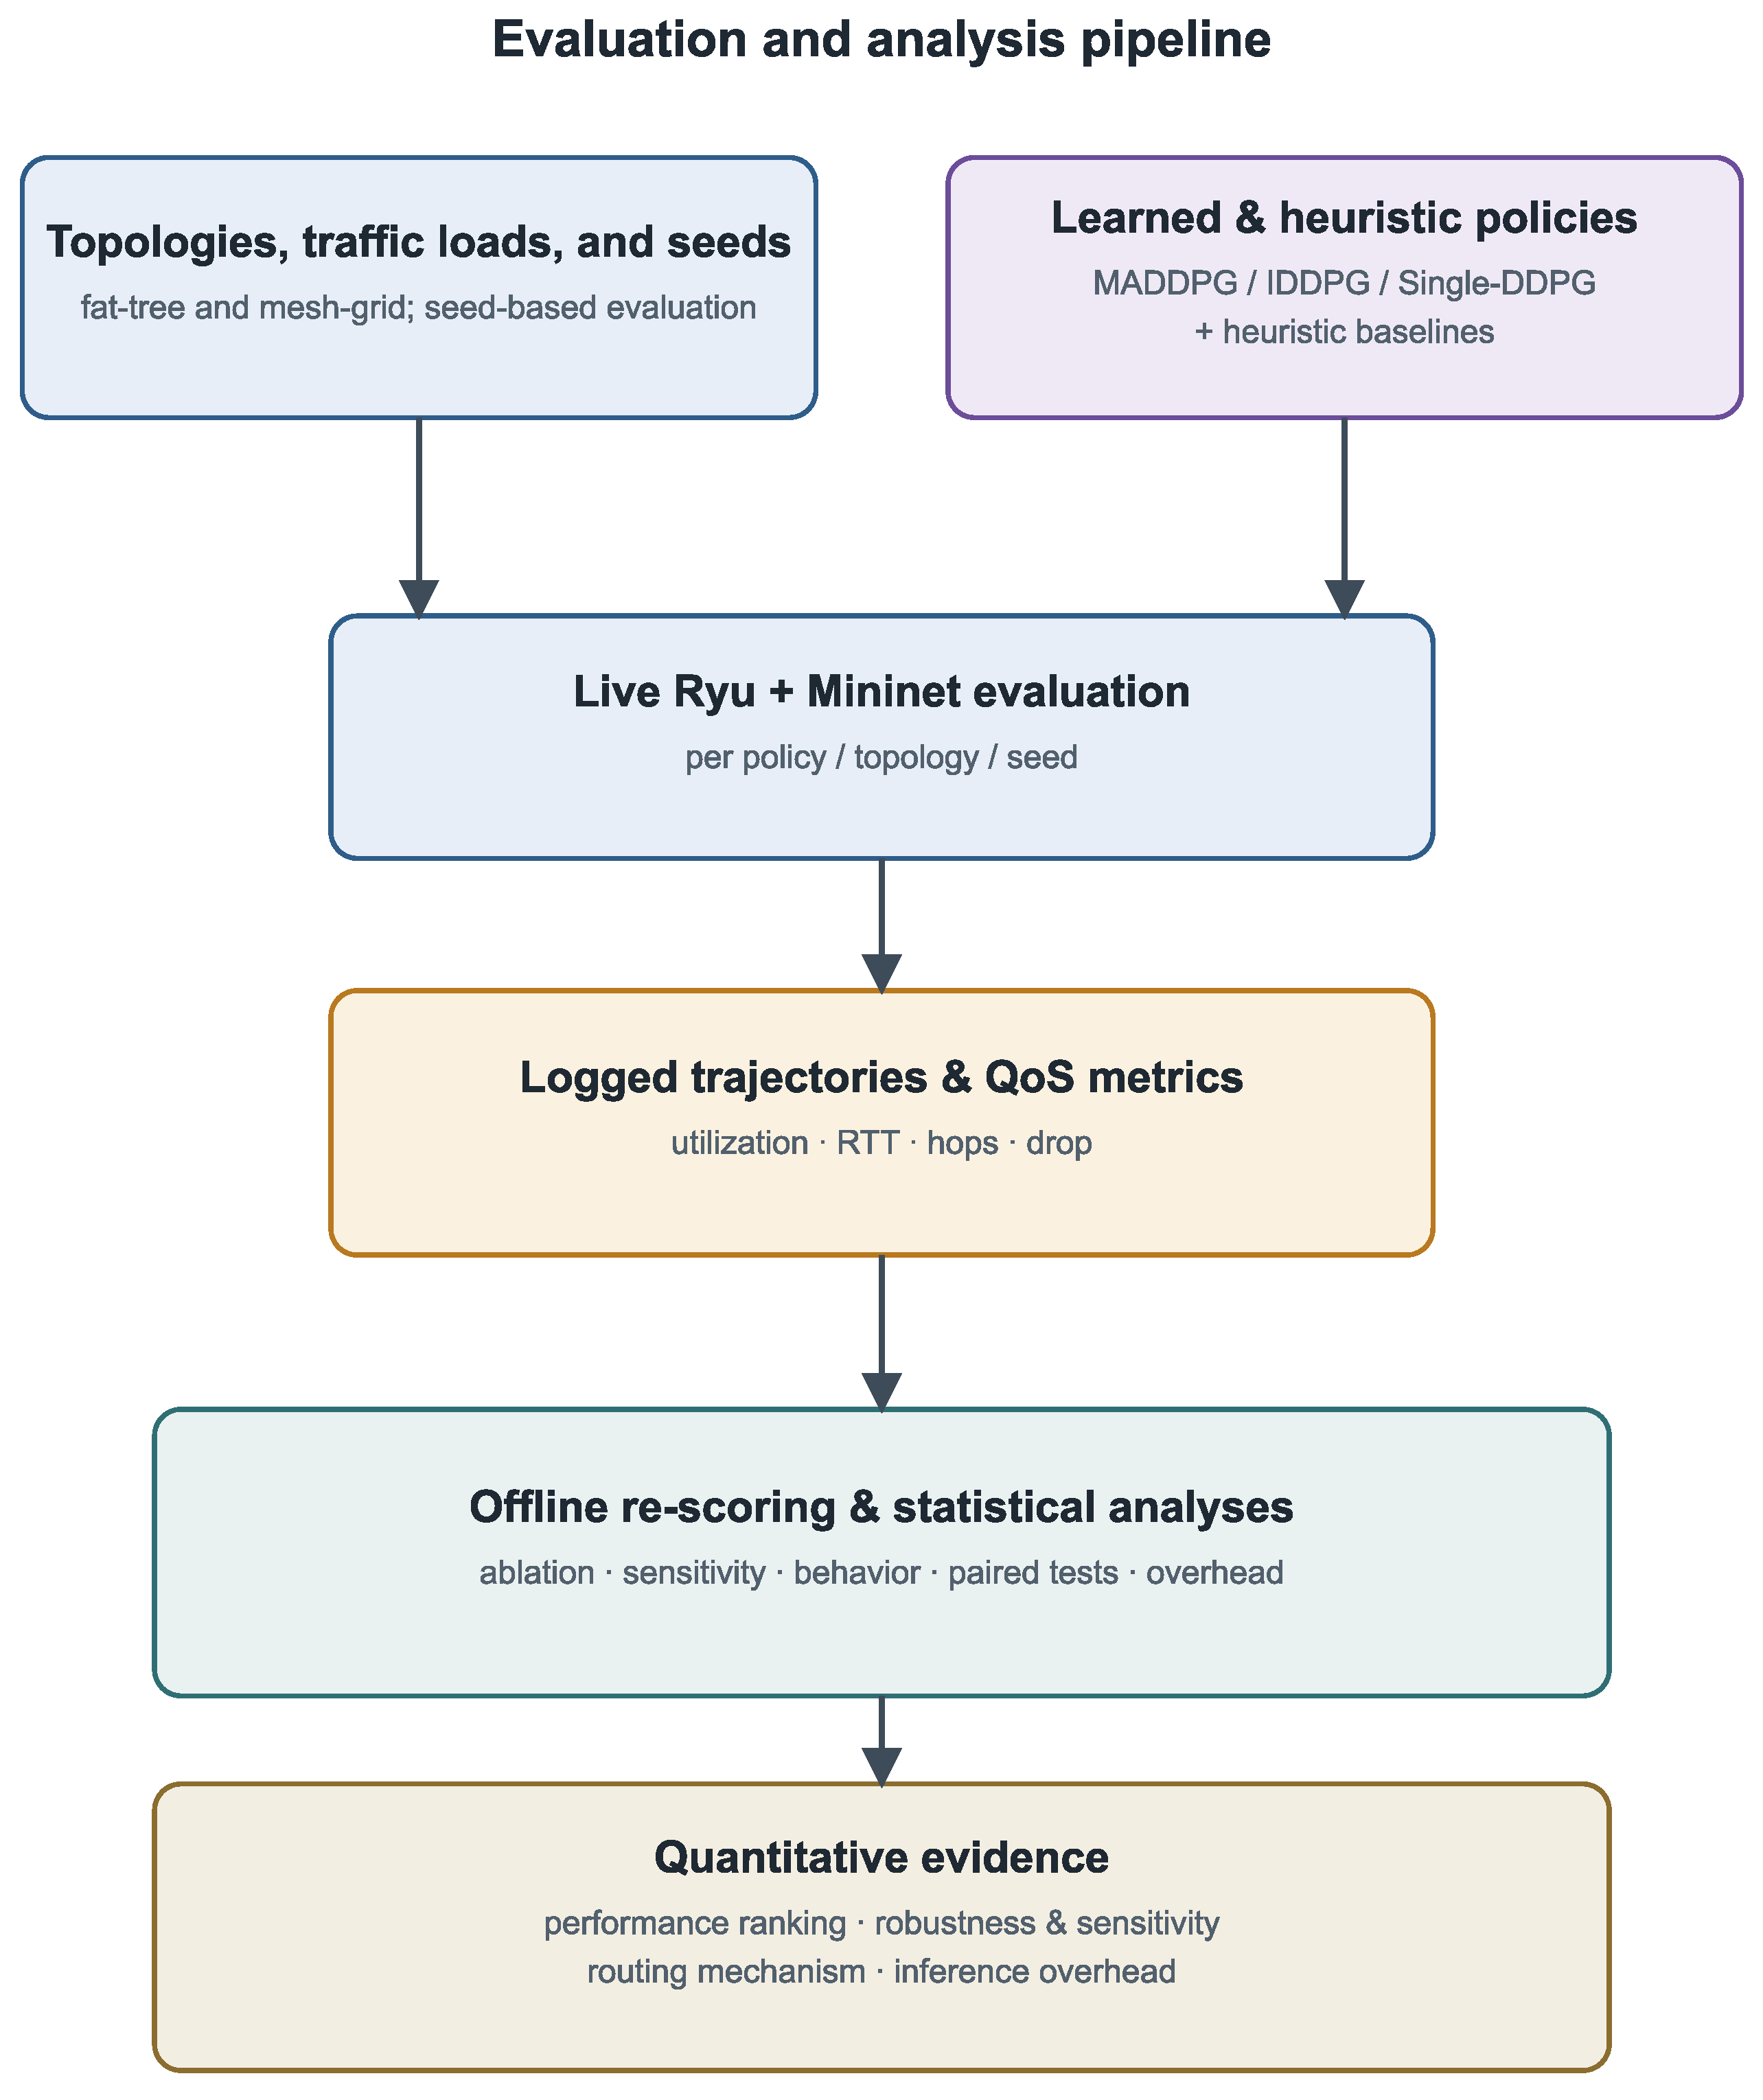
Evaluation and analysis pipeline. Topologies, offered-traffic profiles, seeds, and path-control policies define the live Ryu–Mininet evaluations. Logged trajectories and measured outcomes are used for reward re-scoring, architectural-variant analysis, sensitivity analysis, policy-behavior and flow-completion analysis, paired statistical testing, and controller-overhead evaluation. Auxiliary experiments examine bursty and mixed traffic, link-down and packet-loss conditions, and ECMP forwarding.
Figure 2.
Evaluation and analysis pipeline. Topologies, offered-traffic profiles, seeds, and path-control policies define the live Ryu–Mininet evaluations. Logged trajectories and measured outcomes are used for reward re-scoring, architectural-variant analysis, sensitivity analysis, policy-behavior and flow-completion analysis, paired statistical testing, and controller-overhead evaluation. Auxiliary experiments examine bursty and mixed traffic, link-down and packet-loss conditions, and ECMP forwarding.
Figure 3.
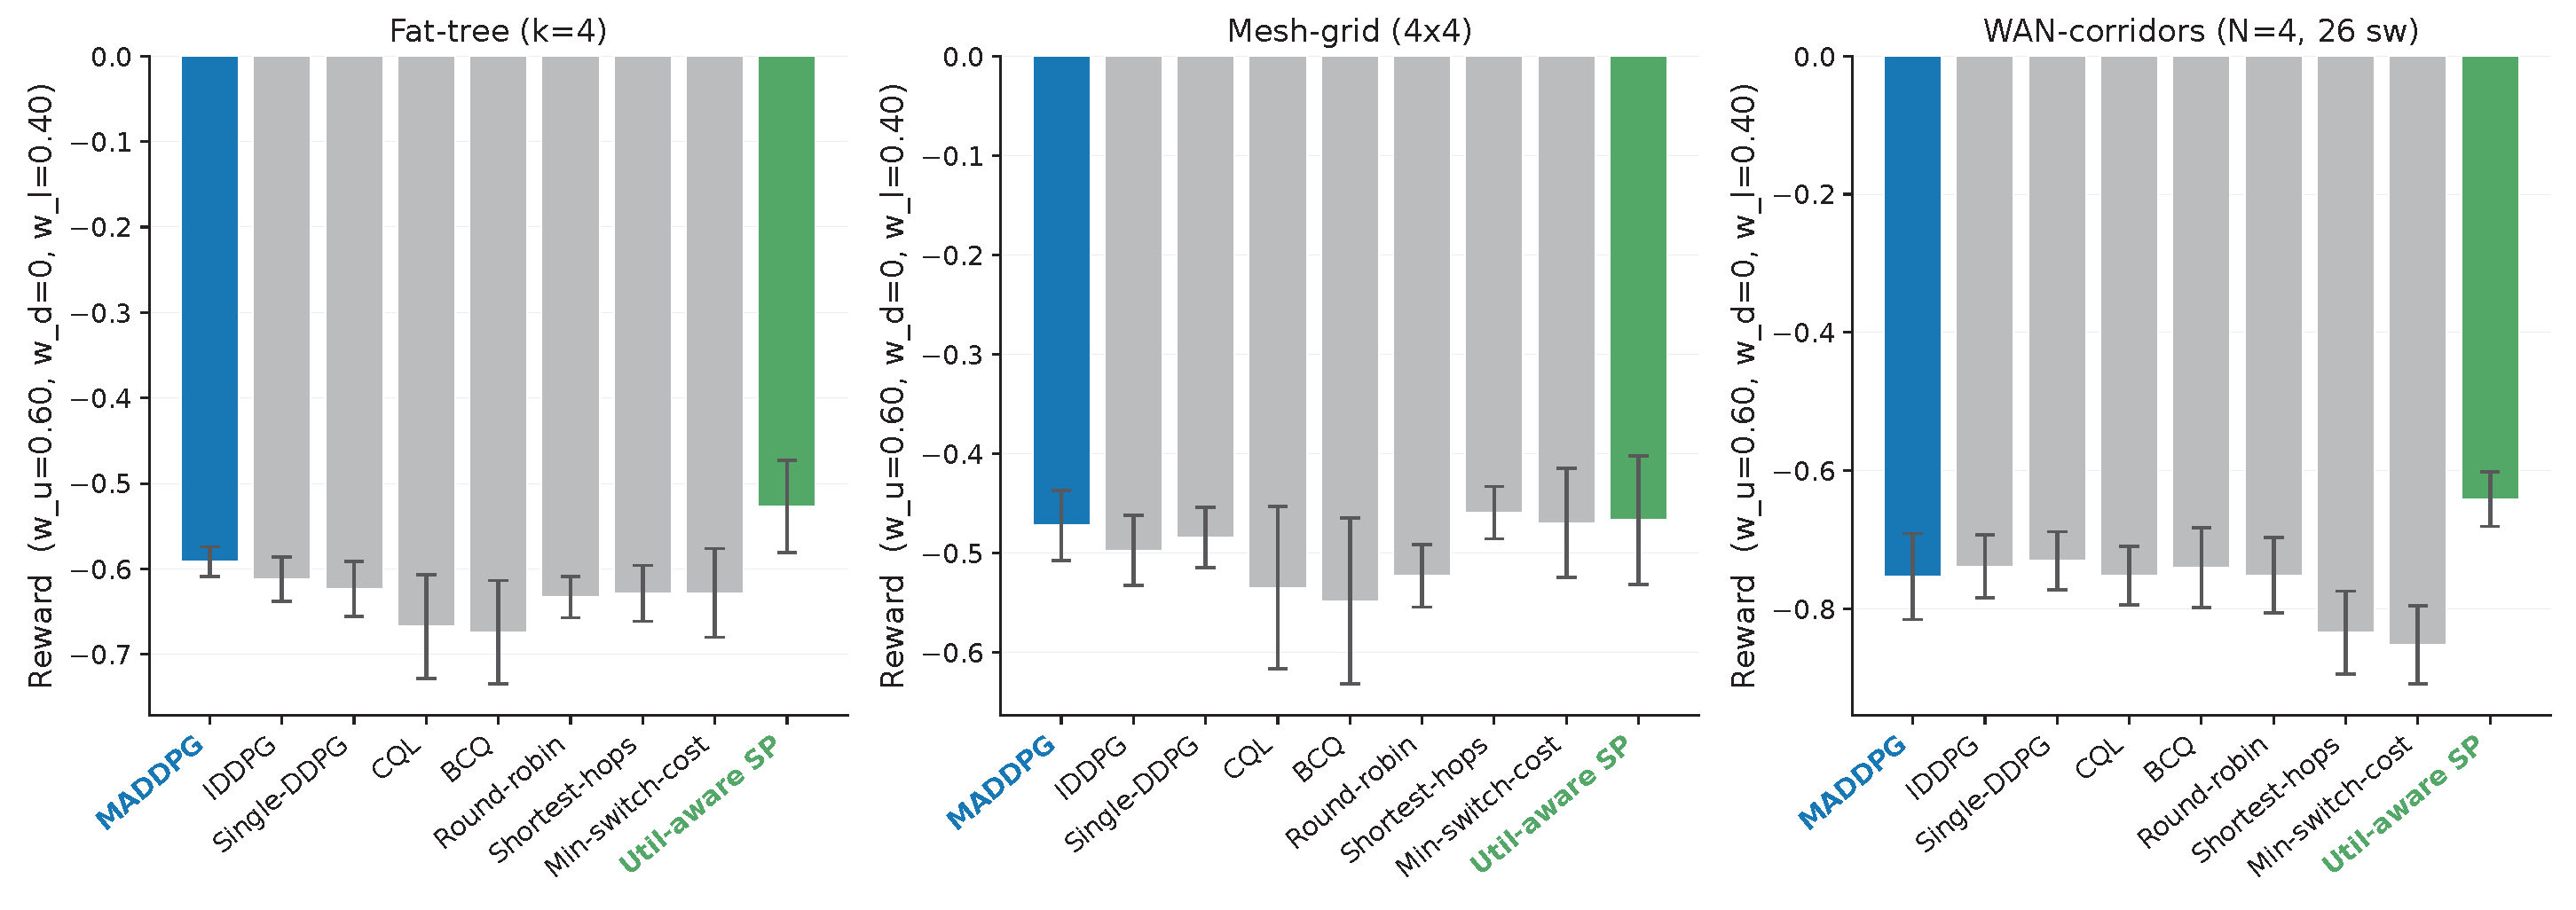
Validated-profile reward by policy on the fat-tree, mesh-grid, and WAN-corridors topologies. Bars show the mean episode reward and error bars show one standard deviation over ten matched seeds. Rewards were computed with , , and ; higher reward is better and zero is the best attainable value.
Figure 3.
Validated-profile reward by policy on the fat-tree, mesh-grid, and WAN-corridors topologies. Bars show the mean episode reward and error bars show one standard deviation over ten matched seeds. Rewards were computed with , , and ; higher reward is better and zero is the best attainable value.
Figure 4.
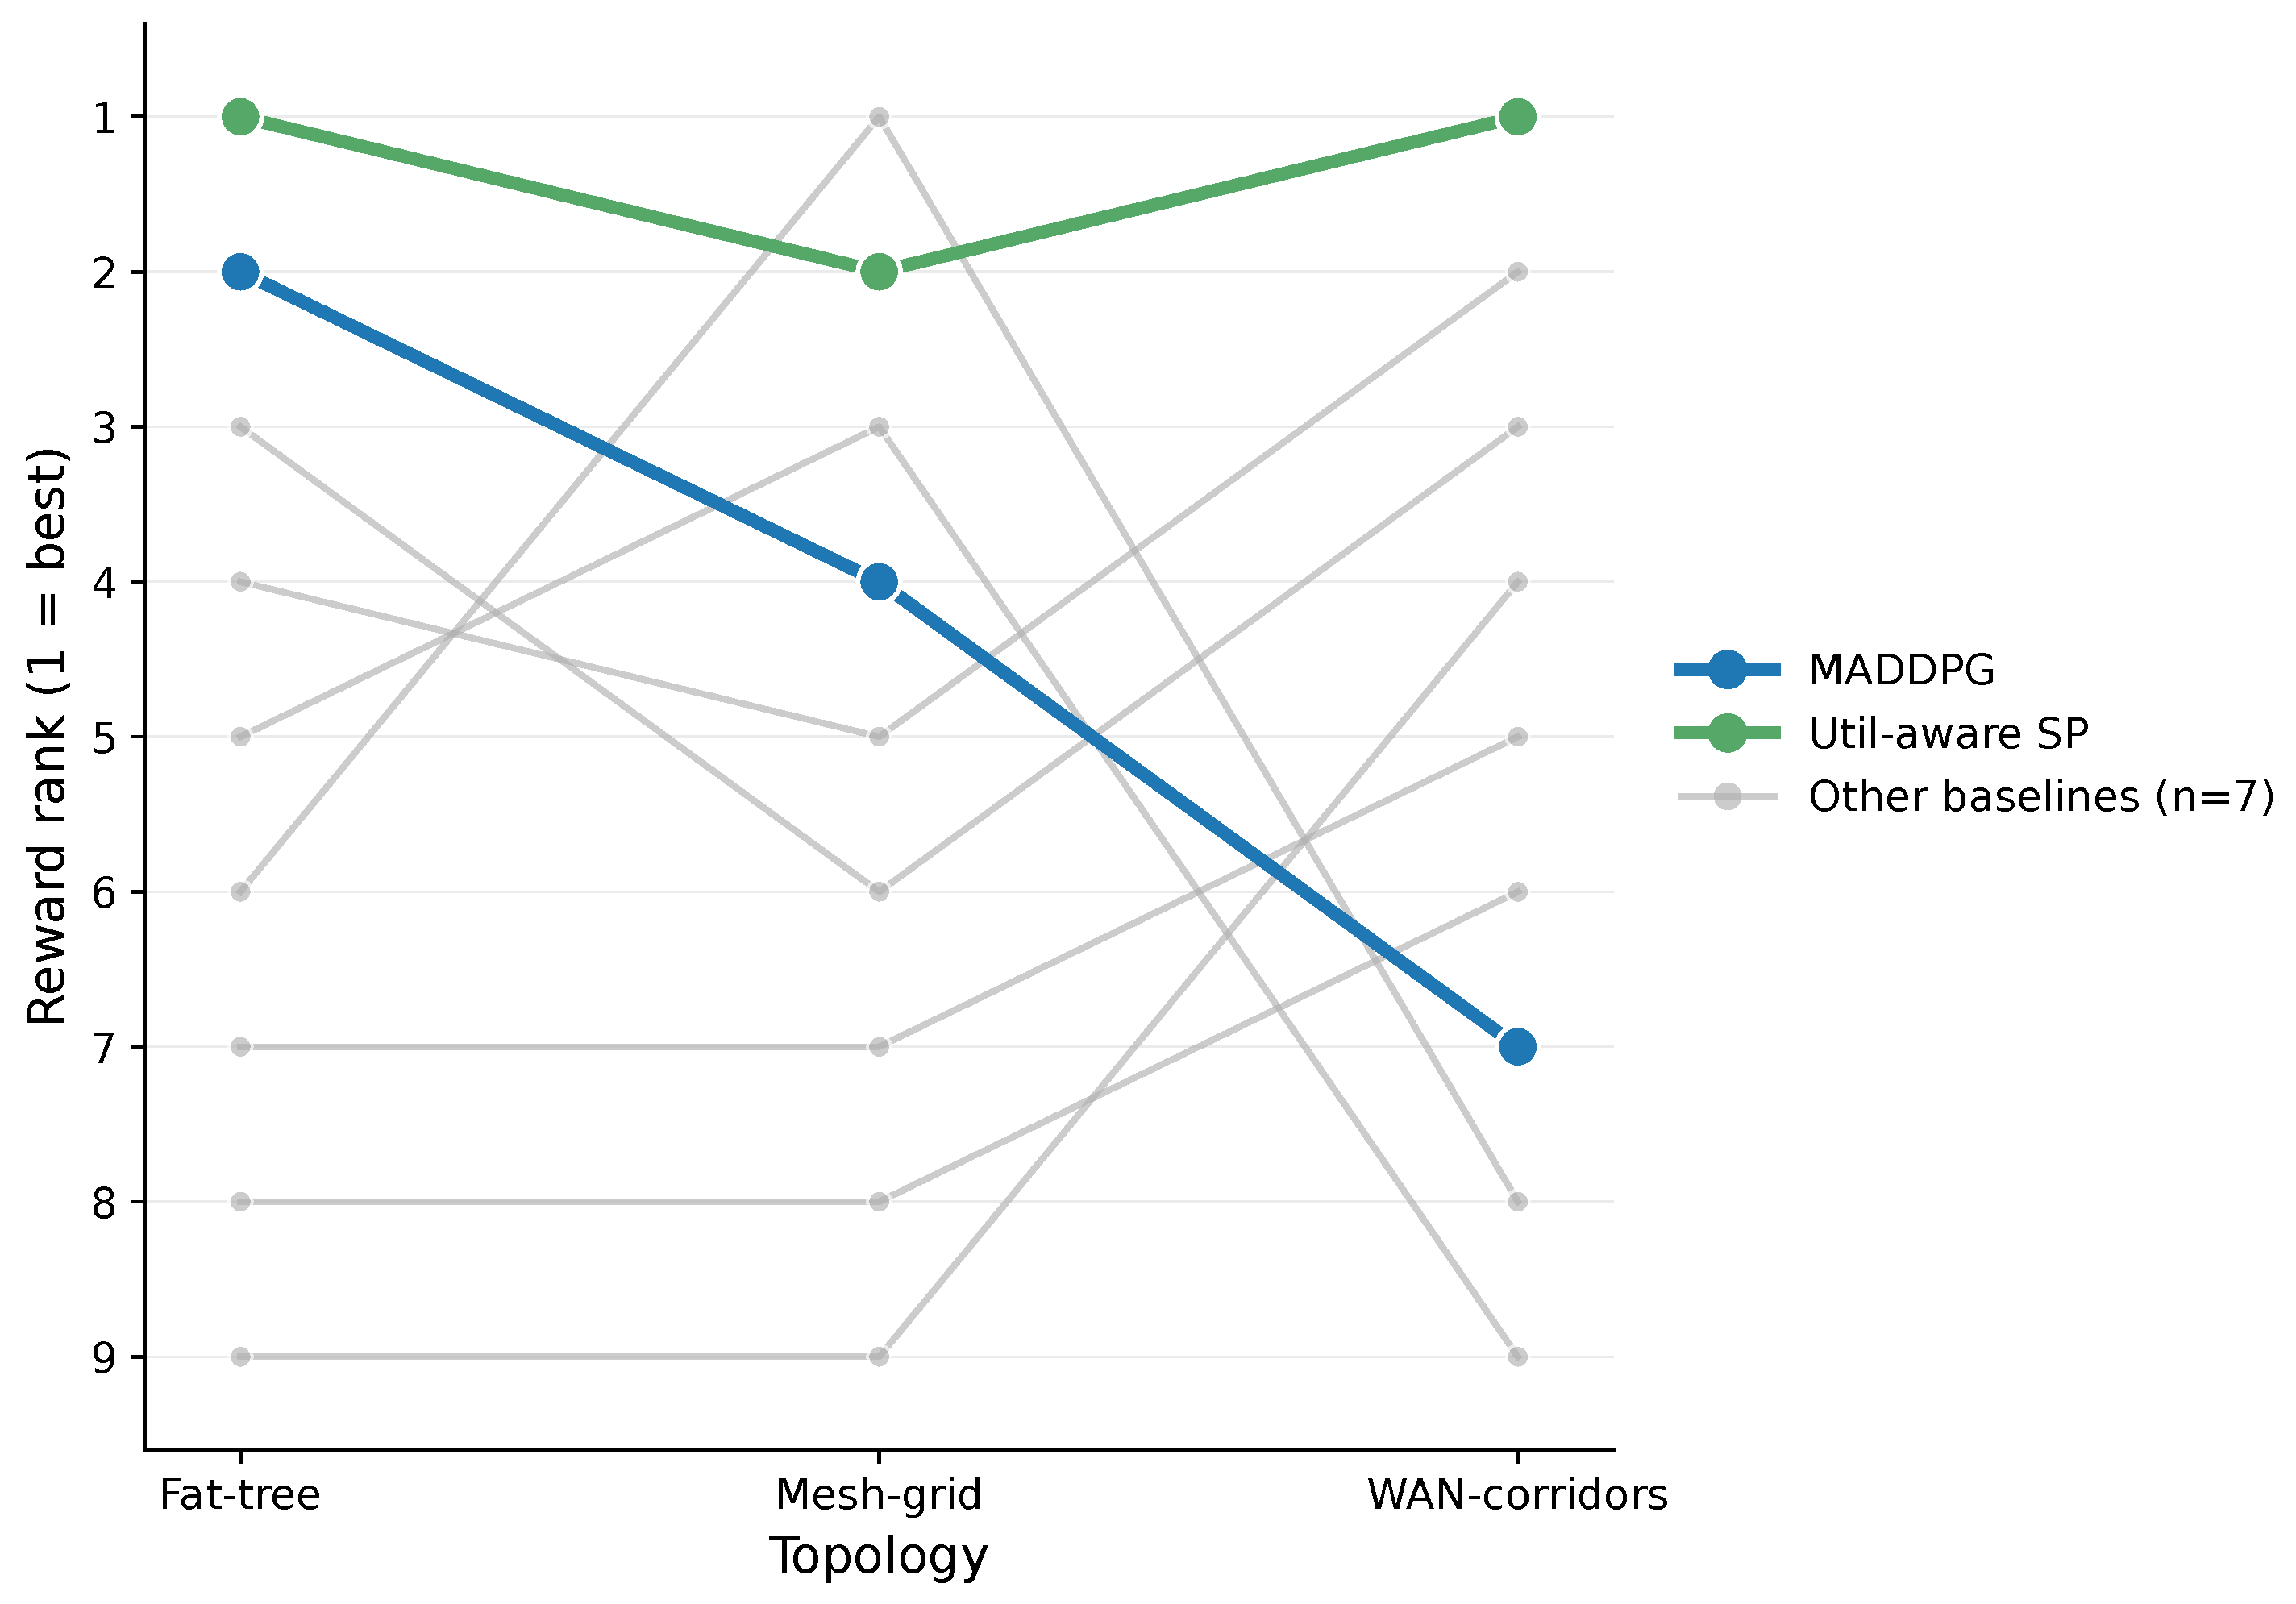
Validated-profile reward-rank profiles across the fat-tree, mesh-grid, and WAN-corridors topologies. Rank 1 indicates the highest mean reward within a topology. The ranks are descriptive point estimates; statistical separation is evaluated using paired seed-level comparisons.
Figure 4.
Validated-profile reward-rank profiles across the fat-tree, mesh-grid, and WAN-corridors topologies. Rank 1 indicates the highest mean reward within a topology. The ranks are descriptive point estimates; statistical separation is evaluated using paired seed-level comparisons.
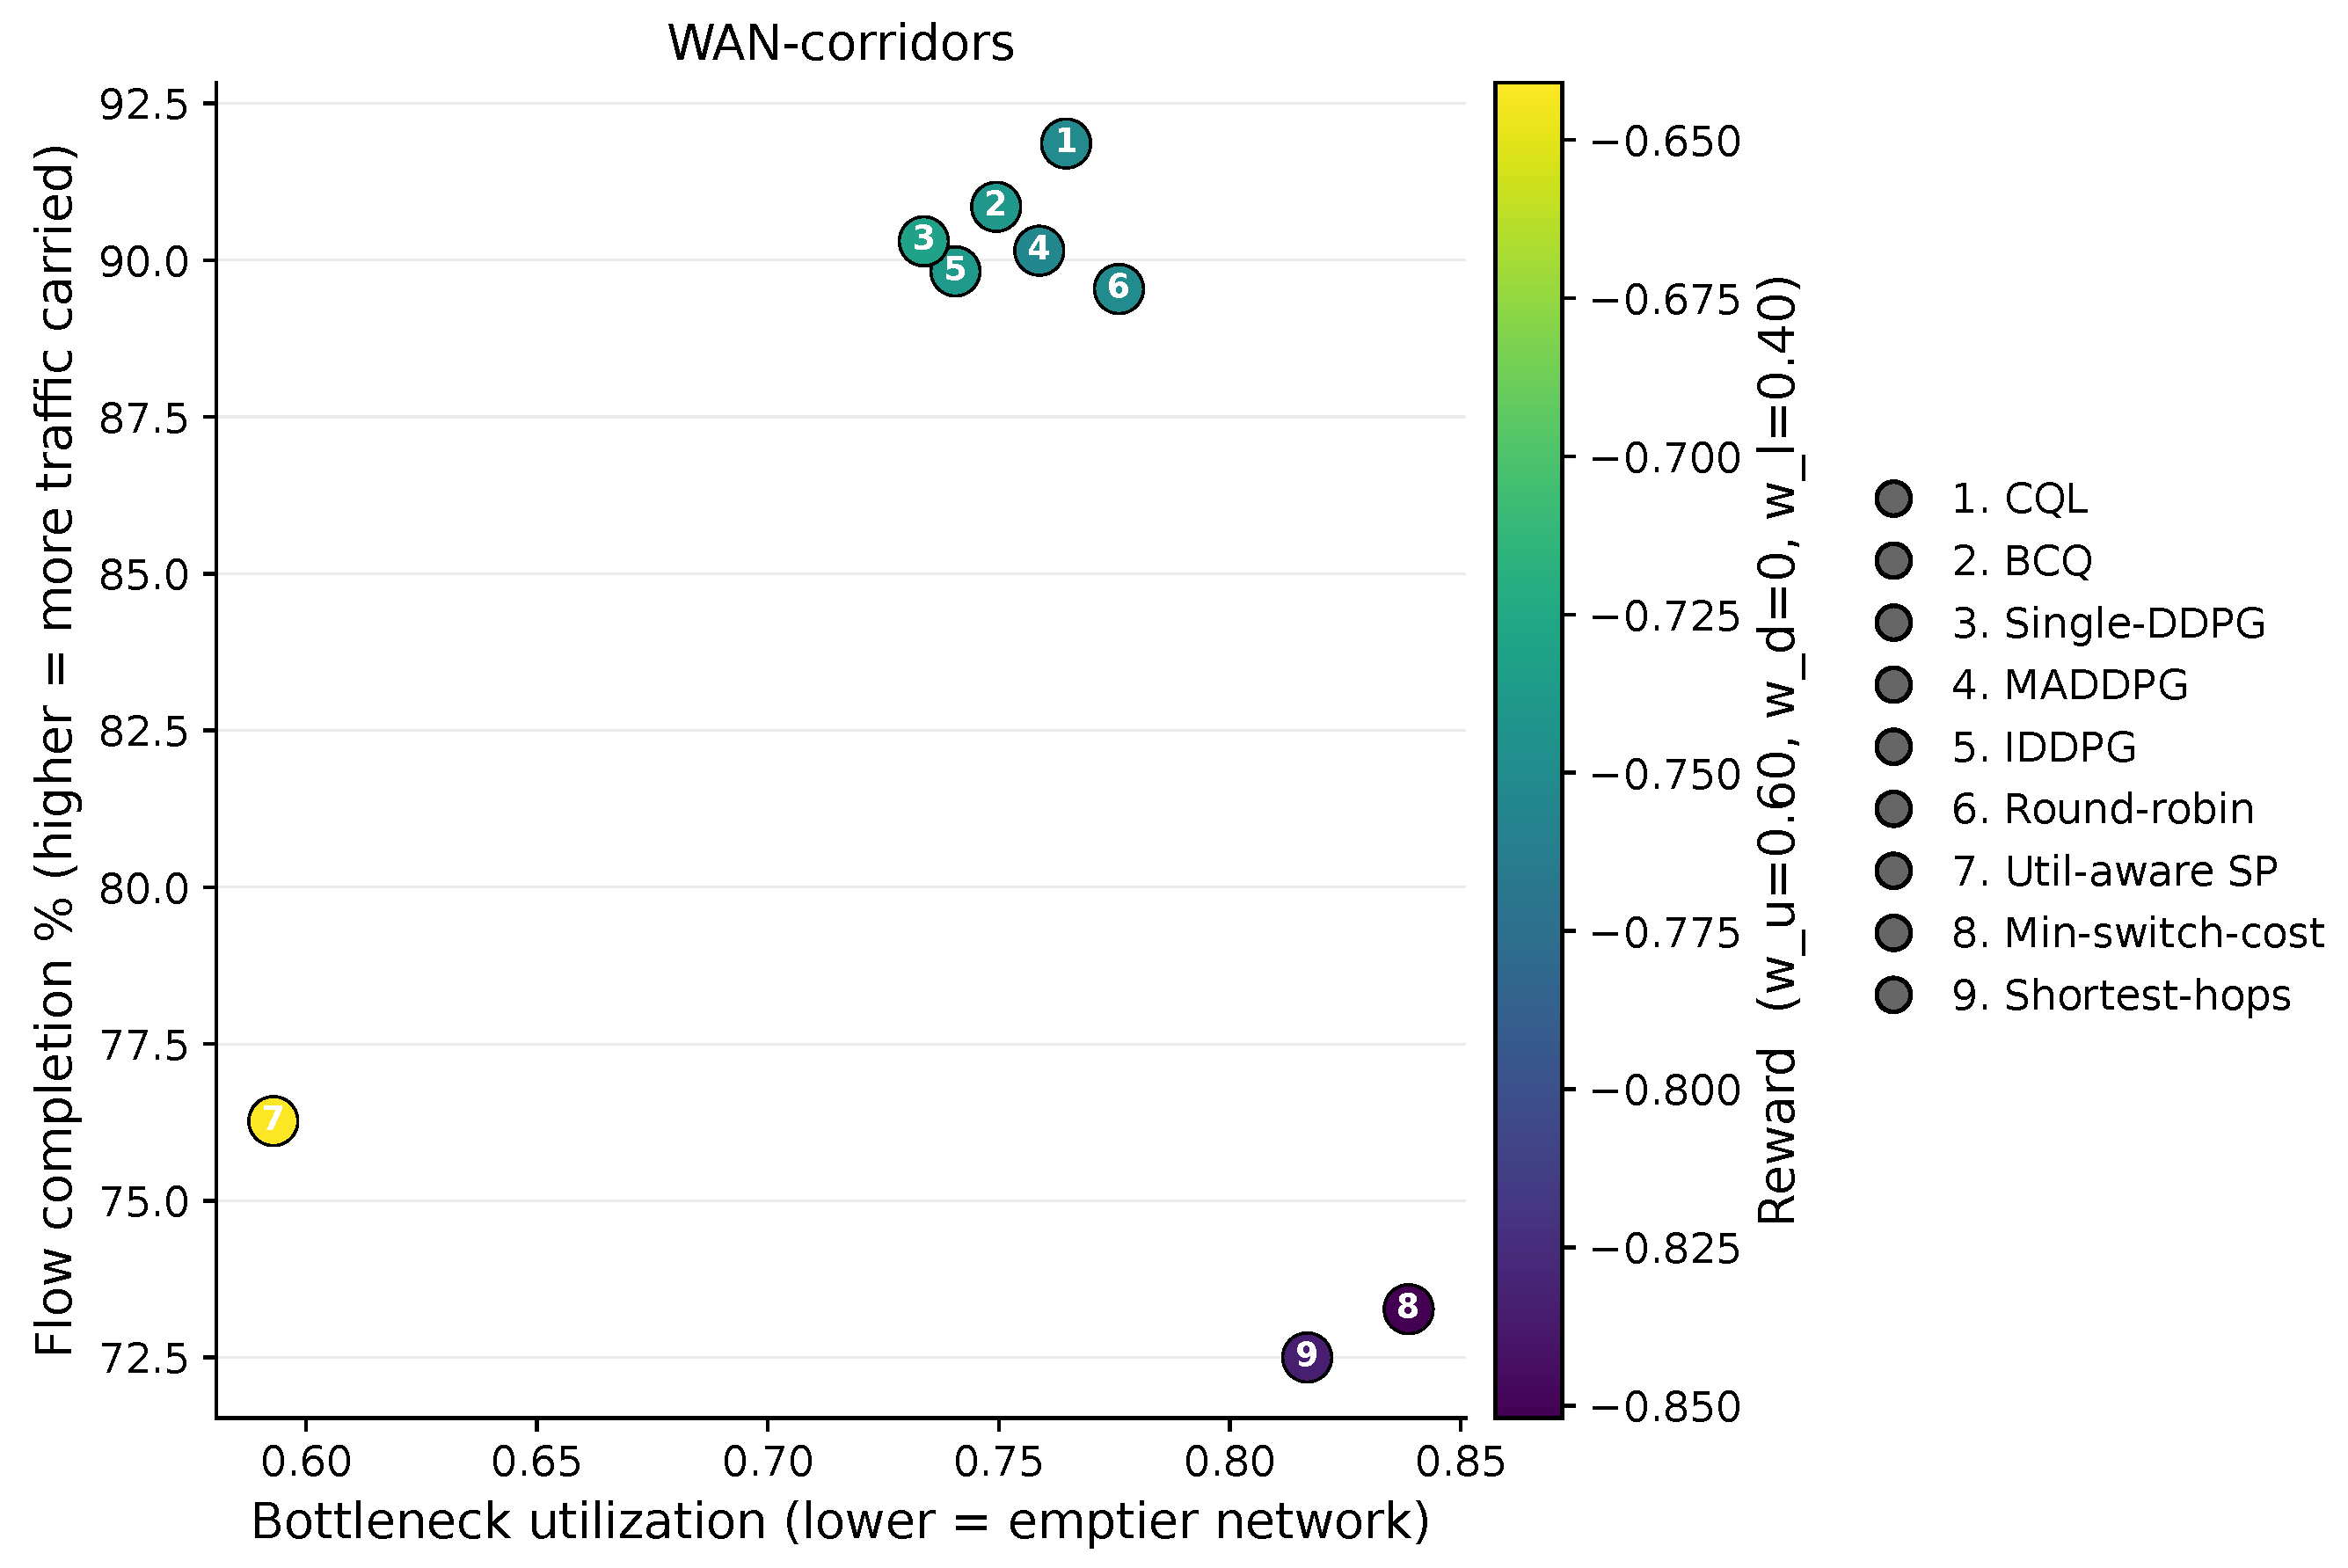
Figure 5.
Flow completion and bottleneck utilization on WAN-corridors under the validated-profile setting. Each point represents the mean over ten matched seeds, and point color indicates the mean reward computed with , , and . Higher completion and lower utilization are preferable. Numbered markers are identified in the accompanying key.
Figure 5.
Flow completion and bottleneck utilization on WAN-corridors under the validated-profile setting. Each point represents the mean over ten matched seeds, and point color indicates the mean reward computed with , , and . Higher completion and lower utilization are preferable. Numbered markers are identified in the accompanying key.
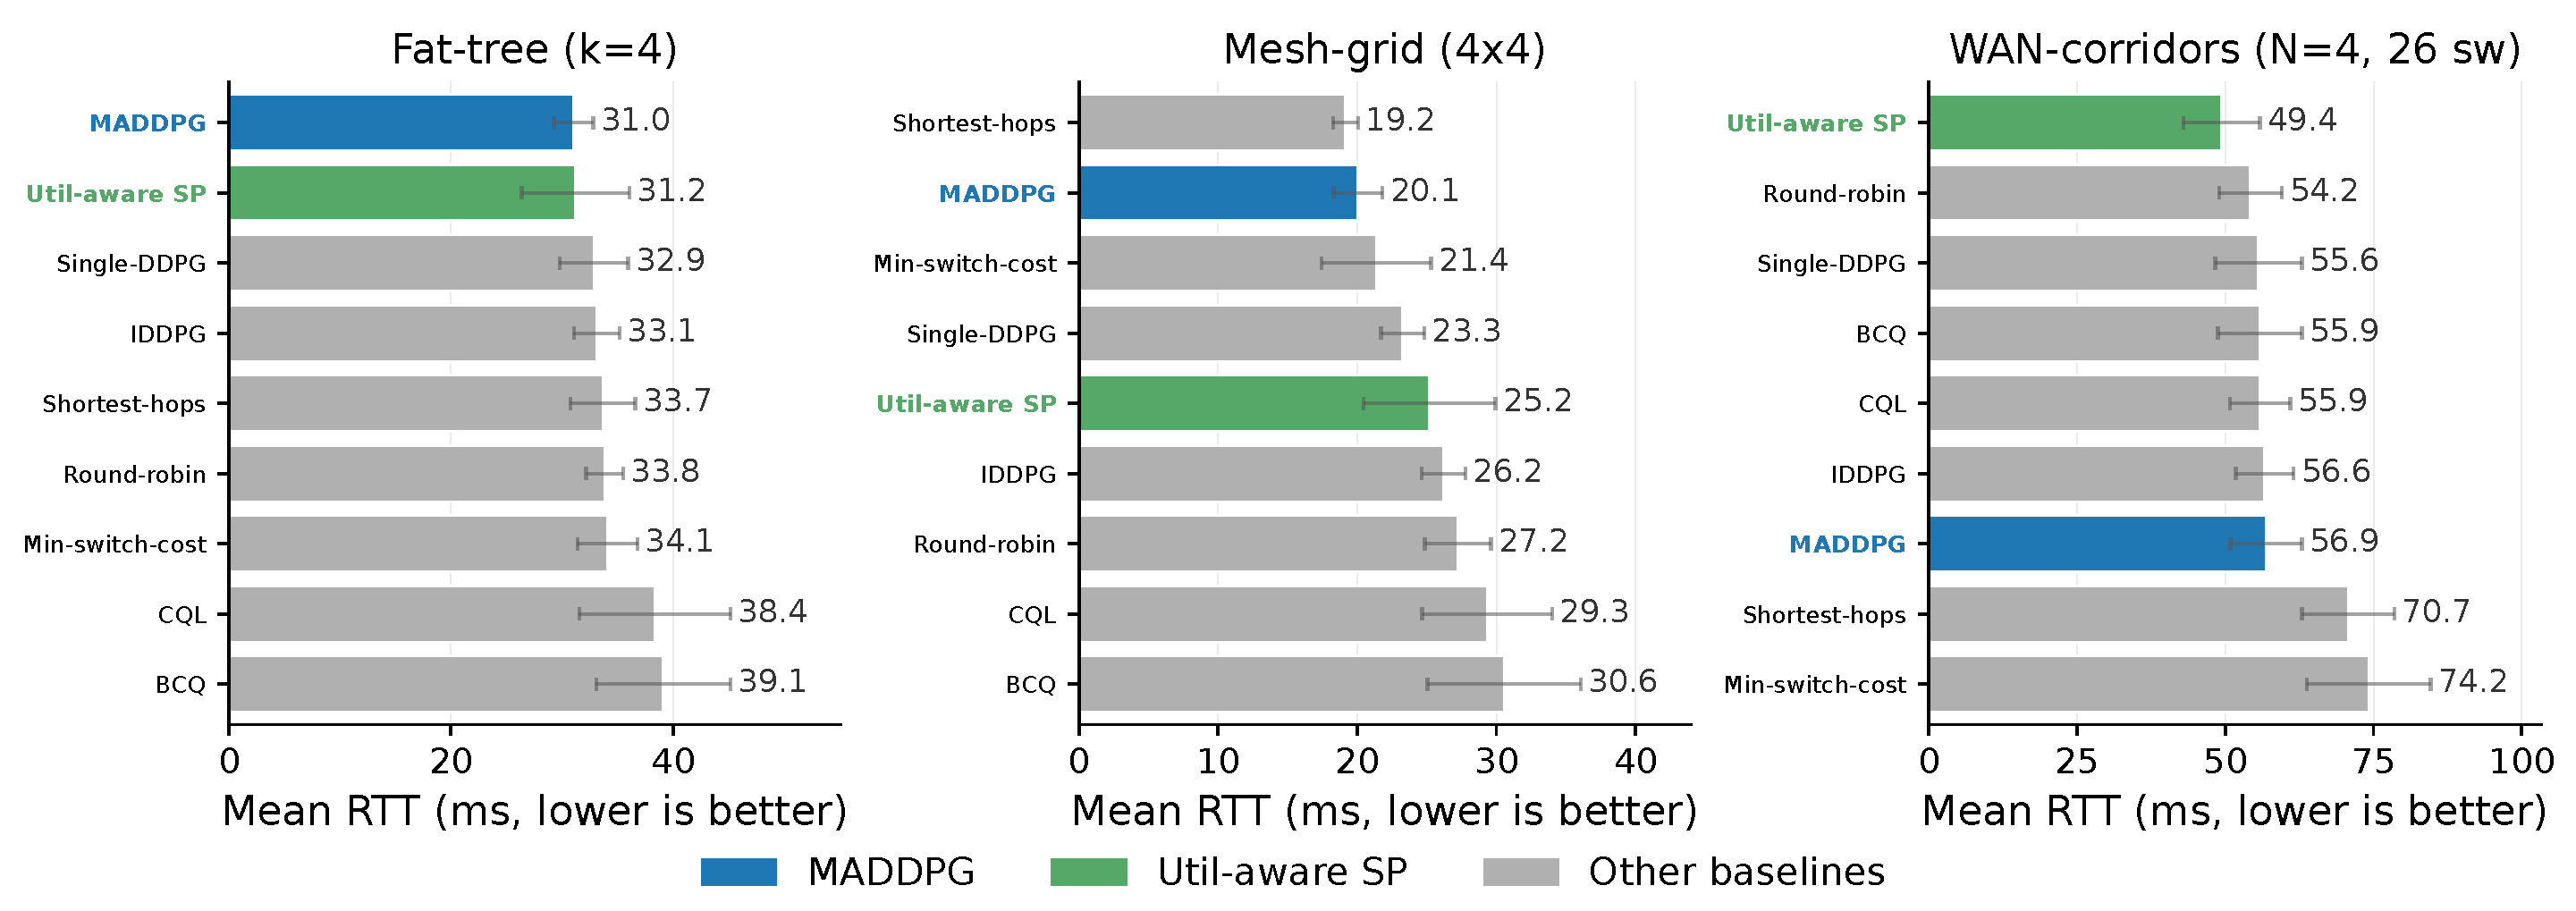
Figure 6.
Mean end-to-end RTT under the validated-profile setting on the fat-tree, mesh-grid, and WAN-corridors topologies. Values are averaged over ten matched seeds; lower RTT is better. MADDPG and Util-aware SP are highlighted, while the remaining policies are shown as comparison policies.
Figure 6.
Mean end-to-end RTT under the validated-profile setting on the fat-tree, mesh-grid, and WAN-corridors topologies. Values are averaged over ten matched seeds; lower RTT is better. MADDPG and Util-aware SP are highlighted, while the remaining policies are shown as comparison policies.
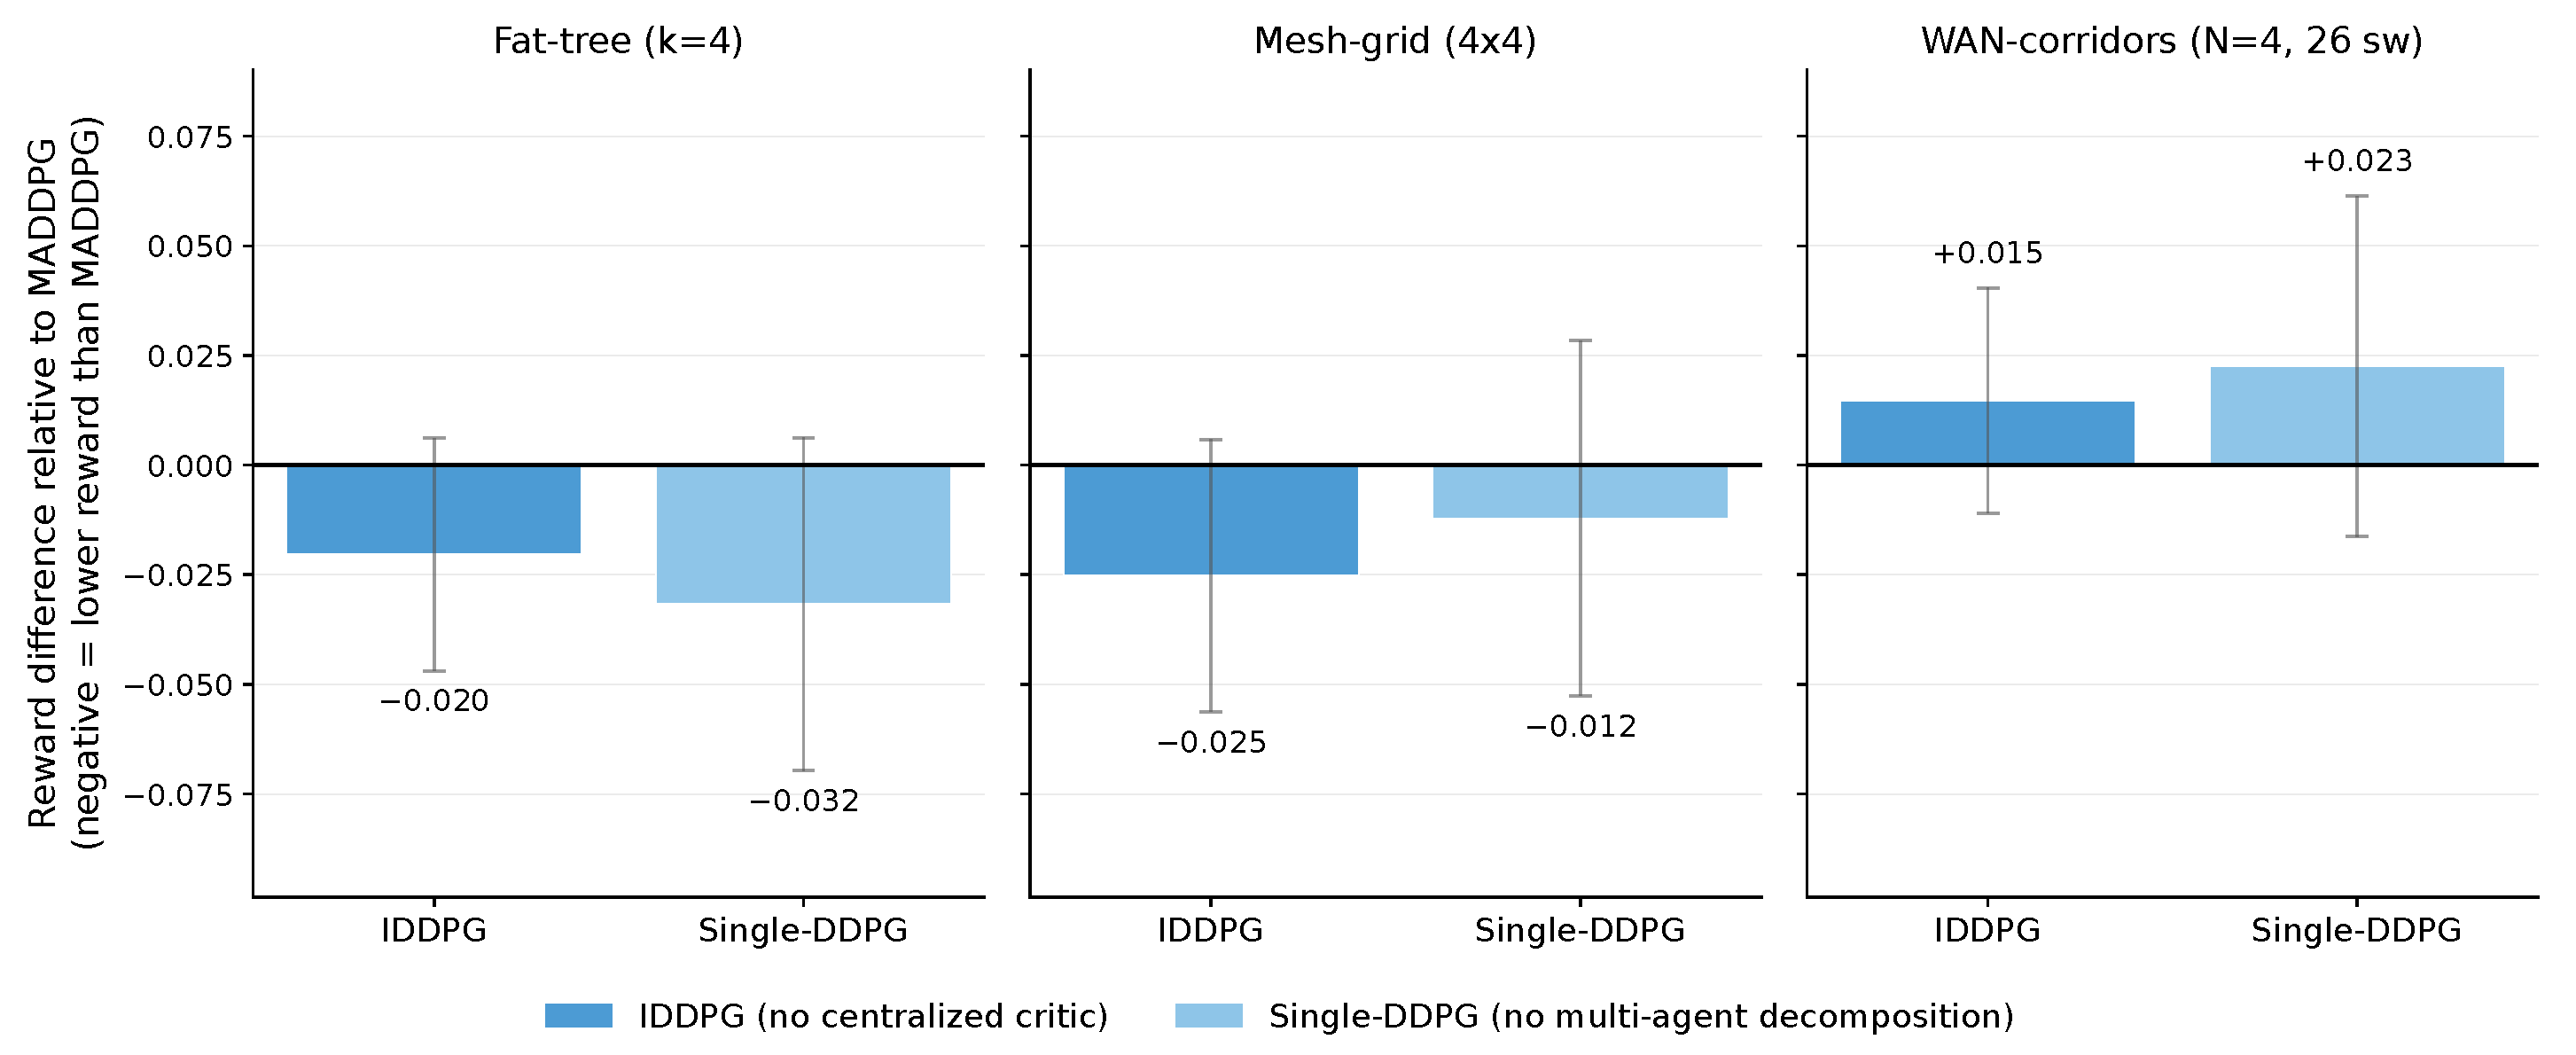
Figure 7.
Implementation-level architectural comparisons under the validated-profile setting. Bars show the mean paired reward difference relative to MADDPG over ten matched seeds, and error bars show one standard deviation of the paired differences. Negative values indicate lower reward than MADDPG. IDDPG uses independent traffic-pair critics, whereas Single-DDPG uses one joint controller; target-projection settings are not matched on fat-tree and mesh-grid.
Figure 7.
Implementation-level architectural comparisons under the validated-profile setting. Bars show the mean paired reward difference relative to MADDPG over ten matched seeds, and error bars show one standard deviation of the paired differences. Negative values indicate lower reward than MADDPG. IDDPG uses independent traffic-pair critics, whereas Single-DDPG uses one joint controller; target-projection settings are not matched on fat-tree and mesh-grid.
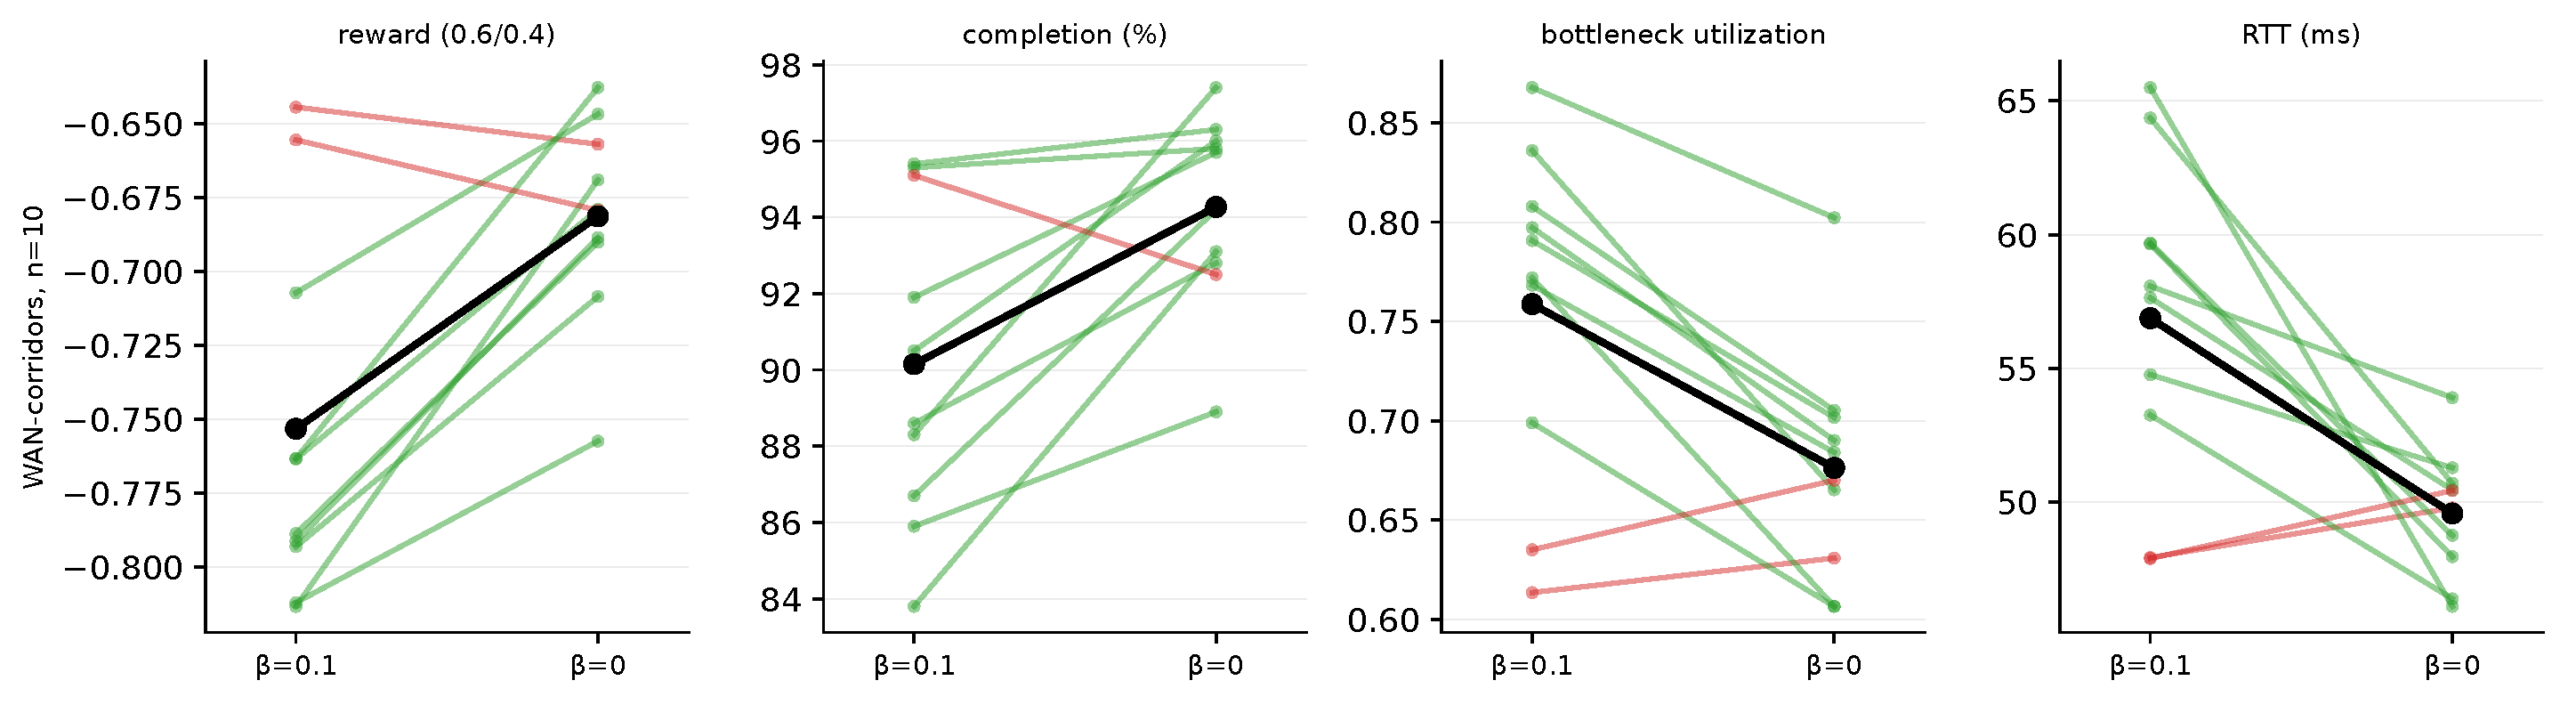
Figure 8.
Paired WAN-corridors comparison of MADDPG with the selected behavior-adjustment weight and with the behavior-deviation reward adjustment removed, . Thin lines connect matched seeds, and the black line shows the mean. Green lines denote seeds that moved in the preferred direction of the plotted metric, and red lines denote seeds that did not. Higher reward and completion are better, whereas lower bottleneck utilization and RTT are better. Target projection is enabled for both variants.
Figure 8.
Paired WAN-corridors comparison of MADDPG with the selected behavior-adjustment weight and with the behavior-deviation reward adjustment removed, . Thin lines connect matched seeds, and the black line shows the mean. Green lines denote seeds that moved in the preferred direction of the plotted metric, and red lines denote seeds that did not. Higher reward and completion are better, whereas lower bottleneck utilization and RTT are better. Target projection is enabled for both variants.
Figure 9.
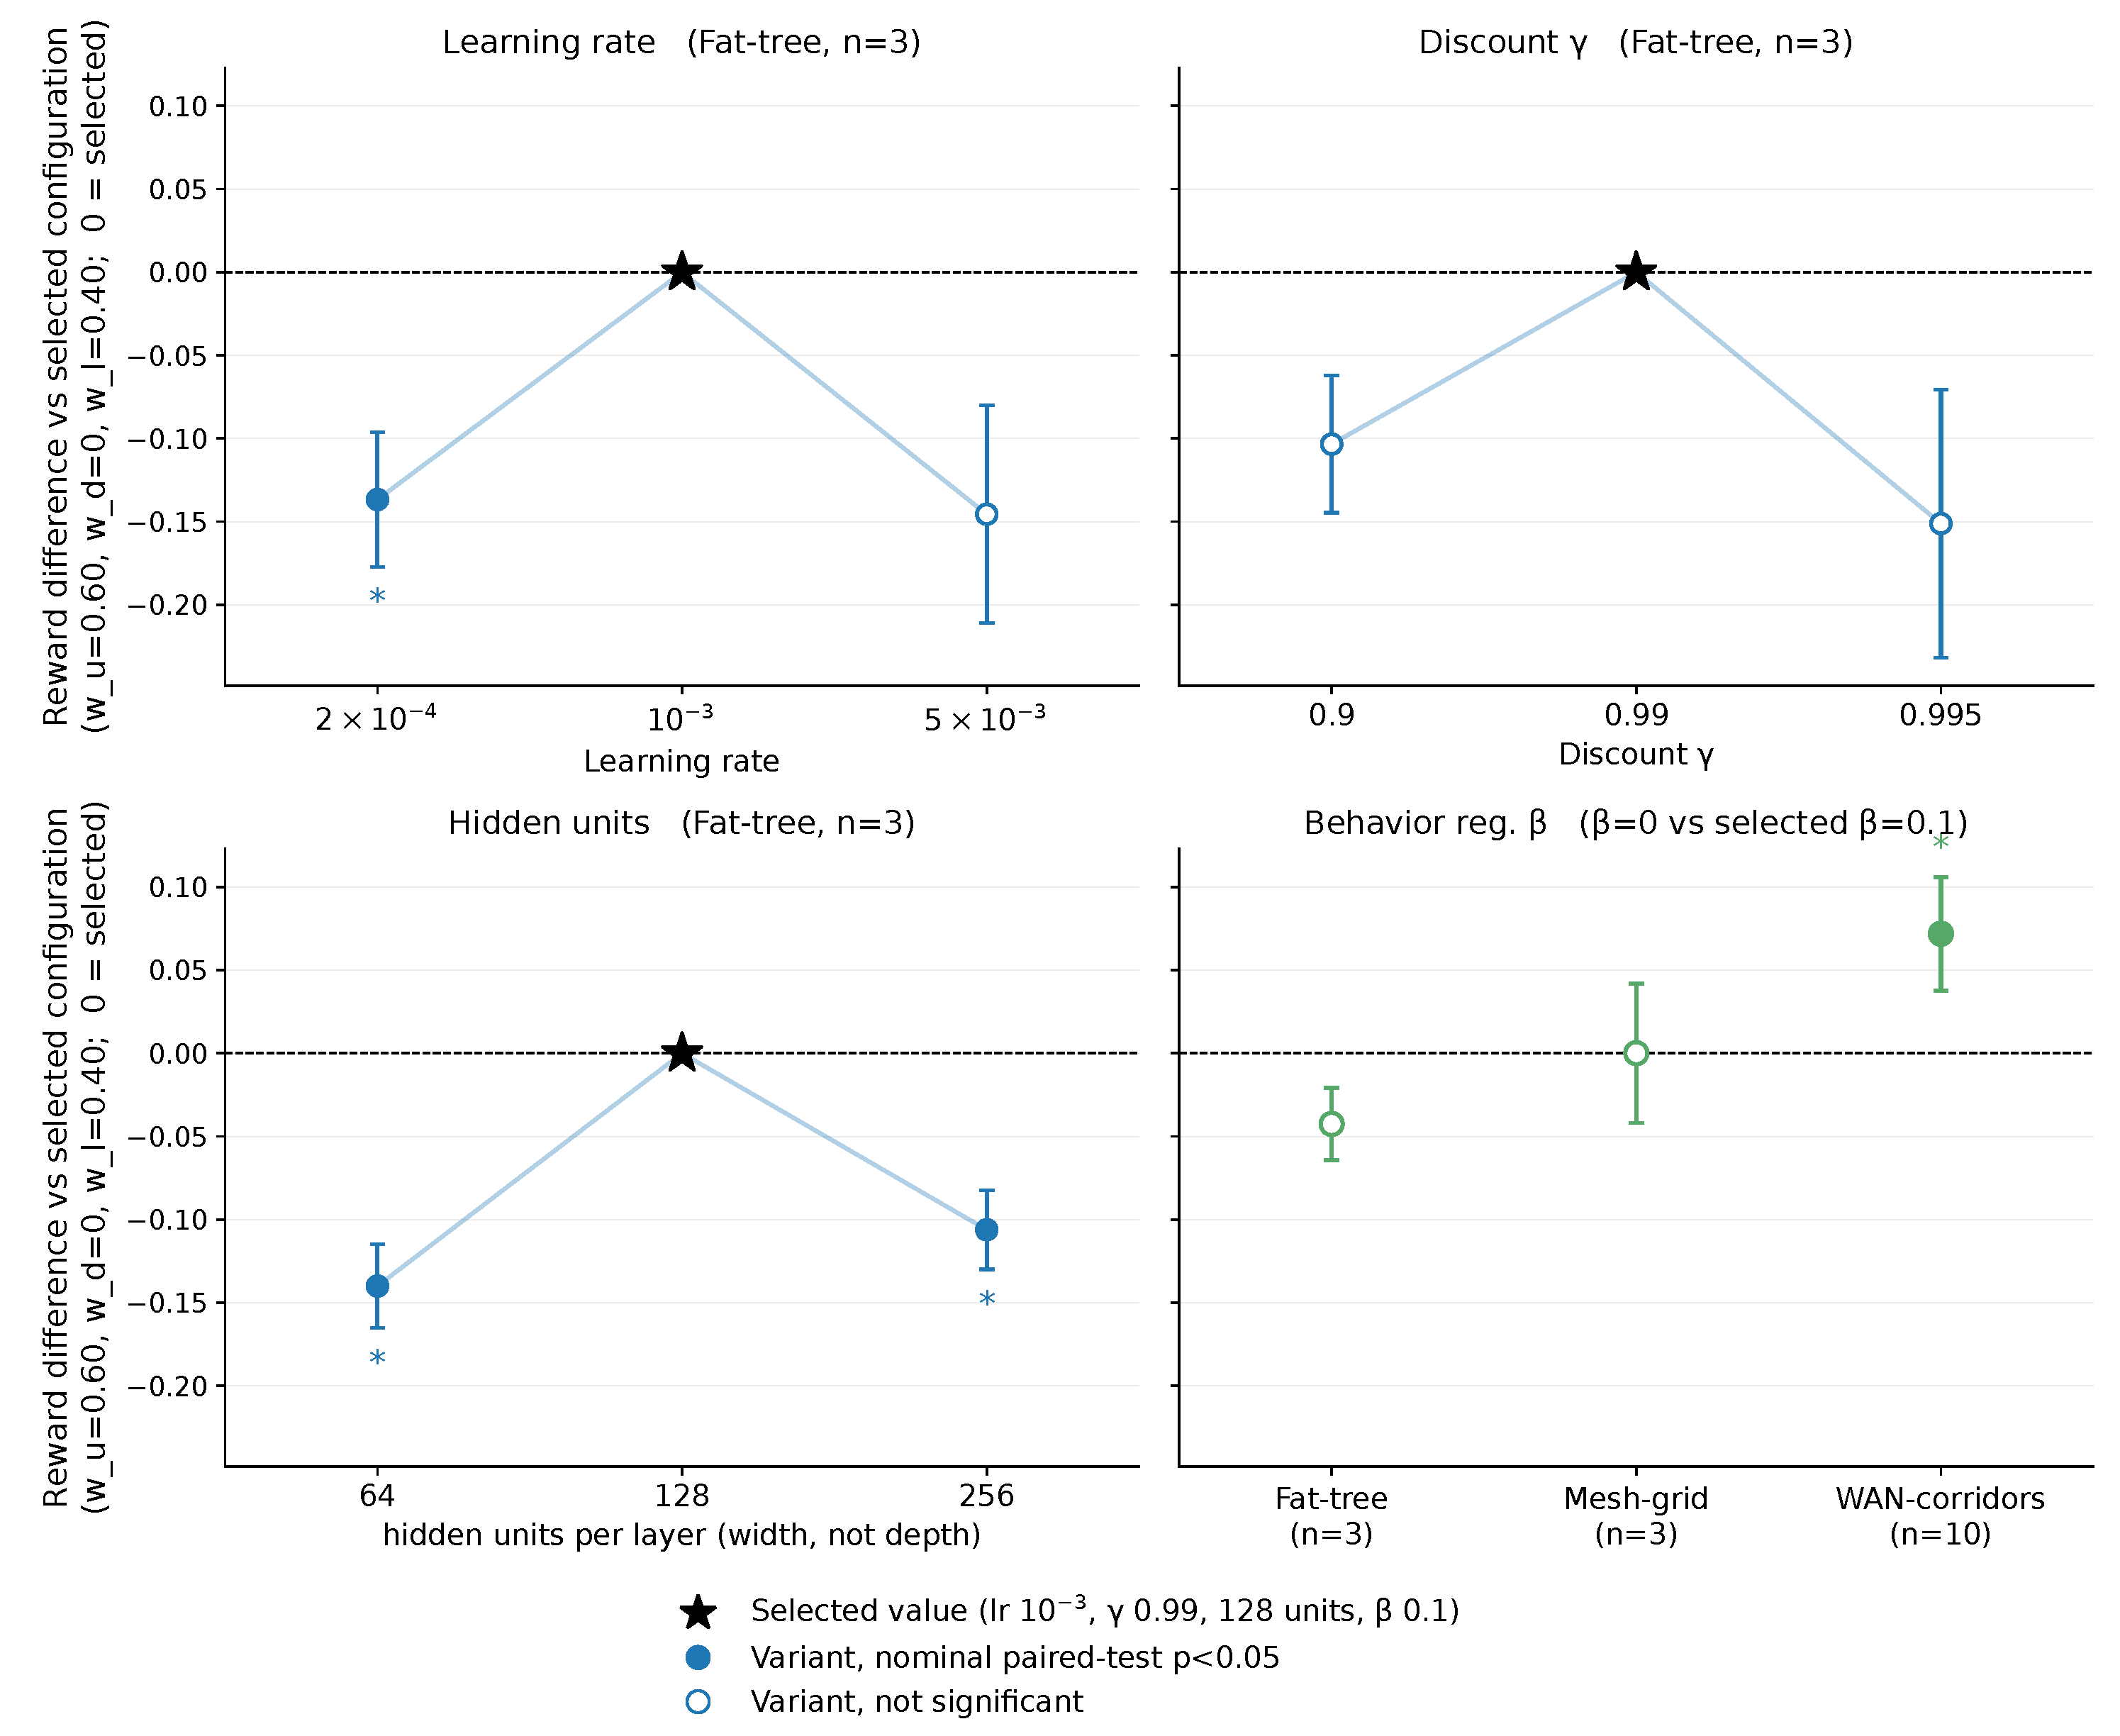
Sensitivity of MADDPG to learning rate, discount factor, hidden-layer width, and behavior-adjustment weight. Values show the paired reward difference relative to the selected configuration under , , and . A value of zero denotes the selected configuration. The black star marks the selected configuration in each panel. Filled markers with an asterisk indicate a nominal two-sided paired t-test result of .
Figure 9.
Sensitivity of MADDPG to learning rate, discount factor, hidden-layer width, and behavior-adjustment weight. Values show the paired reward difference relative to the selected configuration under , , and . A value of zero denotes the selected configuration. The black star marks the selected configuration in each panel. Filled markers with an asterisk indicate a nominal two-sided paired t-test result of .
Figure 10.
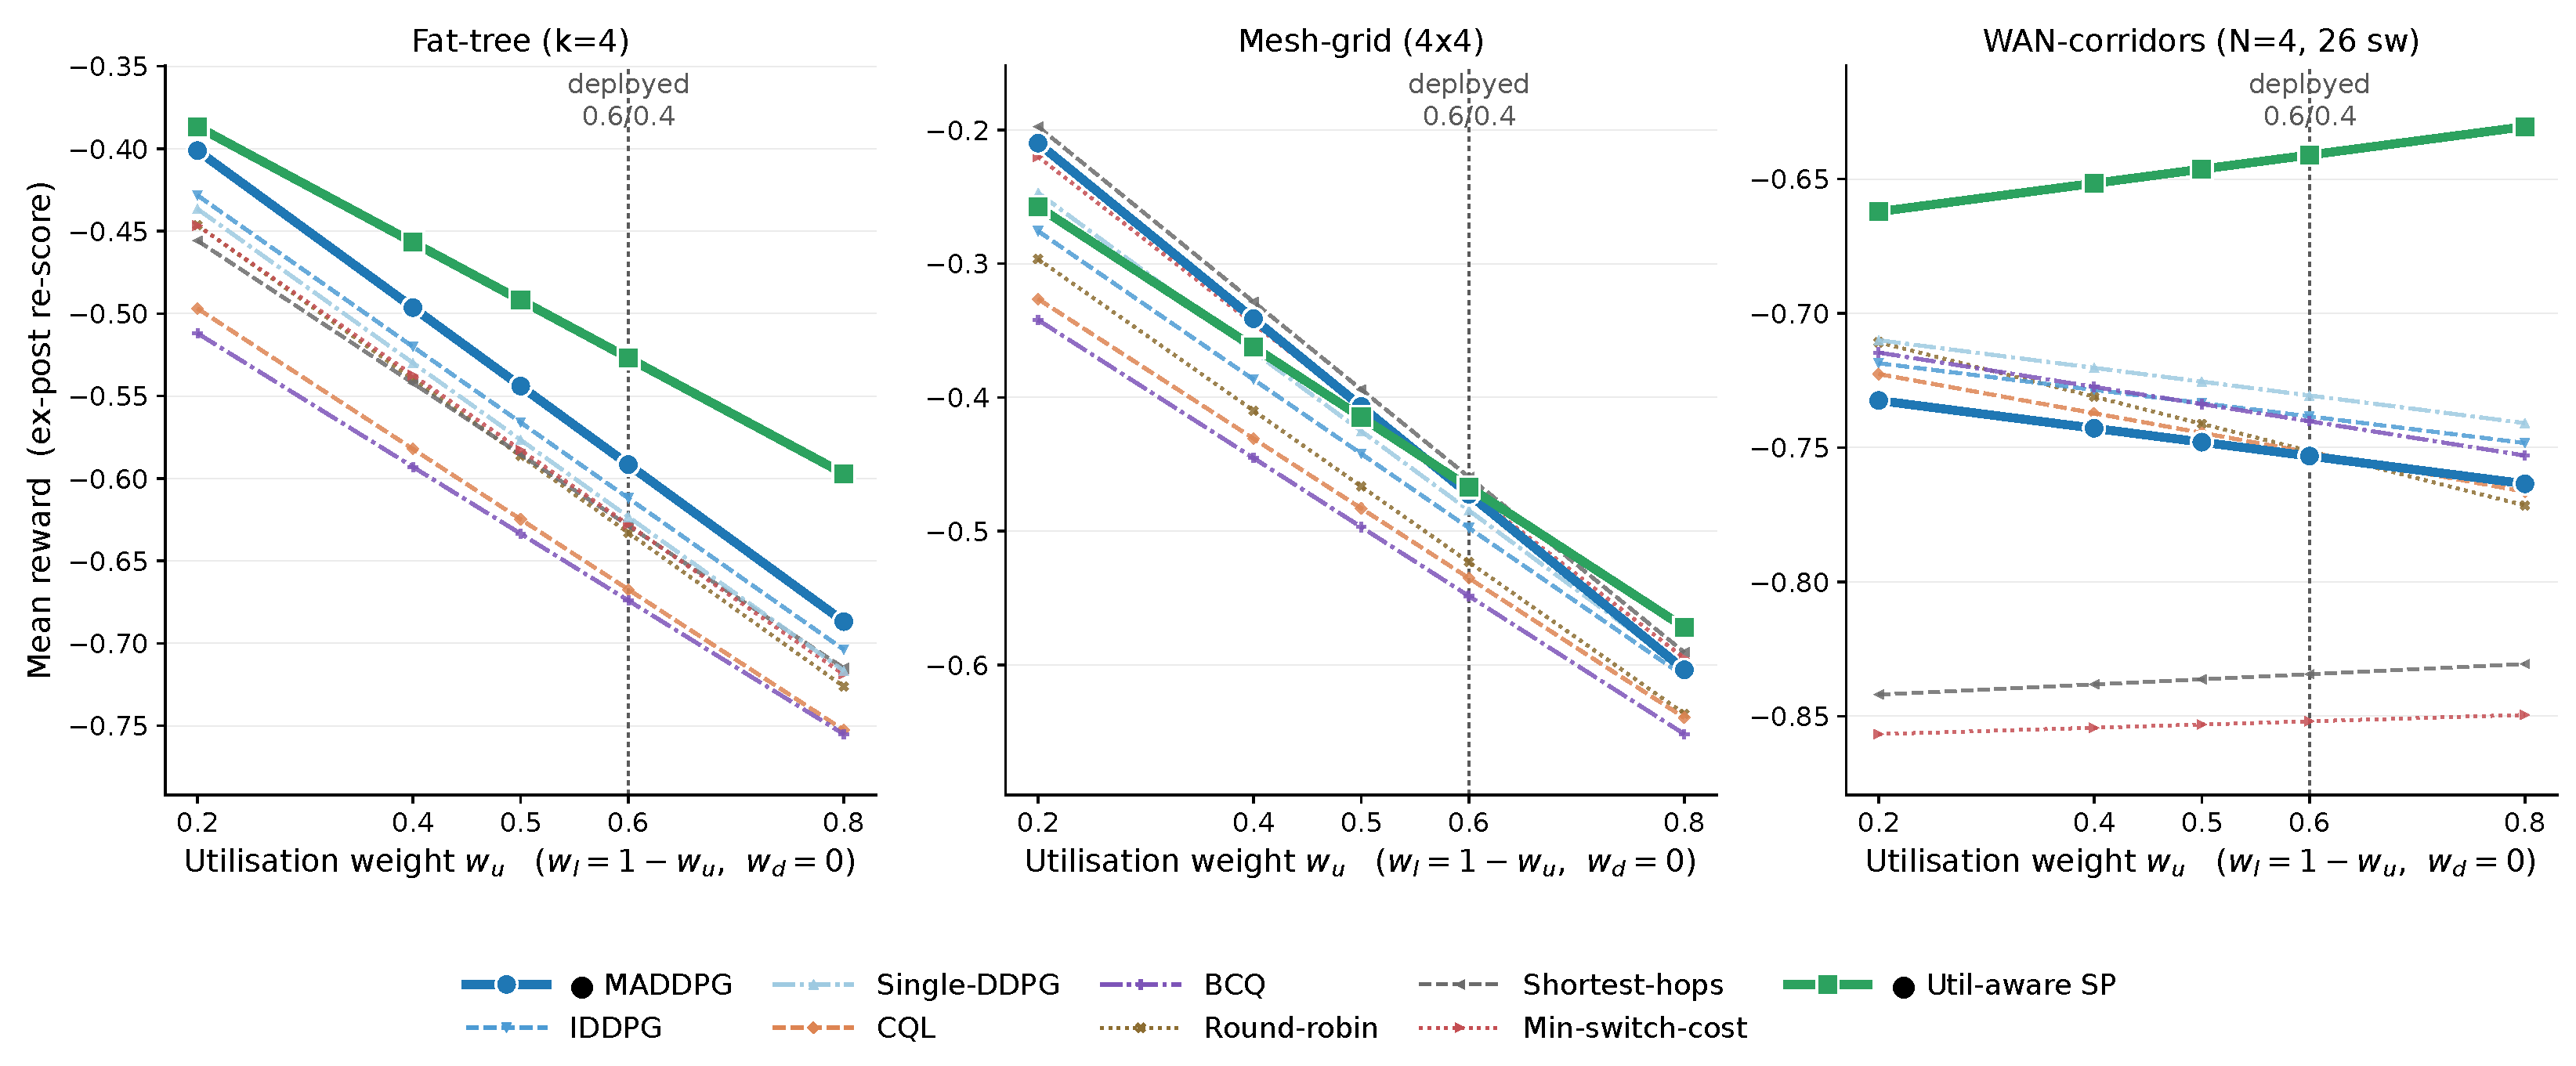
Reward-weight sensitivity under ex post re-scoring of the validated-profile trajectories. The utilization weight is varied while and . The deployed configuration is . All nine policies are evaluated on the fat-tree, mesh-grid, and WAN-corridors topologies; higher reward is better.
Figure 10.
Reward-weight sensitivity under ex post re-scoring of the validated-profile trajectories. The utilization weight is varied while and . The deployed configuration is . All nine policies are evaluated on the fat-tree, mesh-grid, and WAN-corridors topologies; higher reward is better.
Figure 11.
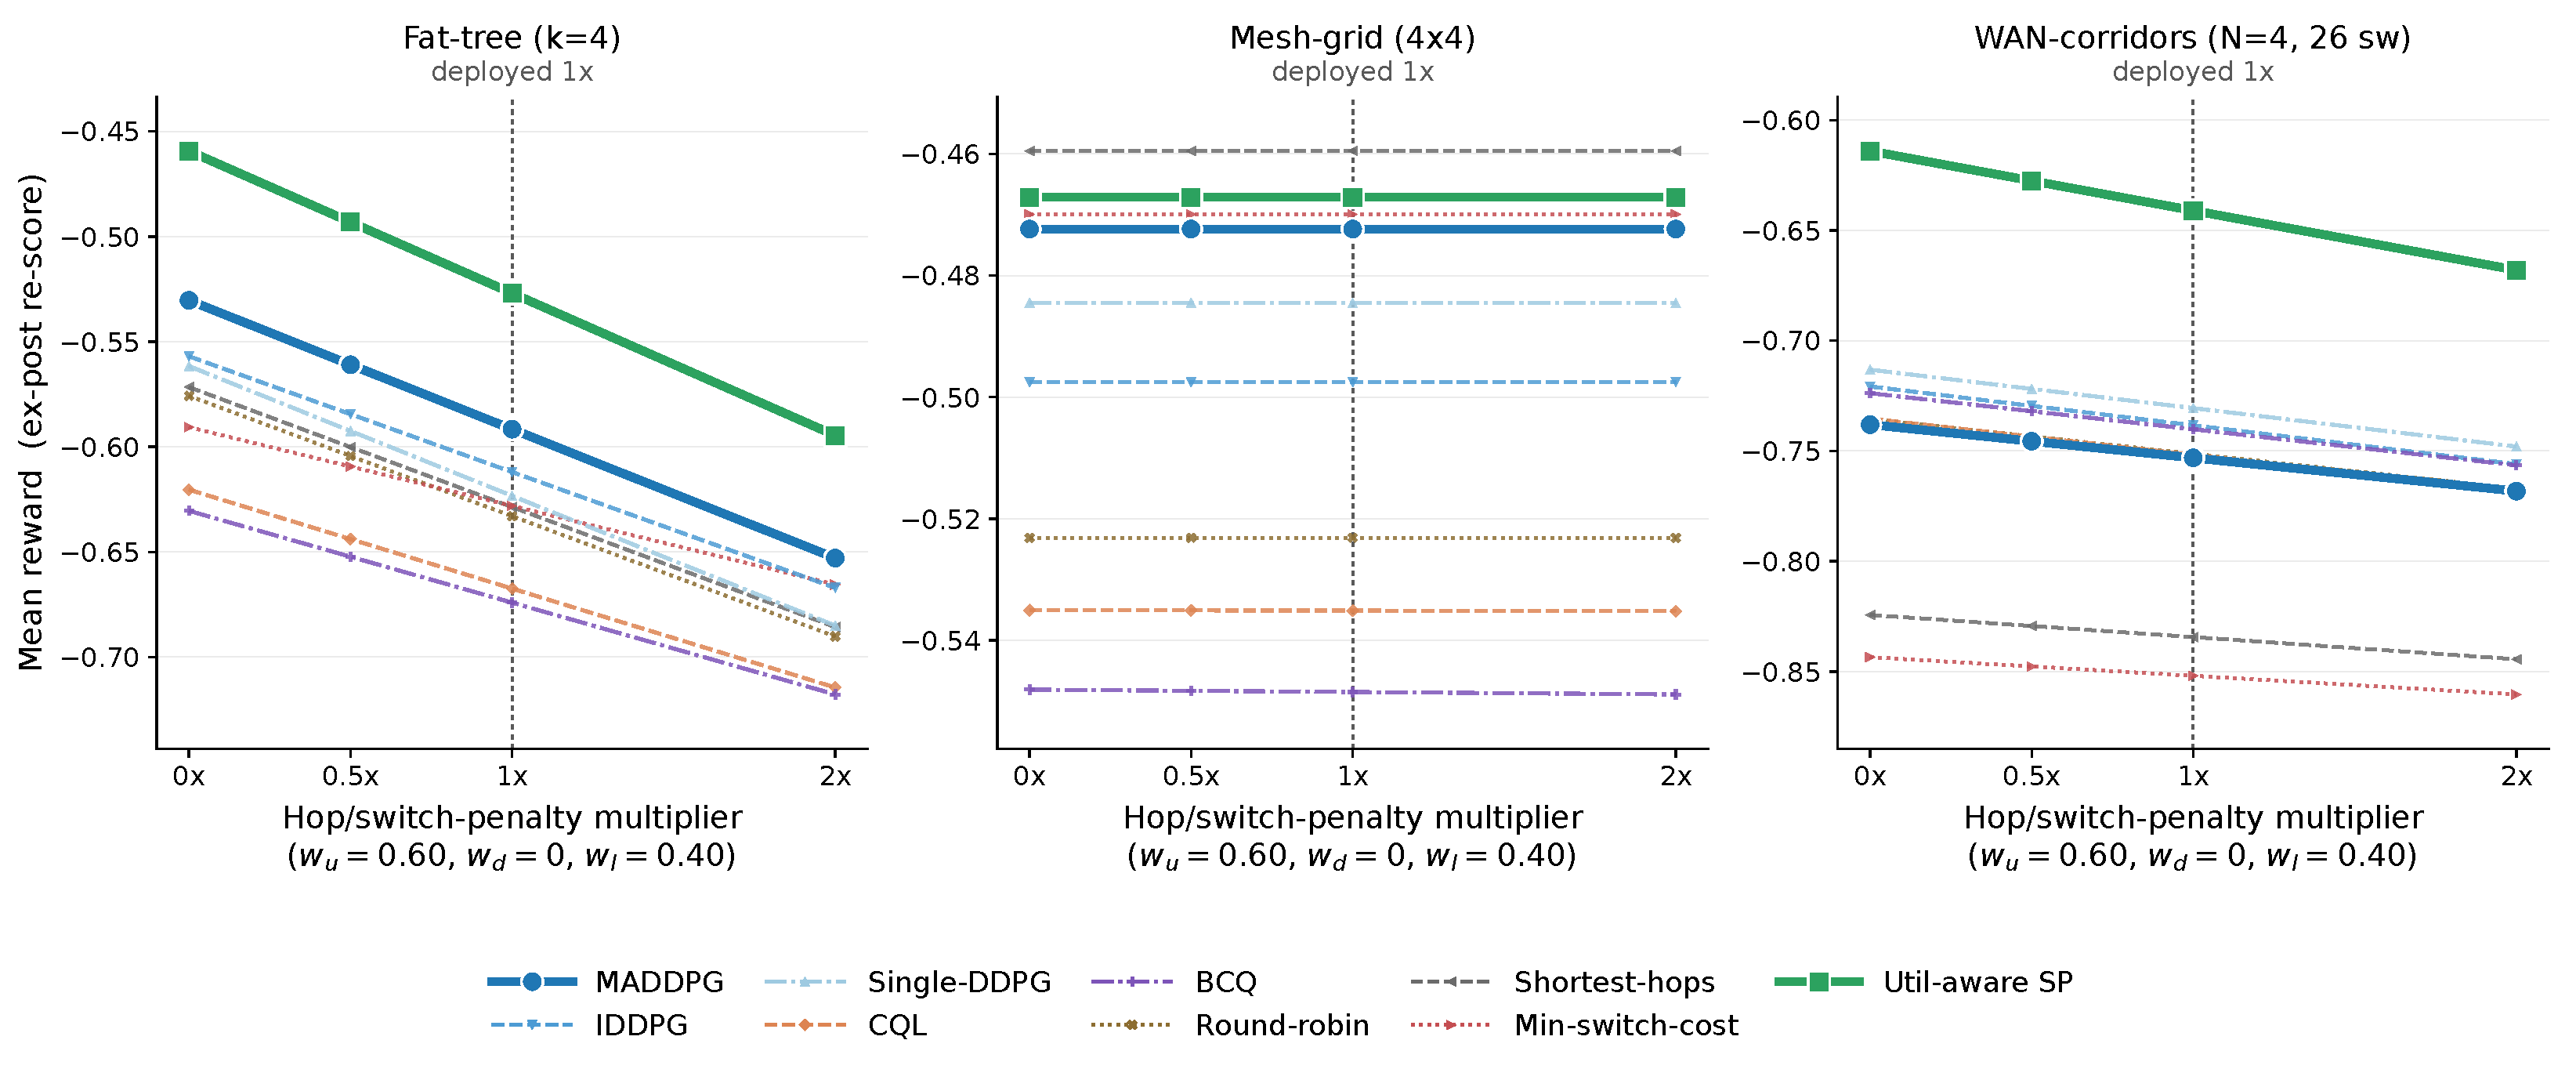
Hop/switch-penalty sensitivity under ex post re-scoring of the validated-profile trajectories. The reward weights remain fixed at , , and , while the realized penalty is scaled from to . The deployed configuration is . All nine policies are evaluated on the fat-tree, mesh-grid, and WAN-corridors topologies; higher reward is better.
Figure 11.
Hop/switch-penalty sensitivity under ex post re-scoring of the validated-profile trajectories. The reward weights remain fixed at , , and , while the realized penalty is scaled from to . The deployed configuration is . All nine policies are evaluated on the fat-tree, mesh-grid, and WAN-corridors topologies; higher reward is better.
Figure 12.
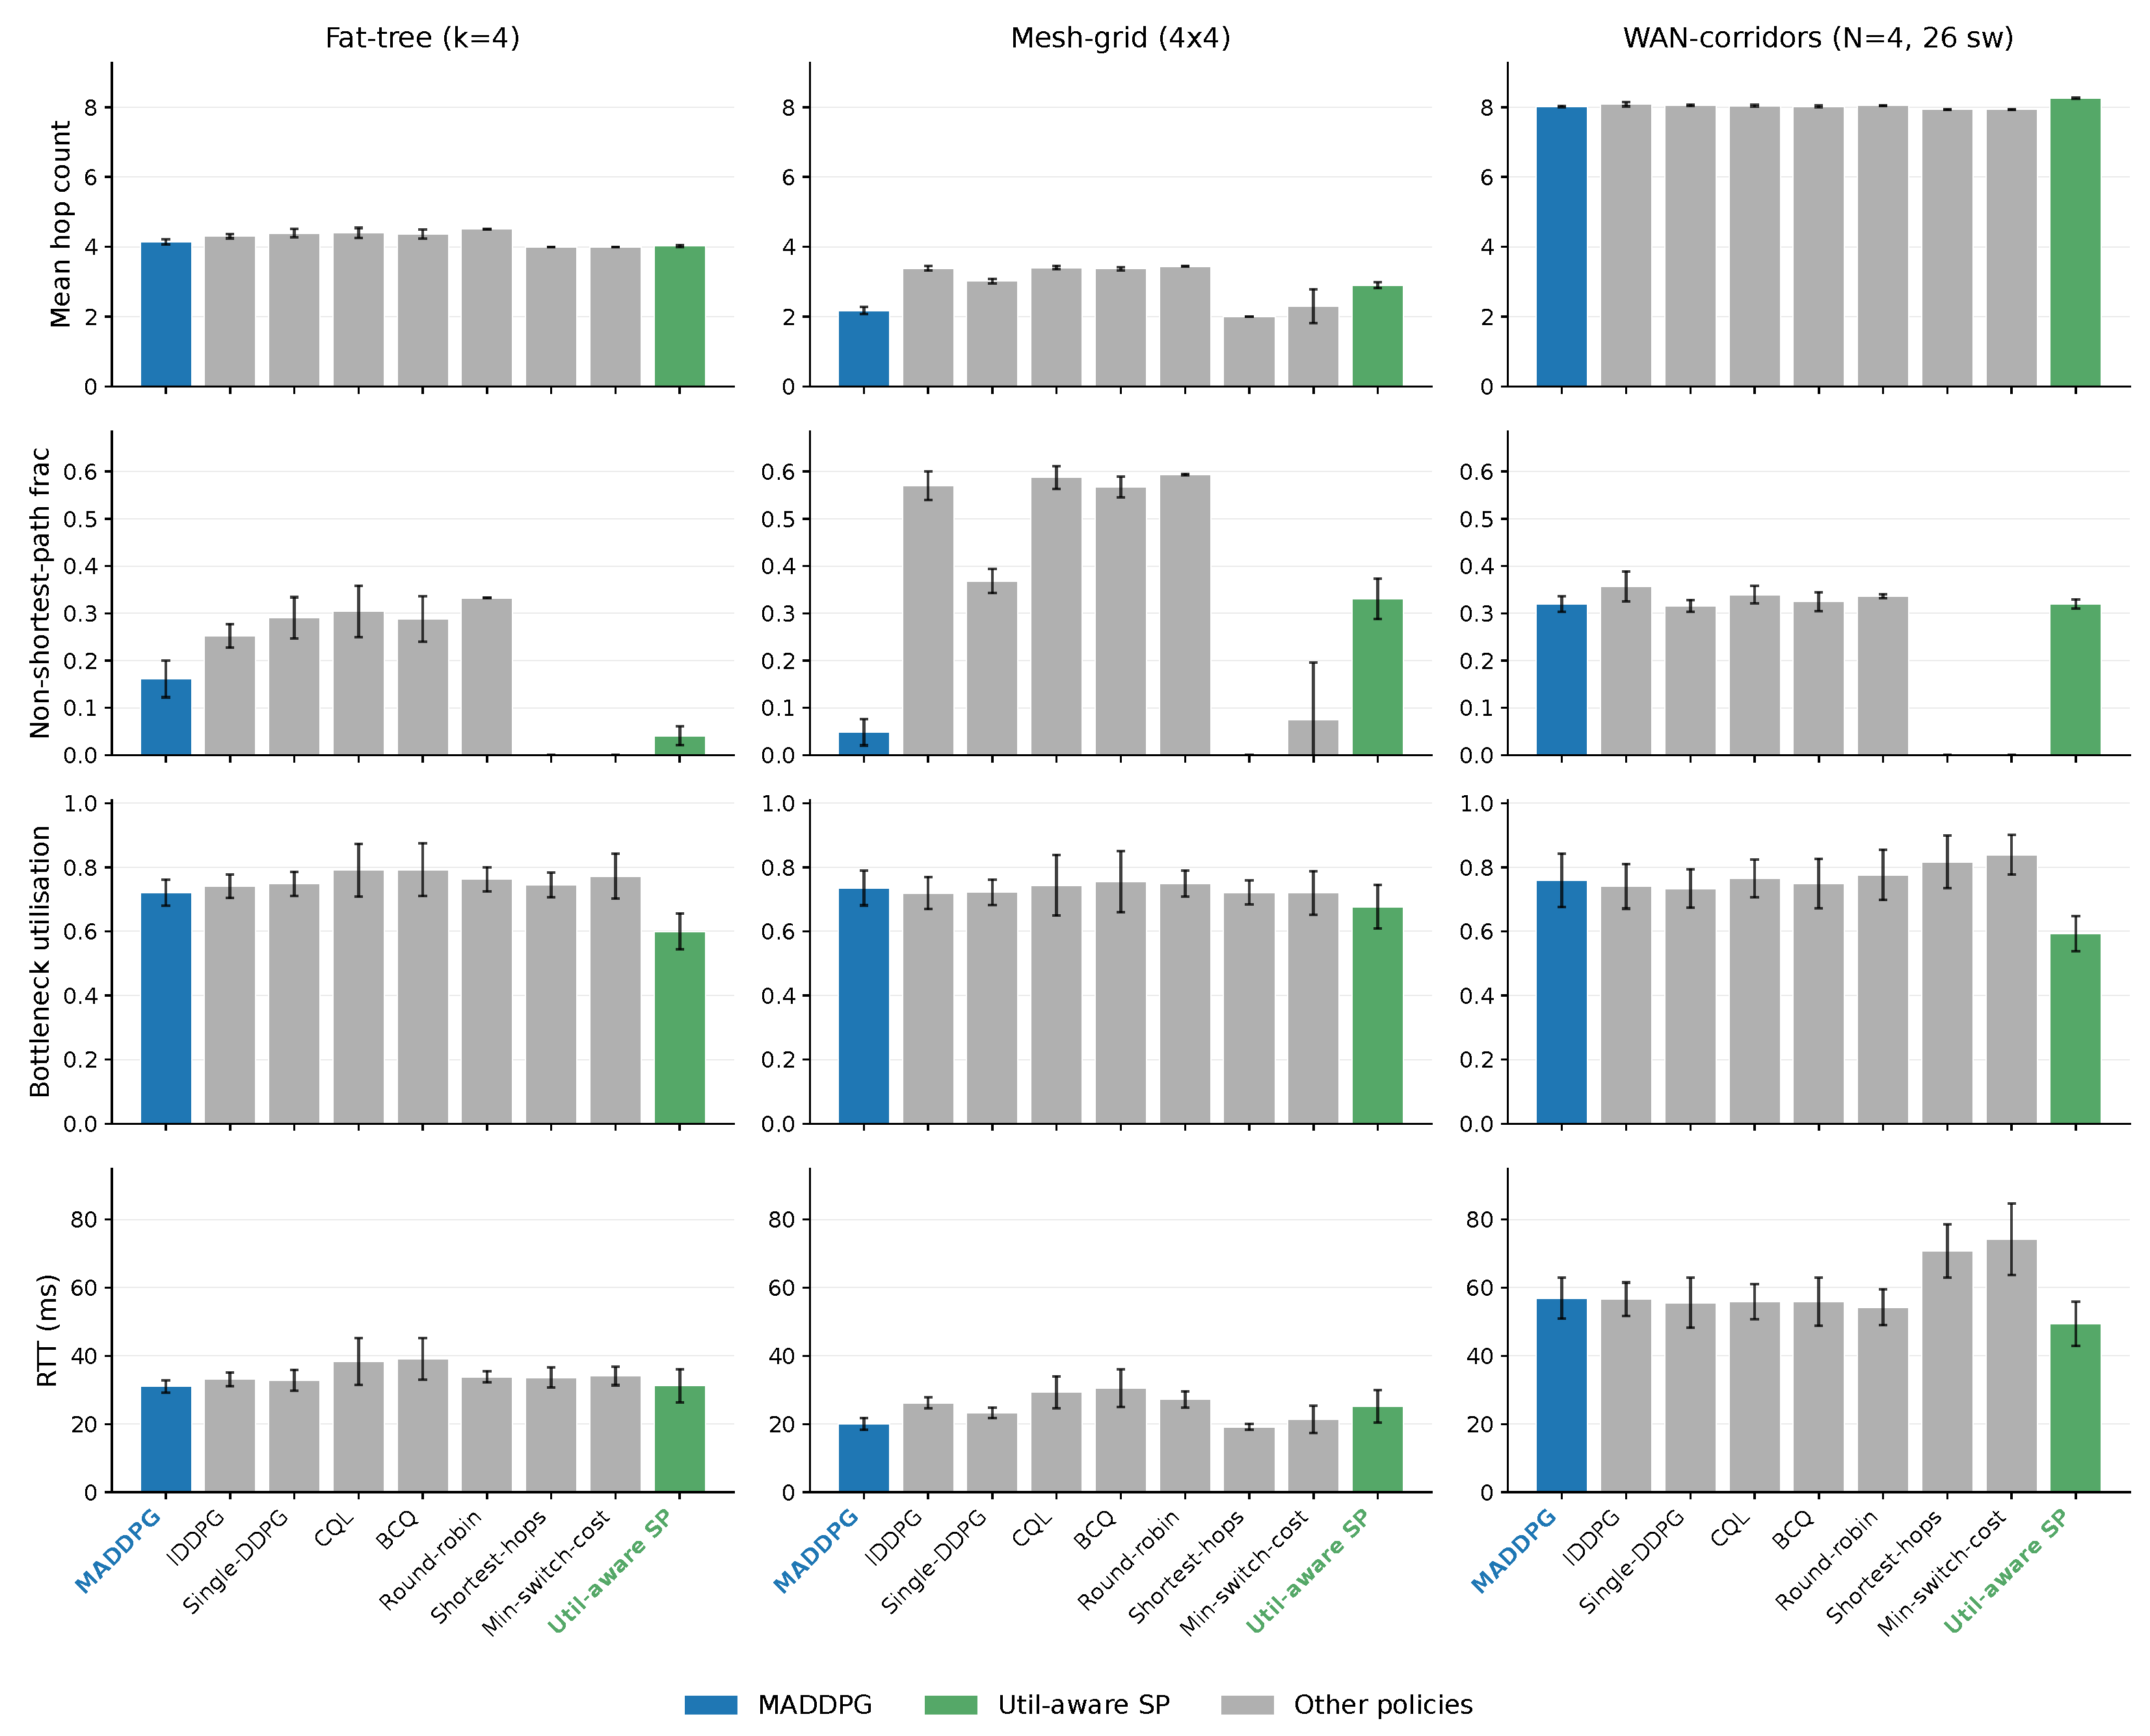
Policy-behavior metrics under the validated-profile setting on the fat-tree, mesh-grid, and WAN-corridors topologies. Bars show means over ten matched seeds and error bars show one standard deviation. The rows report mean hop count, longer-than-minimum-hop selection fraction, bottleneck utilization, and RTT. Lower values are preferable except where additional path diversity intentionally supports congestion avoidance.
Figure 12.
Policy-behavior metrics under the validated-profile setting on the fat-tree, mesh-grid, and WAN-corridors topologies. Bars show means over ten matched seeds and error bars show one standard deviation. The rows report mean hop count, longer-than-minimum-hop selection fraction, bottleneck utilization, and RTT. Lower values are preferable except where additional path diversity intentionally supports congestion avoidance.
Figure 13.
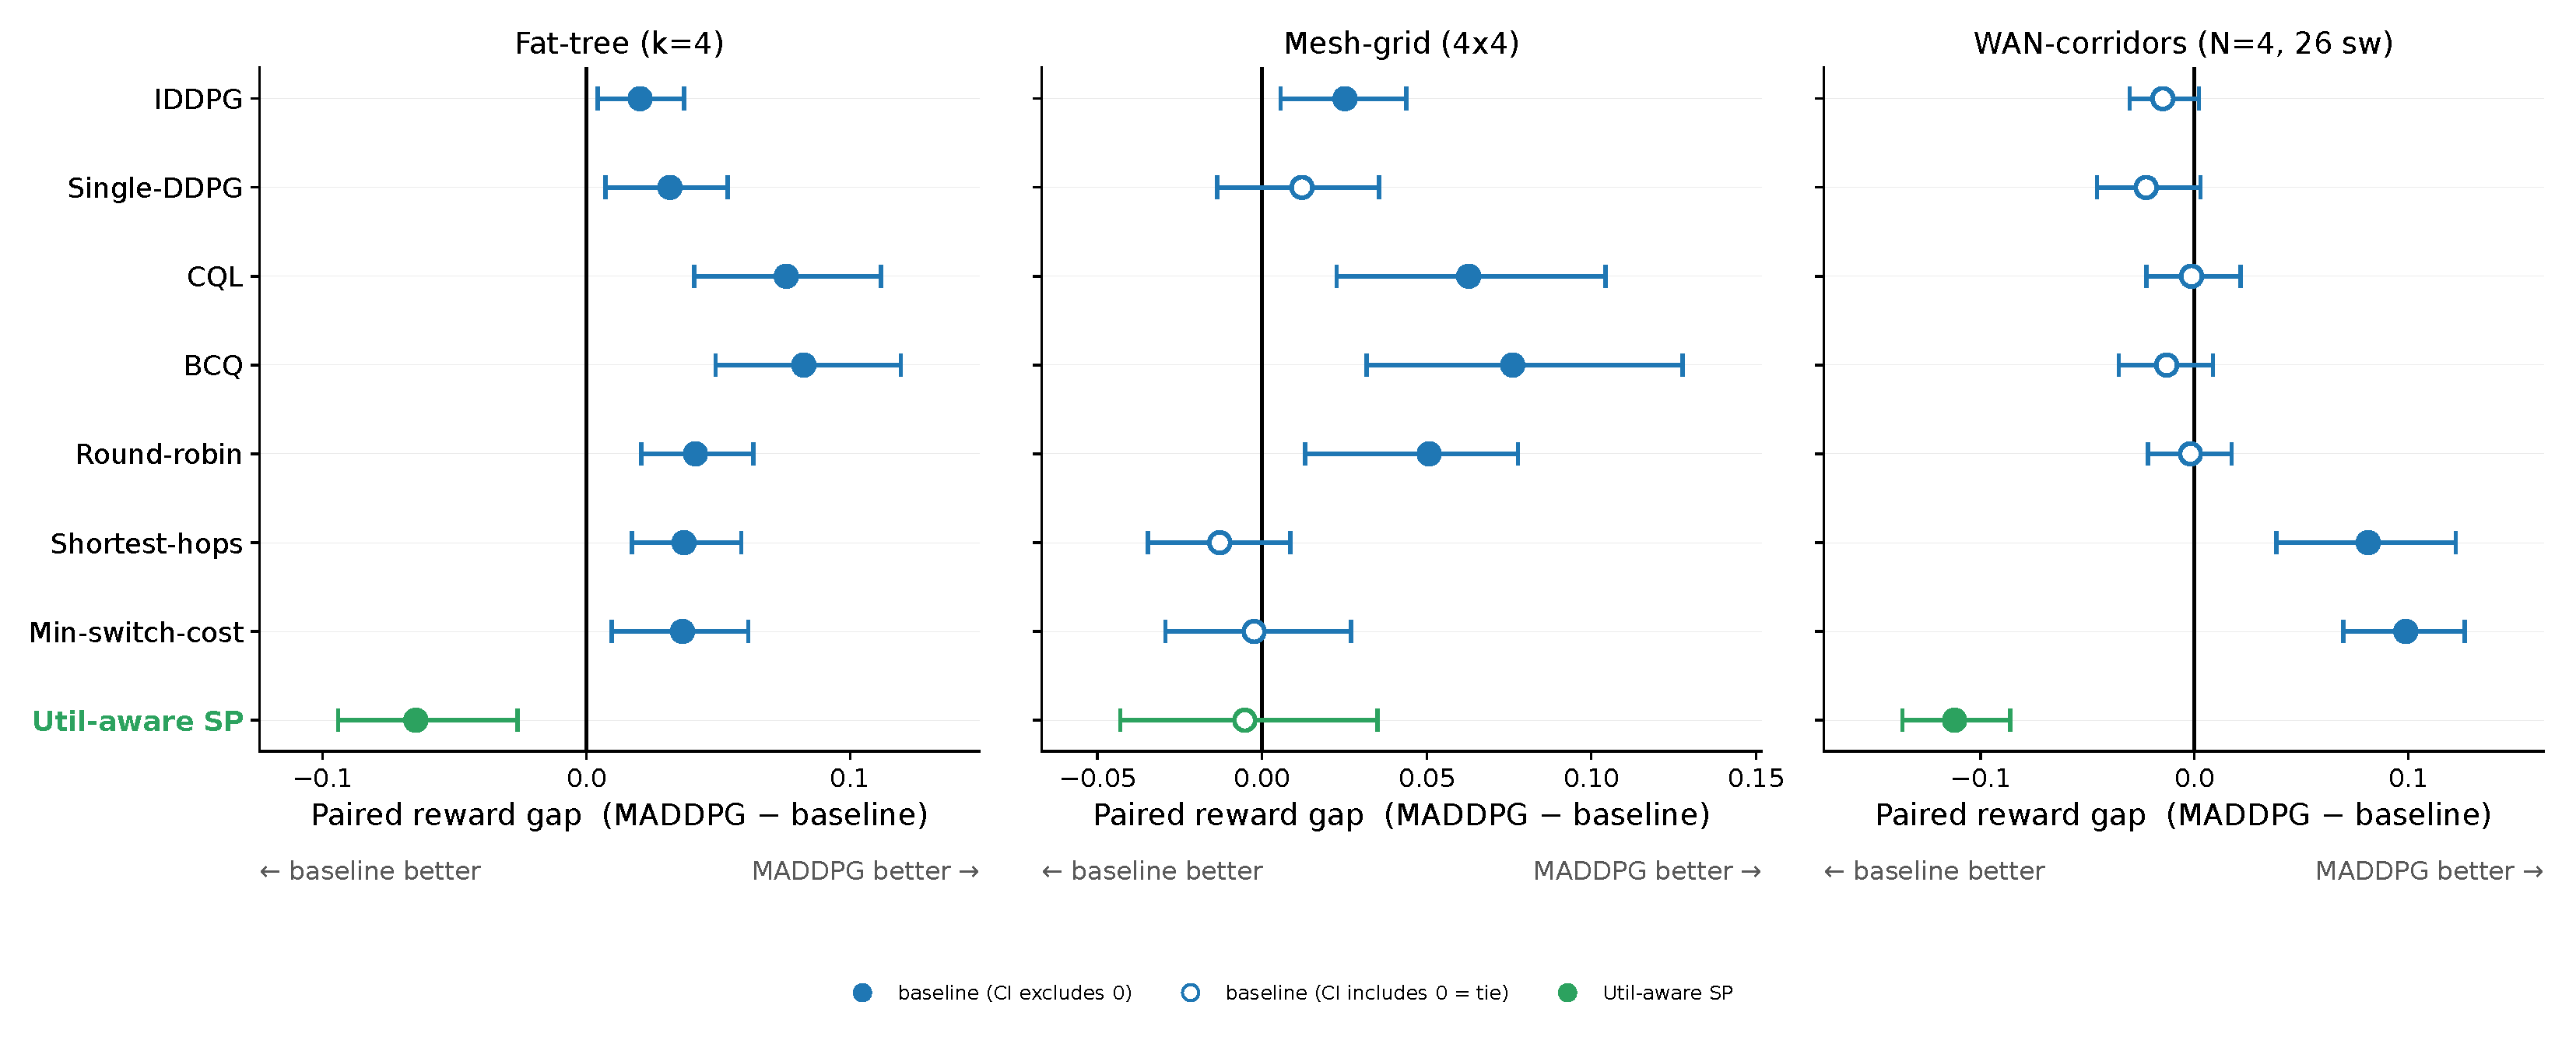
Paired reward gaps between MADDPG and each comparison policy under the validated-profile setting on the fat-tree, mesh-grid, and WAN-corridors topologies. Positive values indicate higher reward for MADDPG, while negative values indicate higher reward for the comparison policy. Error bars show bootstrap confidence intervals for the mean paired gap across ten matched seeds. Filled markers indicate intervals that exclude zero; open markers indicate intervals that include zero.
Figure 13.
Paired reward gaps between MADDPG and each comparison policy under the validated-profile setting on the fat-tree, mesh-grid, and WAN-corridors topologies. Positive values indicate higher reward for MADDPG, while negative values indicate higher reward for the comparison policy. Error bars show bootstrap confidence intervals for the mean paired gap across ten matched seeds. Filled markers indicate intervals that exclude zero; open markers indicate intervals that include zero.
Figure 14.
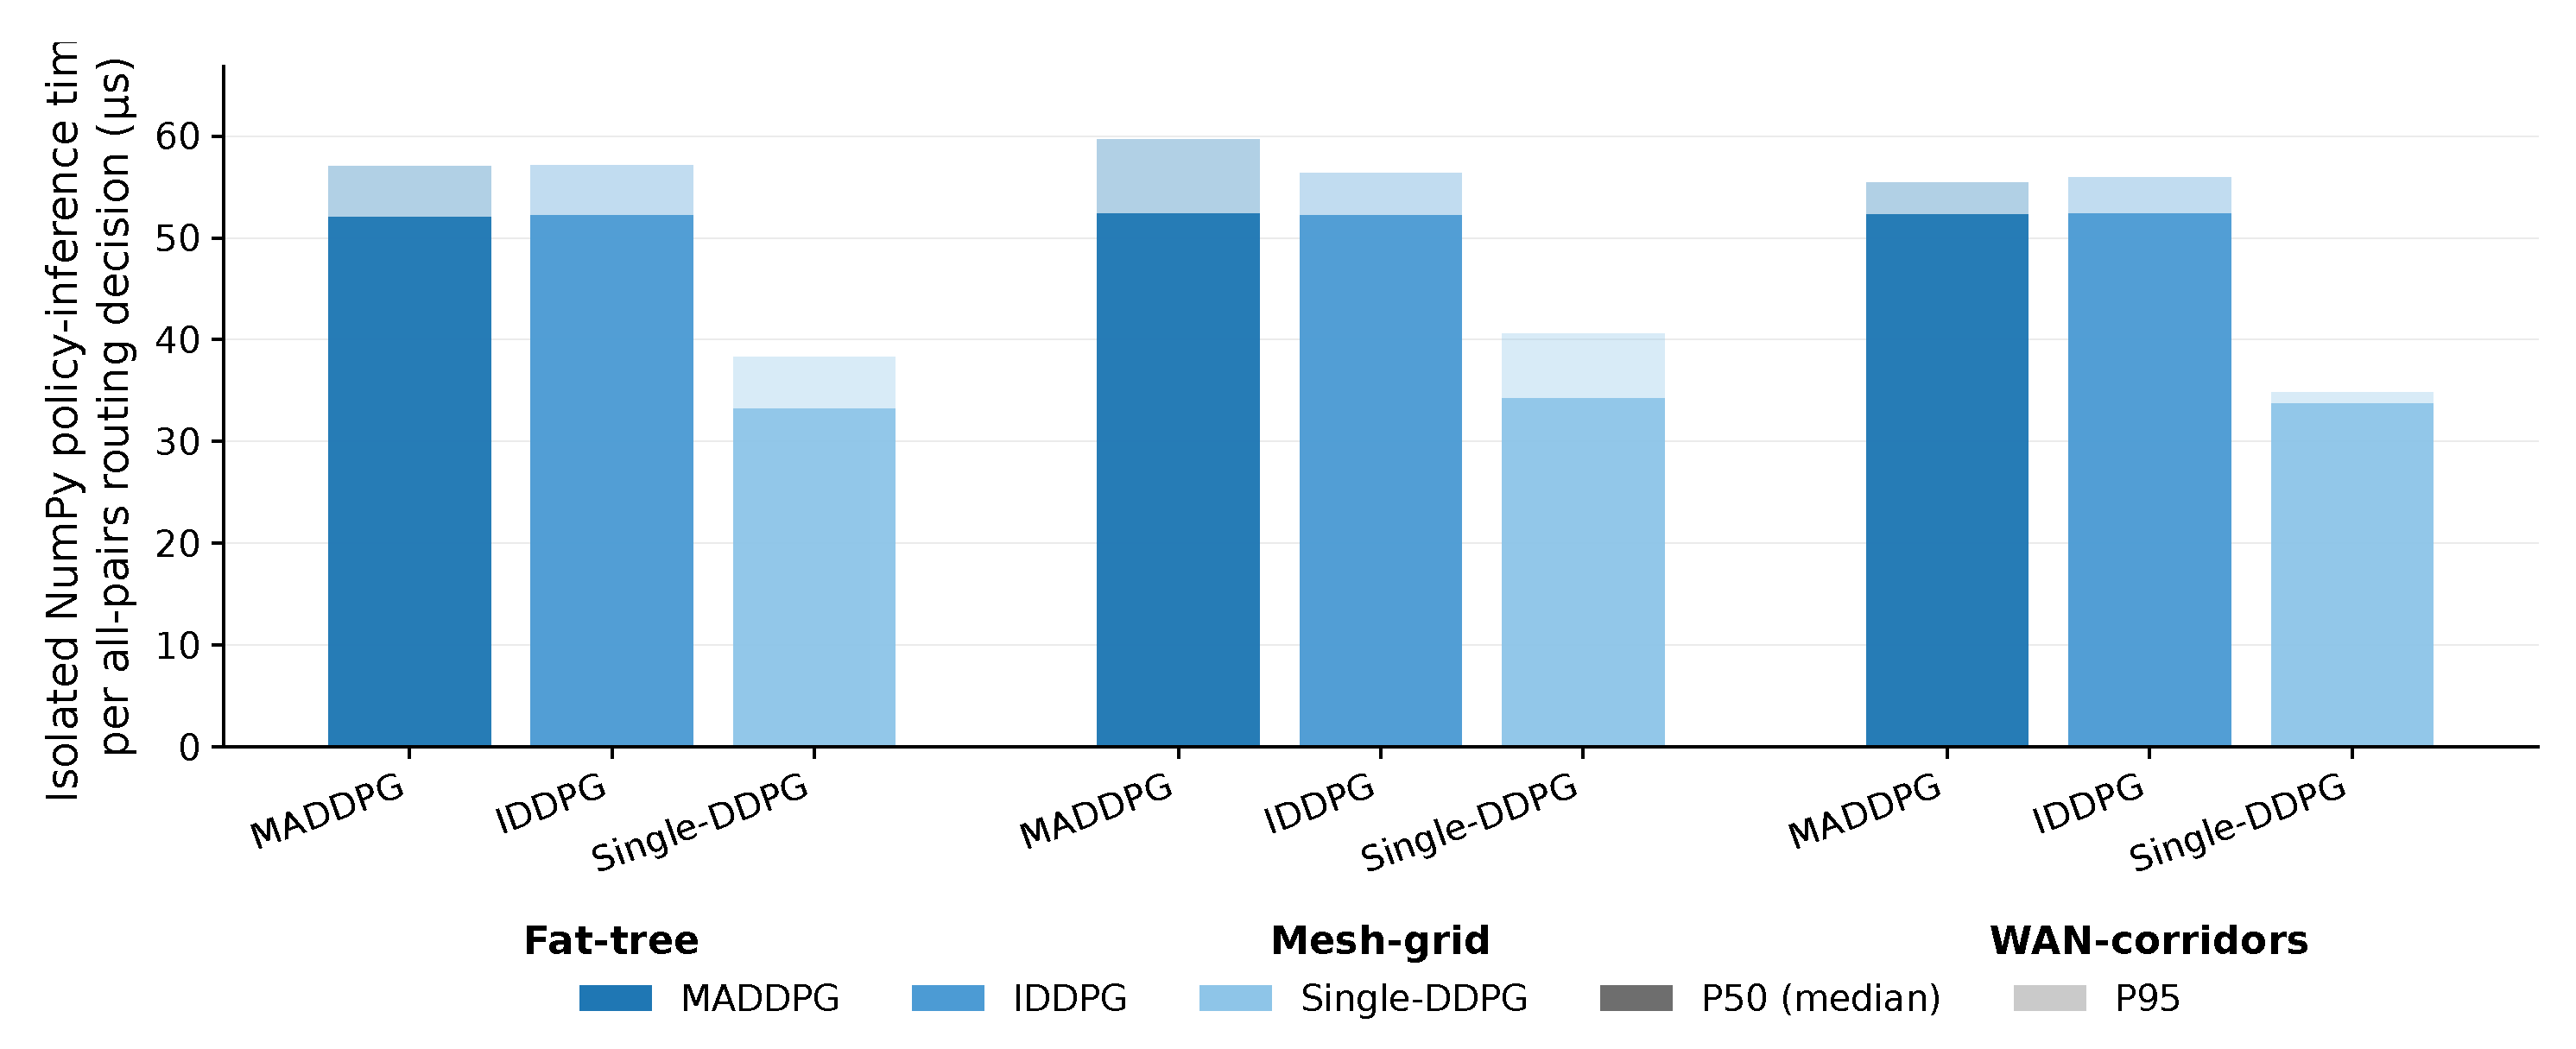
Isolated inference time of the exported NumPy policies on the fat-tree, mesh-grid, and WAN-corridors topologies. One measurement covers path selection for all controlled traffic pairs. Bars show the median and 95th-percentile times over 1500 logged decisions.
Figure 14.
Isolated inference time of the exported NumPy policies on the fat-tree, mesh-grid, and WAN-corridors topologies. One measurement covers path selection for all controlled traffic pairs. Bars show the median and 95th-percentile times over 1500 logged decisions.
Figure 15.
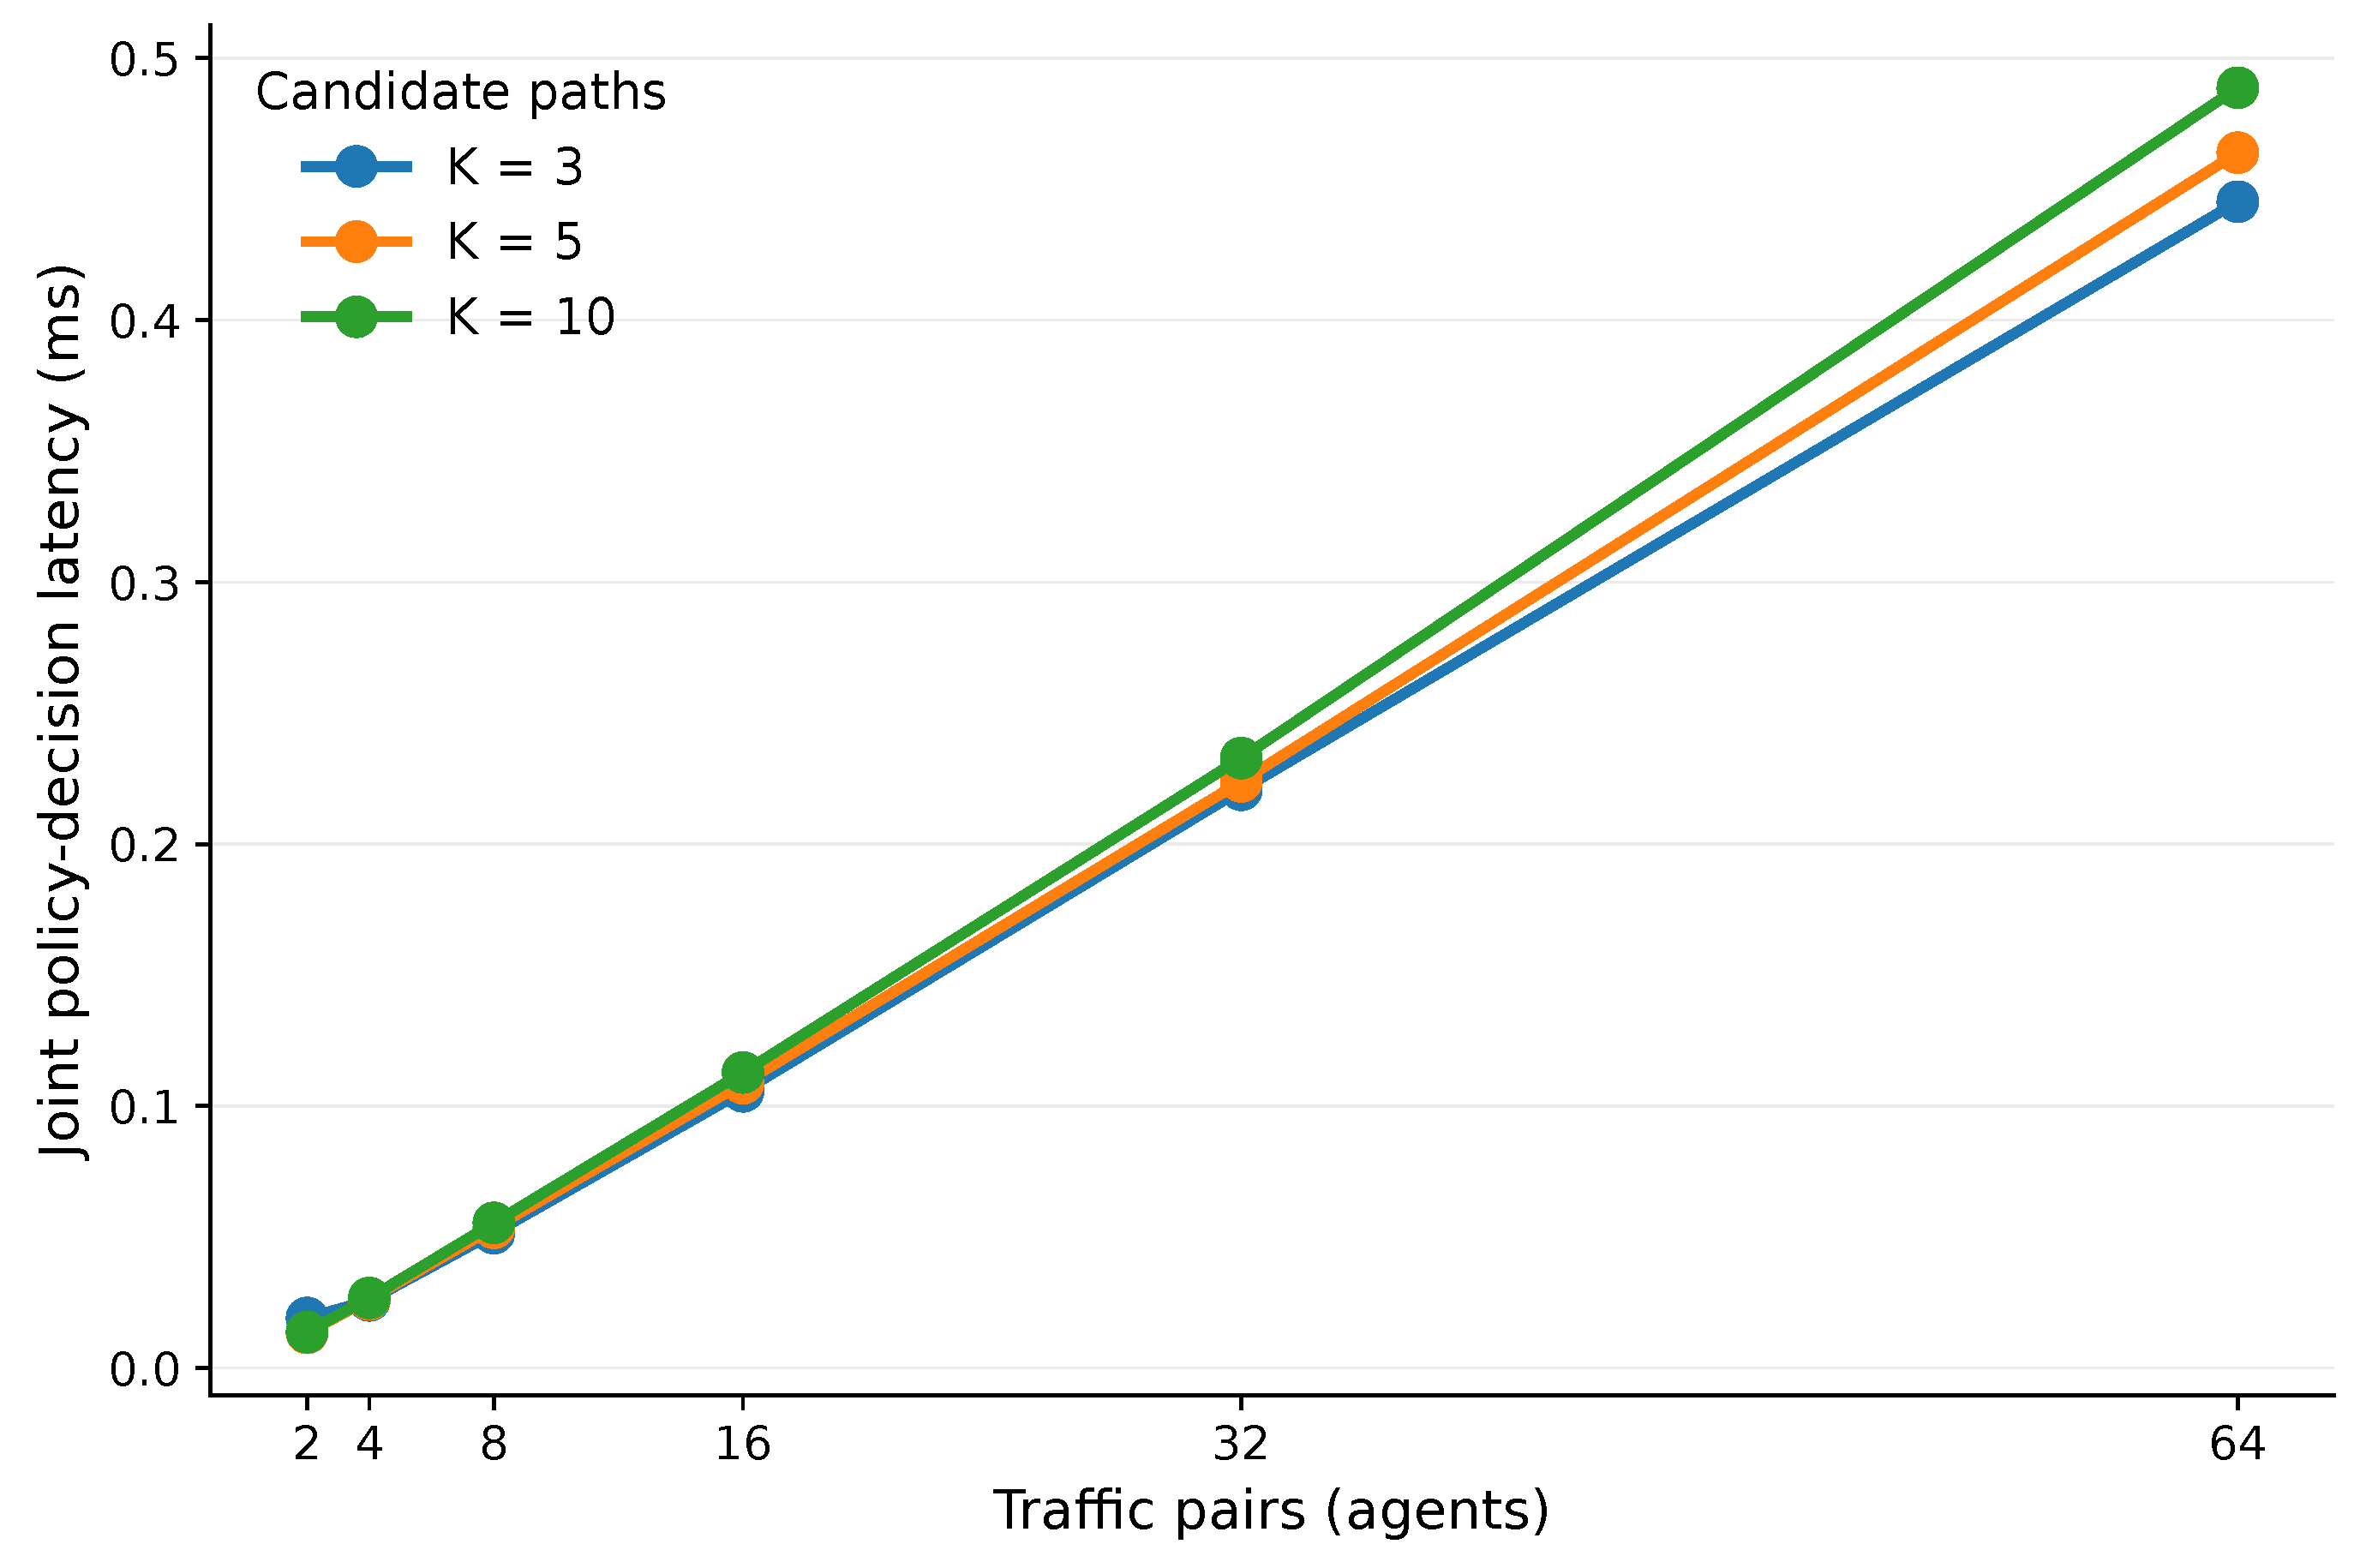
Offline joint policy-decision latency as the number of traffic-pair agents N and candidate paths K increases. Each measurement includes action selection for all N agents.
Figure 15.
Offline joint policy-decision latency as the number of traffic-pair agents N and candidate paths K increases. Each measurement includes action selection for all N agents.
Figure 16.
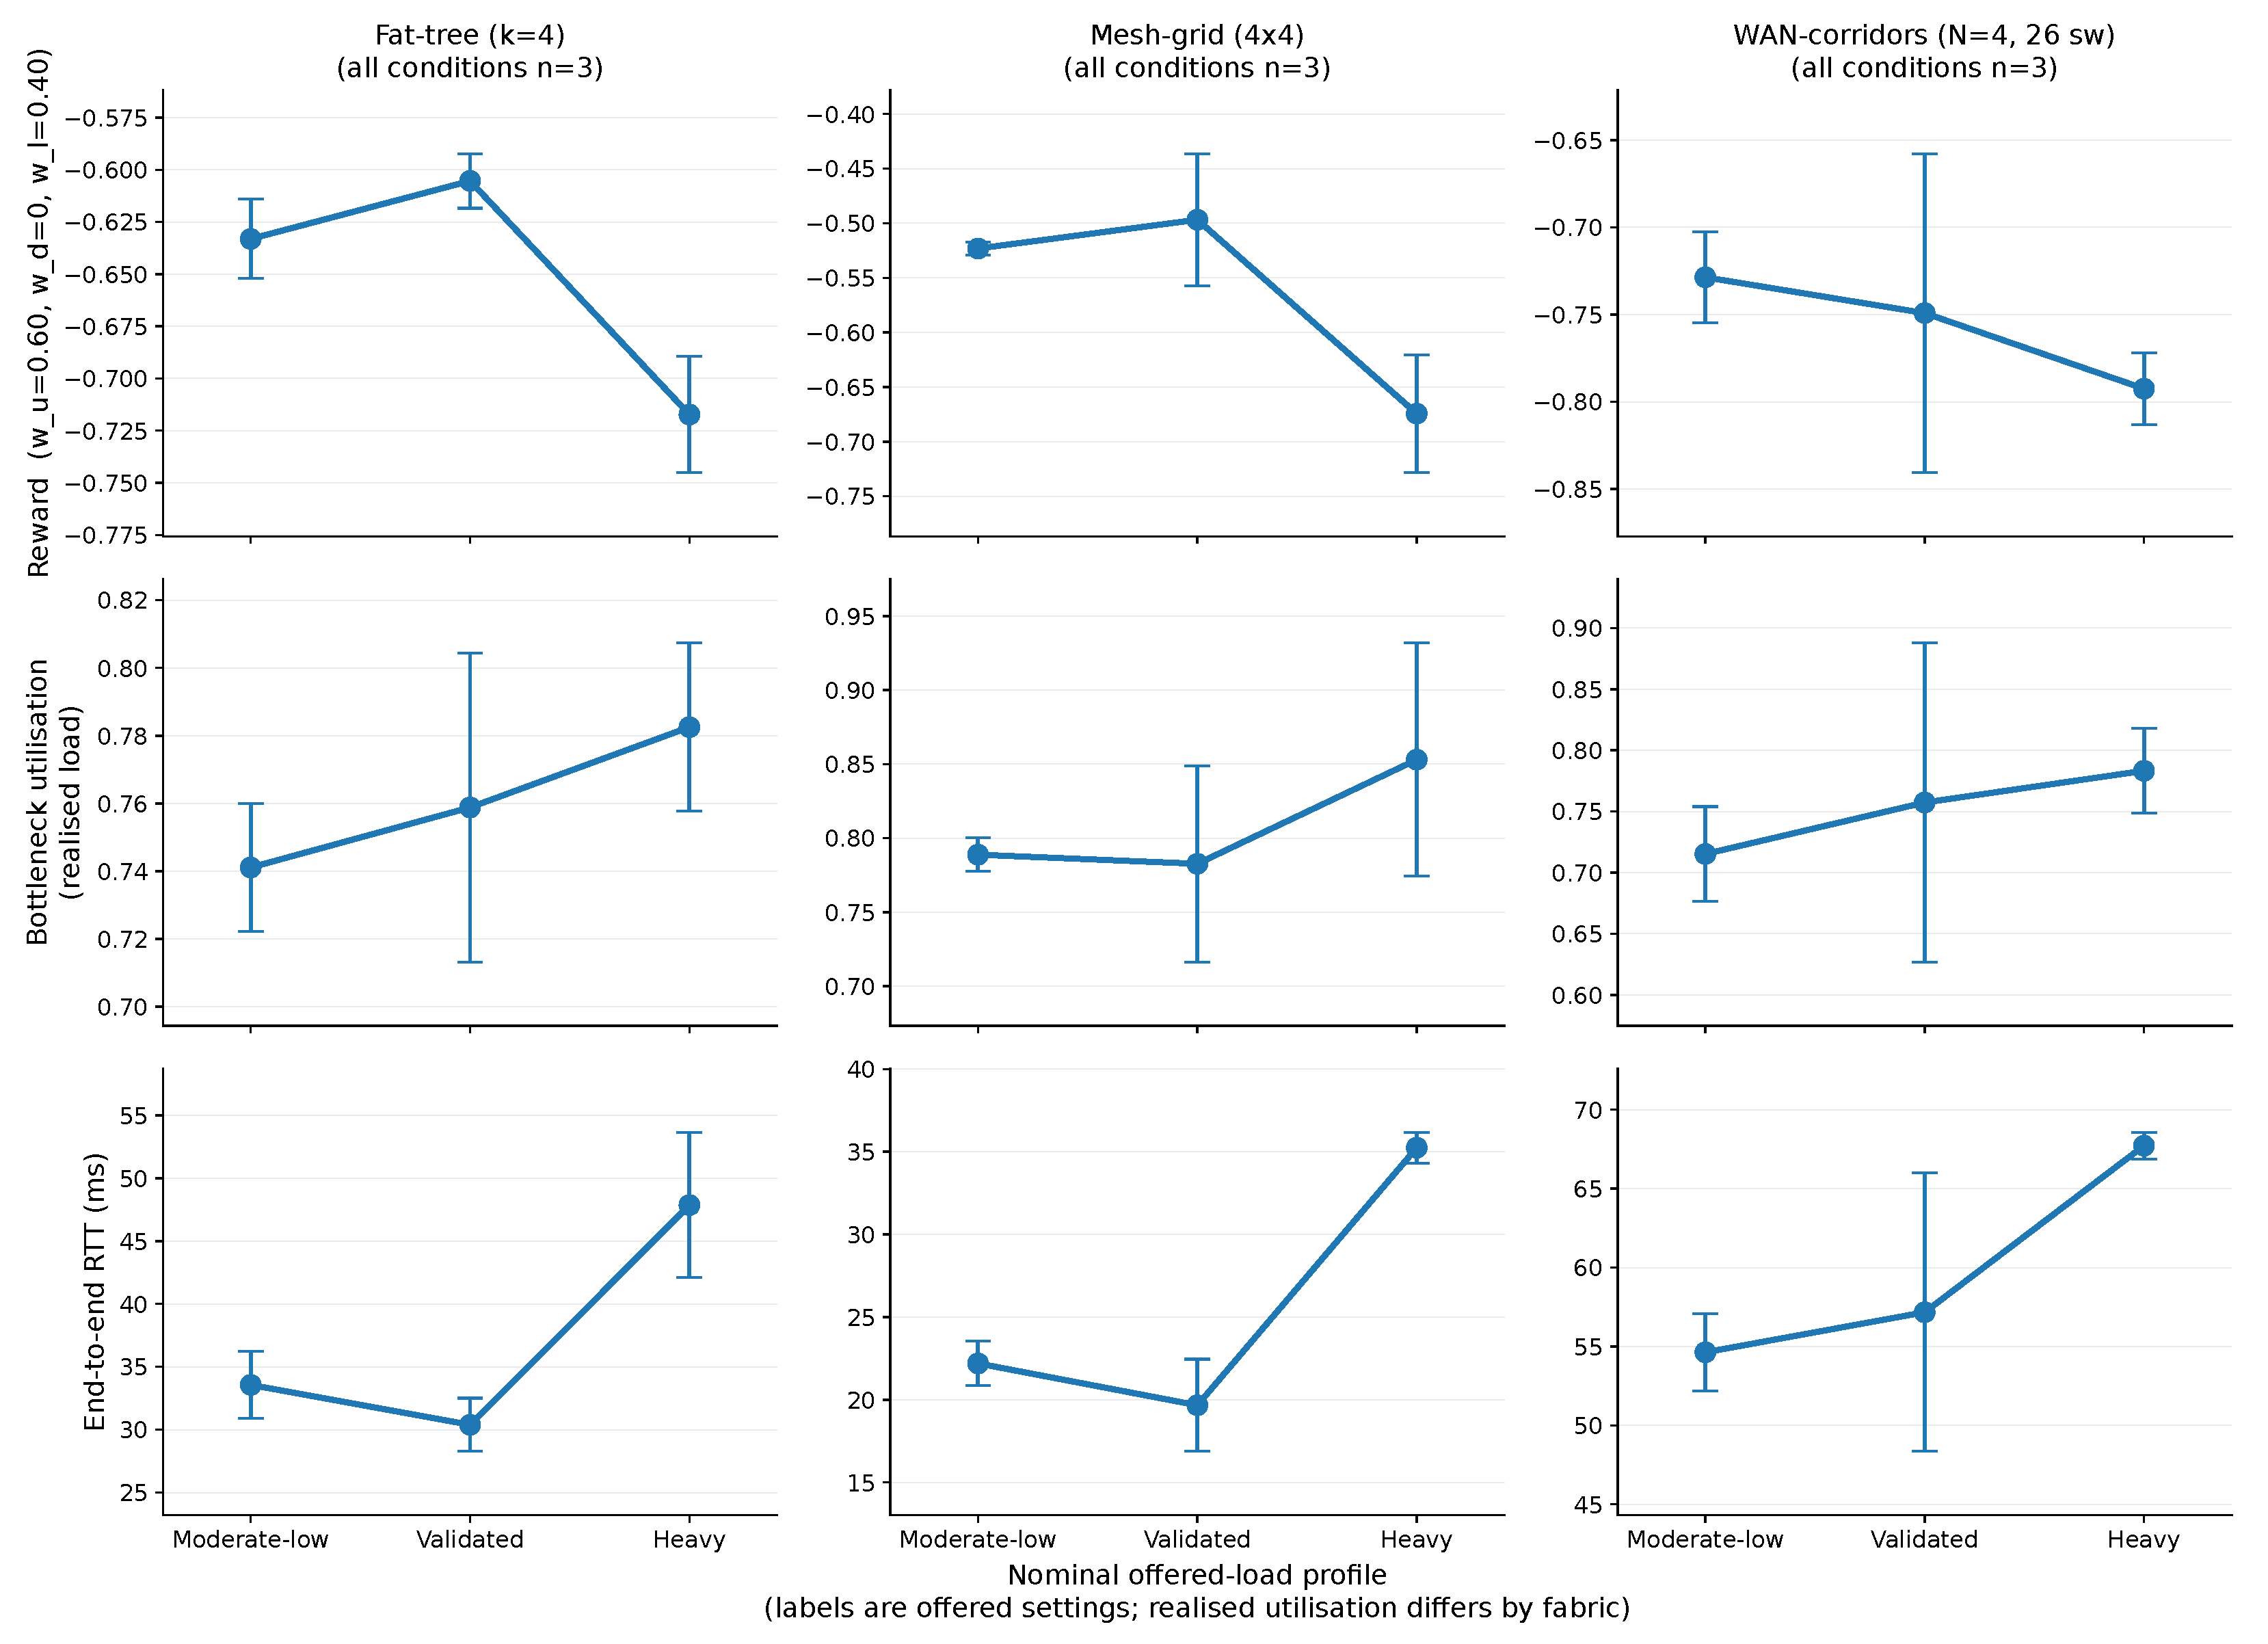
Operating envelope of MADDPG across three nominal offered-traffic profiles on the fat-tree, mesh-grid, and WAN-corridors topologies. The rows report reward, realized bottleneck utilization, and end-to-end RTT. Values are means over the same three seeds in every condition, and error bars show one standard deviation. The profile labels denote configured offered-traffic settings; realized utilization differs by topology.
Figure 16.
Operating envelope of MADDPG across three nominal offered-traffic profiles on the fat-tree, mesh-grid, and WAN-corridors topologies. The rows report reward, realized bottleneck utilization, and end-to-end RTT. Values are means over the same three seeds in every condition, and error bars show one standard deviation. The profile labels denote configured offered-traffic settings; realized utilization differs by topology.
Table 1.
Topology and offered-traffic coverage. The main comparison evaluates nine policies with ten paired seeds per topology; the operating-envelope analysis evaluates MADDPG with three seeds per offered profile.
Table 1.
Topology and offered-traffic coverage. The main comparison evaluates nine policies with ten paired seeds per topology; the operating-envelope analysis evaluates MADDPG with three seeds per offered profile.
| Topology and Structural Role | Main Comparison | MADDPG Operating Envelope |
|---|
| Fat-tree (); path-diverse fabric | Validated profile; 9 policies; 10 paired seeds | Moderate-low, validated, and heavy; 3 seeds per profile |
| Mesh-grid (); lower-diversity fabric | Validated profile; 9 policies; 10 paired seeds | Moderate-low, validated, and heavy; 3 seeds per profile |
| WAN-corridors (, 26 switches); corridor-like network | Validated profile; 9 policies; 10 paired seeds | Moderate-low, validated, and heavy; 3 seeds per profile |
Table 2.
State and transition structure used for offline learning.
Table 2.
State and transition structure used for offline learning.
| Component | Contents | Role |
|---|
| Shared network block | Aggregate utilization, traffic-control, latency, and previous-action features | Common network context available to all agents |
| Candidate-path block | Feasibility, bottleneck utilization, mean utilization, normalized hop count, and normalized switch cost | Describes one retained routing candidate, including its feasibility state |
| Global state | Shared block and candidate blocks for all traffic pairs | Input to the centralized critics during training |
| Local observation | Shared block and candidate blocks for traffic pair i | Input to actor i during training and deployment |
| Joint action | One candidate-path index per traffic pair | Determines the paths installed by the SDN controller |
| Per-agent reward vector | One base training reward per traffic-pair agent | Used to form the behavior-adjusted MADDPG training rewards |
| Reward ingredients | Utilization, drop-related, latency, and path-cost terms | Support scalar reward reconstruction and sensitivity analysis |
| Next state | Subsequent state in the same representation | Completes the offline transition tuple |
Table 3.
Reward and cost terms used for offline scoring and sensitivity analysis.
Table 3.
Reward and cost terms used for offline scoring and sensitivity analysis.
| Term | Meaning | Role in Objective |
|---|
| Bottleneck utilization | Penalizes congested selected paths |
| Per-step link-drop term | Retained in objective; ; does not measure flow completion |
| Normalized RTT-related loss | Penalizes high end-to-end latency |
| Realized hop/switch penalty | Penalizes gated excess path cost |
Table 4.
Selected MADDPG training configuration and tested alternatives.
Table 4.
Selected MADDPG training configuration and tested alternatives.
| Parameter | Selected Value | Tested Alternatives |
|---|
| Learning rate | | , |
| Discount factor | | , |
| Hidden units per layer | 128 | 64, 256 |
| Behavior-adjustment weight | | 0 |
| Training iterations | | Not varied |
Table 5.
Policies used in the main validated-profile comparison.
Table 5.
Policies used in the main validated-profile comparison.
| Policy | Type | Purpose in Evaluation |
|---|
| MADDPG | Proposed method | Multi-agent controller with centralized critics and behavior-adjusted training rewards |
| IDDPG | Learning variant | Trains traffic-pair agents independently without centralized joint-action evaluation |
| Single-DDPG | Learning variant | Replaces the per-pair multi-agent decomposition with one learned controller |
| CQL | Offline-RL baseline | Applies conservative Q-value regularization to per-agent discrete candidate selection |
| BCQ | Offline-RL baseline | Restricts per-agent candidate selection using a learned behavior-support model |
| Round-robin | Heuristic baseline | Cycles through the retained candidates |
| Shortest-hops | Heuristic baseline | Selects the feasible retained candidate with minimum hop count |
| Min-switch-cost | Heuristic baseline | Selects the retained candidate with minimum switch cost |
| Util-aware SP | Heuristic baseline | Selects the retained candidate with minimum observed bottleneck utilization |
Table 6.
Evaluation metrics and their roles in the study.
Table 6.
Evaluation metrics and their roles in the study.
| Metric Group | Role in Evaluation |
|---|
| Mean episode reward | Primary scalar objective; higher values indicate lower evaluated routing cost |
| Rank and average rank | Descriptive cross-topology rank profile across the three evaluated fabrics |
| RTT and bottleneck utilization | Reward-independent latency and congestion measurements |
| Flow completion | Fraction of dispatched flows terminating with exit code 0; qualifies comparisons at unequal delivered traffic |
| Hop count and longer-than-minimum-hop fraction | Selected-path length and use of candidates longer than the retained minimum-hop candidate |
| Path-switch frequency and entropy | Temporal stability and distribution of selections across the candidate catalogue |
| Paired reward gap | Seed-matched MADDPG–comparison-policy reward comparison |
| Bootstrap confidence interval | Uncertainty of the mean paired reward gap |
| Permutation and sign tests | Paired significance and seed-level win consistency |
| Paired t- and Wilcoxon tests | Selected physical-metric and behavior-adjustment comparisons; three-seed analyses use the paired t-test only |
| Cliff’s | Non-parametric effect-size estimate |
| Isolated policy timing | Mean, median, and 95th-percentile joint path-selection latency |
| Full-loop stage timing | Polling, state construction, policy decision, rule installation, barrier synchronization, and total elapsed interval |
| Scalability timing | Joint decision latency as the numbers of agents N and candidate paths K increase |
| Model size | Parameter count and serialized policy footprint |
Table 7.
Protocols used in the auxiliary fat-tree evaluations. Each condition uses three matched seeds.
Table 7.
Protocols used in the auxiliary fat-tree evaluations. Each condition uses three matched seeds.
| Condition | Evaluation Protocol |
|---|
| Bursty traffic | User Datagram Protocol (UDP) traffic with elephant rates of 6–9 Mbit/s, durations of 4–6 s, and inter-arrival gaps of 10–14 s. The traffic-shock probability is , with a rate multiplier sampled from –. This condition changes the stochastic flow-generation distributions rather than imposing a fixed burst start time, duration, or period. |
| Mixed traffic | Two UDP flow components are used. Mice flows have rates of –2 Mbit/s, durations of 2–4 s, and inter-arrival gaps of 1–3 s. Elephant flows have rates of 3–4 Mbit/s, durations of 30–60 s, and inter-arrival gaps of 10–20 s. The elephant probability is , and the maximum number of concurrent flows is 10. |
| Link down | One bidirectional fat-tree fabric link is disabled at s and remains unavailable until the end of the episode. The switches remain active, and the resulting topology-discovery event causes the controller to update the topology and recompute candidate paths. |
| Packet loss | A packet-loss rate is applied bidirectionally to every switch-to-switch fabric link from s until the end of the episode. |
| ECMP | Static per-flow ECMP assigns each flow to one of the feasible retained candidates using a destination-port-based hash. The assignment remains fixed for the duration of the flow. |
Table 8.
Validated-profile mean reward and point-estimate rank for the nine evaluated policies. The rank within each topology is shown in parentheses; rank 1 is best. Average rank is calculated across the three topologies.
Table 8.
Validated-profile mean reward and point-estimate rank for the nine evaluated policies. The rank within each topology is shown in parentheses; rank 1 is best. Average rank is calculated across the three topologies.
| Policy | Fat-Tree | Mesh-Grid | WAN-Corridors | Average Rank |
|---|
| MADDPG | (2) | (4) | (7) | 4.33 |
| IDDPG | (3) | (6) | (3) | 4.00 |
| Single-DDPG | (4) | (5) | (2) | 3.67 |
| CQL | (8) | (8) | (6) | 7.33 |
| BCQ | (9) | (9) | (4) | 7.33 |
| Round-robin | (7) | (7) | (5) | 6.33 |
| Shortest-hops | (6) | (1) | (8) | 5.00 |
| Min-switch-cost | (5) | (3) | (9) | 5.67 |
| Util-aware SP | (1) | (2) | (1) | 1.33 |
Table 9.
Flow completion, bottleneck utilization, and reward on WAN-corridors under the validated-profile setting. Values are mean ± standard deviation over ten matched seeds.
Table 9.
Flow completion, bottleneck utilization, and reward on WAN-corridors under the validated-profile setting. Values are mean ± standard deviation over ten matched seeds.
| Policy | Completion (%) | Bottleneck Utilization | Mean Reward |
|---|
| MADDPG | | | |
| IDDPG | | | |
| Single-DDPG | | | |
| CQL | | | |
| BCQ | | | |
| Round-robin | | | |
| Shortest-hops | | | |
| Min-switch-cost | | | |
| Util-aware SP | | | |
Table 10.
Flow completion, bottleneck utilization, and reward on the mesh-grid topology under the validated-profile setting. Values are mean ± standard deviation over ten matched seeds.
Table 10.
Flow completion, bottleneck utilization, and reward on the mesh-grid topology under the validated-profile setting. Values are mean ± standard deviation over ten matched seeds.
| Policy | Completion (%) | Bottleneck Utilization | Mean Reward |
|---|
| MADDPG | | | |
| IDDPG | | | |
| Single-DDPG | | | |
| CQL | | | |
| BCQ | | | |
| Round-robin | | | |
| Shortest-hops | | | |
| Min-switch-cost | | | |
| Util-aware SP | | | |
Table 11.
Mean end-to-end RTT and point-estimate RTT rank under the validated-profile setting. Values are averaged over ten matched seeds; lower RTT and rank are better. The number in parentheses preceded by # is the point-estimate RTT rank within that topology.
Table 11.
Mean end-to-end RTT and point-estimate RTT rank under the validated-profile setting. Values are averaged over ten matched seeds; lower RTT and rank are better. The number in parentheses preceded by # is the point-estimate RTT rank within that topology.
| Policy | Fat-Tree | Mesh-Grid | WAN-Corridors |
|---|
| MADDPG | (#1) | (#2) | (#7) |
| IDDPG | (#4) | (#6) | (#6) |
| Single-DDPG | (#3) | (#4) | (#3) |
| CQL | (#8) | (#8) | (#5) |
| BCQ | (#9) | (#9) | (#4) |
| Round-robin | (#6) | (#7) | (#2) |
| Shortest-hops | (#5) | (#1) | (#8) |
| Min-switch-cost | (#7) | (#3) | (#9) |
| Util-aware SP | (#2) | (#5) | (#1) |
Table 12.
Implementation-level architectural comparisons under the validated-profile setting. The reward difference is computed within each matched seed as the variant reward minus the MADDPG reward. Negative values indicate lower reward than MADDPG.
Table 12.
Implementation-level architectural comparisons under the validated-profile setting. The reward difference is computed within each matched seed as the variant reward minus the MADDPG reward. Negative values indicate lower reward than MADDPG.
| Topology | Implemented Variant | Mean Difference | Standard Deviation | Seeds |
|---|
| Fat-tree | IDDPG (independent traffic-pair critics) | | | 10 |
| Fat-tree | Single-DDPG (one joint controller) | | | 10 |
| Mesh-grid | IDDPG (independent traffic-pair critics) | | | 10 |
| Mesh-grid | Single-DDPG (one joint controller) | | | 10 |
| WAN-corridors | IDDPG (independent traffic-pair critics) | | | 10 |
| WAN-corridors | Single-DDPG (one joint controller) | | | 10 |
Table 13.
Paired WAN-corridors comparison of MADDPG with and . The difference is computed as the value minus the value. “Improved seeds” accounts for the preferred direction of each metric. The displayed values are from two-sided paired t-tests.
Table 13.
Paired WAN-corridors comparison of MADDPG with and . The difference is computed as the value minus the value. “Improved seeds” accounts for the preferred direction of each metric. The displayed values are from two-sided paired t-tests.
| Metric | | | Difference | Paired t-Test | Improved Seeds |
|---|
| Reward | | | | | |
| Flow completion (%) | | | | | |
| Bottleneck utilization | | | | | |
| RTT (ms) | | | | | |
Table 14.
MADDPG hyperparameter sensitivity. Each variant changes one parameter relative to the selected configuration. The difference is the variant reward minus the selected-configuration reward on the same matched seeds. For the three-seed comparisons, denotes the two-sided paired t-test. For the ten-seed WAN-corridors behavior-adjustment comparison, both the paired t-test and Wilcoxon signed-rank test are reported.
Table 14.
MADDPG hyperparameter sensitivity. Each variant changes one parameter relative to the selected configuration. The difference is the variant reward minus the selected-configuration reward on the same matched seeds. For the three-seed comparisons, denotes the two-sided paired t-test. For the ten-seed WAN-corridors behavior-adjustment comparison, both the paired t-test and Wilcoxon signed-rank test are reported.
| Parameter | Value | Topology | Mean Reward | Standard Deviation | Seeds | Difference and Paired Test |
|---|
| Learning rate | | Fat-tree | | | 3 | Reference |
| Learning rate | | Fat-tree | | | 3 | , |
| Learning rate | | Fat-tree | | | 3 | , |
| Discount factor | | Fat-tree | | | 3 | Reference |
| Discount factor | | Fat-tree | | | 3 | , |
| Discount factor | | Fat-tree | | | 3 | , |
| Hidden units | 128 | Fat-tree | | | 3 | Reference |
| Hidden units | 64 | Fat-tree | | | 3 | , |
| Hidden units | 256 | Fat-tree | | | 3 | , |
| Behavior adjustment | | Fat-tree | | | 3 | Reference |
| Behavior adjustment | | Fat-tree | | | 3 | , |
| Behavior adjustment | | Mesh-grid | | | 3 | Reference |
| Behavior adjustment | | Mesh-grid | | | 3 | , |
| Behavior adjustment | | WAN-corridors | | | 10 | Reference |
| Behavior adjustment | | WAN-corridors | | | 10 | , , |
Table 15.
Reward-weight sensitivity ranks under ex post re-scoring. Rank 1 indicates the highest mean reward within a topology and weight setting. The deployed configuration is shown in bold.
Table 15.
Reward-weight sensitivity ranks under ex post re-scoring. Rank 1 indicates the highest mean reward within a topology and weight setting. The deployed configuration is shown in bold.
| Topology | | MADDPG | IDDPG | Single | CQL | BCQ | RR | SH | MSC | UASP | Best policy |
|---|
| Fat-tree | | 2 | 3 | 4 | 8 | 9 | 5 | 7 | 6 | 1 | Util-aware SP |
| Fat-tree | | 2 | 3 | 4 | 8 | 9 | 6 | 7 | 5 | 1 | Util-aware SP |
| Fat-tree | | 2 | 3 | 4 | 8 | 9 | 7 | 6 | 5 | 1 | Util-aware SP |
| Fat-tree | | 2 | 3 | 4 | 8 | 9 | 7 | 6 | 5 | 1 | Util-aware SP |
| Fat-tree | | 2 | 3 | 5 | 8 | 9 | 7 | 4 | 6 | 1 | Util-aware SP |
| Mesh-grid | | 2 | 6 | 4 | 8 | 9 | 7 | 1 | 3 | 5 | Shortest-hops |
| Mesh-grid | | 2 | 6 | 5 | 8 | 9 | 7 | 1 | 3 | 4 | Shortest-hops |
| Mesh-grid | | 2 | 6 | 5 | 8 | 9 | 7 | 1 | 3 | 4 | Shortest-hops |
| Mesh-grid | | 4 | 6 | 5 | 8 | 9 | 7 | 1 | 3 | 2 | Shortest-hops |
| Mesh-grid | | 5 | 6 | 4 | 8 | 9 | 7 | 2 | 3 | 1 | Util-aware SP |
| WAN-corridors | | 7 | 5 | 2 | 6 | 4 | 3 | 8 | 9 | 1 | Util-aware SP |
| WAN-corridors | | 7 | 4 | 2 | 6 | 3 | 5 | 8 | 9 | 1 | Util-aware SP |
| WAN-corridors | | 7 | 3 | 2 | 6 | 4 | 5 | 8 | 9 | 1 | Util-aware SP |
| WAN-corridors | | 7 | 3 | 2 | 6 | 4 | 5 | 8 | 9 | 1 | Util-aware SP |
| WAN-corridors | | 5 | 3 | 2 | 6 | 4 | 7 | 8 | 9 | 1 | Util-aware SP |
Table 16.
Hop/switch-penalty sensitivity ranks under ex post re-scoring. Rank 1 indicates the highest mean reward within a topology and penalty setting. The deployed configuration is shown in bold.
Table 16.
Hop/switch-penalty sensitivity ranks under ex post re-scoring. Rank 1 indicates the highest mean reward within a topology and penalty setting. The deployed configuration is shown in bold.
| Topology | Penalty | MADDPG | IDDPG | Single | CQL | BCQ | RR | SH | MSC | UASP | Best Policy |
|---|
| Fat-tree | | 2 | 3 | 4 | 8 | 9 | 6 | 5 | 7 | 1 | Util-aware SP |
| Fat-tree | | 2 | 3 | 4 | 8 | 9 | 6 | 5 | 7 | 1 | Util-aware SP |
| Fat-tree | | 2 | 3 | 4 | 8 | 9 | 7 | 6 | 5 | 1 | Util-aware SP |
| Fat-tree | | 2 | 4 | 5 | 8 | 9 | 7 | 6 | 3 | 1 | Util-aware SP |
| Mesh-grid | | 4 | 6 | 5 | 8 | 9 | 7 | 1 | 3 | 2 | Shortest-hops |
| Mesh-grid | | 4 | 6 | 5 | 8 | 9 | 7 | 1 | 3 | 2 | Shortest-hops |
| Mesh-grid | | 4 | 6 | 5 | 8 | 9 | 7 | 1 | 3 | 2 | Shortest-hops |
| Mesh-grid | | 4 | 6 | 5 | 8 | 9 | 7 | 1 | 3 | 2 | Shortest-hops |
| WAN-corridors | | 7 | 3 | 2 | 5 | 4 | 6 | 8 | 9 | 1 | Util-aware SP |
| WAN-corridors | | 7 | 3 | 2 | 6 | 4 | 5 | 8 | 9 | 1 | Util-aware SP |
| WAN-corridors | | 7 | 3 | 2 | 6 | 4 | 5 | 8 | 9 | 1 | Util-aware SP |
| WAN-corridors | | 6 | 3 | 2 | 7 | 4 | 5 | 8 | 9 | 1 | Util-aware SP |
Table 17.
Policy-behavior metrics under the validated-profile setting. Values are means over ten seeds. “Longer-path fraction” denotes the fraction of selections longer than the retained minimum-hop candidate, and completion is the percentage of dispatched flows that terminate successfully.
Table 17.
Policy-behavior metrics under the validated-profile setting. Values are means over ten seeds. “Longer-path fraction” denotes the fraction of selections longer than the retained minimum-hop candidate, and completion is the percentage of dispatched flows that terminate successfully.
| Topology | Policy | Hops | Longer-Path Fraction | Util. | RTT (ms) | Switch | Entropy | Completion (%) |
|---|
| Fat-tree | MADDPG | 4.137 | 0.161 | 0.721 | 31.031 | 0.360 | 0.814 | 90.208 |
| Fat-tree | IDDPG | 4.301 | 0.252 | 0.741 | 33.134 | 0.464 | 0.918 | 90.031 |
| Fat-tree | Single-DDPG | 4.392 | 0.290 | 0.748 | 32.862 | 0.329 | 0.775 | 88.515 |
| Fat-tree | CQL | 4.402 | 0.304 | 0.791 | 38.365 | 0.504 | 0.962 | 90.879 |
| Fat-tree | BCQ | 4.361 | 0.288 | 0.793 | 39.134 | 0.521 | 0.967 | 92.391 |
| Fat-tree | Round-robin | 4.506 | 0.332 | 0.762 | 33.830 | 0.370 | 0.999 | 88.263 |
| Fat-tree | Shortest-hops | 4.000 | 0.000 | 0.744 | 33.670 | 0.000 | 0.000 | 78.000 |
| Fat-tree | Min-switch-cost | 4.000 | 0.000 | 0.772 | 34.101 | 0.000 | 0.000 | 91.832 |
| Fat-tree | Util-aware SP | 4.021 | 0.041 | 0.600 | 31.232 | 0.783 | 0.734 | 88.954 |
| Mesh-grid | MADDPG | 2.174 | 0.048 | 0.735 | 20.063 | 0.067 | 0.180 | 95.510 |
| Mesh-grid | IDDPG | 3.383 | 0.570 | 0.719 | 26.207 | 0.476 | 0.940 | 95.896 |
| Mesh-grid | Single-DDPG | 3.016 | 0.368 | 0.722 | 23.270 | 0.292 | 0.829 | 96.272 |
| Mesh-grid | CQL | 3.406 | 0.587 | 0.744 | 29.345 | 0.599 | 0.990 | 92.710 |
| Mesh-grid | BCQ | 3.370 | 0.567 | 0.755 | 30.555 | 0.503 | 0.984 | 92.467 |
| Mesh-grid | Round-robin | 3.442 | 0.593 | 0.750 | 27.239 | 0.370 | 0.999 | 95.463 |
| Mesh-grid | Shortest-hops | 2.000 | 0.000 | 0.722 | 19.166 | 0.000 | 0.000 | 79.848 |
| Mesh-grid | Min-switch-cost | 2.300 | 0.075 | 0.720 | 21.381 | 0.000 | 0.000 | 90.619 |
| Mesh-grid | Util-aware SP | 2.898 | 0.331 | 0.677 | 25.202 | 0.602 | 0.764 | 92.526 |
| WAN-corridors | MADDPG | 8.018 | 0.320 | 0.759 | 56.877 | 0.524 | 0.951 | 90.150 |
| WAN-corridors | IDDPG | 8.081 | 0.357 | 0.741 | 56.626 | 0.575 | 0.981 | 89.820 |
| WAN-corridors | Single-DDPG | 8.050 | 0.316 | 0.734 | 55.598 | 0.592 | 0.978 | 90.300 |
| WAN-corridors | CQL | 8.042 | 0.339 | 0.765 | 55.896 | 0.612 | 0.993 | 91.860 |
| WAN-corridors | BCQ | 8.022 | 0.325 | 0.749 | 55.852 | 0.596 | 0.992 | 90.850 |
| WAN-corridors | Round-robin | 8.044 | 0.336 | 0.776 | 54.246 | 0.370 | 0.999 | 89.540 |
| WAN-corridors | Shortest-hops | 7.934 | 0.000 | 0.817 | 70.727 | 0.000 | 0.000 | 72.500 |
| WAN-corridors | Min-switch-cost | 7.933 | 0.000 | 0.839 | 74.191 | 0.000 | 0.000 | 73.270 |
| WAN-corridors | Util-aware SP | 8.254 | 0.320 | 0.593 | 49.379 | 0.990 | 0.999 | 76.270 |
Table 18.
Decomposition of the fat-tree reward gap between MADDPG and Util-aware SP. Component differences are computed as MADDPG minus Util-aware SP, and reward contributions follow .
Table 18.
Decomposition of the fat-tree reward gap between MADDPG and Util-aware SP. Component differences are computed as MADDPG minus Util-aware SP, and reward contributions follow .
| Component | MADDPG | Util-Aware SP | Difference | Reward Contribution | Paired t-Test |
|---|
| Bottleneck utilization U | 0.721 | 0.600 | | | 0.00008 |
| Latency loss L | 0.245 | 0.249 | | | 0.88638 |
| Hop/switch penalty P | 0.061 | 0.068 | | | 0.11136 |
| Total reward gap | | | — |
Table 19.
Paired seed-level statistical comparisons between MADDPG and the eight comparison policies under the validated-profile setting. Positive mean gaps, median gains, and Cliff’s values favor MADDPG.
Table 19.
Paired seed-level statistical comparisons between MADDPG and the eight comparison policies under the validated-profile setting. Positive mean gaps, median gains, and Cliff’s values favor MADDPG.
| Topology | Comparison Policy | Mean Gap | Bootstrap Interval | Permutation p | Sign-Test p | Wins | Cliff’s | Median Gain |
|---|
| Fat-tree | IDDPG | 0.0204 | | 0.0586 | 0.3438 | 7/10 | 0.52 | 0.0118 |
| Fat-tree | Single-DDPG | 0.0317 | | 0.0410 | 0.3438 | 7/10 | 0.62 | 0.0461 |
| Fat-tree | CQL | 0.0758 | | 0.0039 | 0.0215 | 9/10 | 0.78 | 0.0639 |
| Fat-tree | BCQ | 0.0825 | | 0.0020 | 0.0020 | 10/10 | 0.94 | 0.0568 |
| Fat-tree | Round-robin | 0.0413 | | 0.0059 | 0.0215 | 9/10 | 0.86 | 0.0396 |
| Fat-tree | Shortest-hops | 0.0370 | | 0.0078 | 0.1094 | 8/10 | 0.74 | 0.0328 |
| Fat-tree | Min-switch-cost | 0.0365 | | 0.0352 | 0.1094 | 8/10 | 0.52 | 0.0403 |
| Fat-tree | Util-aware SP | −0.0647 | | 0.0156 | 0.1094 | 2/10 | −0.62 | −0.0821 |
| Mesh-grid | IDDPG | 0.0252 | | 0.0449 | 0.3438 | 7/10 | 0.46 | 0.0346 |
| Mesh-grid | Single-DDPG | 0.0121 | | 0.3906 | 0.7539 | 6/10 | 0.44 | 0.0214 |
| Mesh-grid | CQL | 0.0627 | | 0.0195 | 0.3438 | 7/10 | 0.42 | 0.0587 |
| Mesh-grid | BCQ | 0.0761 | | 0.0098 | 0.0215 | 9/10 | 0.66 | 0.0563 |
| Mesh-grid | Round-robin | 0.0508 | | 0.0234 | 0.0215 | 9/10 | 0.72 | 0.0585 |
| Mesh-grid | Shortest-hops | −0.0128 | | 0.3047 | 0.3438 | 3/10 | −0.08 | −0.0132 |
| Mesh-grid | Min-switch-cost | −0.0024 | | 0.8613 | 1.0000 | 5/10 | 0.02 | −0.0026 |
| Mesh-grid | Util-aware SP | −0.0052 | | 0.7910 | 0.7539 | 4/10 | −0.08 | −0.0025 |
| WAN-corridors | IDDPG | −0.0148 | | 0.1250 | 0.3438 | 3/10 | −0.24 | −0.0194 |
| WAN-corridors | Single-DDPG | −0.0226 | | 0.1133 | 0.3438 | 3/10 | −0.40 | −0.0369 |
| WAN-corridors | CQL | −0.0013 | | 0.9121 | 1.0000 | 5/10 | −0.04 | 0.0036 |
| WAN-corridors | BCQ | −0.0130 | | 0.3066 | 0.7539 | 4/10 | −0.12 | −0.0105 |
| WAN-corridors | Round-robin | −0.0019 | | 0.8652 | 0.7539 | 4/10 | 0.00 | −0.0032 |
| WAN-corridors | Shortest-hops | 0.0813 | | 0.0137 | 0.1094 | 8/10 | 0.62 | 0.0954 |
| WAN-corridors | Min-switch-cost | 0.0988 | | 0.0020 | 0.0020 | 10/10 | 0.78 | 0.1043 |
| WAN-corridors | Util-aware SP | −0.1121 | | 0.0020 | 0.0020 | 0/10 | −0.84 | −0.1196 |
Table 20.
Fat-tree reward under bursty and mixed traffic patterns. Values are mean ± standard deviation over three seeds; higher reward is better.
Table 20.
Fat-tree reward under bursty and mixed traffic patterns. Values are mean ± standard deviation over three seeds; higher reward is better.
| Traffic Pattern | Policy | Reward | Seeds |
|---|
| Bursty | MADDPG | | 3 |
| Bursty | IDDPG | | 3 |
| Bursty | Round-robin | | 3 |
| Bursty | Shortest-hops | | 3 |
| Bursty | Util-aware SP | | 3 |
| Mixed | MADDPG | | 3 |
| Mixed | IDDPG | | 3 |
| Mixed | Round-robin | | 3 |
| Mixed | Shortest-hops | | 3 |
| Mixed | Util-aware SP | | 3 |
Table 21.
Fat-tree reward under the tested link-down and packet-loss conditions. Values are mean ± standard deviation over three seeds; higher reward is better. The results are descriptive.
Table 21.
Fat-tree reward under the tested link-down and packet-loss conditions. Values are mean ± standard deviation over three seeds; higher reward is better. The results are descriptive.
| Condition | Policy | Reward | Seeds |
|---|
| Link down | MADDPG | | 3 |
| Link down | IDDPG | | 3 |
| Link down | Round-robin | | 3 |
| Link down | Shortest-hops | | 3 |
| Link down | Util-aware SP | | 3 |
| Packet loss | MADDPG | | 3 |
| Packet loss | IDDPG | | 3 |
| Packet loss | Round-robin | | 3 |
| Packet loss | Shortest-hops | | 3 |
| Packet loss | Util-aware SP | | 3 |
Table 22.
Single-path MADDPG and static per-flow ECMP forwarding on fat-tree. The difference is computed as ECMP minus single-path MADDPG; higher reward is better. The three-seed value is from a two-sided paired t-test and is interpreted as exploratory.
Table 22.
Single-path MADDPG and static per-flow ECMP forwarding on fat-tree. The difference is computed as ECMP minus single-path MADDPG; higher reward is better. The three-seed value is from a two-sided paired t-test and is interpreted as exploratory.
| Forwarding Mode | Mean Reward | Difference | Paired t-Test | Seeds |
|---|
| MADDPG single-path | | Reference | — | 3 |
| ECMP per-flow | | | | 3 |
Table 23.
Isolated policy-inference overhead and exported model footprint. Timing was measured over 1500 logged all-pairs routing decisions.
Table 23.
Isolated policy-inference overhead and exported model footprint. Timing was measured over 1500 logged all-pairs routing decisions.
| Topology | Policy | Parameters | Size (KB) | Mean () | P50 () | P95 () |
|---|
| Fat-tree | MADDPG | 79,372 | 318.8 | 52.6 | 52.0 | 57.0 |
| Fat-tree | IDDPG | 79,372 | 318.8 | 52.9 | 52.2 | 57.1 |
| Fat-tree | Single-DDPG | 91,660 | 367.3 | 34.1 | 33.2 | 38.3 |
| Mesh-grid | MADDPG | 79,372 | 318.8 | 53.6 | 52.4 | 59.7 |
| Mesh-grid | IDDPG | 79,372 | 318.8 | 52.8 | 52.2 | 56.4 |
| Mesh-grid | Single-DDPG | 91,660 | 367.3 | 35.3 | 34.2 | 40.6 |
| WAN-corridors | MADDPG | 79,372 | 318.8 | 52.8 | 52.3 | 55.4 |
| WAN-corridors | IDDPG | 79,372 | 318.8 | 53.0 | 52.4 | 55.9 |
| WAN-corridors | Single-DDPG | 91,660 | 367.3 | 33.8 | 33.7 | 34.8 |
Table 24.
Mean full-loop timing breakdown for the instrumented MADDPG run on each topology. All values are in milliseconds. The complete elapsed interval includes operations outside the individually instrumented stage timers.
Table 24.
Mean full-loop timing breakdown for the instrumented MADDPG run on each topology. All values are in milliseconds. The complete elapsed interval includes operations outside the individually instrumented stage timers.
| Topology | Polling | State | Decision | Installation | Barrier | Loop Elapsed |
|---|
| Fat-tree | 486.784 | 0.146 | 2.078 | 3.886 | 7.165 | 575.791 |
| Mesh-grid | 512.570 | 0.166 | 0.386 | 3.825 | 7.185 | 617.239 |
| WAN-corridors | 509.489 | 0.172 | 0.809 | 7.467 | 8.613 | 562.030 |
Table 25.
Joint policy-decision latency in the scalability microbenchmark. Values are in milliseconds and include action selection for all traffic-pair agents.
Table 25.
Joint policy-decision latency in the scalability microbenchmark. Values are in milliseconds and include action selection for all traffic-pair agents.
| Traffic Pairs N | | | |
|---|
| 2 | 0.0191 | 0.0134 | 0.0137 |
| 4 | 0.0258 | 0.0262 | 0.0267 |
| 8 | 0.0515 | 0.0535 | 0.0554 |
| 16 | 0.1056 | 0.1087 | 0.1128 |
| 32 | 0.2207 | 0.2239 | 0.2328 |
| 64 | 0.4452 | 0.4639 | 0.4887 |
Table 26.
Operating envelope of MADDPG across three topologies and three nominal offered-traffic profiles. Values are mean ± standard deviation over the same three seeds. The drop column reports the mean logged per-step drop fraction.
Table 26.
Operating envelope of MADDPG across three topologies and three nominal offered-traffic profiles. Values are mean ± standard deviation over the same three seeds. The drop column reports the mean logged per-step drop fraction.
| Topology | Offered-Traffic Profile | Reward | Bottleneck Utilization | RTT (ms) | Drop | Seeds |
|---|
| Fat-tree | Moderate-low | | | | 0.014 | 3 |
| Fat-tree | Validated | | | | 0.009 | 3 |
| Fat-tree | Heavy | | | | 0.023 | 3 |
| Mesh-grid | Moderate-low | | | | 0.005 | 3 |
| Mesh-grid | Validated | | | | 0.008 | 3 |
| Mesh-grid | Heavy | | | | 0.019 | 3 |
| WAN-corridors | Moderate-low | | | | 0.008 | 3 |
| WAN-corridors | Validated | | | | 0.012 | 3 |
| WAN-corridors | Heavy | | | | 0.014 | 3 |