Abstract
Rheumatoid arthritis (RA) is a chronic autoimmune disease marked by joint inflammation and progressive disability. While biological disease-modifying antirheumatic drugs (bDMARDs) have significantly improved disease control, predicting individual treatment response remains clinically challenging. This study presents a machine learning approach to predict 12-month disease activity, measured by DAS28-CRP, in RA patients beginning bDMARD therapy. We trained and evaluated eight regression models, including Ridge, Lasso, Support Vector Regression, and XGBoost, using baseline clinical features from 154 RA patients treated at University Hospital Erlangen. A rigorous nested cross-validation strategy was applied for internal model selection and validation. Importantly, model generalizability was assessed using an independent external dataset from the Austrian BioReg registry, which includes a more diverse, real-world RA patient population from across multiple clinical sites. The Ridge regression model achieved the best internal performance (MAE: 0.633, R2: 0.542) and showed strong external validity when applied to unseen BioReg data (MAE: 0.678, R2: 0.491). These results indicate robust cross-cohort generalization. By predicting continuous DAS28-CRP scores instead of binary remission labels, our approach supports flexible, individualized treatment planning based on local or evolving clinical thresholds. This work demonstrates the feasibility and clinical value of externally validated, data-driven tools for precision treatment planning in RA.
1. Introduction
Rheumatoid arthritis (RA) is a chronic autoimmune disease characterized by persistent joint inflammation, leading to pain, swelling, and, over time, joint damage and disability [1,2]. It affects millions worldwide and remains one of the most common causes of chronic joint disease [3]. Despite advances in treatment, managing RA remains challenging due to the wide variability in individual treatment responses [4].
Achieving remission, where disease activity is minimal or absent, is the primary goal of RA therapy. In clinical practice, remission is typically assessed using composite indices such as the Disease Activity Score for 28 joints (DAS28), which incorporates laboratory markers (e.g., C-reactive protein or CRP), joint counts, and patient-reported symptoms [5]. Identifying likely non-responders before treatment begins could help to avoid irreversible joint damage and guide earlier intervention.
Biological disease-modifying antirheumatic drugs (bDMARDs) have significantly improved outcomes, especially for patients unresponsive to conventional agents like methotrexate [6,7]. However, their effectiveness varies across individuals, and it may take 3 to 6 months to determine treatment response. During this time, non-responders may suffer from side effects, continued inflammation, and financial burdens [8], creating uncertainty for both clinicians and patients. Early prediction of treatment response could lead to more personalized decision-making, which reduces exposure to ineffective therapies and improves outcomes [9,10,11].
Artificial intelligence (AI) is increasingly transforming medicine by enabling the efficient analysis of large and complex datasets beyond the capacity of traditional statistical methods. Within AI, machine learning (ML) holds particular promise for automating tasks such as diagnosis, risk stratification, and treatment selection by identifying patterns in clinical data. Studies across domains like radiology, cardiology, oncology, and neurology have demonstrated that ML models can match, or even surpass, human performance in specific diagnostic and prognostic tasks [12]. In the context of treatment planning, ML enables early prediction of patient response, supports risk stratification, and facilitates timely clinical decision-making [13,14,15,16].
Recent ML studies in RA have used a wide range of input data, ranging from routine clinical features to advanced imaging and molecular profiles [8,17,18,19,20]. While non-routine data sources like synovial gene signatures [19] or multi-omics [20] can reveal underlying disease mechanisms, their cost and complexity limit clinical integration.
Many existing models use accessible clinical data but often simplify the prediction task by reducing it to binary classification, labeling patients as responders or non-responders based on a fixed remission threshold [18,21,22]. While these studies have identified important clinical predictors, including drug-specific patterns [8] and sustained versus short-term response [21], they remain limited by their reliance on dichotomous outcomes. Some recent approaches have introduced risk stratification and model explainability to improve clinical applicability [21,22], yet the binary framework remains a central constraint.
Remission criteria vary across guidelines and continue to evolve [23], making rigid thresholds less reliable in practice. For instance, a patient with a DAS28-CRP score of 2.7 is grouped with someone experiencing much higher disease activity, despite only narrowly missing the remission cutoff of 2.6. Predicting continuous DAS28-CRP scores instead allows for more nuanced and flexible insights that better reflect clinical decision-making.
In addition, a recent systematic review by Mendoza-Pinto et al. [24] highlighted that many published models have a high or unclear risk of bias and often lack external validation. As a result, their reported performance may not translate reliably across clinical settings, underscoring the need for rigorous external validation.
To address these limitations, we developed a ML framework to predict 12-month DAS28-CRP scores in patients with RA initiating bDMARD therapy, using routinely collected baseline clinical data. Our feature set included joint counts, C-reactive protein (CRP), visual analog scale (VAS) scores, and concurrent medications—variables commonly documented in standard rheumatology practice. This design makes the model practical to implement and broadly applicable across diverse clinical settings.
Unlike many existing studies that frame remission prediction as a binary classification task, our approach models DAS28-CRP as a continuous outcome. This enables more nuanced and generalizable predictions that support flexible, individualized treatment planning.
We trained and evaluated several regression models—Ridge, Lasso, Support Vector Regression, Random Forest, and XGBoost—on a cohort of 154 RA patients from University Hospital Erlangen. A nested cross-validation scheme was used to ensure robust performance estimation and reduce overfitting. To evaluate generalizability, we applied the models to an independent external dataset from the Austrian BioReg registry, which includes a more diverse, real-world patient population from multiple clinical sites. This external validation provides insights into model robustness across distinct clinical contexts and sets our study apart from similar works that lack validation beyond internal data.
Ultimately, this study presents a practical, data-driven tool to support early RA management and improve treatment outcomes through more personalized care.
2. Methods
2.1. Data Sources
This study utilized two datasets: one for training ML models and another for external validation. These datasets were collected from independent sources in two different countries. The aim was to assess the models’ generalizability on data from a separate, heterogeneous cohort that was not involved in the model development process.
The primary dataset consists of anonymized clinical data from patients with RA who met the ACR/EULAR 2010 classification criteria and were treated at University Hospital Erlangen in Germany between 2010 and 2017 [21]. Patients were enrolled at the time of bDMARD therapy initiation and followed longitudinally until the treatment was either adjusted or discontinued. Baseline data were defined as routinely collected clinical and laboratory parameters available prior to any treatment response. Follow-up DAS28-CRP scores were used as the primary outcome for model evaluation. The dataset included a range of clinical variables, such as demographic information (age, gender), comorbidities (e.g., asthma), disease activity measures including tender joint count (TJC28) and swollen joint count (SJC28), inflammatory markers such as C-reactive protein (CRP), and information on concurrent medications, including the use of conventional synthetic DMARDs (csDMARDs).
For external validation, we used data from the BioReg dataset [21]. From this registry, we selected patients diagnosed with RA who had been treated with bDMARDs. The BioReg dataset included RA patients beginning bDMARD therapy between 2010 and 2024. It represents a more diverse patient population, as it integrates data from multiple private practices and outpatient clinics across Austria. Its broader clinical settings and patient variability provided a suitable context for evaluating the model’s performance in a real-world, heterogeneous environment.
Before initiating model development, we selected a set of 12 clinical features that are commonly available in routine rheumatology practice and were also consistently recorded in both the Erlangen and BioReg datasets. These included demographic, laboratory, clinical, and composite disease activity variables. Table 1 summarizes the distributions of these features in each cohort and highlights important differences relevant to model generalizability, with full descriptive statistics provided in Appendix A Table A2.

Table 1.
The baseline characteristics of patients in the Erlangen and BioReg cohorts. Values are presented as mean (standard deviation).
2.2. Data Preprocessing
Following the selection of routinely collected clinical features common to both datasets (see Table 1), we performed a series of preprocessing steps to prepare the data for ML. These steps were designed to address common issues in real-world clinical data, including inconsistent documentation and missing values. For instance, demographic variables such as age were consistently recorded at baseline, whereas other clinical measures were intermittently missing across patient records. To reduce bias and maintain data integrity, we implemented a structured imputation strategy. The proportion of missing data for each feature in the Erlangen training dataset is summarized in Table 2.
Table 2.
The selected features and percentages of missing data in the training dataset.
We applied the Multiple Imputation by Chained Equations (MICE) method [25] for variables such as DAS28 and its components. This method models each missing value using available data from all patients collectively. MICE is well-suited to datasets with up to 20% missingness and helps to maintain both statistical accuracy and overall data integrity. For variables that exhibited linear trends or relationships, we additionally applied linear imputation techniques, such as the nearest available observation (NAO) and extrapolation [26,27,28].
2.3. Model Design and Evaluation
After preparing the input features, we applied MinMax scaling to normalize the dataset. The scaler was fitted exclusively on the training folds and then applied to the training and test data to prevent data leakage. Next, we applied eight ML regression algorithms to predict DAS28-CRP scores at the 12-month follow-up. The regression models evaluated in this study included Support Vector Regression (SVR) [29], Ridge [30], Lasso [31], Random Forest [32], K-Nearest Neighbors (KNN) Regression [33], Decision Tree [34], AdaBoost [35], and XGBoost [36].
To ensure robust model evaluation and reduce the risk of overfitting, we employed a nested cross-validation strategy [37]. This approach separated hyperparameter optimization from performance assessment using a two-tiered structure. The outer loop performed 5-fold cross-validation to estimate the model’s generalization performance, while the inner loop applied 3-fold cross-validation to optimize hyperparameters using a randomized search, as detailed in Appendix A Table A1. Model performance was evaluated using mean absolute error (MAE), mean squared error (MSE), and the coefficient of determination (R2) as the primary metric.
In each iteration of the outer loop, the training set was split into three folds in the inner loop. Two of these were used for training, and one was used for validation. The best-performing hyperparameters identified in the inner loop were then used to train the model on the full outer-loop training data. The model was subsequently evaluated on the held-out test fold. This process was repeated for all outer-loop folds to ensure unbiased performance estimates.
After predicting continuous DAS28-CRP values, we further categorized patients into remission and non-remission groups based on the commonly used threshold of 2.6, as defined by the EULAR criteria [38]. While our primary model evaluation was based on regression error metrics such as mean absolute error (MAE), this categorizing step was included to support interpretability and facilitate comparison with existing classification-based approaches. Accuracy and F1 score were calculated for each outer-loop fold to assess classification performance, complementing the main regression-based assessment. A flowchart illustrating the overall methodology of this study is presented in Figure 1.

Figure 1.
The flowchart of our model.
To assess the generalizability of our models, we performed an external validation using an independent dataset from the Austrian BioReg registry. This dataset includes a more diverse and heterogeneous population of RA patients, collected from multiple clinical sites across Austria. For evaluation, the BioReg data were pre-labeled as remission or non-remission based on DAS28-CRP scores using the EULAR-defined threshold of 2.6. We applied our trained models to this external dataset, predicted the DAS28-CRP scores, and manually derived standard classification metrics, including accuracy, precision, recall, and F1 score, based on the predicted values. This external validation provided valuable insights into the robustness and real-world applicability of our approach across varied clinical environments.
2.4. Software
We conducted all data preprocessing, model training, evaluation, and analysis using Python 3.9, with libraries such as Scikit-learn, Pandas, and NumPy.
3. Results
The internal dataset included 154 patients with rheumatoid arthritis (RA) and 13 routinely collected clinical features (see Table 1). These included demographics, laboratory markers, joint counts, and composite disease activity scores. We evaluated eight ML models—Ridge, Lasso, SVR, Random Forest, Decision Tree, KNN, AdaBoost, and XGBoost—on two prediction tasks: (1) regression of 12-month DAS28-CRP scores following bDMARD therapy and (2) classification of remission status based on the EULAR threshold. All models were trained on the internal dataset and externally validated using the Austrian BioReg registry. Model performance was assessed using standard metrics and evaluated for fairness across age groups. We also analyzed feature importance stability.
3.1. Regression Performance
Table 3 summarizes the regression performance using MAE, MSE, and R2 based on nested cross-validation for the internal cohort and direct evaluation on the external cohort. Overall, Ridge regression achieved the best performance across both datasets, with the lowest MAE and MSE and highest R2 values (MAE = 0.633, R2 = 0.542 internally; MAE = 0.678, R2 = 0.491 externally). Lasso and SVR followed closely behind. In contrast, Decision Tree and KNN consistently underperformed, exhibiting higher errors and lower R2 scores, indicating weaker generalization.
Table 3.
The regression performances on internal and external datasets. Bold indicates the best value per column.
The strong performance of Ridge can be attributed to its regularization, which shrinks but retains all input features, thus reducing overfitting while preserving informative signals, especially in datasets with collinear predictors, such as clinical measurements.
All features were scaled using MinMax normalization, which slightly outperformed standard and robust scaling across key metrics for the Ridge model. It yielded the highest R2, accuracy, and F1 score and the lowest MAE. Given its consistent but modest advantage, MinMax was selected as the preferred scaling method.
For context, the observed DAS28-CRP scores ranged from 0.00 to 8.42, capturing the full spectrum from remission to high disease activity. With this range in mind, an MAE value of 0.63 indicates relatively precise prediction, suitable for stratifying disease progression at the population level.
3.2. Classification Performance
To enable clinical interpretation, continuous DAS28-CRP predictions were binarized using the established EULAR threshold of 2.6 into remission and non-remission categories. Classification performance was evaluated using accuracy, precision, recall, and F1 score (Table 4).
Table 4.
The classification performances on internal and external datasets. Bold indicates the best value per column.
Ridge, SVR, and Lasso achieved the best classification performances on the internal dataset, with Ridge obtaining the highest accuracy (0.818) and F1 score (0.800). These results are consistent with the regression findings. In contrast, Decision Tree and KNN lagged behind in all metrics.
We then assessed generalizability using the external BioReg dataset. Ridge again emerged as the top-performing model (accuracy = 0.773, F1 = 0.762), followed by Lasso and SVR. Although tree-based models such as AdaBoost and XGBoost demonstrated high recall, their precision was notably lower, leading to reduced F1 scores. This pattern indicates that these models tend to overpredict remission.
To better understand this behavior, we analyzed class distributions. The internal dataset was relatively balanced (46.4% remission), while the external dataset was moderately imbalanced (only 39.8% in remission). This imbalance likely influenced model behavior, particularly precision–recall trade-offs. Models like AdaBoost and SVR achieved high recall by predicting more positive (remission) cases, but this came at the cost of precision. These findings emphasize the importance of considering both precision and recall in imbalanced clinical classification tasks.
3.3. Fairness Across Age Groups
To assess potential bias, we evaluated model accuracy across younger (<55 years) and older (≥55 years) age groups, using 55 as the threshold based on the median age in the dataset. Table 5 reports the classification accuracy for each subgroup and the performance gap.
Table 5.
Fairness evaluation by age: classification accuracy for patients younger and older than 55 years old. Gap = |Accuracy<55 − Accuracy years|.
Ridge and SVR demonstrated the most balanced performances, with age-based accuracy gaps of only 0.024 and 0.022, respectively. In contrast, tree-based models such as AdaBoost and XGBoost showed wider disparities. These results suggest that regularized linear models are not only more generalizable but also fairer in terms of age subgroup performances.
3.4. Feature Importance and Model Stability
To examine model interpretability and generalizability, we used SHAP (SHapley Additive exPlanations), a game-theoretic approach that quantifies each feature’s contribution to model predictions. The SHAP summary plots rank features by their overall importance across the dataset. Each point represents an individual patient, with the x-axis showing the magnitude and direction of that feature’s impact on the predicted disease activity score. Point color reflects the feature value—red for high and blue for low—enabling intuitive interpretation of how feature levels influence predictions. For instance, in the internal cohort (Figure 2), where the patient’s global health assessment is the most influential feature, the plot shows that patients with high VAS scores (red points) have positive SHAP values, indicating that a patient’s self-reported disease activity directly contributes to a higher predicted DAS28-CRP score.
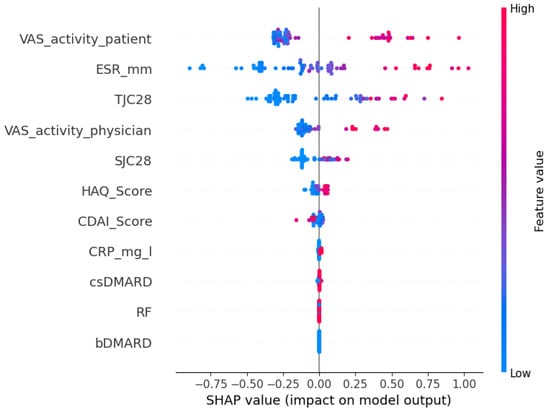
Figure 2.
A SHAP summary plot of feature importance for Ridge on the internal cohort.
As shown in Figure 2 and Figure 3, the top five most predictive features were consistent across both cohorts: a patient’s global health assessment (VAS), ESR, TJC28, a physician’s global health assessment (VAS), and SJC28. Although the order of the top features varied slightly, the consistency in key predictors confirms that Ridge captures stable clinical signals transferable across populations.
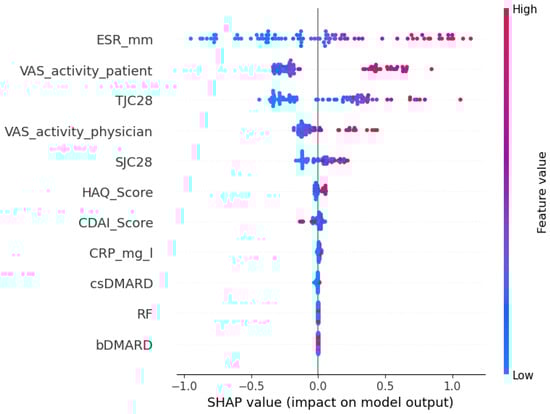
Figure 3.
A SHAP summary plot of feature importance for Ridge on the external cohort.
3.5. Summary
Ridge regression consistently demonstrated the best overall performance across all evaluation criteria. It achieved high predictive accuracy in both regression and classification tasks, generalized effectively to an external cohort, and maintained stable performance across age groups. Furthermore, it relied on consistent and clinically meaningful features, supporting interpretability. These results highlight Ridge regression as a robust, generalizable, and practical model for predicting treatment outcomes in RA, with strong potential for integration into personalized clinical decision-making.
4. Discussion
This study evaluated the feasibility of using baseline clinical data to predict 12-month disease activity in patients with RA who were beginning bDMARD therapy. By applying ML models to estimate continuous DAS28-CRP scores and subsequently categorizing patients using a clinically relevant remission threshold, we developed a flexible and interpretable framework that extends beyond binary classification.
Among the eight ML models tested, Ridge regression consistently achieved the strongest performance, demonstrating the highest internal R2, lowest prediction errors, and best classification metrics. Lasso and SVR also performed well, while tree-based models like Decision Tree and AdaBoost underperformed, especially on external validation. These results underscore the suitability of regularized linear models for clinical prediction tasks involving structured, tabular data and relatively small cohorts.
External validation using the Austrian BioReg dataset revealed a modest decline in model performance, as expected due to differences in cohort characteristics and data collection procedures. Notably, Ridge regression maintained solid generalizability, with a classification accuracy of 0.773 and an F1 score of 0.762. In terms of regression, Ridge also yielded the lowest external mean absolute error (MAE = 0.678) and the highest R2 value (0.491) among all tested models. These results highlight Ridge’s ability to retain meaningful predictive signals across clinical settings and confirm its value as a robust choice for generalizable outcome modeling in RA.
The modest decline in performance observed during external validation likely reflects clinical and methodological differences between the Erlangen and BioReg cohorts. As shown in Table 1, BioReg patients had higher average CRP levels and significantly lower csDMARD co-medication rates, suggesting differences in baseline inflammation and treatment protocols. Additionally, the BioReg cohort was drawn from multiple outpatient clinics and private practices, which may introduce variation into data documentation and patient management compared to the single-center Erlangen cohort. These cohort-specific differences may have contributed to the observed distribution shift, partially explaining the drop in predictive accuracy. Such performance variation is expected when transitioning from a controlled academic setting to a heterogeneous real-world population and highlights the importance of external validation in assessing model generalizability.
To further investigate model interpretability and generalizability, we examined feature importance using the SHAP values for the best-performing Ridge model. Across both the internal and external cohorts, the top five most influential features were largely consistent: the patient’s global health assessment (VAS), the erythrocyte sedimentation rate (ESR), the tender joint count (TJC28), the physician’s global assessment (VAS), and the swollen joint count (SJC28). While the exact ordering of feature importance varied slightly between datasets, the stability of these core predictors suggests that Ridge regression captures clinically meaningful signals that generalize across populations. This interpretability is especially important in clinical settings, where understanding the drivers of model predictions can support clinician confidence and informed decision-making.
By modeling DAS28-CRP as a continuous outcome rather than a binary label, our approach allows clinicians to interpret disease activity more flexibly. Remission criteria vary between guidelines, such as those from EULAR and ACR, and have evolved over time. Predicting a continuous disease activity score enables clinicians to apply whichever threshold is appropriate for their specific clinical context, offering greater utility than a fixed classification scheme. In practice, treatment decisions are often guided not only by whether a patient crosses a defined cutoff (e.g., DAS28-CRP < 2.6) but also by how close they are to it. For instance, a predicted score of 2.7 might prompt continued monitoring or minor treatment adjustments, whereas a value of 4.5 would suggest a clearly insufficient response. By providing a full-spectrum estimate of disease activity, the model supports more nuanced and individualized care while remaining adaptable to different remission definitions or local standards.
In clinical practice, the model output could help to identify patients less likely to respond to the selected bDMARD. This information could support more frequent monitoring, early treatment escalation, or the selection of an alternative bDMARD class. Such individualized guidance could help to avoid prolonged ineffective treatment and enable faster achievement of disease control.
Few prior studies have modeled DAS28-CRP as a continuous outcome, limiting opportunities for the direct comparison of regression results. To enable performance benchmarking, we additionally converted our regression outputs into binary remission classifications using the standard DAS28-CRP threshold. This allowed us to assess classification metrics commonly reported in the literature. Our models achieved over 80% accuracy and F1 score on internal data and over 75% on the external dataset—performance levels that are comparable to or exceed those typically reported for similar clinical prediction tasks. These results support the validity and robustness of our regression framework, even when viewed through the lens of conventional binary evaluation metrics.
Despite these encouraging results, several limitations should be considered. The sample size, particularly in the external validation cohort, was relatively modest, which may affect generalizability and model stability. The models were trained exclusively on baseline clinical features available at the initiation of bDMARD therapy. While this supports early risk stratification, it does not capture subsequent changes in disease activity or short-term treatment response. Incorporating early follow-up data, such as 3-month DAS28-CRP scores, could enhance predictive accuracy and enable more adaptive treatment planning. Additionally, our reliance on routinely collected clinical variables means that potentially important but unmeasured confounders, such as smoking status, physical activity, or socioeconomic factors, were not included. The model also did not differentiate between bDMARD classes, such as TNF inhibitors and JAK inhibitors, which may vary in effectiveness and response patterns. Future work could explore stratified modeling approaches to better account for this therapeutic heterogeneity.
While the model demonstrated strong performance in retrospective evaluation, prospective studies are needed to validate its clinical utility and robustness in real-world settings. Future research should also examine the integration of early treatment response signals and evaluate performance across more diverse populations.
Overall, this study demonstrates that ML models trained on routine clinical data can support remission prediction in RA. The ability to identify patients who are less likely to respond to bDMARDs early in the treatment process could reduce unnecessary delays, improve patient outcomes, and inform more personalized treatment strategies. With further validation and refinement, these models have the potential to become valuable tools in clinical rheumatology.
5. Conclusions
This study presents a ML framework for predicting 12-month disease activity in patients with RA beginning bDMARD therapy based on baseline clinical data. By modeling DAS28-CRP as a continuous outcome, our approach offers greater interpretability and clinical flexibility compared to binary classification. Ridge regression consistently delivered the most reliable performance across both internal and external cohorts, demonstrating the potential for robust, generalizable predictions in diverse clinical settings. The model supports individualized treatment planning by enabling the early identification of patients at risk of poor disease control, thereby contributing to more timely and targeted therapeutic decisions in rheumatology practice.
Author Contributions
Conceptualization, F.S., A.K., and B.M.E.; methodology, F.S. and S.Z.; software, F.S., M.H., and A.A.; validation, F.S., S.Z., S.Z., A.K., G.S., and A.A.; formal analysis, F.S., M.H., and S.Z.; investigation, F.S. and S.Z.; resources, G.S., A.K., and R.F.-S.; data curation, F.S., A.K., S.B., G.S., and S.B.; writing—original draft preparation, F.S., S.Z., A.A., and M.H.; writing—review and editing, S.B., S.Z., M.H., R.F.-S., and B.M.E.; visualization, F.S., S.Z., and M.H.; supervision, G.S. and B.M.E.; project administration, F.S.; funding acquisition, A.K., G.S., and B.M.E. All authors have read and agreed to the published version of the manuscript.
Funding
This research received no external funding.
Institutional Review Board Statement
This study was conducted in accordance with the Declaration of Helsinki and approved by the Ethics Committee of Friedrich-Alexander University Erlangen-Nürnberg (protocol codes 334-18 B and 333-16 B). The external BioReg dataset was collected under ethical approval GS4-EK-4/085-2009, covering patient enrollment in Austria through private practices and outpatient clinics.
Informed Consent Statement
Patient consent was waived as there was no intervention other than routine clinical data collection and patients were anonymized.
Data Availability Statement
The Erlangen dataset analyzed in this study is openly available on Zenodo at https://zenodo.org/records/15689910. The BioReg dataset is not publicly available due to ethical and legal restrictions; access may be granted upon reasonable request and subject to approval by the BioReg ethics committee.
Acknowledgments
The authors wish to thank Fabian Hartmann at the University Hospital Erlangen for his assistance with data collection.
Conflicts of Interest
The authors declare no conflicts of interest. The funders had no role in the design of this study; the collection, analysis, or interpretation of data; the writing of this manuscript; or the decision to publish the results.
Abbreviations
The following abbreviations are used in this manuscript:
| RA | Rheumatoid Arthritis |
| DAS28 | Disease Activity Score for 28 joints |
| CRP | C-Reactive Protein |
| bDMARDs | Biological Disease-Modifying Antirheumatic Drugs |
| ML | Machine Learning |
| ACR | American College of Rheumatology |
| EULAR | European League Against Rheumatism |
| VAS | Visual Analog Scale |
| SJC28 | Swollen Joint Count (28 joints) |
| TJC28 | Tender Joint Count (28 joints) |
| csDMARDs | Conventional Synthetic Disease-Modifying Antirheumatic Drugs |
| MICE | Multiple Imputation by Chained Equations |
| NAO | Nearest Available Observation |
| SVR | Support Vector Regression |
| KNN | K-Nearest Neighbors |
| MAE | Mean Absolute Error |
| MSE | Mean Squared Error |
| R2 | Coefficient of Determination |
Appendix A. Hyperparameter Search Space and Descriptive Statistics
The table below summarizes the hyperparameter search space used for the randomized search during model tuning.
Table A1.
Hyperparameter ranges used during model tuning.
Table A1.
Hyperparameter ranges used during model tuning.
| Model | Search Space |
|---|---|
| Lasso | alpha ∈ logspace(, , 20) |
| Ridge | alpha ∈ logspace(, , 20) |
| KNN | n_neighbors ∈ {1, 2, …, 14} |
| SVR | C ∈ logspace(, , 5); epsilon ∈ logspace(, , 5) |
| Random Forest | n_estimators ∈ {50, 100, 200}; max_depth ∈ {None, 10, 20}; |
| min_samples_split ∈ {2, 5} | |
| AdaBoost | n_estimators ∈ {50, 100}; learning_rate ∈ logspace(, , 5) |
| XGBoost | n_estimators ∈ {50, 100}; max_depth ∈ {3, 4, 5, 6, 7}; |
| learning_rate ∈ logspace(, , 5) | |
| Decision Tree | max_depth ∈ {3, …, 14}; min_samples_split ∈ {2, 5, 10} |
Table A2.
The descriptive statistics for baseline features in the Erlangen and BioReg cohorts. Values are reported as mean (SD) along with minimum, 25th percentile (Q1), median (Q2), 75th percentile (Q3), and maximum.
Table A2.
The descriptive statistics for baseline features in the Erlangen and BioReg cohorts. Values are reported as mean (SD) along with minimum, 25th percentile (Q1), median (Q2), 75th percentile (Q3), and maximum.
| Feature | Mean (SD) | Min | Q1 | Median | Q3 | Max |
|---|---|---|---|---|---|---|
| Erlangen (n = 154) | ||||||
| Age (years) | 53.21 (13.05) | 10 | 46 | 55 | 62 | 81 |
| CDAI Score | 8.95 (9.89) | 0.06 | 2 | 5.45 | 12.4 | 51.9 |
| CRP (mg/L) | 0.37 (0.48) | 0 | 2 | 5.45 | 12.4 | 51.9 |
| csDMARD | 0.62 (0.49) | 0 | 0 | 1 | 1 | 1 |
| DAS28-ESR Score | 2.97 (1.40) | 0 | 1.95 | 2.71 | 3.85 | 8.42 |
| ESR (mm/h) | 17.51 (16.09) | 0.006 | 6 | 14 | 22 | 100 |
| HAQ Score | 0.91 (0.76) | 0.005 | 0.13 | 0.75 | 1.59 | 3 |
| RF | 0.97 (0.16) | 0 | 1 | 1 | 1 | 1 |
| SJC28 | 2.40 (4.18) | 0 | 0 | 0 | 3 | 22 |
| TJC28 | 3.20 (4.80) | 0 | 0 | 1 | 4 | 24 |
| VAS activity (patient) | 32.35 (25.44) | 0 | 11.25 | 30 | 50 | 100 |
| VAS activity (physician) | 18.76 (19.37) | 0 | 3.25 | 11.31 | 28.56 | 85 |
| BioReg (n = 88) | ||||||
| Age (years) | 57.77 (13.93) | 24 | 47.75 | 60 | 68 | 82 |
| CDAI Score | 9.48 (9.56) | 0 | 2.9 | 5.95 | 13.25 | 49 |
| CRP (mg/L) | 6.80 (14.06) | 0 | 0.98 | 2 | 5 | 80 |
| csDMARD | 0.13 (0.33) | 0 | 0 | 0 | 0 | 1 |
| DAS28-ESR Score | 2.37 (1.12) | 0 | 1.54 | 2.24 | 2.96 | 6.9 |
| ESR (mm/h) | 17.47 (15.55) | 0 | 4.75 | 13.5 | 25.25 | 71 |
| HAQ Score | 0.84 (0.68) | 0 | 0.25 | 0.75 | 1.37 | 2.75 |
| RF | 0.43 (0.50) | 0 | 0 | 0 | 1 | 1 |
| SJC28 | 2.10 (2.30) | 0 | 0 | 1 | 3.25 | 10 |
| TJC28 | 3.70 (4.72) | 0 | 0 | 2 | 5 | 21 |
| VAS activity (patient) | 33.28 (22.95) | 0 | 15 | 30 | 50 | 90 |
| VAS activity (physician) | 17.91 (17.61) | 0 | 5 | 12.5 | 25 | 90 |
References
- Firestein, G.S. Evolving concepts of rheumatoid arthritis. Nature 2003, 423, 356–361. [Google Scholar] [CrossRef]
- McInnes, I.B.; Schett, G. The pathogenesis of rheumatoid arthritis. N. Engl. J. Med. 2011, 365, 2205–2219. [Google Scholar] [CrossRef] [PubMed]
- Alamanos, Y.; Drosos, A.A. Epidemiology of adult rheumatoid arthritis. Autoimmun. Rev. 2005, 4, 130–136. [Google Scholar] [CrossRef] [PubMed]
- Ibrahim, F.; Scott, I.C.; Scott, D.L.; Ayis, S.A. Heterogeneity of treatment responses in rheumatoid arthritis using group based trajectory models: Secondary analysis of clinical trial data. BMC Rheumatol. 2023, 7, 33. [Google Scholar] [CrossRef] [PubMed]
- Smolen, J.S.; Landewé, R.B.; Bergstra, S.A.; Kerschbaumer, A.; Sepriano, A.; Aletaha, D.; Caporali, R.; Edwards, C.J.; Hyrich, K.L.; Pope, J.E.; et al. EULAR recommendations for the management of rheumatoid arthritis with synthetic and biological disease-modifying antirheumatic drugs: 2022 update. Ann. Rheum. Dis. 2023, 82, 3–18. [Google Scholar] [CrossRef]
- Smolen, J.S.; Landewé, R.B.; Bijlsma, J.W.; Burmester, G.R.; Dougados, M.; Kerschbaumer, A.; McInnes, I.B.; Sepriano, A.; Van Vollenhoven, R.F.; De Wit, M.; et al. EULAR recommendations for the management of rheumatoid arthritis with synthetic and biological disease-modifying antirheumatic drugs: 2019 update. Ann. Rheum. Dis. 2020, 79, 685–699. [Google Scholar] [CrossRef]
- Buch, M.H. Defining refractory rheumatoid arthritis. Ann. Rheum. Dis. 2018, 77, 966–969. [Google Scholar] [CrossRef]
- Lee, S.; Kang, S.; Eun, Y.; Won, H.H.; Kim, H.; Lee, J.; Koh, E.M.; Cha, H.S. Machine learning-based prediction model for responses of bDMARDs in patients with rheumatoid arthritis and ankylosing spondylitis. Arthritis Res. Ther. 2021, 23, 1–12. [Google Scholar] [CrossRef]
- Aletaha, D.; Kapral, T.; Smolen, J. Toxicity profiles of traditional disease modifying antirheumatic drugs for rheumatoid arthritis. Ann. Rheum. Dis. 2003, 62, 482–486. [Google Scholar] [CrossRef]
- De La Torre, I.; Valor, L.; Nieto, J.C.; Hernandez, D.; Martinez, L.; Gonzalez, C.M.; Monteagudo, I.; Longo, J.L.; Montoro, M.; Carreño, L. Anti-TNF treatments in rheumatoid arthritis: Economic impact of dosage modification. Expert Rev. Pharmacoeconomics Outcomes Res. 2013, 13, 407–414. [Google Scholar] [CrossRef]
- Isaacs, J.D.; Ferraccioli, G. The need for personalised medicine for rheumatoid arthritis. Ann. Rheum. Dis. 2011, 70, 4–7. [Google Scholar] [CrossRef] [PubMed]
- Kufel, J.; Bargieł-Łączek, K.; Kocot, S.; Koźlik, M.; Bartnikowska, W.; Janik, M.; Czogalik, Ł.; Dudek, P.; Magiera, M.; Lis, A.; et al. What is machine learning, artificial neural networks and deep learning?—Examples of practical applications in medicine. Diagnostics 2023, 13, 2582. [Google Scholar] [CrossRef] [PubMed]
- Collins, J.E.; Johansson, F.D.; Gale, S.; Kim, S.; Shrestha, S.; Sontag, D.; Stratton, J.; Trinh, H.; Xu, C.; Losina, E.; et al. Predicting remission among patients with rheumatoid arthritis starting tocilizumab monotherapy: Model derivation and remission score development. ACR Open Rheumatol. 2020, 2, 65–73. [Google Scholar] [CrossRef] [PubMed]
- Hügle, M.; Omoumi, P.; van Laar, J.M.; Boedecker, J.; Hügle, T. Applied machine learning and artificial intelligence in rheumatology. Rheumatol. Adv. Pract. 2020, 4, rkaa005. [Google Scholar] [CrossRef]
- Salehi, F.; Bayat, S.; Schett, G.; Kleyer, A.; Altstidl, T.; Eskofier, B.M. ExSMART-PreRA: Explainable Survival and Risk Assessment Using Machine Learning for Time Estimation in Preclinical Rheumatoid Arthritis. IEEE J. Biomed. Health Inform. 2025, 29, 6017–6028. [Google Scholar] [CrossRef]
- Ukalovic, D.; Leeb, B.F.; Rintelen, B.; Eichbauer-Sturm, G.; Spellitz, P.; Puchner, R.; Herold, M.; Stetter, M.; Ferincz, V.; Resch-Passini, J.; et al. Prediction of ineffectiveness of biological drugs using machine learning and explainable AI methods: Data from the Austrian Biological Registry BioReg. Arthritis Res. Ther. 2024, 26, 44. [Google Scholar] [CrossRef]
- Xie, H.; Fan, J. Machine learning in the prediction of treatment response in rheumatoid arthritis: A systematic review: Serum uric acid in anti-MDA5 antibody-positive dermatomyositis. In Seminars in Arthritis and Rheumatism; Elsevier: Amsterdam, The Netherlands, 2024; p. 152501. [Google Scholar]
- Koo, B.S.; Eun, S.; Shin, K.; Yoon, H.; Hong, C.; Kim, D.H.; Hong, S.; Kim, Y.G.; Lee, C.K.; Yoo, B.; et al. Machine learning model for identifying important clinical features for predicting remission in patients with rheumatoid arthritis treated with biologics. Arthritis Res. Ther. 2021, 23, 1–10. [Google Scholar] [CrossRef]
- Rivellese, F.; Surace, A.E.; Goldmann, K.; Sciacca, E.; Çubuk, C.; Giorli, G.; John, C.R.; Nerviani, A.; Fossati-Jimack, L.; Thorborn, G.; et al. Rituximab versus tocilizumab in rheumatoid arthritis: Synovial biopsy-based biomarker analysis of the phase 4 R4RA randomized trial. Nat. Med. 2022, 28, 1256–1268. [Google Scholar] [CrossRef]
- Yoosuf, N.; Maciejewski, M.; Ziemek, D.; Jelinsky, S.A.; Folkersen, L.; Müller, M.; Sahlström, P.; Vivar, N.; Catrina, A.; Berg, L.; et al. Early prediction of clinical response to anti-TNF treatment using multi-omics and machine learning in rheumatoid arthritis. Rheumatology 2022, 61, 1680–1689. [Google Scholar] [CrossRef]
- Salehi, F.; Lopera Gonzalez, L.I.; Bayat, S.; Kleyer, A.; Zanca, D.; Brost, A.; Schett, G.; Eskofier, B.M. Machine Learning Prediction of Treatment Response to Biological Disease-Modifying Antirheumatic Drugs in Rheumatoid Arthritis. J. Clin. Med. 2024, 13, 3890. [Google Scholar] [CrossRef]
- Salehi, F.; Salin, E.; Smarr, B.; Bayat, S.; Kleyer, A.; Schett, G.; Fritsch-Stork, R.; Eskofier, B.M. A robust machine learning approach to predicting remission and stratifying risk in rheumatoid arthritis patients treated with bDMARDs. Sci. Rep. 2025, 15, 23960. [Google Scholar] [CrossRef]
- Studenic, P.; Aletaha, D.; de Wit, M.; Stamm, T.A.; Alasti, F.; Lacaille, D.; Smolen, J.S.; Felson, D.T. American College of Rheumatology/EULAR remission criteria for rheumatoid arthritis: 2022 revision. Ann. Rheum. Dis. 2023, 82, 74–80. [Google Scholar] [CrossRef] [PubMed]
- Mendoza-Pinto, C.; Sánchez-Tecuatl, M.; Berra-Romani, R.; Maya-Castro, I.D.; Etchegaray-Morales, I.; Munguía-Realpozo, P.; Cárdenas-García, M.; Arellano-Avendaño, F.J.; García-Carrasco, M. Machine learning in the prediction of treatment response in rheumatoid arthritis: A systematic review. Semin. Arthritis Rheum. 2024, 68, 152501. [Google Scholar] [CrossRef] [PubMed]
- Mongin, D.; Lauper, K.; Turesson, C.; Hetland, M.L.; Kristianslund, E.K.; Kvien, T.K.; Santos, M.J.; Pavelka, K.; Iannone, F.; Finckh, A.; et al. Imputing missing data of function and disease activity in rheumatoid arthritis registers: What is the best technique? RMD Open 2019, 5, e000994. [Google Scholar] [CrossRef] [PubMed]
- England, B.R.; Sokolove, J.; Robinson, W.H.; Thiele, G.M.; Ganti, A.K.; Sayles, H.; Michaud, K.; Caplan, L.; Davis, L.A.; Cannon, G.W.; et al. Associations of circulating cytokines and chemokines with cancer mortality in men with rheumatoid arthritis. Arthritis Rheumatol. 2016, 68, 2394–2402. [Google Scholar] [CrossRef]
- Jakobsen, J.C.; Gluud, C.; Wetterslev, J.; Winkel, P. When and how should multiple imputation be used for handling missing data in randomised clinical trials–a practical guide with flowcharts. BMC Med. Res. Methodol. 2017, 17, 162. [Google Scholar] [CrossRef]
- Hayati Rezvan, P.; Lee, K.J.; Simpson, J.A. The rise of multiple imputation: A review of the reporting and implementation of the method in medical research. BMC Med. Res. Methodol. 2015, 15, 30. [Google Scholar] [CrossRef]
- Smola, A.J.; Schölkopf, B. A tutorial on support vector regression. Stat. Comput. 2004, 14, 199–222. [Google Scholar] [CrossRef]
- McDonald, G.C. Ridge regression. Wiley Interdiscip. Rev. Comput. Stat. 2009, 1, 93–100. [Google Scholar] [CrossRef]
- Muthukrishnan, R.; Rohini, R. LASSO: A feature selection technique in predictive modeling for machine learning. In Proceedings of the 2016 IEEE International Conference on Advances in Computer Applications (ICACA), Coimbatore, India, 24 October 2016; pp. 18–20. [Google Scholar]
- Segal, M.R. Machine Learning Benchmarks and Random Forest Regression. 2004. Available online: https://escholarship.org/uc/item/35x3v9t4 (accessed on 7 August 2025).
- Kramer, O.; Kramer, O. K-nearest neighbors. In Dimensionality Reduction with Unsupervised Nearest Neighbors; Springer: Berlin, Germany, 2013; pp. 13–23. [Google Scholar]
- Tso, G.K.; Yau, K.K. Predicting electricity energy consumption: A comparison of regression analysis, decision tree and neural networks. Energy 2007, 32, 1761–1768. [Google Scholar] [CrossRef]
- Solomatine, D.P.; Shrestha, D.L. AdaBoost. RT: A boosting algorithm for regression problems. In Proceedings of the 2004 IEEE International Joint Conference on Neural Networks (IEEE Cat. No. 04CH37541), New York, NY, USA, 25–29 July 2004; Volume 2, pp. 1163–1168. [Google Scholar]
- Chen, T.; He, T.; Benesty, M.; Khotilovich, V.; Tang, Y.; Cho, H.; Chen, K.; Mitchell, R.; Cano, I.; Zhou, T.; et al. Xgboost: Extreme gradient boosting. R Package Version 0.4-2 2015, 1, 1–4. [Google Scholar]
- Vodencarevic, A.; Tascilar, K.; Hartmann, F.; Reiser, M.; Hueber, A.J.; Haschka, J.; Bayat, S.; Meinderink, T.; Knitza, J.; Mendez, L.; et al. Advanced machine learning for predicting individual risk of flares in rheumatoid arthritis patients tapering biologic drugs. Arthritis Res. Ther. 2021, 23, 1–8. [Google Scholar] [CrossRef]
- Fransen, J.; Creemers, M.; Van Riel, P. Remission in rheumatoid arthritis: Agreement of the disease activity score (DAS28) with the ARA preliminary remission criteria. Rheumatology 2004, 43, 1252–1255. [Google Scholar] [CrossRef]


Disclaimer/Publisher’s Note: The statements, opinions and data contained in all publications are solely those of the individual author(s) and contributor(s) and not of MDPI and/or the editor(s). MDPI and/or the editor(s) disclaim responsibility for any injury to people or property resulting from any ideas, methods, instructions or products referred to in the content. |
© 2025 by the authors. Licensee MDPI, Basel, Switzerland. This article is an open access article distributed under the terms and conditions of the Creative Commons Attribution (CC BY) license (https://creativecommons.org/licenses/by/4.0/).