Abstract
The use of agrochemicals in agriculture is widespread globally, as it enables increased crop yields. However, they also contain heavy metals such as copper and nickel, which can leach into the drinking water and harm the environment and human health. As such, it is imperative that they are removed from drinking water. One way to achieve this is through adsorption using biosorbents. This proof-of-concept study aimed to synthesize and characterize environmentally friendly hydrogels from sodium alginate (SA) and pomegranate peel powder (PPP). The gels were characterized using Fourier-Transform Infrared Spectroscopy (FTIR), Scanning Electron Microscopy (SEM), and water uptake tests. The FTIR analysis confirmed the presence of the expected functional groups, SEM revealed that incorporating PPP enhanced the roughness and porosity of the gels, and gels with PPP incorporation were able to absorb 1.58 times more water than SA-only gels. Moreover, their ability to remediate copper and nickel from contaminated water was tested. Here, the effects of contact time, pH, and adsorbent amount were tested for copper, demonstrating that the optimal contact time was 60 min, the optimal pH was ~5, and 0.01 g of adsorbent was needed for optimal adsorption. The effect of contact time was tested for nickel, and it was found that the optimal contact time was 5 min. Overall, these gels show promising results for the remediation of copper and nickel from contaminated water.
1. Introduction
Agrochemicals contain essential nutrients to aid in crop productivity and chemicals to prevent attacks from herbs, pests, and fungi, but many of them contain heavy metals such as copper and nickel which are hazardous to human health [1,2,3,4,5,6]. Copper is a vital metal for plants as it aids in the prevention of many diseases such as grape downy mildew [7]. As such, it can be intentionally incorporated into agrochemicals [7]. Copper is also essential in trace amounts for many physiological processes in humans such as energy production and for the reduction in oxidative stress [7]. However, in excess amounts, it can lead to conditions such as Alzheimer’s Disease (AD) [7]. Similarly, nickel is important for plant growth and development, such as seed germination, so it can be incorporated into agrochemicals [8]. However, it is toxic to plants at increased concentrations [8]. It is also toxic to humans at high concentrations and may lead to lung fibrosis and even cancer [8]. As such, removing these contaminants from contaminated water is important to prevent these long-term effects.
Several methods for the removal of pollutants such as heavy metals from contaminated water have been explored [9]. Of these, adsorption is the most explored as it is cost-effective, has a high removal capacity, and is easy to implement [9]. However, it can also have disadvantages depending on the type of adsorbent used [10]. For instance, the stability of many common adsorbents such as activated carbon remain low, which means that wastewater conditions are harsh for them to survive as they cannot maintain their structure, function, and performance [10]. Also, for many adsorbents, the ability to be recovered from wastewater and be reused for multiple rounds of adsorption is limited [10].
With that, biosorbents are a more environmentally friendly alternative to synthetic ones [9,10,11]. Biosorbents have been shown to be more efficient as they contain a variety of functional groups such as carboxylic acid and hydroxyl groups on their surface, which allows for higher efficiency than traditional adsorbents [9]. They can remove pollutants via interactions such as electrostatic, aggregation, ion exchange, and oxidation/reduction [9]. Biosorbents also tend to have greater stability, and increased recovery and reusability, both achieved by chemical modification [10]. In addition, they have been shown to remove a multitude of contaminants such as heavy metals and dyes [10].
Hydrogels—three-dimensional polymer networks that are crosslinked and contain water—as adsorbents have been gaining more attention recently as an alternative to traditional ones [12]. They are hydrophilic and can maintain their structural stability while holding on to a large quantity of water [12]. As such, they are ideal candidates to remove pollutants from contaminated water [12]. Currently, there are several types of hydrogels such as alginate-based ones, with the ability to remove various types of pollutants such as heavy metals and dyes from contaminated water [9,10,11,12,13,14,15,16]. Alginate is a biodegradable, biocompatible, and non-toxic polymer and it consists of hydroxyl and carboxyl groups that can use mechanisms such as ion exchange and complexing to remove various heavy metals such as copper and nickel [16,17,18,19,20,21,22]. Unfortunately, it also tends to have decreased mechanical strength and stability, and usually degrades easily [16]. However, these issues can be solved by incorporating bioactive reagents which enhances their function and other properties such as mechanical strength [16]. One such bioactive compound is pomegranate (Punica granatum L.) peel. It contains varying chemical compounds such as alkaloids and minerals which have antioxidant, anti-cancer, and antibacterial properties [23,24]. It also contains structural carbohydrates such as pectin, lignin, cellulose, and hemicellulose. Furthermore, polyphenolic compounds, flavonoids, tannins, and organic acids are also present [23,25]. These introduce functional groups such as hydroxyl, carboxyl, and carbonyl groups, which can interact with heavy metals and other contaminants such as dyes, making it valuable in pollutant remediation from water [19,23,26,27,28,29,30]. Abbaz et al. (2023) and Wang and Zhang (2018) demonstrated that sodium alginate-pomegranate peel hydrogels (SA-PP-H) can successfully remove safranin-O and cyanobacterial blooms, respectively [19,30]. In addition, the production process of this type of gel remains green as it requires mild pH and temperature conditions and non-toxic, environmentally friendly reagents [19]. With this and given that pomegranate peel powder (PPP) has been successful in heavy metal removal, SA-PP-H has the potential to remediate heavy metals from contaminated water.
While the synthesis of SA-PP-H has been seen in literature, to the best of our knowledge, its ability to remove heavy metals such as copper and nickel has not been tested. In addition, previous studies have not looked at the cross-sections of these gels via Scanning Electron Microscopy (SEM) [19,30]. As such, the primary aim of this proof-of-concept study is to synthesize an environmentally friendly hydrogel from sodium alginate (SA) with a PPP incorporation for increased efficiency. This study aims to show that the synthesis of this hydrogel is feasible, and that it can be used for copper and nickel remediation from contaminated drinking water. By demonstrating this, it provides the framework for further optimization of the adsorption process using this hydrogel, testing mixed-metal solutions, and real water samples. The synthesis procedure is modified from Abbaz et al., 2023 [19]. Another aim is to characterize this gel via Fourier-Transform Infrared Spectroscopy (FTIR), SEM, diameter size, and water uptake capacity tests. Finally, various copper and nickel adsorption tests will be carried out with the SA-PP-H. These tests include the effect of contact time, initial pH and gel amount for copper, and the effect of contact time for nickel. Finally, Flame Atomic Absorption Spectrometry (FAAS) will be used to quantify the concentration of copper and nickel.
2. Materials and Methods
2.1. Materials and Reagents
Pomegranates were purchased from Chalo Freshco (2650 Lawrence Avenue East, Scarborough ON, M1P 2S1, Canada), 100% Pomegranate peel powder from the brand Mi Nature was purchased from Amazon (Seattle, WA, USA), Sodium Alginate (CAS-No: 9005-38-3) was purchased from Sigma Aldrich (St. Louis, MO, USA), Calcium Chloride Dihydrate, ACS grade (CAS No: 10035-04-8), 99.0–105.0% was purchased from Alfa Aesar (Ward Hill, MA, USA), TraceMetal Grade Nitric Acid (CAS No: 7697-37-2) was purchased from Fisher Chemicals (Landsmeer, The Netherlands), Cupric Nitrate Trihydrate (CAS No: 19004-19-4) and Nickel (II) nitrate hexahydrate (CAS No: 13478-00-7) were purchased from VWR BDH Chemicals (Leuven, Belgium), Sodium Hydroxide (NaOH) (CAS No 1310-73-2) was purchased from ACP Chemicals (Zelienople, PA, USA). RO/DI water and MilliQ water was used throughout.
SA was in the form of a white, odorless powder. PPP was a light brown, odorless powder.
2.2. Preparation PPP and Synthesis of SA-PP-H
To start, pomegranates were peeled, and the peels were rinsed with distilled water, and left overnight to airdry. After, they were oven-dried at 60 °C overnight then ground to a powder using a blender. The powder was then sieved through a 100-mesh sieve (PATIKIL, nylon and polypropylene) to obtain a fine powder. The powder was stored in 20 mL vials at −20 °C for future use.
The procedure for this synthesis was modified from Abbaz et al. (2023) [19]. To start, a 3% w/v SA solution was stirred and heated at 50 °C for 1 h. PPP was added to this solution to a final concentration of 3% w/v PPP and stirred until a homogenous dispersion was observed. This solution was then dropped into a 4% w/v CaCl2 solution using a Fisherbrand 5 mL plastic syringe (Luer-Lock sterile, 3 parts) and left overnight to stabilize. The beads were then subsequently washed three times with DI water to remove any excess CaCl2 and isolated via vacuum filtration. They were then oven-dried at 60 °C (instead of 50 °C) for approximately 24 h and stored in 20 mL scintillation vials at −20 °C for future use. SA-PP-H was synthesized twice for the 1.00 ratio of SA to PPP, and once each for the 0.00, 0.50, 0.75, 1.50, and 2.00 ratios. As a control, sodium alginate-hydrogels (SA-H) were prepared using this procedure without the addition of PPP. This was synthesized a total of two times. This process is visualized in Figure 1 below.
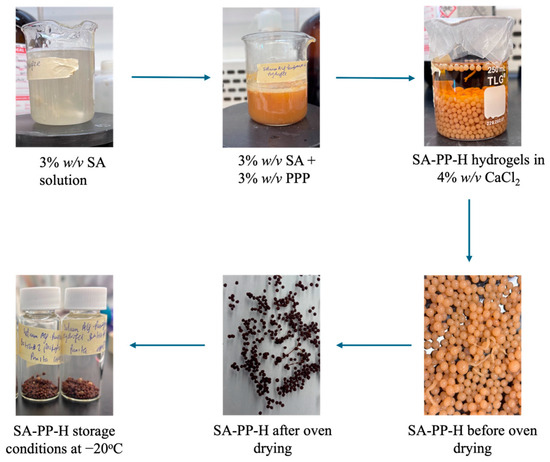
Figure 1.
Schematic diagram of sodium alginate-pomegranate peel hydrogel (SA-PP-H) synthesis.
2.3. Characterization Techniques
To characterize the gels, various techniques were used, including FTIR, SEM, diameter size, and water uptake capacity tests.
2.3.1. FTIR and SEM
FTIR was used to visualize the functional groups present on various samples. The Bruker Alpha-P ATR FTIR (Diamond ATR, Bruker, Billerica, MA, USA) was used. SA-PP-H and SA-H were used for FTIR. The cryogel samples were crushed to a fine powder using a mortar and pestle beforehand. FTIR spectra were recreated in Excel for visual representations.
SEM imaging was used to visualize the surface and cross-sections of cryogels. For this, SA-H, SA-PP-H before and after copper adsorption were used. Before SEM, the beads were frozen at −20 °C, and subsequently lyophilized (8 h freezing, 20 h drying). The beads were molted onto gold plates and visualized at 1.00 mm, 50.0 µm, and 100 µm.
2.3.2. Diameter Size
The diameter of the SA-PP-H and SA-H beads when wet, after drying, and after lyophilization was measured. To do this, ImageJ (Fiji, Bethesda, MD, USA, version 2.14.0/1.54f), an image processing software, was used. An amount of 24 beads were measured for each condition. Excel was used to create visual representations of the data obtained.
2.3.3. Water Uptake Capacity Tests
To test what concentration of PPP would be best for adsorption, hydrogels with different ratios of PPP to SA were synthesized using the procedure from Section 2.2 The ratios were 0.00, 0.50, 0.75, 1.00, 1.50, and 2.00.
Furthermore, to test the ability of the xerogels to take up water, ~0.07 g of SA-PP-H were weighed out and added to 10 mL of distilled water in a 20 mL scintillation vial (WHAETON, Millville, NJ, USA, borosilicate glass). After 1 h, the beads were isolated via vacuum filtration, using water to remove any beads that were stuck in the vial. They were gently patted with a kimwipe to remove any excess water. The beads were then re-weighed. This process was repeated for the SA-PP-H and the control SA-H. Three trials were conducted for each type of xerogel. To calculate the percent water uptake, Equation (1) was used. Here, mf represents the weight of the beads after water uptake, and mi represents the mass of the dried beads before water uptake [19]. Excel was used to create visual representations of the data obtained.
2.4. Batch Adsorption Tests
To test the ability of the SA-PP-H to adsorb copper and nickel, batch adsorption tests were conducted. All beads were lyophilized before adsorption tests. For these tests, Cu(NO3)2·3H2O and Ni(NO3)2·6H2O was used, and all solutions were diluted in 2% HNO3 (in MilliQ water). Here, nitrate salts were used to ensure compatibility with FAAS as FAAS is conducted in a nitric acid medium to ensure accurate readings [31,32,33]. Using nitrate salts reduces potential interference with multiple anions in solution and ensures a consistent ionic background across samples [31,32,33]. The pH of Cu(NO3)2·3H2O and Ni(NO3)2·6H2O was adjusted to ~5.5 and ~5, respectively (except for the effect of pH test), using 30% NaOH, based on the optimal pH ranges (4–7 for copper and ~5 for nickel) previously reported [34,35]. pH paper was used to monitor the pH (Fisherbrand, Waltham, MA, USA, pH 0.0–14.0). After adsorption, all solutions were diluted and filtered into 15 mL falcon tubes (VWR centrifuge tube) using a 10 mL plastic syringe (Air-Tite Luer-Lock, Virginia Beach, VA, USA) and a 0.22 µm syringe filter (ESBE, Markham, ON, Canada, nylon) in preparation for FAAS—a simple, sensitive, and cheap technique that can be used to detect trace levels of metals such as copper and nickel [34,35]. A calibration curve (R2 = 0.9998) was made using 0.2500 0.5000, 1.0000, 2.5000, and 5.000 mg/L Cu(NO3)2·3H2O in 2% HNO3. The same concentrations were used to construct a standard curve for Ni(NO3)2·6H2O (R2 = 0.9998). Thermo iCE 3500 Flame Absorption Spectrophotometer (Thermo Fisher Scientific Inc., Waltham, MA, USA, Acetylene/Air) was used to measure the adsorption of Cu(NO3)2·3H2O at 324.8 nm and Ni(NO3)2·6H2O at 231.8 nm [36,37]. Excel was used to create visual representations of the data obtained.
2.4.1. Effect of Contact Time
This test was used to test how time affects how much copper or nickel can be adsorbed by SA-PP-H. For each time point, ~0.07 g of cryogel beads were weighed out and added to 50 mL of 50 mg/L Cu(NO3)2·3H2O or 50 mg/L Ni(NO3)2·6H2O in a 50 mL beaker. The solutions were stirred at 400 rpm for 0, 5, 15, 30, 45, 60, 90, and 120 min for copper, and 0, 5, 30, 60, 90, and 120 min for nickel. At the specified time, some solution was aliquoted and diluted 10 folds with 2% HNO3, then filtered into a 15 mL falcon tube for FAAS. Three trials were conducted. FAAS was then used to measure the concentration of copper in the supernatant. Equation (2) was then used to calculate qt or adsorption capacity, which is the amount of adsorbate adsorbed per mass of adsorbent (hydrogel beads). Here, Co and Ce are the initial concentration and final concentrations of the adsorbates, respectively. V represents the volume of adsorbate in L, and m represents the mass of the adsorbent in g. The percent removal capacity (R%) was calculated using Equation (3).
2.4.2. Effect of Initial pH
To find the optimal pH for adsorption, this test was conducted. Approximately 0.07 g of SA-PP-H beads were weighed out and added to 10 mL of 50 mg/L Cu(NO3)2·3H2O at pH 1, 3, 5, and 13 (adjusted with 30% NaOH) in a 20 mL scintillation vial. The solution was stirred at 400 rpm for 60 min, then decanted, diluted 10 folds with 2% HNO3, filtered into 15 mL falcon tubes, and analyzed by FAAS. Three trials were conducted. Equation (2) was then used to calculate qt and Equation (3) was used to calculate R%.
2.4.3. Effect of Gel Amount
This test was used to examine how varying amounts of cryogel would affect the amount of copper that is adsorbed per weight of gel. To do this, varying amounts of SA-PP-H beads were weighed out (0.1, 0.2, 0.3, 0.4, and 0.5 g) and added to 10 mL of 50 mg/L Cu(NO3)2·3H2O in a 20 mL scintillation vial. The solutions were stirred at 400 rpm for 60 min, decanted, and diluted 10 folds with 2% HNO3, and filtered into a 15 mL flacon tube for FAAS analysis. Three trials were conducted. Equation (2) was then used to calculate qt and Equation (3) was used to calculate R%.
3. Results
3.1. Structural and Functional Characterization
The physical properties of the gels synthesized in this study can be seen in Table 1 below. Overall, the appearances involve circular shapes for all gels, and the color of the SA-H was white/off-white, but when PPP was incorporated, the gels took the light brown color of the PPP. These properties remained consistent across all synthesis replicates, indicating that the synthesis procedure is reproducible and reliable.

Table 1.
Physical properties of Sodium Alginate-Hydrogels (SA-H) and SA-PP-H.
3.1.1. FTIR and SEM Analysis of SA-H and SA-PP-H
Furthermore, to identify the functional groups present on the surface of the SA-H and SA-PP-H, FTIR was used. Here, the beads were crushed into a powder using a mortar and pestle before analysis. The results are illustrated in Figure 2. The broad peak at 3261.19 cm−1 in all spectra represents the O–H stretching vibrations, indicating the presence of carboxylic acid, phenol and alcohol groups from both the SA and PPP [19,27,28,29]. The O–H may be bonded or free [29]. These groups indicate the presence of cellulose, lignin, and hemicellulose, which would come from the PPP [29]. It may also indicate the presence of water, but that is unlikely as the samples were lyophilized before FTIR analysis was conducted. The weak peak at 2918.55 cm−1 on the SA-PP-H spectra represents C–H stretching from CH2 groups from the PPP [19,27,28,29]. The weak peak at 1723.39 cm−1 in the SA-PP-H spectra is indicative of C=O stretching vibrations from PPP, which means that carbonyl groups such as ketones, carboxylic acids, and aldehydes are present [19,27,28,29]. The medium peaks at 1596.94 cm−1 and 1423.58 cm−1 on both spectra are indicative of COO- stretching, symmetric and antisymmetric, respectively [19]. This confirms the presence of carboxylic acid and ester functional groups from both SA and PPP [19]. Furthermore, the weak peak at 1315.49 cm−1 on the SA-PP-H spectra represents C–H bending from CH2 groups from PPP [27]. The weak peak at 1229.83 cm−1 on all spectra represents C–O bending, indicating the presence of ester, ether carboxylic acid, alcoholic and phenolic groups [27,28,29]. The strong peak at 1007.52 cm−1 on all spectra represents C–O stretching vibrations [27,28,29]. This further highlights the presence of ester, ether, carboxylic acid, alcoholic and phenolic functional groups due to compounds such as tannins, lignin, cellulose, and hemicellulose present in PPP [19,27,28,29]. It is also indicative of carboxylic acid, ether, and hydroxyl functional groups present in SA [19]. Finally, the weak peak at 819.89 cm−1 on all spectra is characteristic of both -CCH and -COH bending [29]. The -CCH bending can be attributed to alkane groups, while the -COH bending can be attributed to hydroxyl, carboxylic acid, aldehyde, and phenol groups [27,28,29].
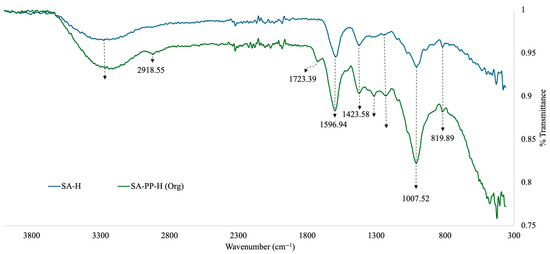
Figure 2.
Overlapped Fourier-Transform Infrared Spectroscopy (FTIR) spectra of SA-H and SA-PP-H.
Moreover, to visualize the surface and cross-sections of SA-H and SA-PP-H before and after copper adsorption at various magnifications, SEM was utilized. The surface images demonstrate that the SA-H had a smooth surface, and is highly compact (Figure 3(1a,2a,3a)), while the SA-PP-H before and after copper adsorption had a rougher and more porous surface (Figure 3(1b,2b,3b,1c,2c,3c)), and is less compact. Furthermore, the cross-section images can be seen in Figure 4. Like the surface images, the SA-H also appears to be smoother and more compact throughout the cryogel (Figure 4(1a,2a,3a)), while the SA-PP-H appears rougher and more porous throughout, both before and after copper adsorption (Figure 4(1b,2b,3b,1c,2c,3c)).
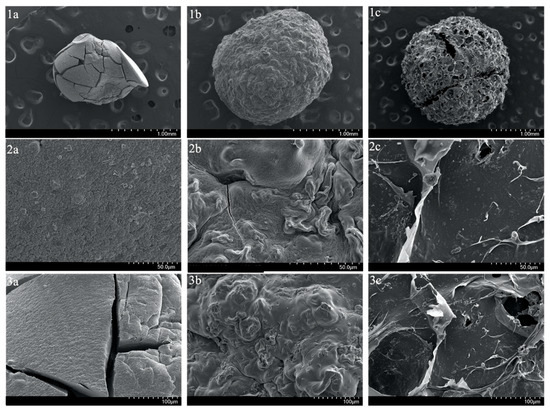
Figure 3.
Scanning Electron Microscope (SEM) image of the surface of SA-H (1a,2a,3a), SA-PP-H before copper adsorption (1b,2b,3b), and SA-PP-H after copper adsorption (1c,2c,3c) at different magnifications (1.00 mm, 50.0 µm, 100 µm).
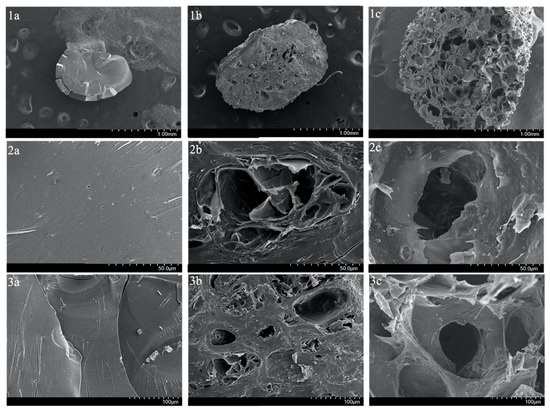
Figure 4.
SEM image of the cross-section of SA-H (1a,2a,3a), SA-PP-H before copper adsorption (1b,2b,3b), and SA-PP-H after copper adsorption (1c,2c,3c) at different magnifications (1.00 mm, 50.0 µm, 100 µm).
3.1.2. Diameter Size of SA-H vs. SA-PP-H
During the synthesis process for all hydrogels, they were first oven-dried then lyophilized. To estimate the size of gels when wet, oven-dried, and lyophilized, ImageJ (Fiji, version 2.14.0/1.54f) was used. The data obtained can be visualized in Figure 5 and Figure 6 for SA-H beads and SA-PP-H, respectively. Figure 5 shows that the average diameters were 9.91 ± 0.65, 0.95 ± 0.13, and 1.63 ± 0.24 mm for the wet, dried, and lyophilized SA-H, respectively. Figure 6 shows that the average diameters were 4.38 ± 0.33, 1.25 ± 0.19, and 1.45 ± 0.23 mm for the wet, dried, and lyophilized SA-PP-H, respectively.
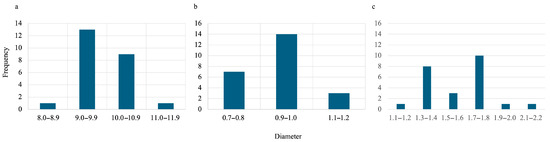
Figure 5.
Size distribution of wet (a), oven-dried (b), and lyophilized (c) SA-H. The sample size was 24 beads for each condition.
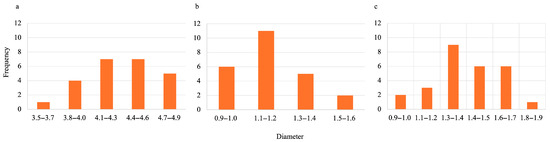
Figure 6.
Size distribution of wet (a), oven-dried (b), and lyophilized (c) SA-PP-H. The sample size was 24 beads for each condition.
3.1.3. Effect of PPP Concentration and Hydrogel Type on Water Uptake Capacity
To test the ideal ratio of PPP to SA for the water uptake capacity of the gels, and therefore the ideal ratio for heavy metal adsorption, a test was carried out. Here, beads with different concentrations of PPP were placed in water for 1 h, then isolated via vacuum filtration, patted dry, and reweighed. The water uptake capacity was calculated using Equation (1). The results are illustrated in Figure 7. There is a plateau from a 1.00 ratio, and the highest uptake percentage was 60.07 ± 2.48% observed at a 2.00 ratio of SA to PPP.
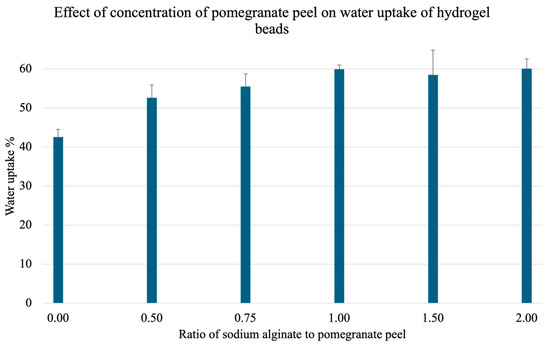
Figure 7.
Effect of PPP concentration on mean water uptake percent. Pre-weighed gels with varying ratios of sodium alginate (SA) to pomegranate peel powder (PPP) (0.00, 0.50, 0.75, 1.00, 1.50, and 2.00) were treated with water for 1 h and reweighed. A total of 3 trials were conducted for each ratio.
Furthermore, to test how the gel performs in aqueous solutions, a water uptake capacity test was carried out similarly to Section 3.1.3. The results are illustrated in Figure 8. Overall, the SA-PP-H beads showed a 1.58× increase in water adsorption as compared to the SA-H beads.
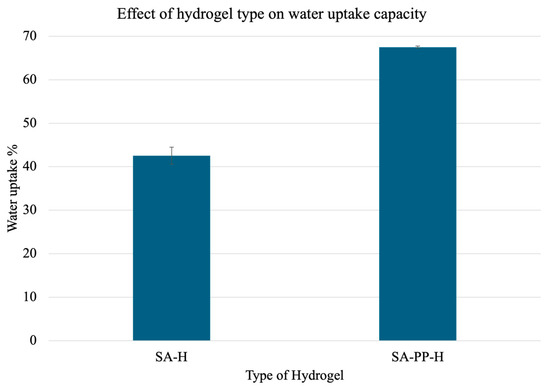
Figure 8.
Water uptake capacity of gels made from SA-H and SA-PP-H. Pre-weighed gels were treated with water for 1 h and reweighed. A total of 3 trials were conducted for each ratio. The mean uptake percentages were 42.55 ± 1.96 and 67.49 ± 0.23 for SA-H gels, and SA-PP-H, respectively. A total of 3 trials were conducted for each type of gel.
3.2. Batch Adsorption Tests for Copper and Nickel
Batch adsorption tests for copper and nickel were carried out. The tests conducted include the effect of contact time, initial adsorbate amount, adsorbent amount, and pH for copper, and the effect of contact time for nickel.
3.2.1. Effect of Contact Time on Copper and Nickel Adsorption
To test the effect of time on copper and nickel adsorption onto SA-PP-H, a contact time test was carried out. Here, a specified amount of beads was weighed out, and placed in 50 mg/L Cu(NO3)2·3H2O (pH ~5.5) or 50 mg/L Ni(NO3)2·6H2O (pH ~5) for varying amounts of time, then analyzed via FAAS. As was evident, for copper (Figure 9a), with time, both qt and R% increases. They rapidly increase in the first 5 min, then slow down as an equilibrium is achieved (t = 60 min), then plateau. For nickel (Figure 9b), they also rapidly increase within the first 5 min, but plateau after.
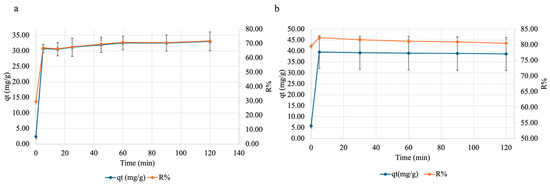
Figure 9.
The effect of contact time on adsorption of (a) copper and (b) nickel onto SA-PP-H. Gels were placed in 50 mg/L Cu(NO3)2·3H2O (pH ~5.5) for 0, 5, 15, 25, 45, 60, 90, and 120 min or 50 mg/L Ni(NO3)2·6H2O (pH ~5) for 0, 5, 30, 60, 90, and 120 min, after which the supernatant was analyzed by FAAS. The error bars represent the standard deviation in adsorption capacity (qt) (n = 3, blue) and removal percent (R%) (n = 3, orange).
3.2.2. Effect of pH on Adsorption of Copper onto SA-PP-H
To find the ideal pH for adsorption, a pH test was carried out. A specified amount of beads was placed in 50 mg/L Cu(NO3)2·3H2O at varying pH values for 60 min after which the supernatant was analyzed by FAAS. Three trials were conducted for each pH value. The results are illustrated in Figure 10. Overall, as the pH increases, qt decreases, while R% increases until plateauing at pH 5.
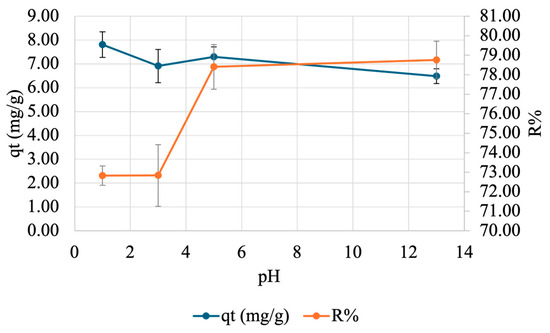
Figure 10.
Effect of pH on adsorption of copper onto SA-PP-H. A specified amount of beads was placed in 50 mg/L Cu(NO3)2·3H2O at varying pH values (1, 3, 5, 13) for 60 min after which the supernatant was analyzed by FAAS. The error bars represent the standard deviation in qt (n = 3, blue) and R% (n = 3, orange).
3.2.3. Effect of Adsorbate Amount on Adsorption of Copper onto SA-PP-H
To test how increasing the amount of gel would affect copper adsorption, an adsorbent dosage test was carried out. Here, varying amounts of gel were placed in 50 mg/L Cu(NO3)2·3H2O (pH ~5.5) for 60 min after which the supernatant was analyzed by FAAS. The results are visualized in Figure 11 below. As evident, as the adsorbent dose increases, qt decreases, but the R% plateaus (at 0.01 g).
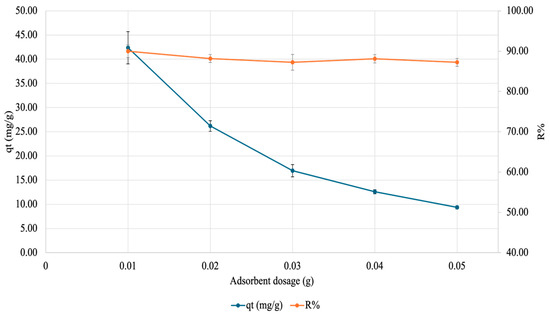
Figure 11.
Effect of adsorbate amount on adsorption of copper onto SA-PP-H. Varying amounts of gel (0.01, 0.02, 0.03, 0.04, and 0.05 g) were placed in 50 mg/L Cu(NO3)2·3H2O (pH ~5.5) for 60 min after which the supernatant was analyzed by FAAS. The error bars represent the standard deviation in qt (n = 3, blue) and R% (n = 3, orange).
3.3. Comparison to Similar Adsorbents
Table 2 presents a comparison between SA-PP-H and the maximum adsorption capacity (qmax)and maximum R% for similar adsorbents. It also outlines some advantages and limitations of these adsorbents.
Table 2.
Comparison of the performance, advantages, and limitations of SA-PP-H to various adsorbents.
4. Discussion
The purpose of this study was to synthesize and characterize hydrogels from SA with PPP incorporations. Moreover, their ability to remediate heavy metals from contaminated water was also explored. Overall, the synthesis of the hydrogel was successful. The appearance of the xerogels is consistent with literature [19].
FTIR was also conducted for SA-H and SA-PP-H. Here, the gels with PPP incorporations showed more peaks than the SA-H, indicating that the addition of PPP allowed for an increased amount of functional groups present [19]. For example, while SA-H should contain C=O bonds due to the carboxylic acid groups present (see Figure 2), it is not evident on the FTIR. However, for the SA-PP-H, there is a weak C=O peak at 1723.39 cm−1, indicating that incorporating PPP into the structure allowed for more functional groups to be present in the final structure. This is due to the retention of bioactive compounds in the hydrogel such as tannins, lignin, phenolic compounds, and hemicellulose, as confirmed by peaks such as the C–O stretch at 1007.52 cm−1. This was expected as PPP is known to enhance the structure of SA-H via increased crosslinking, allowing for increased adsorption efficiency of contaminants [19].
Moreover, surface and cross-section images of SA-H and SA-PP-H before and after copper adsorption were also taken via SEM. The surface and cross-section images demonstrate that the SA-H is smooth, and highly compact, while the SA-PP-H before and after copper adsorption is rougher, more porous, and less compact. This is because the SA-PP-H had PPP incorporations, which means its lignocellulosic content is higher than in the SA-H, allowing for more pores to be available, and therefore was rougher [19]. Abbaz et al. (2023) had similar observations when the surfaces of SA-PP-H and SA-H were explored via SEM [19]. In addition, the SA-H has visible cracks on the surface, which may have occurred during lyophilization. Here, the PPP enhanced the stability of the SA-PP-H, so it remained intact during lyophilization [19,88]. Moreover, is evident that the gel is rougher and more porous after copper is adsorbed. This was expected as Tenea et al. (2024) saw similar morphology changes when cadmium, nickel, and lead were adsorbed onto polystyrene and polypropylene microplastics [89]. There are also cracks in the gel, likely due to mechanical agitation from the stir bar during adsorption. These morphology changes are likely due to heavy metal deposition, which indicates that copper was indeed adsorbed into the cryogel [89]. Overall, both surface and cross-section images show that SA-PP-H is effective at copper adsorption, as expected [19]. However, it is also important to note that the lyophilization process, while consistent across all samples, may affect the morphology due to differences in composition [90]. Factors such as nucleation and gel matrix rigidity may influence SEM features such as pore size [90]. Therefore, some of the morphological differences may partially be attributed to the sample’s different responses to lyophilization.
Furthermore, the diameter size of SA-H and SA-PP-H when wet, oven-dried, and lyophilized was analyzed. As expected, when dried, both types of beads shrunk in size due to water being removed from their structures [90]. When lyophilized after oven-drying, their structures expanded, as expected [90]. When wet, SA-H is shown to be larger than SA-PP-H, as expected, because PPP increases the crosslinking density and thus creates an overall smaller, but more stable gel [19]. However, when dry, the SA-PP-H was larger in diameter, further demonstrating its stability as it was less prone to collapse [19]. Finally, upon lyophilization, the SA-PP-H had smaller diameters, reflecting the lower initial water uptake. Furthermore, the beads are distributed over a range of sizes, meaning they are not uniform in size. This is due to manually dropping them into CaCl2 with a syringe as opposed to using an automated dropper.
Moreover, the effect of PPP concentration on the gel’s ability to take up water was investigated. Here, as expected, there is an increase in water uptake capacity with increased amounts of PPP incorporations [19]. However, there is a plateau once the ratio becomes 1.00. This indicates that a 1-to-1 ratio of PPP to SA is ideal for hydrogel synthesis for water remediation. Furthermore, a water uptake test comparing SA-H and SA-PP-H was conducted. Overall, the SA-PP-H beads showed a 1.58x increase in water adsorption, as compared to the SA-H beads. This can be attributed to the increased porosity and increased crosslinking of SA-PP-H [19].
Finally, the ability of SA-PP-H to take up copper and nickel was tested. Here, contact time, adsorbent amount, and pH were tested. Contact time tests can provide insights into how long it takes for the adsorbent to reach equilibrium and its maximum R%. For copper (Figure 9a), both qt and R% rapidly increases in the first 5 min, then slows down as an equilibrium is achieved (t = 60 min), then begins to plateau. This pattern was also seen when raw PPP, activated carbon (AC) from PPP, and AC from chemically treated PPP (2.5 g/L) were used to remove 20 mg/L copper (pH 5.8) over a 2 h period [82]. Furthermore, the ability of raw pomegranate peel to remove varying concentrations of Cu(NO3)2·3H2O (10–50 mg/L) at pH 5.8 at different time points (0–240 min) was also illustrated by Ben-Ali et al. (2017) [84]. This pattern is seen as initially, there are many adsorption sites available, which allows for many adsorbate molecules to get adsorbed [89]. Then, as the adsorption sites become more saturated, less sites are available for the adsorbate, and therefore the adsorption rates slow down until reaching an equilibrium and plateauing [89].
Moreover, the qt and R% of nickel increase rapidly within the first 5 min then plateau. This is like the observation of a rapid increase in qt until plateauing at 15 min by Aliwi and Halboos (2024) [76]. However, the pattern for R% is unlike the observation of a rapid increase in R% within the first 5 min, then slowly increasing until plateauing at 35 min, by Abbasi et al. (2013) when they tested the ability of raw PPP to take up 10 mg/L of nickel over a 60 min period [78]. This is because they measured R% in 5 min intervals, while this study carried out 30 min intervals [78]. As such, we were unable to see the adsorption slowly increase before its plateau. In addition, this study observed a plateau after 5 min, while Abbasi et al. (2013) observed it after 35 min [78]. This difference may be because they used raw PPP, while this study used PPP-based cryogels, meaning that the adsorbent used here was more stable therefore allowed for more nickel removal [19,23,78]. Overall, the plateau seen in this study occurs sooner for both qt and R%, indicating that SA-PP-H is promising for nickel removal.
Moreover, it is important to understand what the optimal pH is for adsorbate adsorption as different pH values can affect the charge of the gel’s active sites, which affects their efficiency. Here, the qt trend was not expected as there were some fluctuations before pH 5, then decreased after. There is a dip in qt at pH 3, then an increase again at pH 5, likely due to the varying sizes of beads [91]. Furthermore, as the pH increases, R% increases, and begins to plateau at pH 5 for copper. The trend was expected as at low pH values, there are H+ ions present in solution, which compete with copper for adsorption sites [82]. This means that they would not be able to interact with the adsorbate as much, resulting in a lower R% [19]. Furthermore, as the pH increases, the adsorption sites become more negatively charged since less H+ is present for competition, so they can interact more with the positively charged copper ions [19,82]. As such, higher pH values were expected to show higher R%, which was seen here. This is consistent with the observations made by El-Ashtoukhy et al. (2008) when they exposed 2.5 g/L of raw PPP, AC from PPP, and AC from chemically treated PPP to 10 mg/L of copper at varying pH values (1–8) for 2 h [82]. Moreover, the observed optimal pH for copper adsorption is ~5 for practical applications, which is consistent with literature as the optimal range for copper adsorption was previously demonstrated to be 4–7 [34,82].
To gain insights into how much adsorbent is needed for maximum adsorption, the effect of adsorbent amount on copper adsorption was tested. Here, as the adsorbent dose increases, qt decreases and R% plateaus for copper. A decreasing qt is expected because qt is a measure of adsorbate adsorbed per weight of adsorbent; therefore, with increasing adsorbent amounts and no changes in adsorbate amount, less adsorbate is adsorbed per weight of adsorbent [19]. This is also seen in Abbaz et al. (2023) for safranin-O adsorption onto SA-PP-H [19]. Moreover, as the adsorbent dose increases, R% plateaus. This expected as El-Ashtoukhy et al. (2008) saw an increase in R% after leaving raw PPP, AC from PPP, and AC from chemically treated PPP in 50 mg/L of copper at pH 5.8 for 2 h [19,82]. Since only a plateau is seen here, it is likely that the R% peaked at an adsorbent dosage lower than 0.01 g, meaning that less adsorbent is needed to reach the maximum R%.
The highest experimental qt for copper was 42.37 ± 3.35 mg/g after 60 min, when 50 mg/L of adsorbate at pH 5.5 and 0.01 g of adsorbent were used. This is higher than other pomegranate peel-based adsorbents, as seen in Table 2. For example, Ben-Ali et al. (2017) observed a qmax of 30.12 mg/g for raw pomegranate peel at 313 K, pH 5.8, 10–60 mg/L Cu(NO3)2·3H2O solution after 2 h exposure time [84]. This demonstrates that SA-PP-H performed better than similar adsorbents under optimal conditions. However, the qt is lower than adsorbents from other biopolymers, such as the carboxymethyl cellulose/guar gum/modified Typha angustifolia (CMC/GG/MTC) composite hydrogel synthesized by Yang et al. (2023), which showed a qmax of 805.45 mg/g for copper at varying Cu(NO3)2 concentrations [54]. It is also less effective than other natural, synthetic polymers, carbon-based materials, and metal oxide-based adsorbents. For instance, Tahir et al. (2019) observed a qmax of 543.3 mg/g when of 0.05 g of hydroxypropyl-cyclodextrin-graphene/Fe3O4 nanoparticles were used to remove 200 mg/L of adsorbate at pH 7, at room temperature after 120 min [75].
Moreover, the highest R% for copper was 89.98 ± 1.55% when 50 mg/L of adsorbate at pH 5.5 was used and 0.01 g after 60 min. This is within the range of 62–99.82% removal observed in literature for similar adsorbents. For example, El-Ashtoukhy et al. (2008) observed maximum copper removal rates with 2.5 g/L of raw PPP to be ~60% after ~10 min when 50 mg/L of copper was used at a pH of 5.6 [82]. Furthermore, Rashed et al. (2020) found that the R% was 80% when 30 g/L of raw pomegranate peel was used to remove 1000 mg/L of copper at pH 5–6 after 60 min [86]. These values are likely lower because they used raw PPP, while a more stable cryogel structure was used here. Raw PPP has been found to be less effective and more unstable on its own as compared to when it is in a gel structure or modified with materials such as carbon or zirconium (IV) [19,23,82]. Contrarily, adsorbents such as the pomegranate peel-based activated carbon adsorbent demonstrated by Saeed et al. (2016) show a higher qmax [87]. Here, AC was prepared from pomegranate peel via heat (873 K), then treated with acid (mixture of zinc chloride and phosphoric acid, or 0.1 M nitric acid) [87]. They found that upon treatment with the mixture of zinc chloride and phosphoric acid, a R% of 99.82% was achieved. Here, 50 mg/L CuSO4 was used, and the exposure time was 60 min [87].
The highest experimental qt for nickel was 39.52 ± 7.49 mg/g after 60 min when 50 mg/L of adsorbate at pH 5 and 0.07 g of adsorbent were used. This is within the range of 7.54–52 mg/g observed for other pomegranate peel-based adsorbents. For instance, Abbasi et al. (2013) observed a qmax of 7.54 when raw PPP was used to remove Ni(NO3)2·6H2O from water [78]. On the other hand, Bhatnagar and Minocha (2010) observed a qmax of 52 mg/g when 10 g/L of activated carbon from pomegranate peel was used to remove varying concentrations of nickel at pH 5.5–6.5 and 25 °C [81]. Moreover, it performs better than natural and metal oxide-based adsorbents. For example, when 0.1 g of montmorillonite was used to remove Ni(NO3)2·6H2O from water at pH 5.7, a qmax of 15.6 was observed after 180 min [47]. However, the qmax remains lower than other biopolymer-based adsorbents such as Pseudomonas sp., which demonstrated a qmax of 556 mg/g [53]. It also remained lower than synthetic polymer- and carbon-based adsorbents. For example, a qmax of 149.25 was observed after 24 h when an aqueous solution of nickel was treated with activated carbon functionalized with HNO3 [47]. Furthermore, the highest R% was 82.25 ± 0.48% when 0.07 g of hydrogel was used to treat 50 mg/L of Ni(NO3)2·6H2O at pH 5 after 5 min of exposure. This is lower than other similar adsorbents such as other pomegranate peel-based, metal oxide-based, synthetic polymer-based, biopolymer-based, and natural adsorbents. For example, a R% of 99.615% was observed by Aliwi and Halboos (2024) when they treated aqueous nickel (15 mg/L, pH 3) with nano Fe2O3/pomegranate peel at 328 K [76].
Overall, SA-PP-H shows potential for both copper and nickel adsorption as it performs within range for some similar adsorbents. However, while SA-PP-H is effective, there are other similar adsorbents that are more effective. However, the synthesis of these adsorbents uses harsh temperature conditions (for example 600 °C) and chemicals such as potassium persulfate. The synthesis of SA-PP-H on the other hand remains simple, and uses mild pH and temperature conditions, so it remains eco-friendly. Furthermore, the SA-PP-H synthesized here remains low-cost as SA and PPP are cheap [19]. This helps to keep the cost of synthesis low, which is useful in large-scale applications. Since the SA-PP-H produced here can be considered green, and its performance is comparable to similar adsorbents, it demonstrates the potential to remove copper and nickel from contaminated water. However, several limitations are present. For instance, the SA-PPP mixture was dropped into the crosslinker manually. This means that beads were not uniform throughout the experiment, so despite having similar masses of adsorbent, some vials may have had larger beads than others, which may have caused discrepancies in adsorption [92]. Larger beads tend to adsorb less than smaller ones, so the vials with larger beads likely adsorbed less copper than those with smaller beads, leading to larger standard deviations between trials [92]. This could be improved by an automated dropper in future studies. Furthermore, other adsorption tests could be carried out such as the effect of temperature to see how the gels behave as the temperature increases or declines. Also, more detailed tests for nickel are required such as the effect of adsorbent amount and pH. This would give a better picture of how nickel is adsorbed, therefore allowing for better optimization of the gels. Finally, the recyclability and reusability of this type of gel for heavy metal remediation may be tested.
5. Conclusions
To conclude, the primary goal of this experiment was to synthesize hydrogel beads from SA, with PPP incorporations. This goal was achieved as the beads were successfully synthesized. Another goal was to characterize these hydrogels using FTIR, SEM, and water uptake tests, which was also achieved. These characterization tests demonstrated that PPP incorporations may enhance the ability of the gels to remediate heavy metals from contaminated water. This is because they included more functional groups, a rougher and more surface and cross-section, and higher water uptake capacities. Finally, we aimed to test the ability of these gels to remediate heavy metal from contaminated water. Several tests were conducted with both copper and nickel, though nickel was less extensively studied due to time constraints. For copper, the tests conducted include the effect of contact time, adsorbent amount, and pH. For nickel, the tests conducted included the effect of contact time. The results indicate that SA-PP-H is a good candidate for copper remediation, with a maximum experimental qt of 42.37 ± 3.35 mg/g and a maximum R% of 89.98 ± 1.55% after the optimal contact time of 60 min. Furthermore, an optimal pH of ~5 was observed, and the optimal adsorbent amount was found to be ~0.01 g. Finally, for nickel, a contact time test was conducted. This indicated that nickel had an optimal contact time of 5 min, with a maximum qt of 39.52 ± 7.49 mg/g and a maximum R% of 82.26 ± 0.48%. These results are promising as they demonstrate that SA-PP-H is a good candidate for both copper and nickel remediation. This offers a cost-effective, eco-friendly way to remediate heavy metals from contaminated water.
Author Contributions
Conceptualization: N.T. and P.L.; Investigation: P.L.; Data curation: N.T. and P.L.; Original draft preparation: P.L.; Review and editing: N.T. and X.F. All authors have read and agreed to the published version of the manuscript.
Funding
This work is funded by Natural Science and Research Council of Canada RGPIN-2024-04924.
Institutional Review Board Statement
Not applicable.
Informed Consent Statement
Not applicable.
Data Availability Statement
The original contributions presented in this study are included in the article. Further inquiries can be directed to the corresponding author.
Conflicts of Interest
The authors declare no conflicts of interest.
References
- Devi, P.I.; Manjula, M.; Bhavani, R.V. Agrochemicals, Environment, and Human Health. Annu. Rev. Environ. Resour. 2022, 47, 399–421. [Google Scholar] [CrossRef]
- Sumudumali, R.G.I.; Jayawardana, J.M.C.K.; Piyathilake, I.D.U.H.; Randika, J.L.P.C.; Udayakumara, E.P.N.; Gunatilake, S.K.; Malavipathirana, S. What Drives the Pesticide User Practices among Farmers in Tropical Regions? A Case Study in Sri Lanka. Environ. Monit. Assess. 2021, 193, 860. [Google Scholar] [CrossRef]
- Tchounwou, P.B.; Yedjou, C.G.; Patlolla, A.K.; Sutton, D.J. Heavy Metals Toxicity and the Environment; Springer: Basel, Switzerland, 2012; Volume 101, pp. 133–164. [Google Scholar] [CrossRef]
- Naccarato, A.; Vommaro, M.L.; Amico, D.; Sprovieri, F.; Pirrone, N.; Tagarelli, A.; Giglio, A. Triazine Herbicide and NPK Fertilizer Exposure: Accumulation of Heavy Metals and Rare Earth Elements, Effects on Cuticle Melanization, and Immunocompetence in the Model Species Tenebrio Molitor. Toxics 2023, 11, 499. [Google Scholar] [CrossRef]
- Bernardini, G.; Spinelli, O.; Vismara, C.; Presutti, C.; Bolzacchini, E.; Orlandi, M.; Settimi, R. Evaluation of the Developmental Toxicity of the Pesticide Mcpa and Its Contaminants Phenol and Chlorocresol. Environ. Toxicol. Chem. 1996, 15, 754–760. [Google Scholar] [CrossRef]
- Ding, C.; Chen, J.; Zhu, F.; Chai, L.; Lin, Z.; Zhang, K.; Shi, Y. Biological Toxicity of Heavy Metal(Loid)s in Natural Environments: From Microbes to Humans. Front. Environ. Sci. 2022, 10, 920957. [Google Scholar] [CrossRef]
- Coelho, F.C.; Squitti, R.; Ventriglia, M.; Cerchiaro, G.; Daher, J.P.; Rocha, J.G.; Rongioletti, M.C.A.; Moonen, A.-C. Agricultural Use of Copper and Its Link to Alzheimer’s Disease. Biomolecules 2020, 10, 897. [Google Scholar] [CrossRef] [PubMed]
- Genchi, G.; Carocci, A.; Lauria, G.; Sinicropi, M.S.; Catalano, A. Nickel: Human Health and Environmental Toxicology. Int. J. Environ. Res. Public Health 2020, 17, 679. [Google Scholar] [CrossRef]
- Qasem, N.A.A.; Mohammed, R.H.; Lawal, D.U. Removal of Heavy Metal Ions from Wastewater: A Comprehensive and Critical Review. npj Clean Water 2021, 4, 36. [Google Scholar] [CrossRef]
- Satyam, S.; Patra, S. Innovations and Challenges in Adsorption-Based Wastewater Remediation: A Comprehensive Review. Heliyon 2024, 10, e29573. [Google Scholar] [CrossRef]
- Ma, Y.; Zhang, X.; Wen, J. Study on the Harm of Waste Activated Carbon and Novel Regeneration Technology of It. IOP Conf. Ser. Earth Environ. Sci. 2021, 769, 022047. [Google Scholar] [CrossRef]
- Guo, Y.; Bae, J.; Fang, Z.; Li, P.; Zhao, F.; Yu, G. Hydrogels and Hydrogel-Derived Materials for Energy and Water Sustainability. Chem. Rev. 2020, 120, 7642–7707. [Google Scholar] [CrossRef]
- Alsaka, L.; Alsaka, L.; Altaee, A.; Zaidi, S.J.; Zhou, J.; Kazwini, T. A Review of Hydrogel Application in Wastewater Purification. Separations 2025, 12, 51. [Google Scholar] [CrossRef]
- Yuan, Y.; Zhang, Q.; Lin, S.; Li, J. Water: The Soul of Hydrogels. Prog. Mater. Sci. 2025, 148, 101378. [Google Scholar] [CrossRef]
- Ren, Y.; Wang, Q.; Xu, W.; Yang, M.; Guo, W.; He, S.; Liu, W. Alginate-Based Hydrogels Mediated Biomedical Applications: A Review. Int. J. Biol. Macromol. 2024, 279, 135019. [Google Scholar] [CrossRef]
- Djemaa, I.B.; Auguste, S.; Drenckhan-Andreatta, W.; Andrieux, S. Hydrogel Foams from Liquid Foam Templates: Properties and Optimisation. Adv. Colloid Interface Sci. 2021, 294, 102478. [Google Scholar] [CrossRef]
- Tan, J.; Luo, Y.; Guo, Y.; Zhou, Y.; Liao, X.; Li, D.; Lai, X.; Liu, Y. Development of Alginate-Based Hydrogels: Crosslinking Strategies and Biomedical Applications. Int. J. Biol. Macromol. 2023, 239, 124275. [Google Scholar] [CrossRef]
- Naranjo-Alcazar, R.; Bendix, S.; Groth, T.; Gallego Ferrer, G. Research Progress in Enzymatically Cross-Linked Hydrogels as Injectable Systems for Bioprinting and Tissue Engineering. Gels 2023, 9, 230. [Google Scholar] [CrossRef]
- Abbaz, A.; Arris, S.; Viscusi, G.; Ayat, A.; Aissaoui, H.; Boumezough, Y. Adsorption of Safranin O Dye by Alginate/Pomegranate Peels Beads: Kinetic, Isotherm and Thermodynamic Studies. Gels 2023, 9, 916. [Google Scholar] [CrossRef]
- Savić Gajić, I.M.; Savić, I.M.; Svirčev, Z. Preparation and Characterization of Alginate Hydrogels with High Water-Retaining Capacity. Polymers 2023, 15, 2592. [Google Scholar] [CrossRef] [PubMed]
- Elwakeel, K.Z.; Ahmed, M.M.; Akhdhar, A.; Sulaiman, M.G.M.; Khan, Z.A. Recent Advances in Alginate-Based Adsorbents for Heavy Metal Retention from Water: A Review. Desalination Water Treat. 2022, 272, 50–74. [Google Scholar] [CrossRef]
- Jayakody, M.M.; Vanniarachchy, M.P.G.; Wijesekara, I. Composition Analysis of Selected Sri Lankan Seaweeds. J. Trop. For. Environ. 2019, 9, 93–100. [Google Scholar] [CrossRef]
- Poudel, B.R.; Ale, D.S.; Aryal, R.L.; Ghimire, K.N.; Gautam, S.K.; Paudyal, H.; Pokhrel, M.R. Zirconium Modified Pomegranate Peel for Efficient Removal of Arsenite from Water. BIBECHANA 2022, 19, 1–13. [Google Scholar] [CrossRef]
- Mo, Y.; Ma, J.; Gao, W.; Zhang, L.; Li, J.; Li, J.; Zang, J. Pomegranate Peel as a Source of Bioactive Compounds: A Mini Review on Their Physiological Functions. Front. Nutr. 2022, 9, 887113. [Google Scholar] [CrossRef]
- Azmat, F.; Safdar, M.; Ahmad, H.; Khan, M.R.J.; Abid, J.; Naseer, M.S.; Aggarwal, S.; Imran, A.; Khalid, U.; Zahra, S.M.; et al. Phytochemical Profile, Nutritional Composition of Pomegranate Peel and Peel Extract as a Potential Source of Nutraceutical: A Comprehensive Review. Food Sci. Nutr. 2024, 12, 661–674. [Google Scholar] [CrossRef] [PubMed]
- Bhatnagar, A.; Sillanpää, M.; Witek-Krowiak, A. Agricultural Waste Peels as Versatile Biomass for Water Purification—A Review. Chem. Eng. J. 2015, 270, 244–271. [Google Scholar] [CrossRef]
- Salih, S.I.; Oleiwi, J.K.; Mohamed, A.S. Investigation of Mechanical Properties of PMMA Composite Reinforced with Different Types of Natural Powders. ARPN J. Eng. Appl. Sci. 2018, 13, 8889–8900. [Google Scholar]
- Hashem, A.; Aniagor, C.O.; Fikry, M.; Taha, G.M.; Badawy, S.M. Characterization and Adsorption of Raw Pomegranate Peel Powder for Lead (II) Ions Removal. J. Mater. Cycles Waste Manag. 2023, 25, 2087–2100. [Google Scholar] [CrossRef]
- Ben-Ali, S. Application of Raw and Modified Pomegranate Peel for Wastewater Treatment: A Literature Overview and Analysis. Int. J. Chem. Eng. 2021, 2021, 8840907. [Google Scholar] [CrossRef]
- Wang, H.; Zhang, L. Preparation of Hydrogel Beads Based on Sodium Alginate and Aqueous Extract from Pomegranate Peel and Its Cyanobacteria Removal Performance. Environ. Prot. Eng. 2018, 44, 159–167. [Google Scholar] [CrossRef]
- Bulska, E.; Ruszczyńska, A. Analytical Techniques for Trace Element Determination. Phys. Sci. Rev. 2017, 2, 20178002. [Google Scholar] [CrossRef]
- Hill, S.J.; Fisher, A.S. Atomic Absorption, Methods and Instrumentation. In Encyclopedia of Spectroscopy and Spectrometry, 2nd ed.; Lindon, J.C., Ed.; Academic Press: Oxford, UK, 1999. [Google Scholar] [CrossRef]
- Uddin, A.H.; Khalid, R.S.; Alaama, M.; Abdualkader, A.M.; Kasmuri, A.; Abbas, S.A. Comparative Study of Three Digestion Methods for Elemental Analysis in Traditional Medicine Products Using Atomic Absorption Spectrometry. J. Anal. Sci. Technol. 2016, 7, 6. [Google Scholar] [CrossRef]
- Abbar, B.; Alem, A.; Marcotte, S.; Pantet, A.; Ahfir, N.-D.; Bizet, L.; Duriatti, D. Experimental Investigation on Removal of Heavy Metals (Cu2+, Pb2+, and Zn2+) from Aqueous Solution by Flax Fibres. Process Saf. Environ. Prot. 2017, 109, 639–647. [Google Scholar] [CrossRef]
- Cruz-Lopes, L.; Weber Macena, M.; Esteves, B.; Guiné, R. Ideal pH for the Adsorption of Metal Ions Cr6+, Ni2+, Pb2+ in Aqueous Solution with Different Adsorbent Materials. Open Agric. 2021, 6, 115–123. [Google Scholar] [CrossRef]
- Escudero, L.A.; Blanchet, A.J.; Sombra, L.L.; Salonia, J.A.; Gasquez, J.A. Determination of the Total and Extractable Fraction of Ni in Lake Sediments and Natural Waters of San Luis (Argentina) by FAAS Using a Simple Solid Phase Extraction System. Microchem. J. 2014, 116, 92–97. [Google Scholar] [CrossRef]
- Bagherian, G.; Arab Chamjangali, M.; Shariati Evari, H.; Ashrafi, M. Determination of Copper(II) by Flame Atomic Absorption Spectrometry after Its Perconcentration by a Highly Selective and Environmentally Friendly Dispersive Liquid–Liquid Microextraction Technique. J. Anal. Sci. Technol. 2019, 10, 3. [Google Scholar] [CrossRef]
- Khalil, A.; Hashaikeh, R.; Hilal, N. 3D Printed Zeolite-Y for Removing Heavy Metals from Water. J. Water Process Eng. 2021, 42, 102187. [Google Scholar] [CrossRef]
- Abdelwahab, O.; Thabet, W.M. Natural Zeolites and Zeolite Composites for Heavy Metal Removal from Contaminated Water and Their Applications in Aquaculture Systems: A Review. Egypt. J. Aquat. Res. 2023, 49, 431–443. [Google Scholar] [CrossRef]
- Buzukashvili, S.; Sommerville, R.; Rowson, N.A.; Waters, K.E. An Overview of Zeolites Synthesised from Coal Fly Ash and Their Potential for Extracting Heavy Metals from Industrial Wastewater. Can. Metall. Q. 2024, 63, 130–152. [Google Scholar] [CrossRef]
- Chen, M.; Nong, S.; Zhao, Y.; Riaz, M.S.; Xiao, Y.; Molokeev, M.S.; Huang, F. Renewable P-Type Zeolite for Superior Absorption of Heavy Metals: Isotherms, Kinetics, and Mechanism. Sci. Total Environ. 2020, 726, 138535. [Google Scholar] [CrossRef]
- Ferronato, C.; Vianello, G.; Antisari, L.V. Adsorption of Pathogenic Microorganisms, NH4+ and Heavy Metals from Wastewater by Clinoptilolite Using Bed Laminar Flow. Clay Miner. 2015, 50, 1–10. [Google Scholar] [CrossRef]
- Senila, M.; Cadar, O. Modification of Natural Zeolites and Their Applications for Heavy Metal Removal from Polluted Environments: Challenges, Recent Advances, and Perspectives. Heliyon 2024, 10, e25303. [Google Scholar] [CrossRef] [PubMed]
- Velarde, L.; Nabavi, M.S.; Escalera, E.; Antti, M.-L.; Akhtar, F. Adsorption of Heavy Metals on Natural Zeolites: A Review. Chemosphere 2023, 328, 138508. [Google Scholar] [CrossRef] [PubMed]
- Sossou, K.; Prasad, S.B.; Agbotsou, K.E.; Souley, H.S. Evaluation of the Performance of Magnetic Zeolite Nanocomposites in Removing Various Water Contaminants as Heavy Metals, Organic Pollutants, and Emerging Contaminants: A Review Evaluation of the Performance of Magnetic Zeolite Nanocomposites in Removing Various Water Contaminants as Heavy Metals, Organic Pollutants, and Emerging Contaminants: A Review. Next Nanotechnol. 2024, 6, 100075. [Google Scholar]
- Eleraky, M.I.; Razek, T.M.A.; Hasani, I.W.; Fahim, Y.A. Adsorptive Removal of Lead, Copper, and Nickel Using Natural and Activated Egyptian Calcium Bentonite Clay. Sci. Rep. 2025, 15, 13050. [Google Scholar] [CrossRef]
- Xie, S.; Huang, L.; Su, C.; Yan, J.; Chen, Z.; Li, M.; Du, M.; Zhang, H. Application of Clay Minerals as Adsorbents for Removing Heavy Metals from the Environment. Green Smart Min. Eng. 2024, 1, 249–261. [Google Scholar] [CrossRef]
- Rando, G.; Scalone, E.; Sfameni, S.; Plutino, M.R. Functional Bio-Based Polymeric Hydrogels for Wastewater Treatment: From Remediation to Sensing Applications. Gels 2024, 10, 498. [Google Scholar] [CrossRef]
- Sinyeue, C.; Garioud, T.; Lemestre, M.; Meyer, M.; Brégier, F.; Chaleix, V.; Sol, V.; Lebouvier, N. Biosorption of Nickel Ions Ni2+ by Natural and Modified Pinus Caribaea Morelet Sawdust. Heliyon 2022, 8, e08842. [Google Scholar] [CrossRef]
- Popescu, I.; Pelin, I.M.; Suflet, D.M.; Stanciu, M.C.; Constantin, M. Chitosan/Poly(Maleic Acid-Alt-Vinyl Acetate) Hydrogel Beads for the Removal of Cu2+ from Aqueous Solution. Gels 2024, 10, 500. [Google Scholar] [CrossRef]
- Adamowska, M.; Kaniewska, K.; Muszyńska, M.; Romański, J.; Hyk, W.; Karbarz, M. Smart Hydrogel Based on Derivatives of Natural α-Amino Acids for Efficient Removal of Metal Ions from Wastewater. Gels 2024, 10, 560. [Google Scholar] [CrossRef]
- Bejan, A.; Marin, L. Outstanding Sorption of Copper (II) Ions on Porous Phenothiazine-Imine-Chitosan Materials. Gels 2023, 9, 134. [Google Scholar] [CrossRef] [PubMed]
- Noman, E.; Al-Gheethi, A.; Saphira Radin Mohamed, R.M.; Al-Sahari, M.; Hossain, M.S.; Vo, D.-V.N.; Naushad, M. Sustainable Approaches for Nickel Removal from Wastewater Using Bacterial Biomass and Nanocomposite Adsorbents: A Review. Chemosphere 2022, 291 Pt 1, 132862. [Google Scholar] [CrossRef]
- Yang, L.; Bao, L.; Dong, T.; Xie, H.; Wang, X.; Wang, H.; Wu, J.; Hao, C. Adsorption Properties of Cellulose/Guar Gum/Biochar Composite Hydrogel for Cu2+, Co2+ and Methylene Blue. Int. J. Biol. Macromol. 2023, 242 Pt 4, 125021. [Google Scholar] [CrossRef]
- Antić, K.; Onjia, A.; Vasiljević-Radović, D.; Veličković, Z.; Tomić, S.L. Removal of Nickel Ions from Aqueous Solutions by 2-Hydroxyethyl Acrylate/Itaconic Acid Hydrogels Optimized with Response Surface Methodology. Gels 2021, 7, 225. [Google Scholar] [CrossRef]
- Araque, L.M.; Fernández de Luis, R.; Fidalgo-Marijuan, A.; Infantes-Molina, A.; Rodríguez-Castellón, E.; Pérez, C.J.; Copello, G.J.; Lázaro-Martínez, J.M. Linear Polyethyleneimine-Based and Metal Organic Frameworks (DUT-67) Composite Hydrogels as Efficient Sorbents for the Removal of Methyl Orange, Copper Ions, and Penicillin V. Gels 2023, 9, 909. [Google Scholar] [CrossRef] [PubMed]
- Araque, L.M.; Infantes-Molina, A.; Rodríguez-Castellón, E.; Garro-Linck, Y.; Franzoni, B.; Pérez, C.J.; Copello, G.J.; Lázaro-Martínez, J.M. Ionic Crosslinking of Linear Polyethyleneimine Hydrogels with Tripolyphosphate. Gels 2024, 10, 790. [Google Scholar] [CrossRef] [PubMed]
- Ayach, J.; El Malti, W.; Duma, L.; Lalevée, J.; Al Ajami, M.; Hamad, H.; Hijazi, A. Comparing Conventional and Advanced Approaches for Heavy Metal Removal in Wastewater Treatment: An In-Depth Review Emphasizing Filter-Based Strategies. Polymers 2024, 16, 1959. [Google Scholar] [CrossRef]
- Ibrahim, A.G.; Saleh, A.S.; Elsharma, E.M.; Metwally, E.; Siyam, T. Chitosan-g-maleic Acid for Effective Removal of Copper and Nickel Ions from Their Solutions. Int. J. Biol. Macromol. 2019, 121, 1287–1294. [Google Scholar] [CrossRef] [PubMed]
- Ihsanullah; Abbas, A.; Al-Amer, A.M.; Laoui, T.; Al-Marri, M.J.; Nasser, M.S.; Khraisheh, M.; Atieh, M.A. Heavy Metal Removal from Aqueous Solution by Advanced Carbon Nanotubes: Critical Review of Adsorption Applications. Sep. Purif. Technol. 2016, 157, 141–161. [Google Scholar] [CrossRef]
- Mahesh, N.; Balakumar, S.; Shyamalagowri, S.; Manjunathan, J.; Pavithra, M.K.S.; Babu, P.S.; Kamaraj, M.; Govarthanan, M. Carbon-Based Adsorbents as Proficient Tools for the Removal of Heavy Metals from Aqueous Solution: A State of Art-Review Emphasizing Recent Progress and Prospects. Environ. Res. 2022, 213, 113723. [Google Scholar] [CrossRef]
- Mahdi, Z.; El Hanandeh, A. Insight into Copper and Nickel Adsorption from Aqueous Solutions onto Carbon-Coated-Sand: Isotherms, Kinetics, Mechanisms, and Cost Analysis. Clean. Chem. Eng. 2022, 3, 100045. [Google Scholar] [CrossRef]
- Wang, Y.; Yan, X.; Zhang, Y.; Qin, X.; Yu, X.; Jiang, L.; Li, B. Efficient Removal of Nickel from Wastewater Using Copper Sulfate–Ammonia Complex Modified Activated Carbon: Adsorption Performance and Mechanism. Molecules 2024, 29, 2405. [Google Scholar] [CrossRef]
- Khater, D.; Alkhabbas, M.; Al-Ma’abreh, A.M. Adsorption of Pb, Cu, and Ni Ions on Activated Carbon Prepared from Oak Cupules: Kinetics and Thermodynamics Studies. Molecules 2024, 29, 2489. [Google Scholar] [CrossRef] [PubMed]
- Mehdi Sabzehmeidani, M.; Mahnaee, S.; Ghaedi, M.; Heidari, H.; Roy, V.A.L. Carbon Based Materials: A Review of Adsorbents for Inorganic and Organic Compounds. Mater. Adv. 2021, 2, 598–627. [Google Scholar] [CrossRef]
- Sheraz, N.; Shah, A.; Haleem, A.; Jan Iftikhar, F. Comprehensive Assessment of Carbon-, Biomaterial- and Inorganic-Based Adsorbents for the Removal of the Most Hazardous Heavy Metal Ions from Wastewater. RSC Adv. 2024, 14, 11284–11310. [Google Scholar] [CrossRef] [PubMed]
- Ibrahim, H.; Sazali, N.; Salleh, W.N.W.; Hasrul, N.; Ngadiman, A.; Fadil, N.A.; Harun, Z. Outlook on the Carbon-Based Materials for Heavy Metal Removal. Biointerface Res. Appl. Chem. 2021, 12, 5303–5323. [Google Scholar] [CrossRef]
- Seo, C.; Lee, J.W.; Jeong, J.-W.; Kim, T.-S.; Lee, Y.; Gang, G.; Lee, S.G. Current Technologies for Heavy Metal Removal from Food and Environmental Resources. Food Sci. Biotechnol. 2023, 33, 287–295. [Google Scholar] [CrossRef]
- Şahin, M.; Atasoy, M.; Arslan, Y.; Yildiz, D. Removal of Ni(II), Cu(II), Pb(II), and Cd(II) from Aqueous Phases by Silver Nanoparticles and Magnetic Nanoparticles/Nanocomposites. ACS Omega 2023, 8, 34834–34843. [Google Scholar] [CrossRef]
- Sibiya, N.P.; Mahlangu, T.P.; Tetteh, E.K.; Rathilal, S. Review on Advancing Heavy Metals Removal: The Use of Iron Oxide Nanoparticles and Microalgae-Based Adsorbents. Clean. Chem. Eng. 2025, 11, 100137. [Google Scholar] [CrossRef]
- Mahmoud, A.E.D.; Al-Qahtani, K.M.; Alflaij, S.O.; Al-Qahtani, S.F.; Alsamhan, F.A. Green Copper Oxide Nanoparticles for Lead, Nickel, and Cadmium Removal from Contaminated Water. Sci. Rep. 2021, 11, 12547. [Google Scholar] [CrossRef]
- Ghosh, N.; Das, S.; Biswas, G.; Haldar, P.K. Review on Some Metal Oxide Nanoparticles as Effective Adsorbent in Wastewater Treatment. Water Sci. Technol. 2022, 85, 3370–3395. [Google Scholar] [CrossRef]
- Olawade, D.B.; Wada, O.Z.; Egbewole, B.I.; Fapohunda, O.; Ige, A.O.; Usman, S.O.; Ajisafe, O. Metal and Metal Oxide Nanomaterials for Heavy Metal Remediation: Novel Approaches for Selective, Regenerative, and Scalable Water Treatment. Front. Nanotechnol. 2024, 6, 1466721. [Google Scholar] [CrossRef]
- Saadi, W.; Othman, M.; Souissi-Najar, S.; Ouederni, A. Copper Adsorption onto Pomegranate Peel Activated Carbon as a New Adsorbent. Cell. Chem. Technol. 2023, 57, 657–669. [Google Scholar] [CrossRef]
- Tahir, M.U.; Su, X.; Zhao, M.; Liao, Y.; Wu, R.; Chen, D. Preparation of Hydroxypropyl-Cyclodextrin-Graphene/Fe3O4 and Its Adsorption Properties for Heavy Metals. Surf. Interfaces 2019, 16, 43–49. [Google Scholar] [CrossRef]
- Mohammed Aliwi, H.; Hazim Halboos, M. Nickel Ion Adsorption from Water by Nano Fe2O3/PP Prepared from Pomegranate Peel Residue and Treated Magnetically. BIO Web Conf. 2024, 139, 06032. [Google Scholar] [CrossRef]
- Shartooh, S.; Al-Azzawi, M.; Al-Hiyaly, S. Pomegranate Peels as Biosorbent Material to Remove Heavy Metal Ions from Industerial Wastewater. Iraqi J. Sci. 2013, 54, 823–831. [Google Scholar]
- Abbasi, Z.; Alikarami, M.; Homafar, A. Adsorption Study on Pomegranate Peel: Removal of Ni2+ and Co2+ from Aqueous Solution. Inorg. Chem. 2013, 8, 69–73. [Google Scholar]
- Nourmohammadi Dehbalaei, F.; Akbari, Z.; Abdi, M.S.; Naeeni, S.T.O. Green Walnut Husk and Pomegranate Peel for Nickel Removals from Industrial Wastewater by Absorption Process: Batch and Column Experiments. Appl. Water Sci. 2025, 15, 212. [Google Scholar] [CrossRef]
- Khawaja, M.; Mubarak, S.; Zia-Ur-Rehman, M.; Kazi, A.A.; Hamid, A. Adsorption Studies of Pomegranate Peel Activated Charcoal for Nickel (II) Ion. J. Chil. Chem. Soc. 2015, 60, 2642–2645. [Google Scholar] [CrossRef]
- Bhatnagar, A. Biosorption Optimization of Nickel Removal from Water Using Punica Granatum Peel Waste. Colloids Surf. B Biointerfaces 2010, 76, 544–548. [Google Scholar] [CrossRef]
- El-Ashtoukhy, E.-S.; Amin, N.K.; Abdelwahab, O. Removal of Lead (II) and Copper (II) from Aqueous Solution Using Pomegranate Peel as a New Adsorbent. Desalination 2008, 223, 162–173. [Google Scholar] [CrossRef]
- Kenessova, A.K.; Seilkhanova, G.A.; Rakhym, A.B.; Mastai, Y. Composite Materials Based on Orange and Pomegranate Peels for Cu (II) and Zn (II) Ions Extraction. Int. J. Biol. Chem. 2020, 13, 154–160. [Google Scholar] [CrossRef]
- Ben-Ali, S.; Jaouali, I.; Souissi-Najar, S.; Ouederni, A. Characterization and Adsorption Capacity of Raw Pomegranate Peel Biosorbent for Copper Removal. J. Clean. Prod. 2017, 142 Pt 4, 3809–3821. [Google Scholar] [CrossRef]
- Ghaedi, A.M.; Ghaedi, M.; Vafaei, A.; Iravani, N.; Keshavarz, M.; Rad, M.; Tyagi, I.; Agarwal, S.; Gupta, V.K. Adsorption of Copper (II) Using Modified Activated Carbon Prepared from Pomegranate Wood: Optimization by Bee Algorithm and Response Surface Methodology. J. Mol. Liq. 2015, 206, 195–206. [Google Scholar] [CrossRef]
- Rashed, M.K.; Tayh, W. Removal of Heavy Metals from Wastewater Using Pomegranate Peel. IOP Conf. Ser. Mater. Sci. Eng. 2020, 881, 012187. [Google Scholar] [CrossRef]
- Saeed, H.; Chaudhry, F.S.; Rehman, S.; Rashid, Z.; Ijaz, A.; Awan, J.A. Removal of Toxic Metallic Ions Cr(VI), Cu(II), Ni(II), Co(II) and Cd(II) from Waste Water Effluents of Tanneries by Using Punica Granatum (Pomgranate) Membrane. Iran. J. Energy Environ. 2016, 7, 52–57. [Google Scholar]
- Peng, Y.; Gardner, D.J.; Han, Y. Drying Cellulose Nanofibrils: In Search of a Suitable Method. Cellulose 2012, 19, 91–102. [Google Scholar] [CrossRef]
- Tenea, A.-G.; Dinu, C.; Rus, P.A.; Ionescu, I.A.; Gheorghe, S.; Iancu, V.I.; Vasile, G.G.; Pascu, L.F.; Chiriac, F.L. Exploring Adsorption Dynamics of Heavy Metals onto Varied Commercial Microplastic Substrates: Isothermal Models and Kinetics Analysis. Heliyon 2024, 10, e35364. [Google Scholar] [CrossRef]
- Assegehegn, G.; Brito-de La Fuente, E.; Franco, J.M.; Gallegos, C. The Importance of Understanding the Freezing Step and Its Impact on Freeze-Drying Process Performance. J. Pharm. Sci. 2019, 108, 1378–1395. [Google Scholar] [CrossRef]
- Cuppett, J.; Duncan, S.; Dietrich, A. Evaluation of Copper Speciation and Water Quality Factors That Affect Aqueous Copper Tasting Response. Chem. Senses 2006, 31, 689–697. [Google Scholar] [CrossRef] [PubMed]
- Natarajan, R.; Saikia, K.; Ponnusamy, S.K.; Rathankumar, A.K.; Rajendran, D.S.; Venkataraman, S.; Tannani, D.B.; Arvind, V.; Somanna, T.; Banerjee, K.; et al. Understanding the Factors Affecting Adsorption of Pharmaceuticals on Different Adsorbents—A Critical Literature Update. Chemosphere 2022, 287 Pt 1, 131958. [Google Scholar] [CrossRef]


Disclaimer/Publisher’s Note: The statements, opinions and data contained in all publications are solely those of the individual author(s) and contributor(s) and not of MDPI and/or the editor(s). MDPI and/or the editor(s) disclaim responsibility for any injury to people or property resulting from any ideas, methods, instructions or products referred to in the content. |
© 2025 by the authors. Licensee MDPI, Basel, Switzerland. This article is an open access article distributed under the terms and conditions of the Creative Commons Attribution (CC BY) license (https://creativecommons.org/licenses/by/4.0/).