1. Introduction
Amid accelerating digital transformation, various sectors of society are generating unprecedented data deluges. Data is no longer merely a resource but has become a core engine driving intelligent decision making, system optimization, and future prediction. With the widespread adoption of Internet of Things (IoT), artificial intelligence, and high-performance computing technologies, the volume, variety, and acquisition frequency of data are growing exponentially. Traditional single-source data analysis methods struggle to support high-quality decision making in complex environments, leading to research directions such as data fusion and intelligent analytics. In this context, Data Intelligence Fusion (DIF), which integrates “data fusion” and “intelligent computing,” has emerged as a critical interdisciplinary concept and methodology in information processing and decision-support systems [
1], rapidly gaining traction in fields like smart manufacturing, precision healthcare, financial risk management, and urban governance [
2].
The core objective of DIF is to dismantle data silos by enabling semantic-, feature-, and decision-level collaborative modeling of structured, semi-structured, unstructured, and multi-modal heterogeneous data, thereby achieving data-driven high-quality cognition and intelligent prediction. At the technical level, breakthroughs in DIF models—such as Ngiam et al.’s multi-modal deep learning framework [
3], Tang et al.’s graph neural fusion network [
4], and Li et al.’s multi-source information fusion graph convolution network for traffic flow prediction [
5]—have demonstrated significant advances in model expressiveness, robustness, and reasoning capabilities.
Nevertheless, DIF still faces challenges, including misalignment of multi-source features, effective compression of redundant information, and balancing model interpretability with generalization. To address these issues, researchers are continuously integrating cutting-edge techniques such as attention mechanisms, multi-scale fusion, transfer learning, and self-supervised modeling to enhance the practicality of DIF systems in complex scenarios [
6,
7].
Against this backdrop, this study focuses on the innovative application of DIF in predicting international sports medals, using the 2028 Los Angeles Olympics as a case study. By integrating multi-source heterogeneous data—historical Olympic medal records, macroeconomic indicators, athlete training logs, and team structures—this research constructs a multidimensional fusion modeling framework for medal distribution prediction and influencing factor analysis. Beyond conventional data processing, this study addresses modeling challenges such as geopolitical interference in historical data, event stability filtering, and athlete generational transitions. It establishes a multidimensional predictive framework integrating traditional competitive advantages, Host effects, economic and demographic factors, and regional influence. This research not only delivers interval predictions for the 2028 Olympic medal distribution but also reveals threshold effects of gross domestic product (GDP) and population size on medal counts, quantifies the marginal returns of coaching resource investments, and provides theoretically grounded and practically actionable insights for national Olympic committees in athlete development, event prioritization, resource allocation, and strategic planning.
The structure of this article is as follows: First, the overall modeling framework and key methodological innovations are introduced, including the integration of Traditional Advantage Index (TAI), Athlete Strength Index (ASI), and Host effect; next, the data sources, preprocessing principles, and filtering strategies are detailed. Then, the construction of various sub-models—such as K-means clustering, backpropagation neural network (BPNN), auto regressive integrated moving average (ARIMA), logistic regression, and random forest—is systematically described, along with the rationale for their selection, for example, the influence certain coaches have on medal counts, which we call the “Great Coach” effect [
8]. Then, the comprehensive results and validation analyses are presented, including performance metrics and predictive accuracy assessments. Finally, the model’s application scenarios, limitations, and implications for Olympic strategy formulation are discussed, followed by a sensitivity analysis and suggestions for future work.
2. Methodology
2.1. Idea
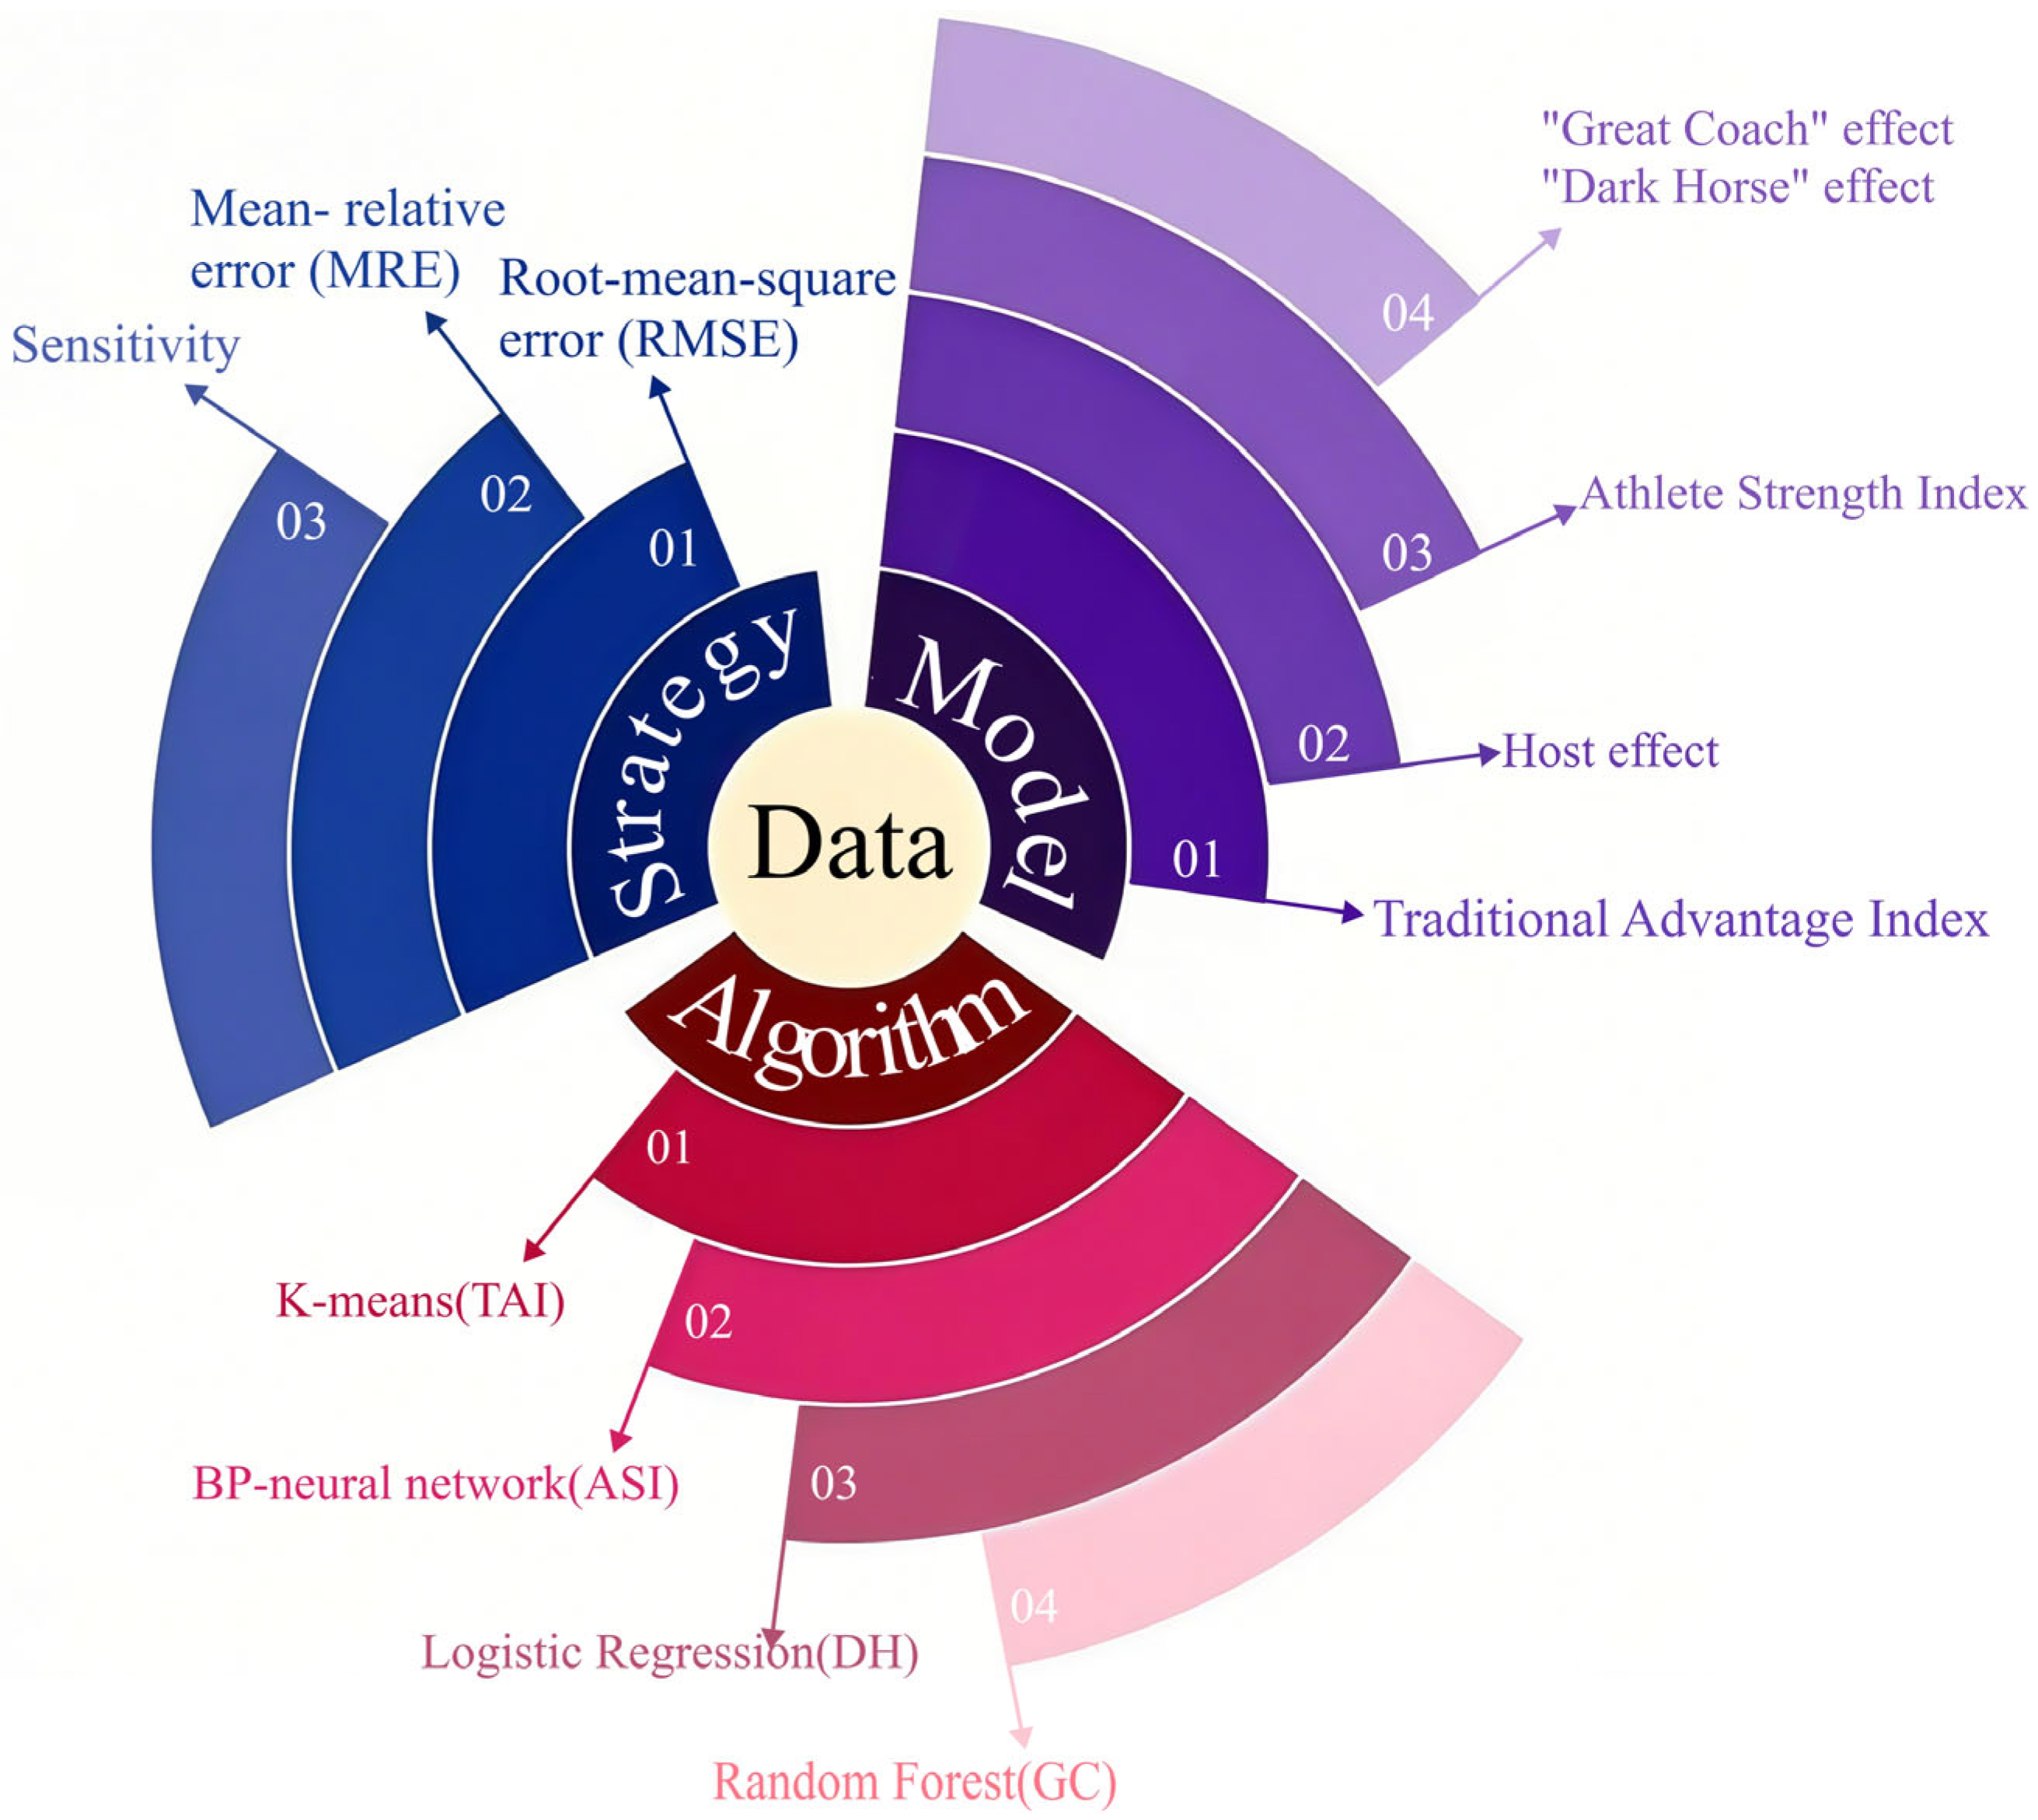
DIF requires the organic fusion of data and intelligent methods, which is composed of a model, strategy, and algorithm [
1]. As shown in
Figure 1, our modeling idea considers these factors sufficiently: the data is core and similar with a specific common nature; the model is a mapping or function considering the traditional advantages, athletes’ strength, host nation, debut medal-winning countries which we call the “Dark Horse” effect and the “Great Coach” effect [
9]; the strategy is selected as the common evaluation standard, such as root mean square error (RMSE), Mean-relative error (MRE), and sensitivity, for finding the optimal model; The algorithms include the K-means, BPNN, logistic regression, and random forest to determine this model.
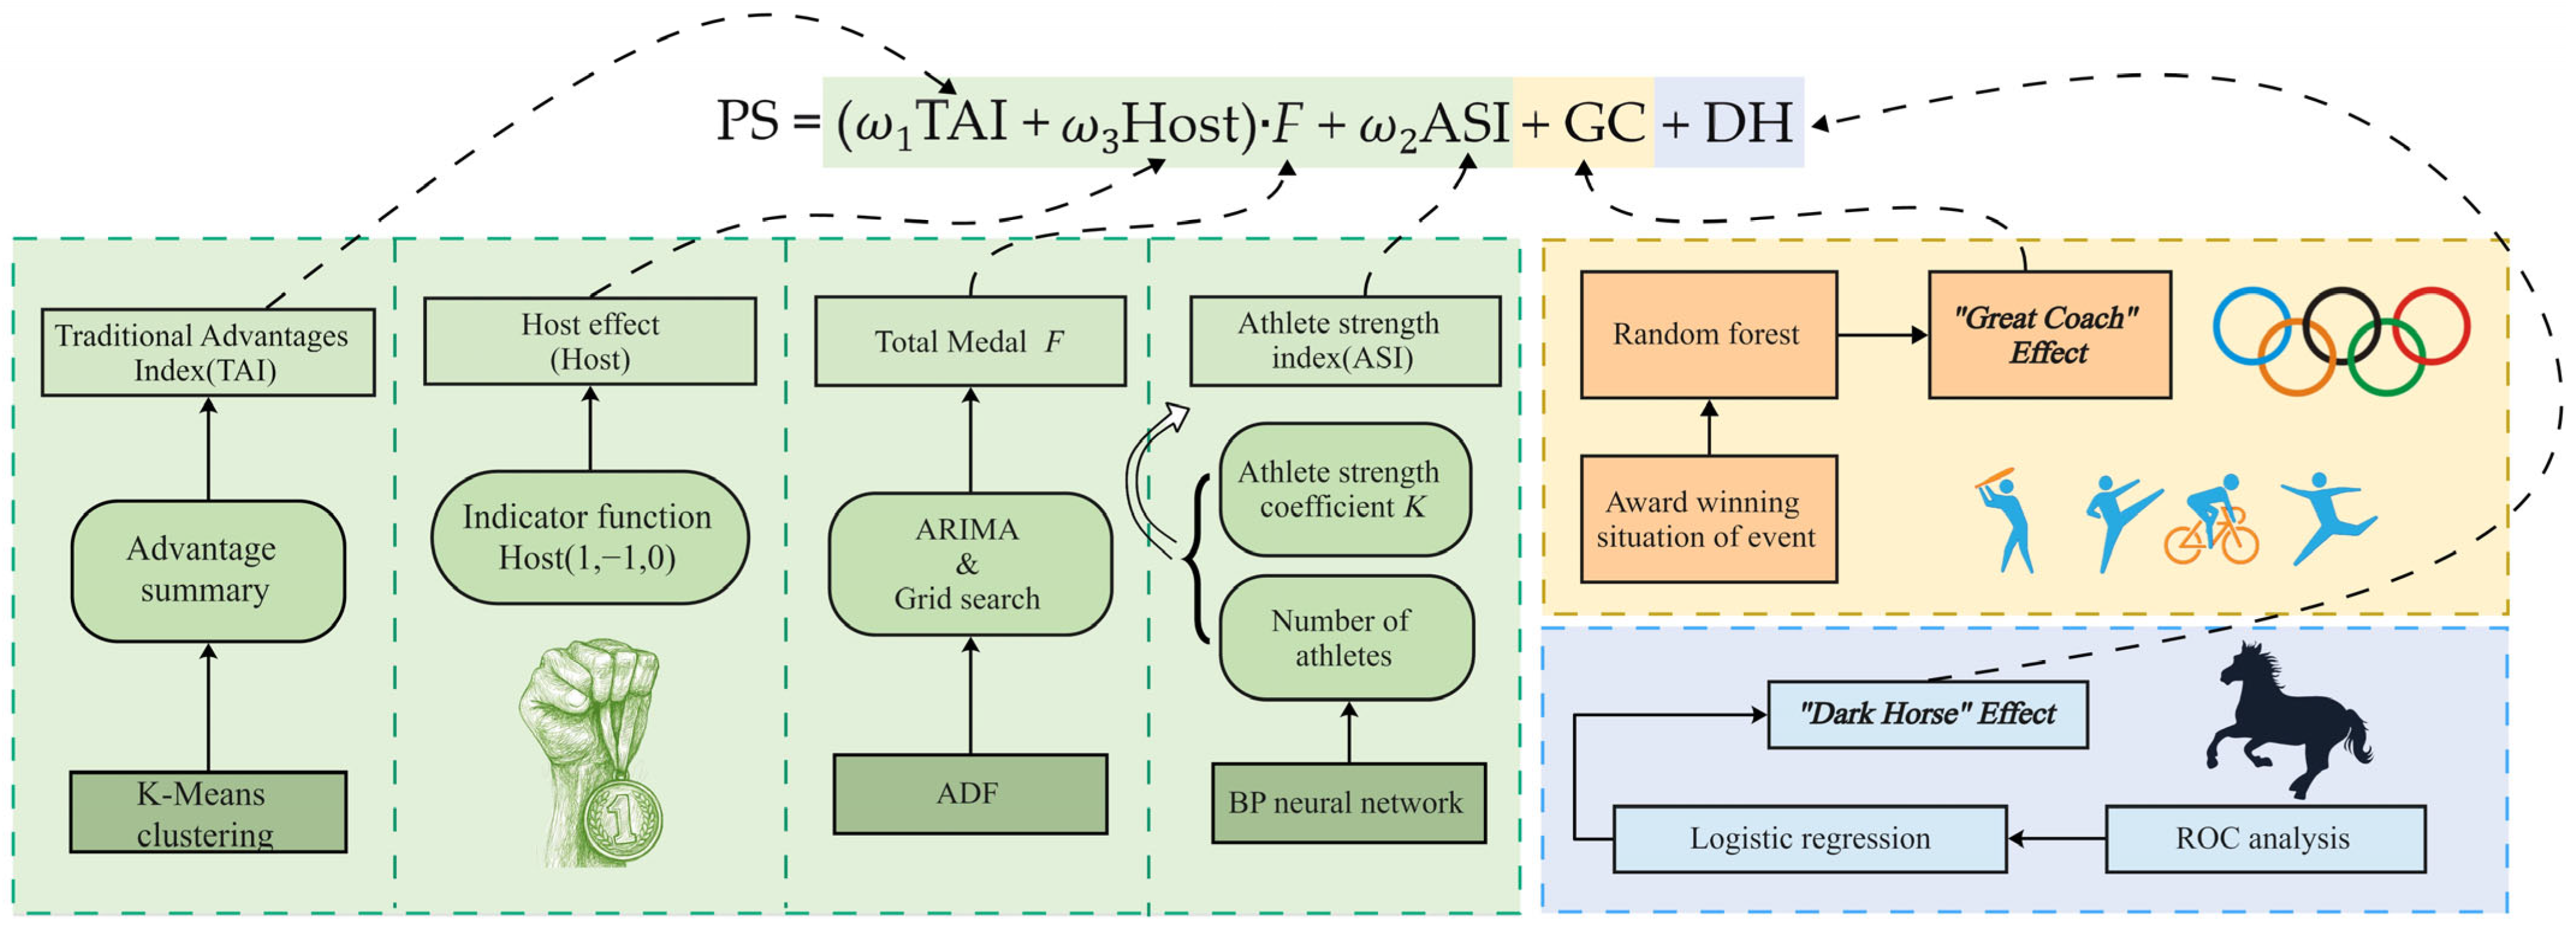
The modelling process is shown in
Figure 2, illustrating the multiple stages that underpin the hybrid intelligent prediction framework. The model begins by introducing the TAI, derived from K-means clustering, which classifies countries’ historical competitiveness in specific Olympic events into high, medium, or low categories. This allows for the quantification of structural national advantages. Following this, the ASI is constructed using a BPNN, which dynamically reflects each country’s athletic capability by predicting the number of medal-winning athletes based on past performance and participation data. A Host effect factor is also incorporated, modeled by a ternary variable (1 for host, −1 for post-host adjustment, and 0 otherwise), to account for the surge or drop in medals often associated with hosting the Games.
The model further integrates two critical nonlinear influences. The first is the “Great Coach” effect, modeled via random forest regression, which captures how elite coaching can elevate national medal counts beyond structural and athlete-based expectations—both in targeted events and indirectly through system-wide performance gains. The second is the “Dark Horse” effect, quantified through logistic regression, which predicts the likelihood of countries winning their first Olympic medal, based on variables such as participation frequency, past results, and event diversity.
Finally, the model’s accuracy and robustness are tested by comparing its medal count predictions for the 2024 Olympics with actual outcomes, using metrics such as RMSE and mean relative error. Collectively,
Figure 2 encapsulates the integration of multiple data sources, statistical techniques, and machine learning algorithms into a unified Performance Score framework, offering a comprehensive approach to Olympic medal forecasting.
2.2. Data
The data was collected from
https://olympics.com (accessed on 26 Janurary 2025) and
https://www.olympedia.org (accessed on 26 Janurary 2025), which are the official websites of the International Olympic Committee. These platforms provide comprehensive historical Olympic data, including athlete participation, coach records, medal counts (gold, silver, bronze) by event, competition disciplines, and medal tables. From these sources, the following datasets were compiled:
Medal counts per event: Detailed records of gold, silver, and bronze medals awarded in each discipline across all Olympic editions, aggregated to calculate total medals per Games.
Historical medal tables: Annual rankings of nations by total medals earned, including gold, silver, and bronze.
Host nation records: Documentation of countries hosting the Olympics for each edition.
Athlete participation: Profiles of competitors in each event, including nationality, gender, and medal status (with athletes tracked per event to avoid duplication in multi-discipline participation).
After extracting the raw data, preliminary cleaning was performed to address inconsistencies, missing values, or duplicate entries that could bias prediction outcomes. This included standardizing country names, resolving discrepancies in medal allocations, and validating athlete records against official results. The principle of data processing is as follows:
Abandon the data of countries that once participated but now no longer exist or have split, such as the Soviet Union. It is meaningless to predict a non-existent country.
Combine the results of athletes who are members of the team competition; otherwise, repeated medal statistics will cause the statistical value to deviate from the actual value seriously.
Abandon those events that only existed in the past few Olympic Games, such as Roque.
Multiple teams from a country should be merged and treated as a single entity [
10].
For years with missing data on the official website, any interpolation method would lead to unreasonable imputed values; therefore, we excluded those missing values.
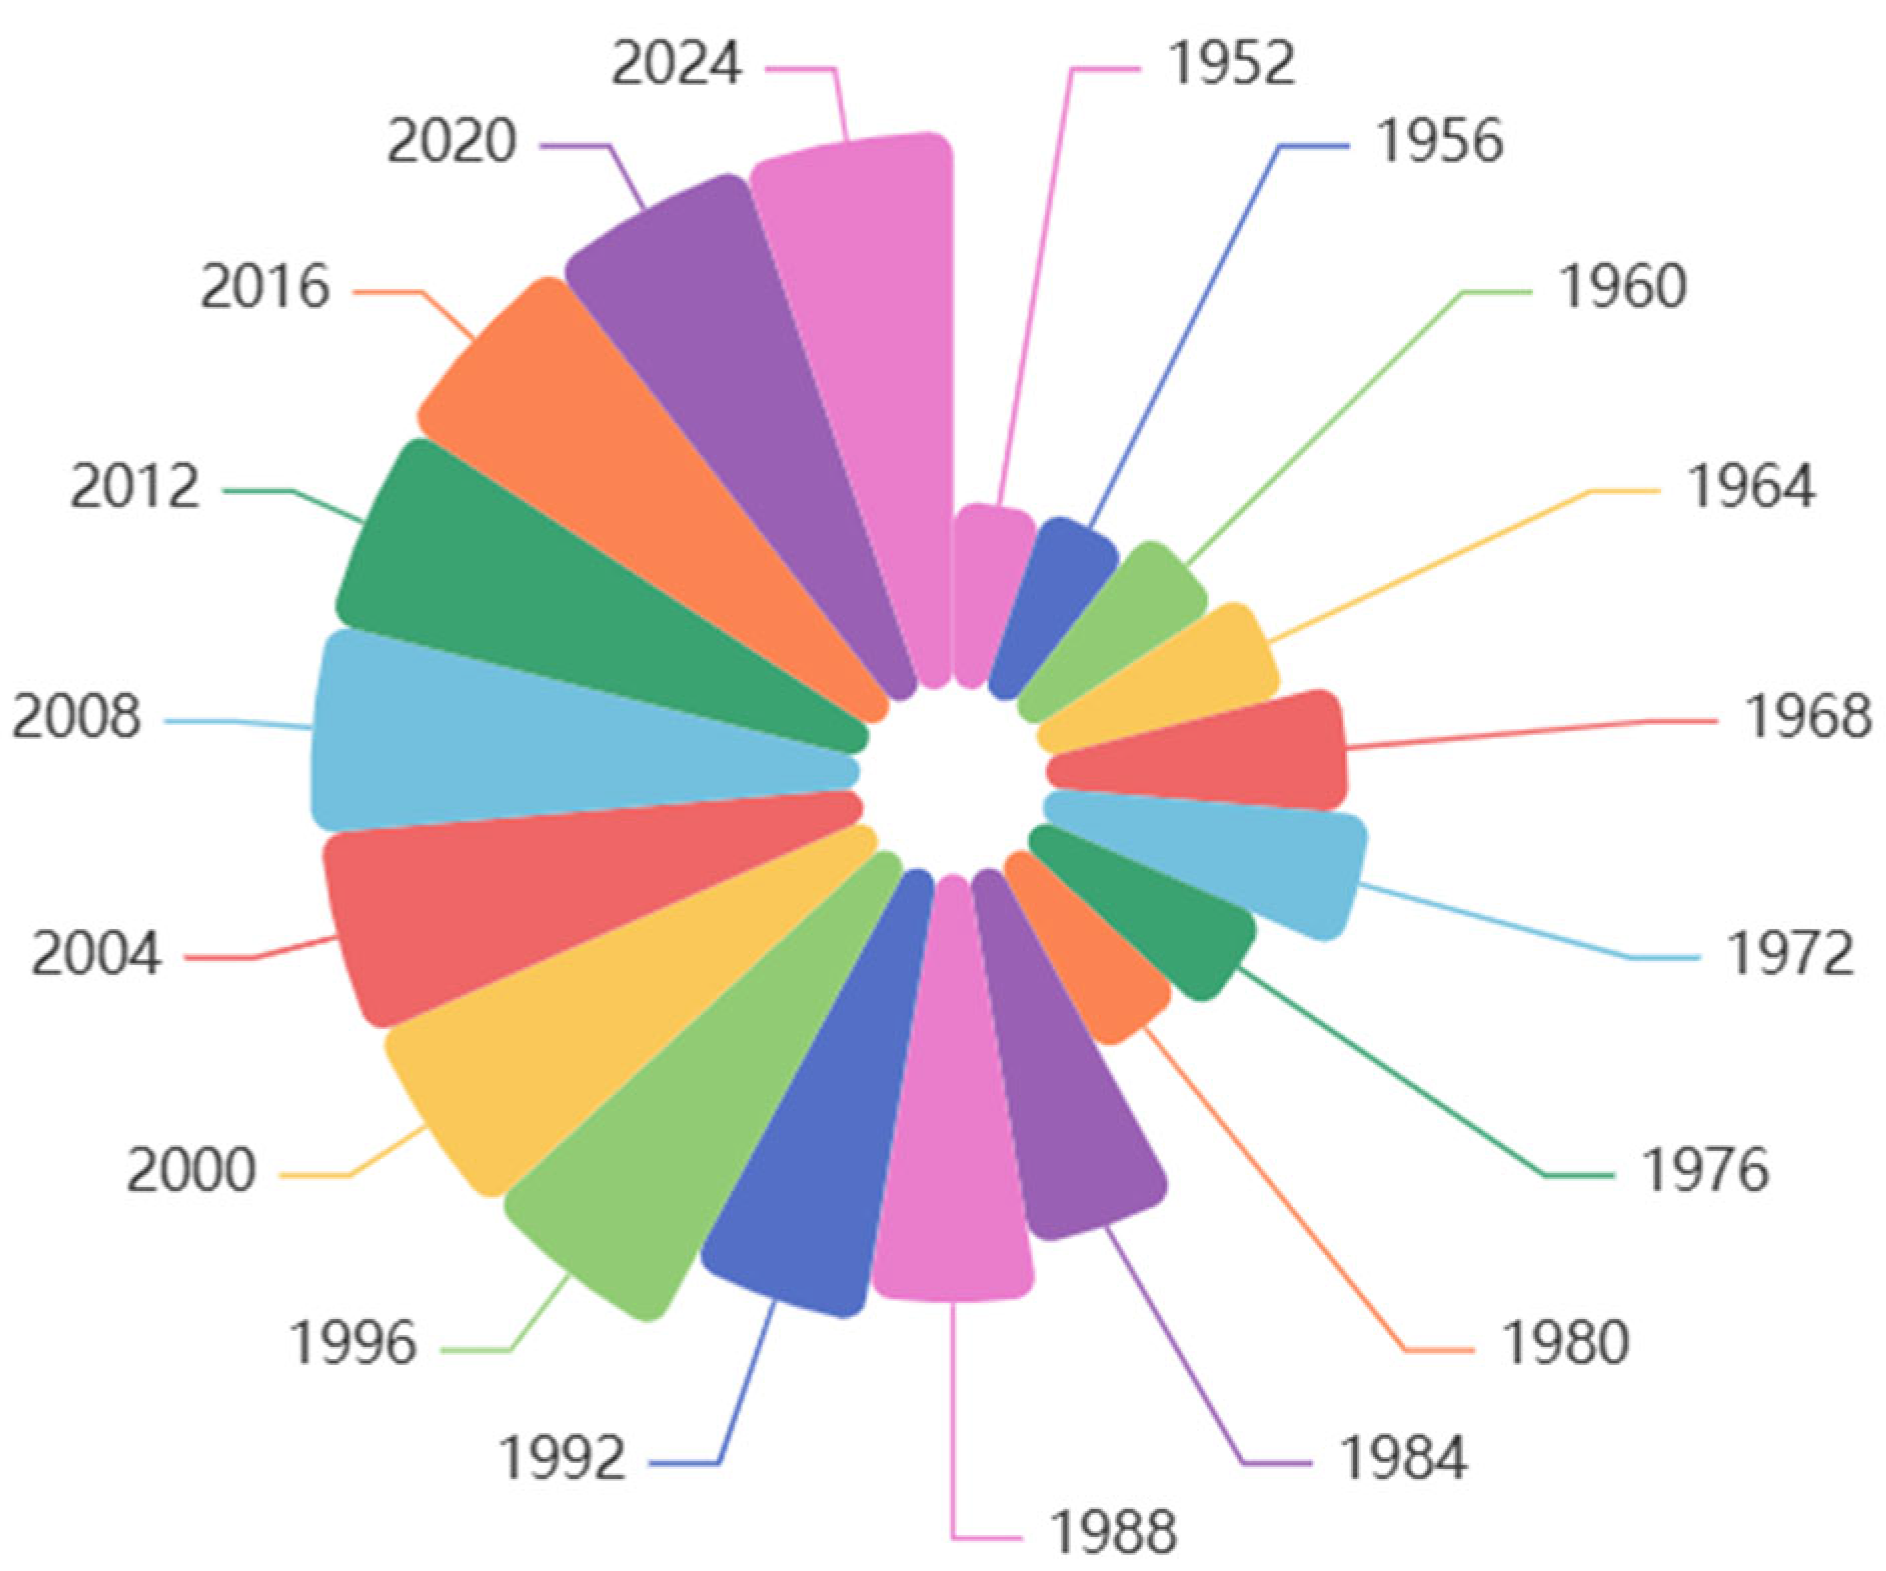
Figure 3 shows the trend of the number of countries participating in each Olympic Games after 1952. The number of countries participating in the Olympic Games did not stabilize until 1996 and after. Therefore, when we analyze the data, we focus on the data from 1996 and after, which is more authentic and representative.
When observing the data, we found that the number of countries participating in the Olympic Games was strongly correlated with political factors, so we need to exclude these political factors when selecting the data. For example, before 1945, the world was in a state of turbulence because of the well-known factors of war. After 1984, the world entered a period of peace. Although the participation of major sports countries has been stable, currently, due to the change in the competition system and other factors, the events of the Olympic Games have changed greatly. Many events have been removed, and new events have also been added. This change did not stabilize until 2000.
Through comprehensive considerations, we decided to choose the data after 2000 as the data sample for traditional advantage analysis. Volatile data fluctuations would severely compromise the robustness and accuracy of our models, as our analysis requires relatively stable data patterns.
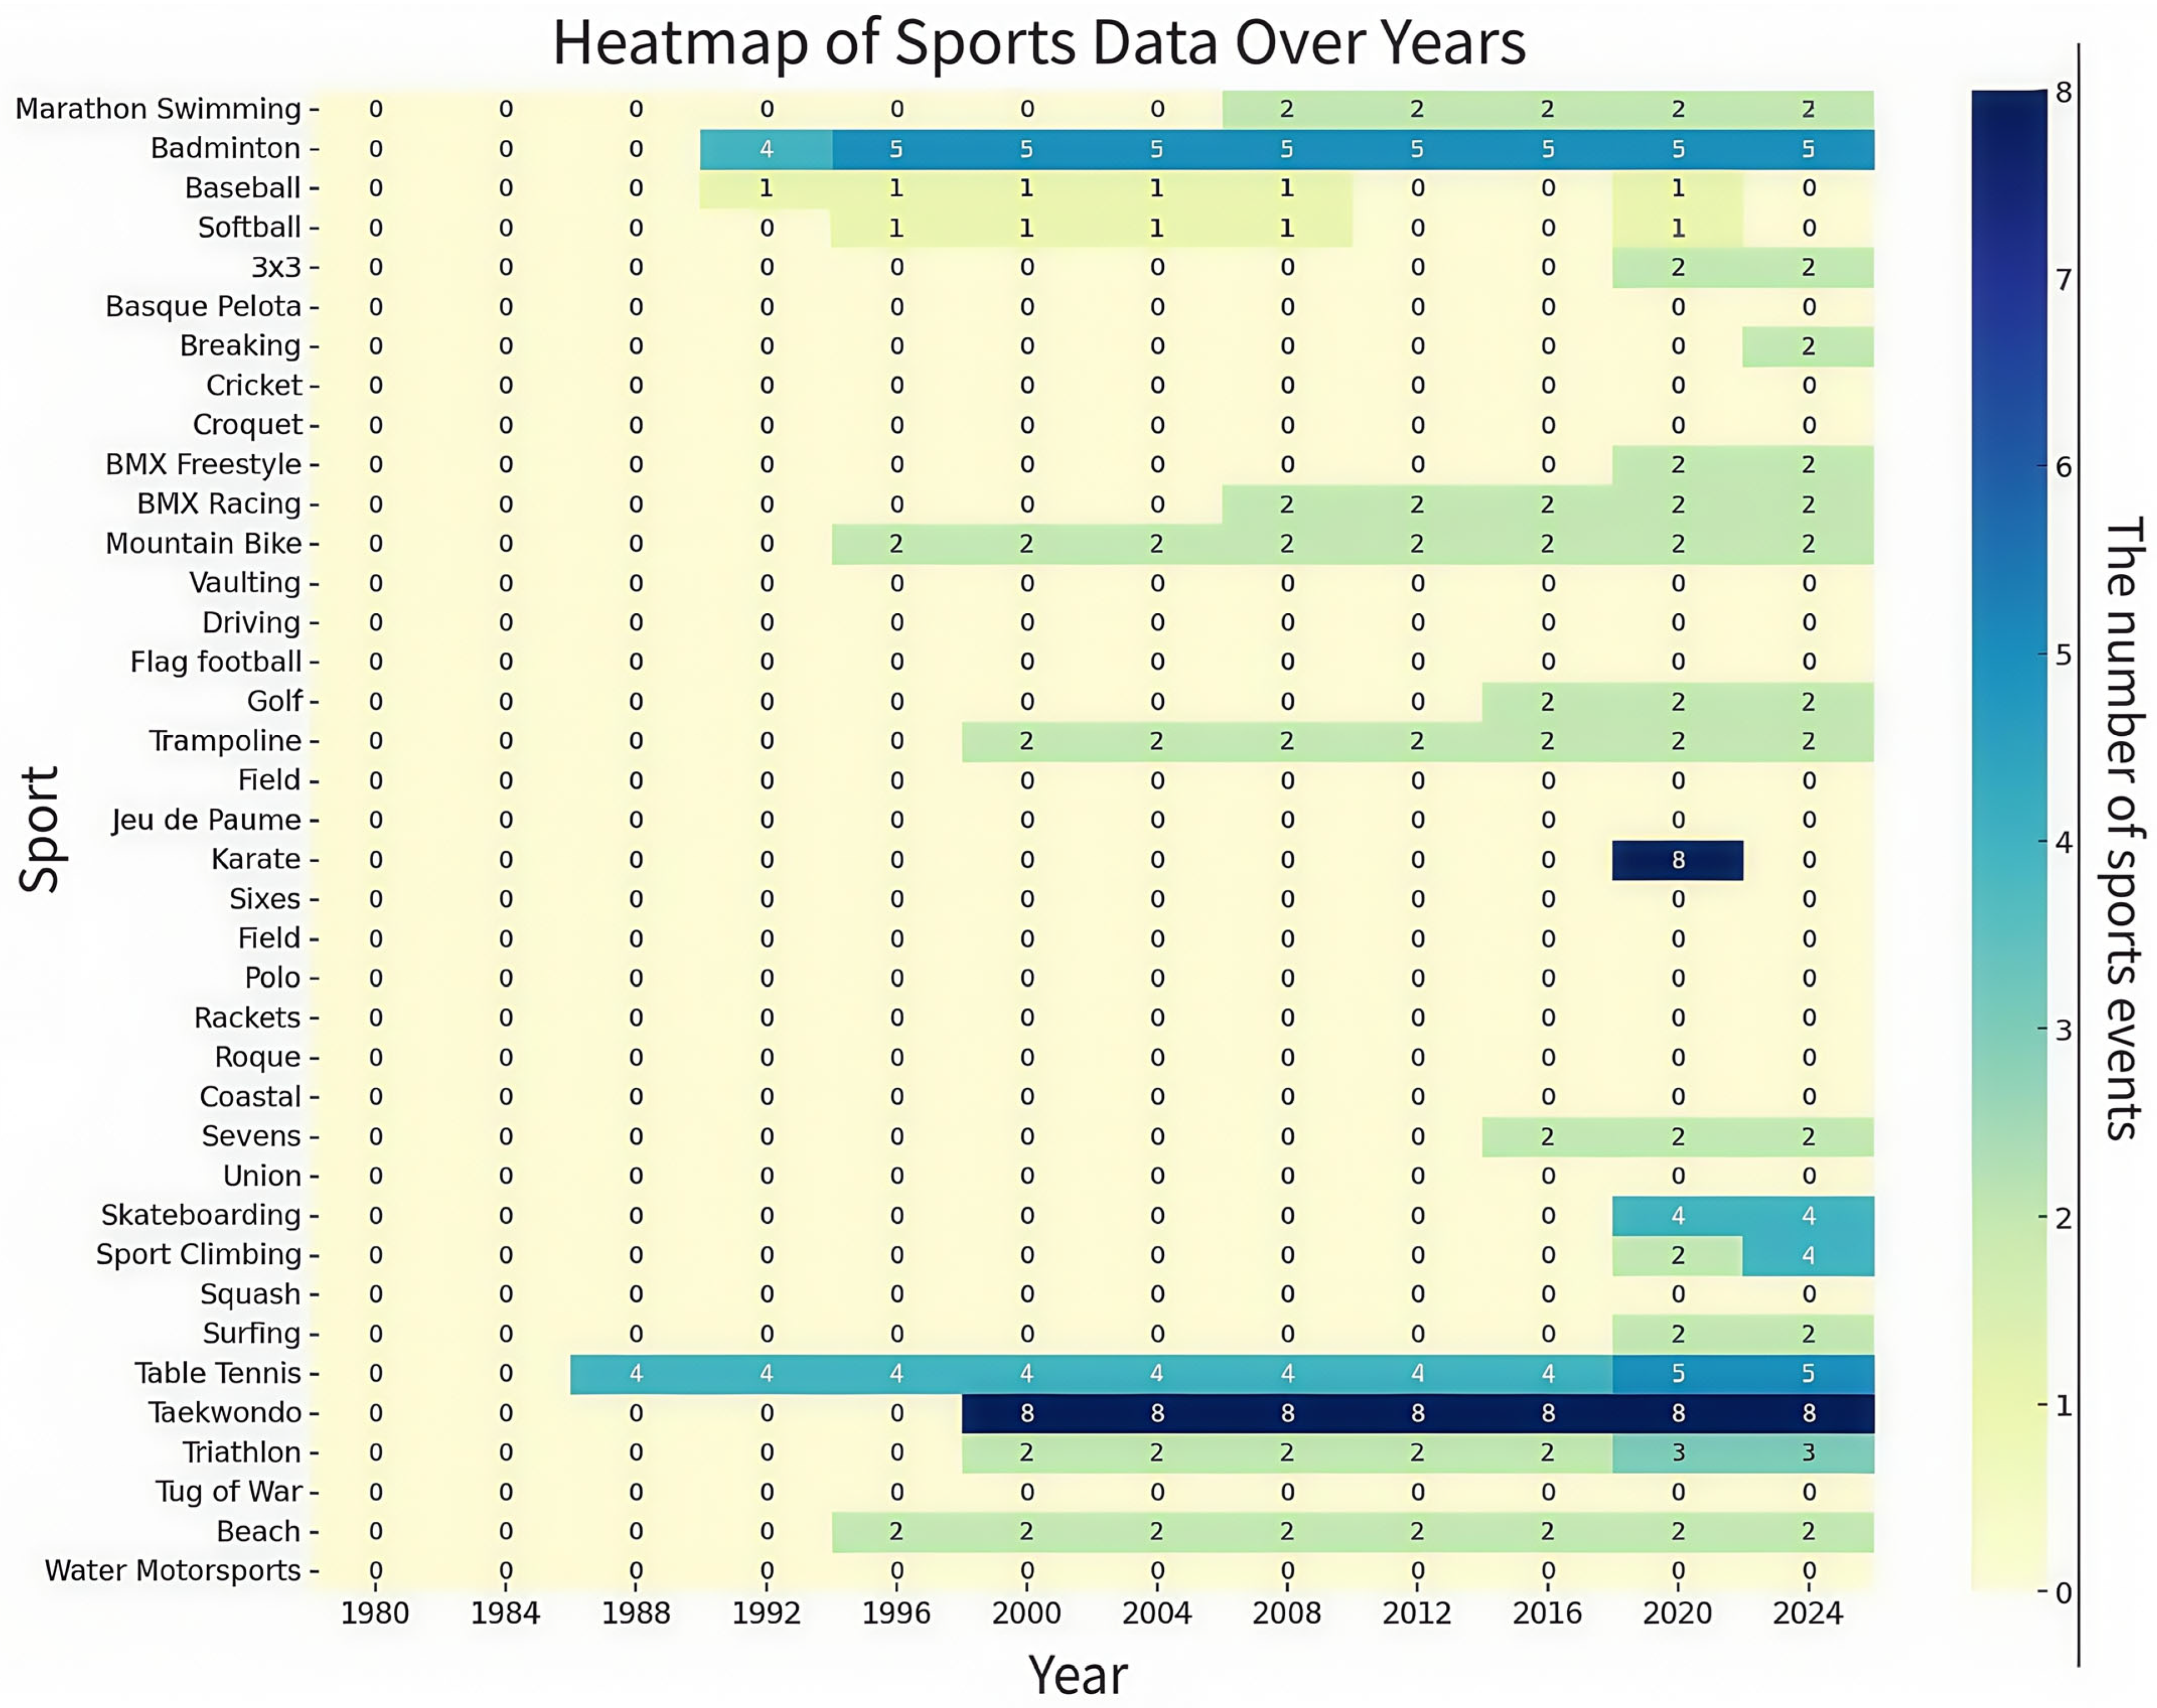
To more intuitively reflect our ideas, we selected some representative data and drew a heat map based on sports and time. As shown in
Figure 4, some sports appeared stably in the Olympic Games after 2000, and some sports did not appear again after only once in the past. Our goal is to sift out these events and obtain the stable events existing in the Olympic Games.
2.3. Model
To accurately describe the distribution of medals in each Olympic Games, we created an evaluation system called the Performance Score (PS), which corresponds to the number of medals. It can directly reflect the number of medals a country has won in a certain Olympic Games. Based on this, initially, we constructed the main part of PS by considering three main factors: TAI, ASI, and Host. The main part of the model is expressed as follows:
where
,
, and
are the weights of the three indices, respectively. And
F represents the total number of Olympic medals.
2.3.1. Traditional Advantage
To quantify the traditional advantages, we counted the Olympic Games in 2000 and later, calculated the total number of medals won by each country in each event, and the percentage of the total number of medals produced in this event since 2000. To distinguish whether different countries have advantages in different projects, we use the K-means algorithm to classify this percentage [
11].
The K-means algorithm is an iterative clustering analysis algorithm [
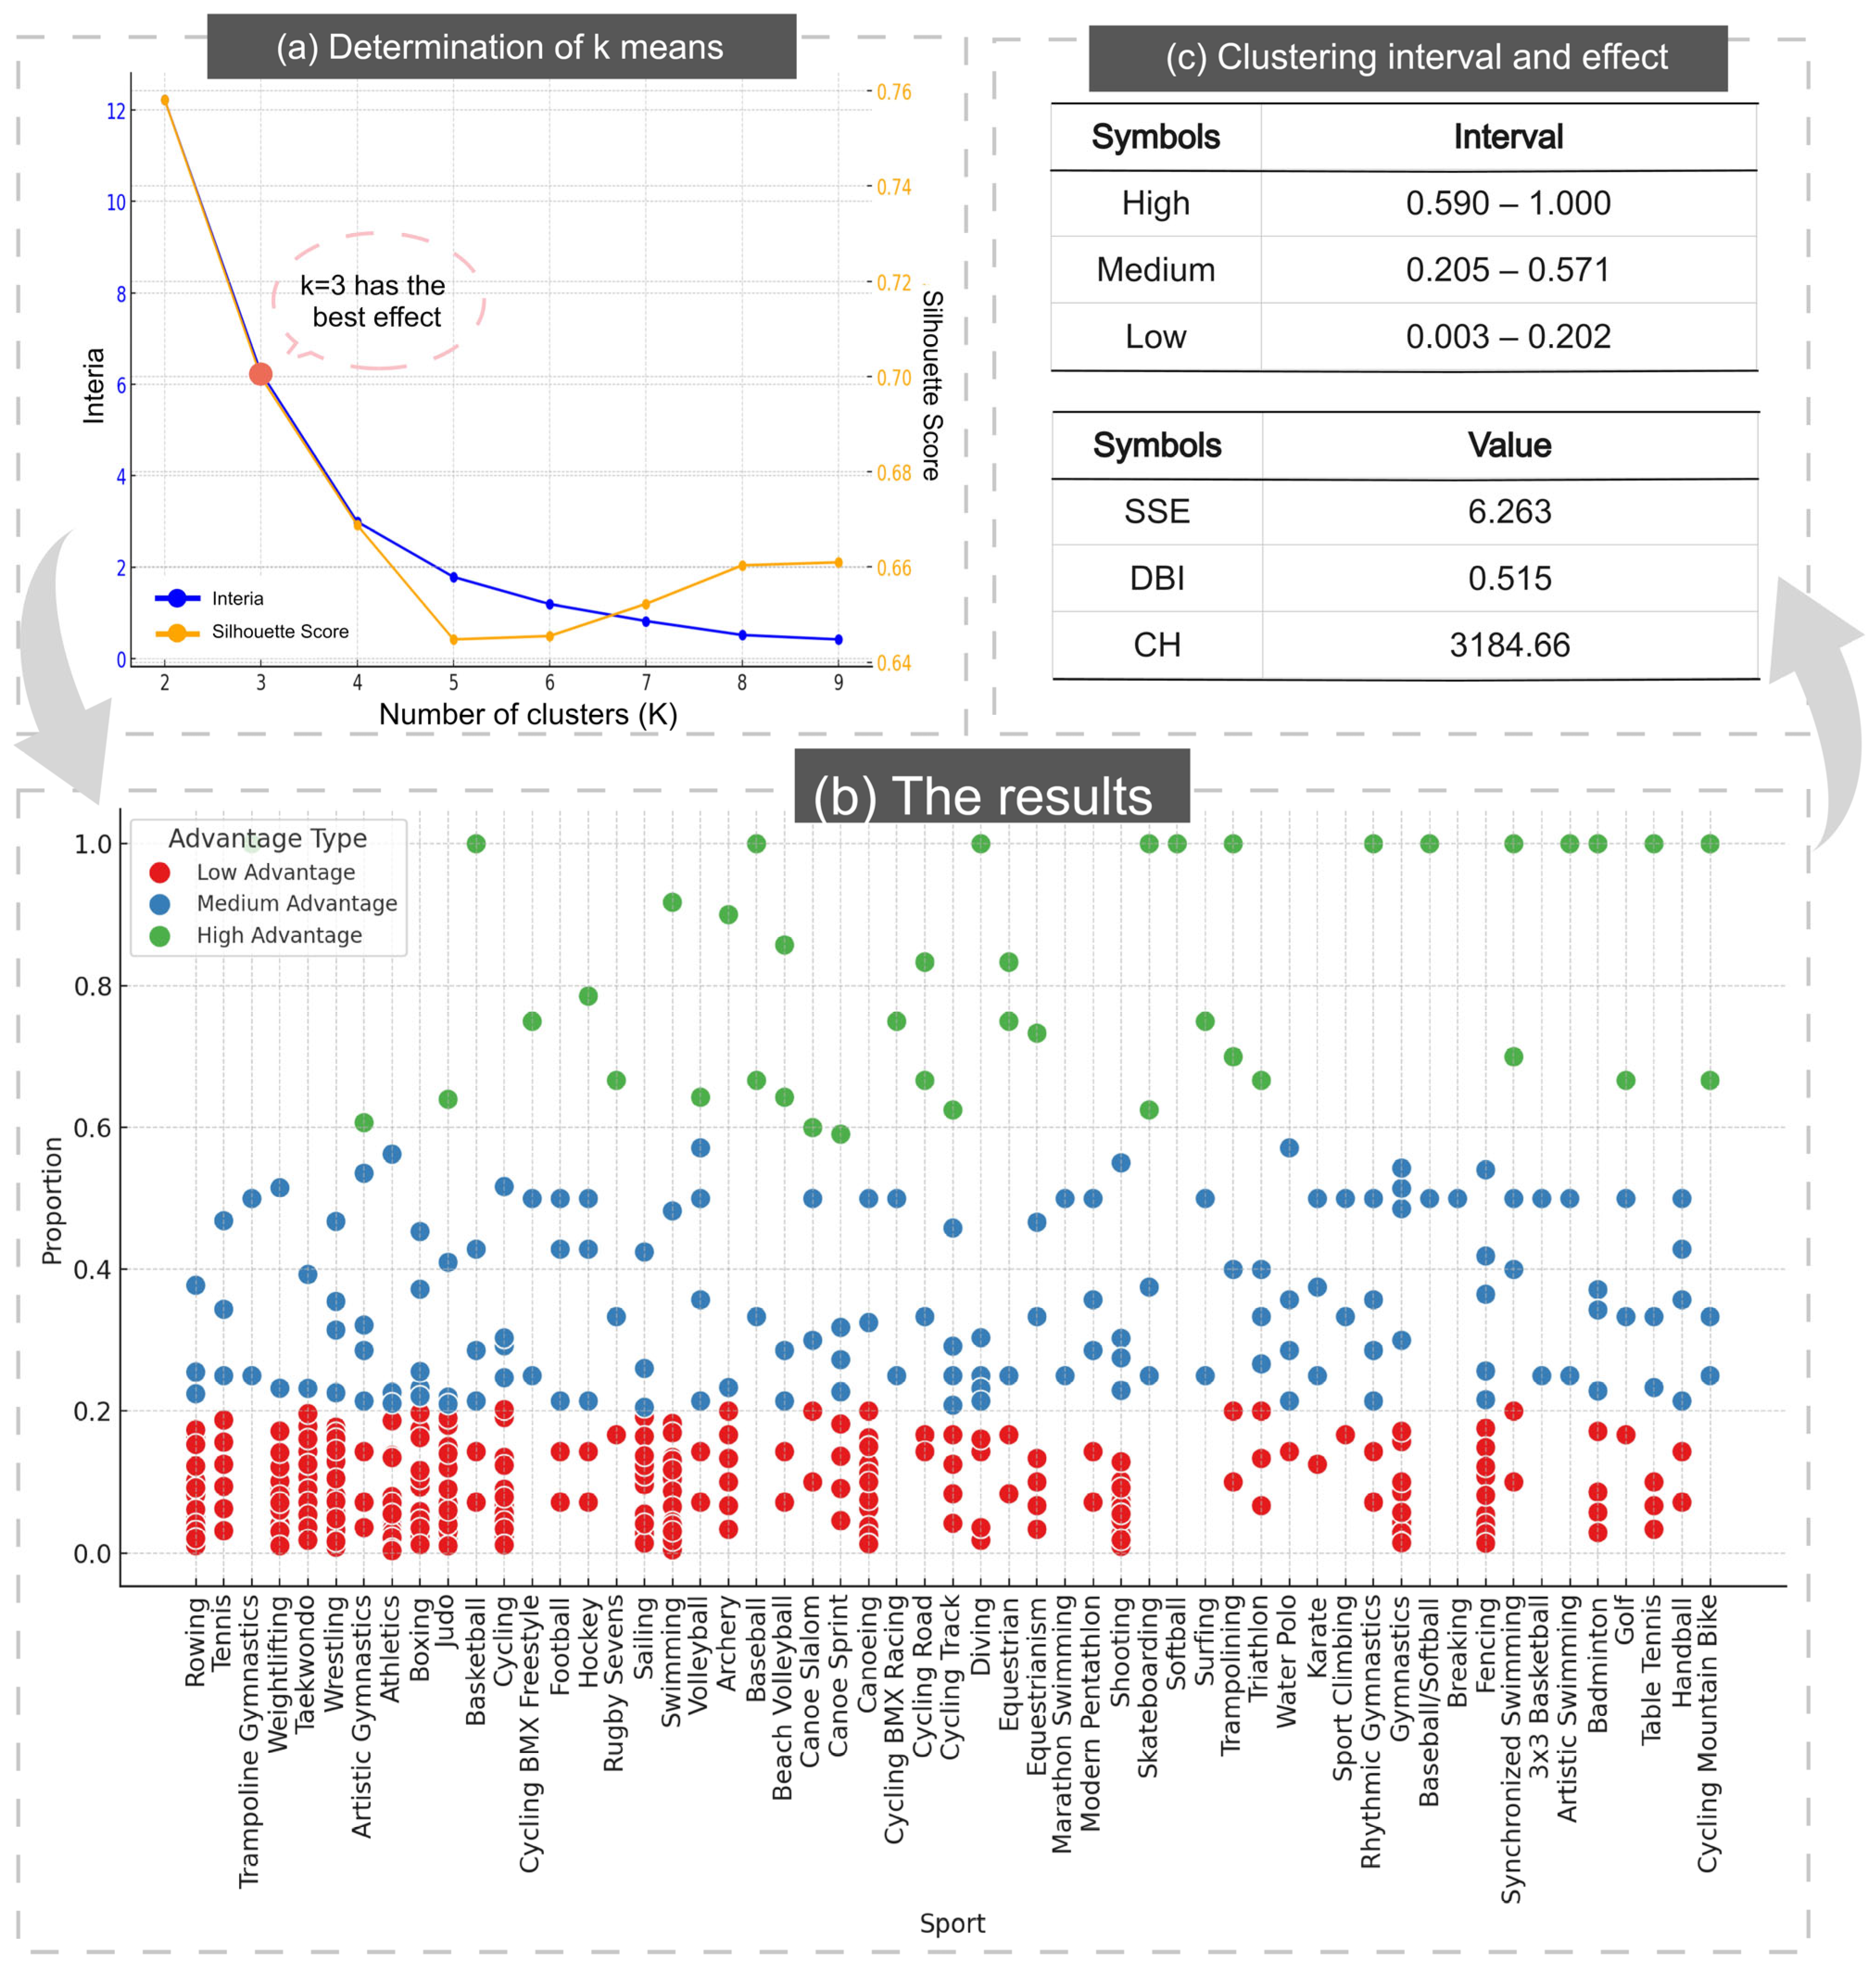
12]. For the K-means algorithm, firstly, we need to select the clustering K value, calculate the inertia value and contour coefficient through the elbow method, and draw the curve between them and the K value, as shown in
Figure 5a.
To determine optimal clustering centers, we selected three candidate points for iterative optimization, ultimately categorizing national sports competitiveness into three advantage levels: high, medium, and low. Countries with a high advantage demonstrate significant competitiveness in events, exhibiting elevated win rates and medal acquisition capabilities. Medium advantage indicates moderate competitive proficiency, while low advantage reflects insufficient competitiveness and diminished winning probabilities. Clustering results are shown in
Figure 5b.
The percentage intervals corresponding to each category are shown in the first table in
Figure 5c. To verify the reliability of the clustering, we simultaneously calculated the SSE, DBI, and CH scores of the clusters, as shown in the second table. Later, we use the same method for the number of gold medals.
For the TAI, it should be the percentage of medals in a country’s advantageous events to the total number of medals. In this way, we only need to multiply TAI by the total number of medals to obtain the total number of medals won by a country through advantageous events.
Firstly, to score a country’s advantageous projects, we determined that a country with a high advantage in a project scores 5 points, a medium advantage is scored 3 points, and a low advantage is scored 1 point. Our scoring formula is as follows:
where the
i represents the project number in which the country has advantages.
Scores represent the advantage score for each country, and
H,
M, and
L, denote the number of high, medium, and low advantage items that a country possesses, respectively.
Based on this, TAI is defined as follows:
where the
j and
m are the country codes.
2.3.2. Host Effect
As an important part of predicting the Olympic medal table, the effect of the host nation cannot be ignored [
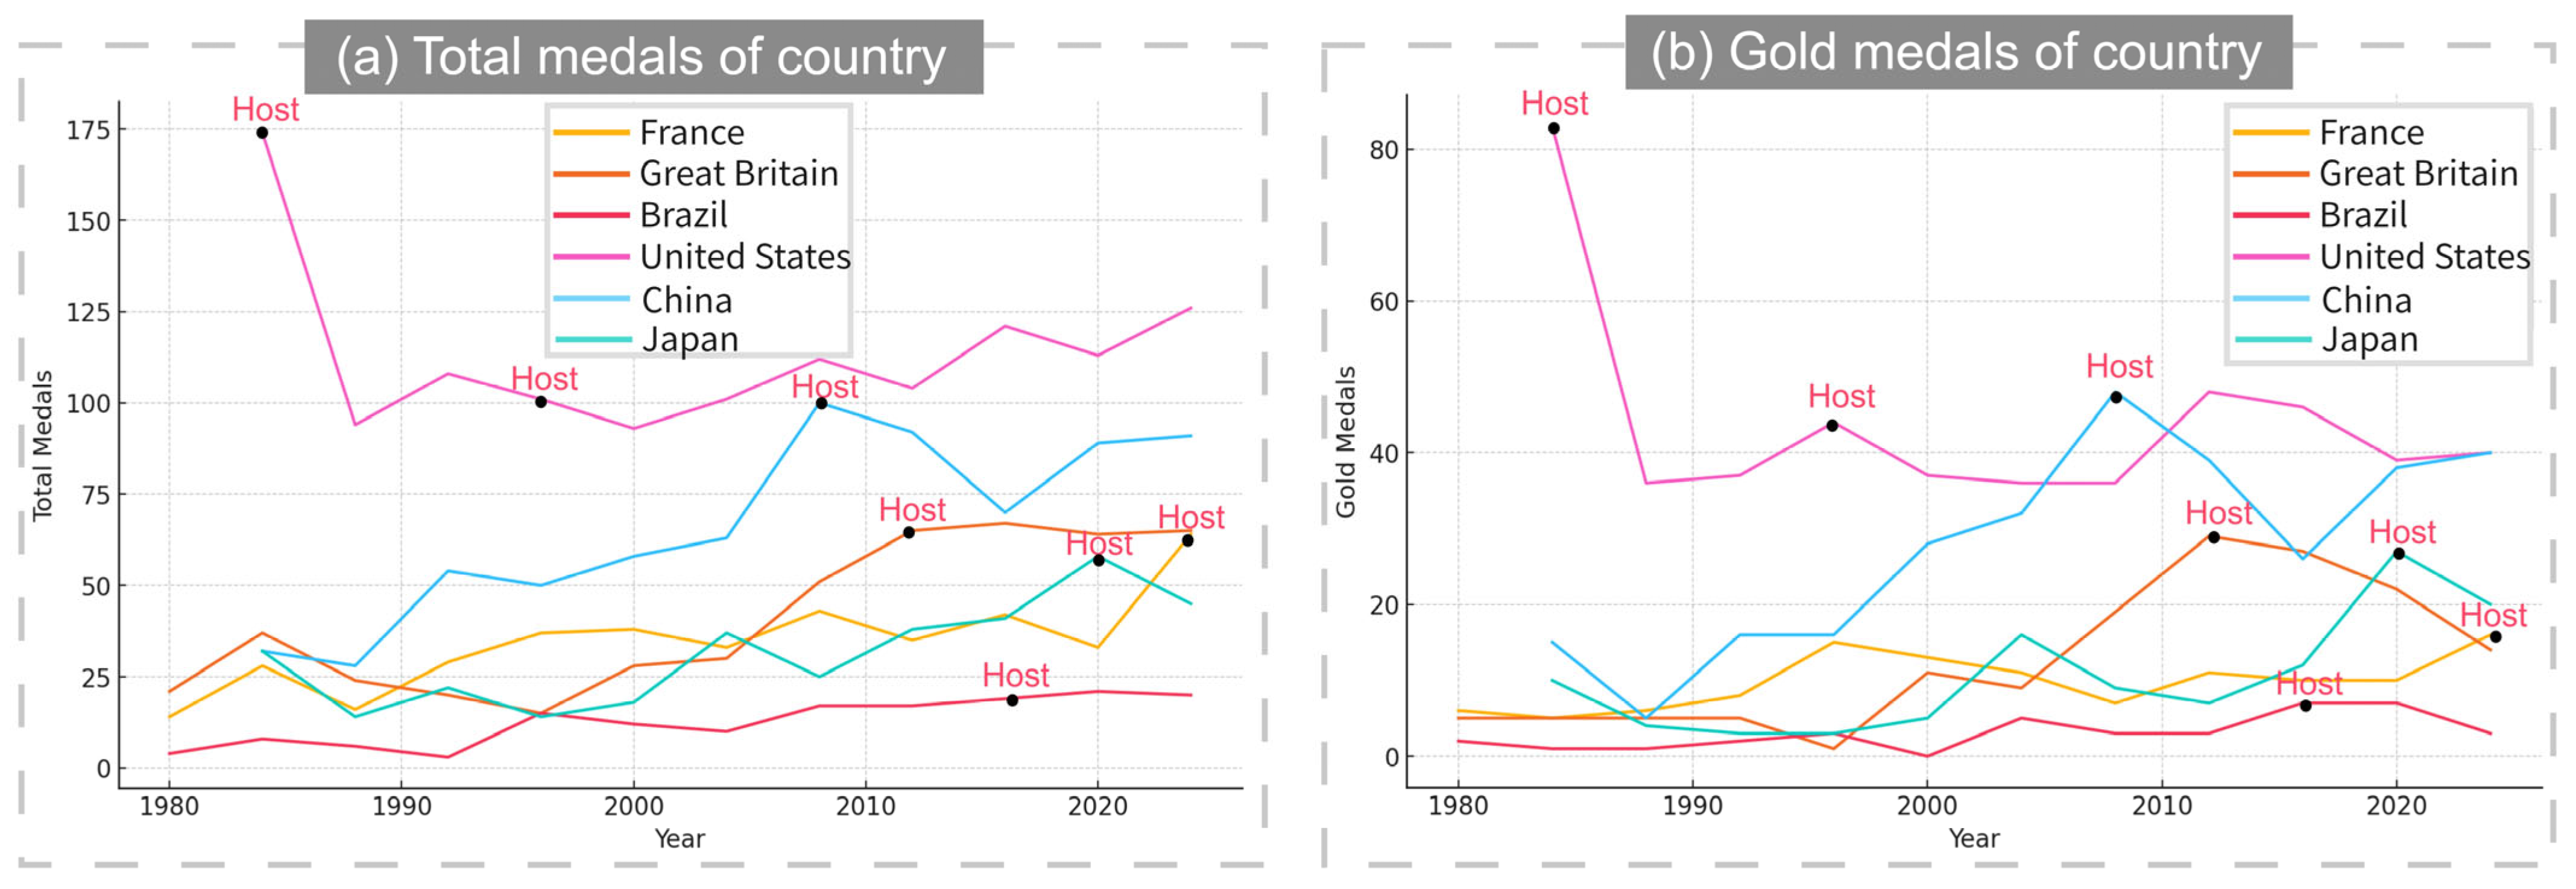
13]. By observing data after 2000, we found that for most host countries, there is a sudden increase in both the total number of medals won and the number of gold medals won compared to the previous year, which we named the Host effect. As shown in
Figure 6:
We define the Host as follows:
In the process of building the model, we found that whether a country hosts the Olympics has a negative impact on the long-term prediction and overall trend of medal distribution, which can disrupt our prediction accuracy and is usually identified as an outlier in the algorithm. Therefore, to eliminate the impact of this effect on future predictions, we introduced “−1” to modify our model. This usually eliminates the overall data volatility caused by the Host effect in the previous year in the second year’s data.
2.3.3. Athlete Strength
Athlete evaluation in this study prioritizes recent Olympic performance, as data relevance diminishes over extended periods. We focused on athletes participating in up to three consecutive Games, excluding those with more appearances, given comparable physical capabilities and peak performance periods between adjacent Olympics.
The athlete’s strength coefficient
K is defined as follows:
where
ATwon represents the number of athletes who have won medals and
ATtotal represents the total number of athletes in the country at this Olympics.
The strength coefficient (
K) quantifies the medal-winning athlete ratio per country, serving as an indicator of national athletic proficiency. Assuming consistent
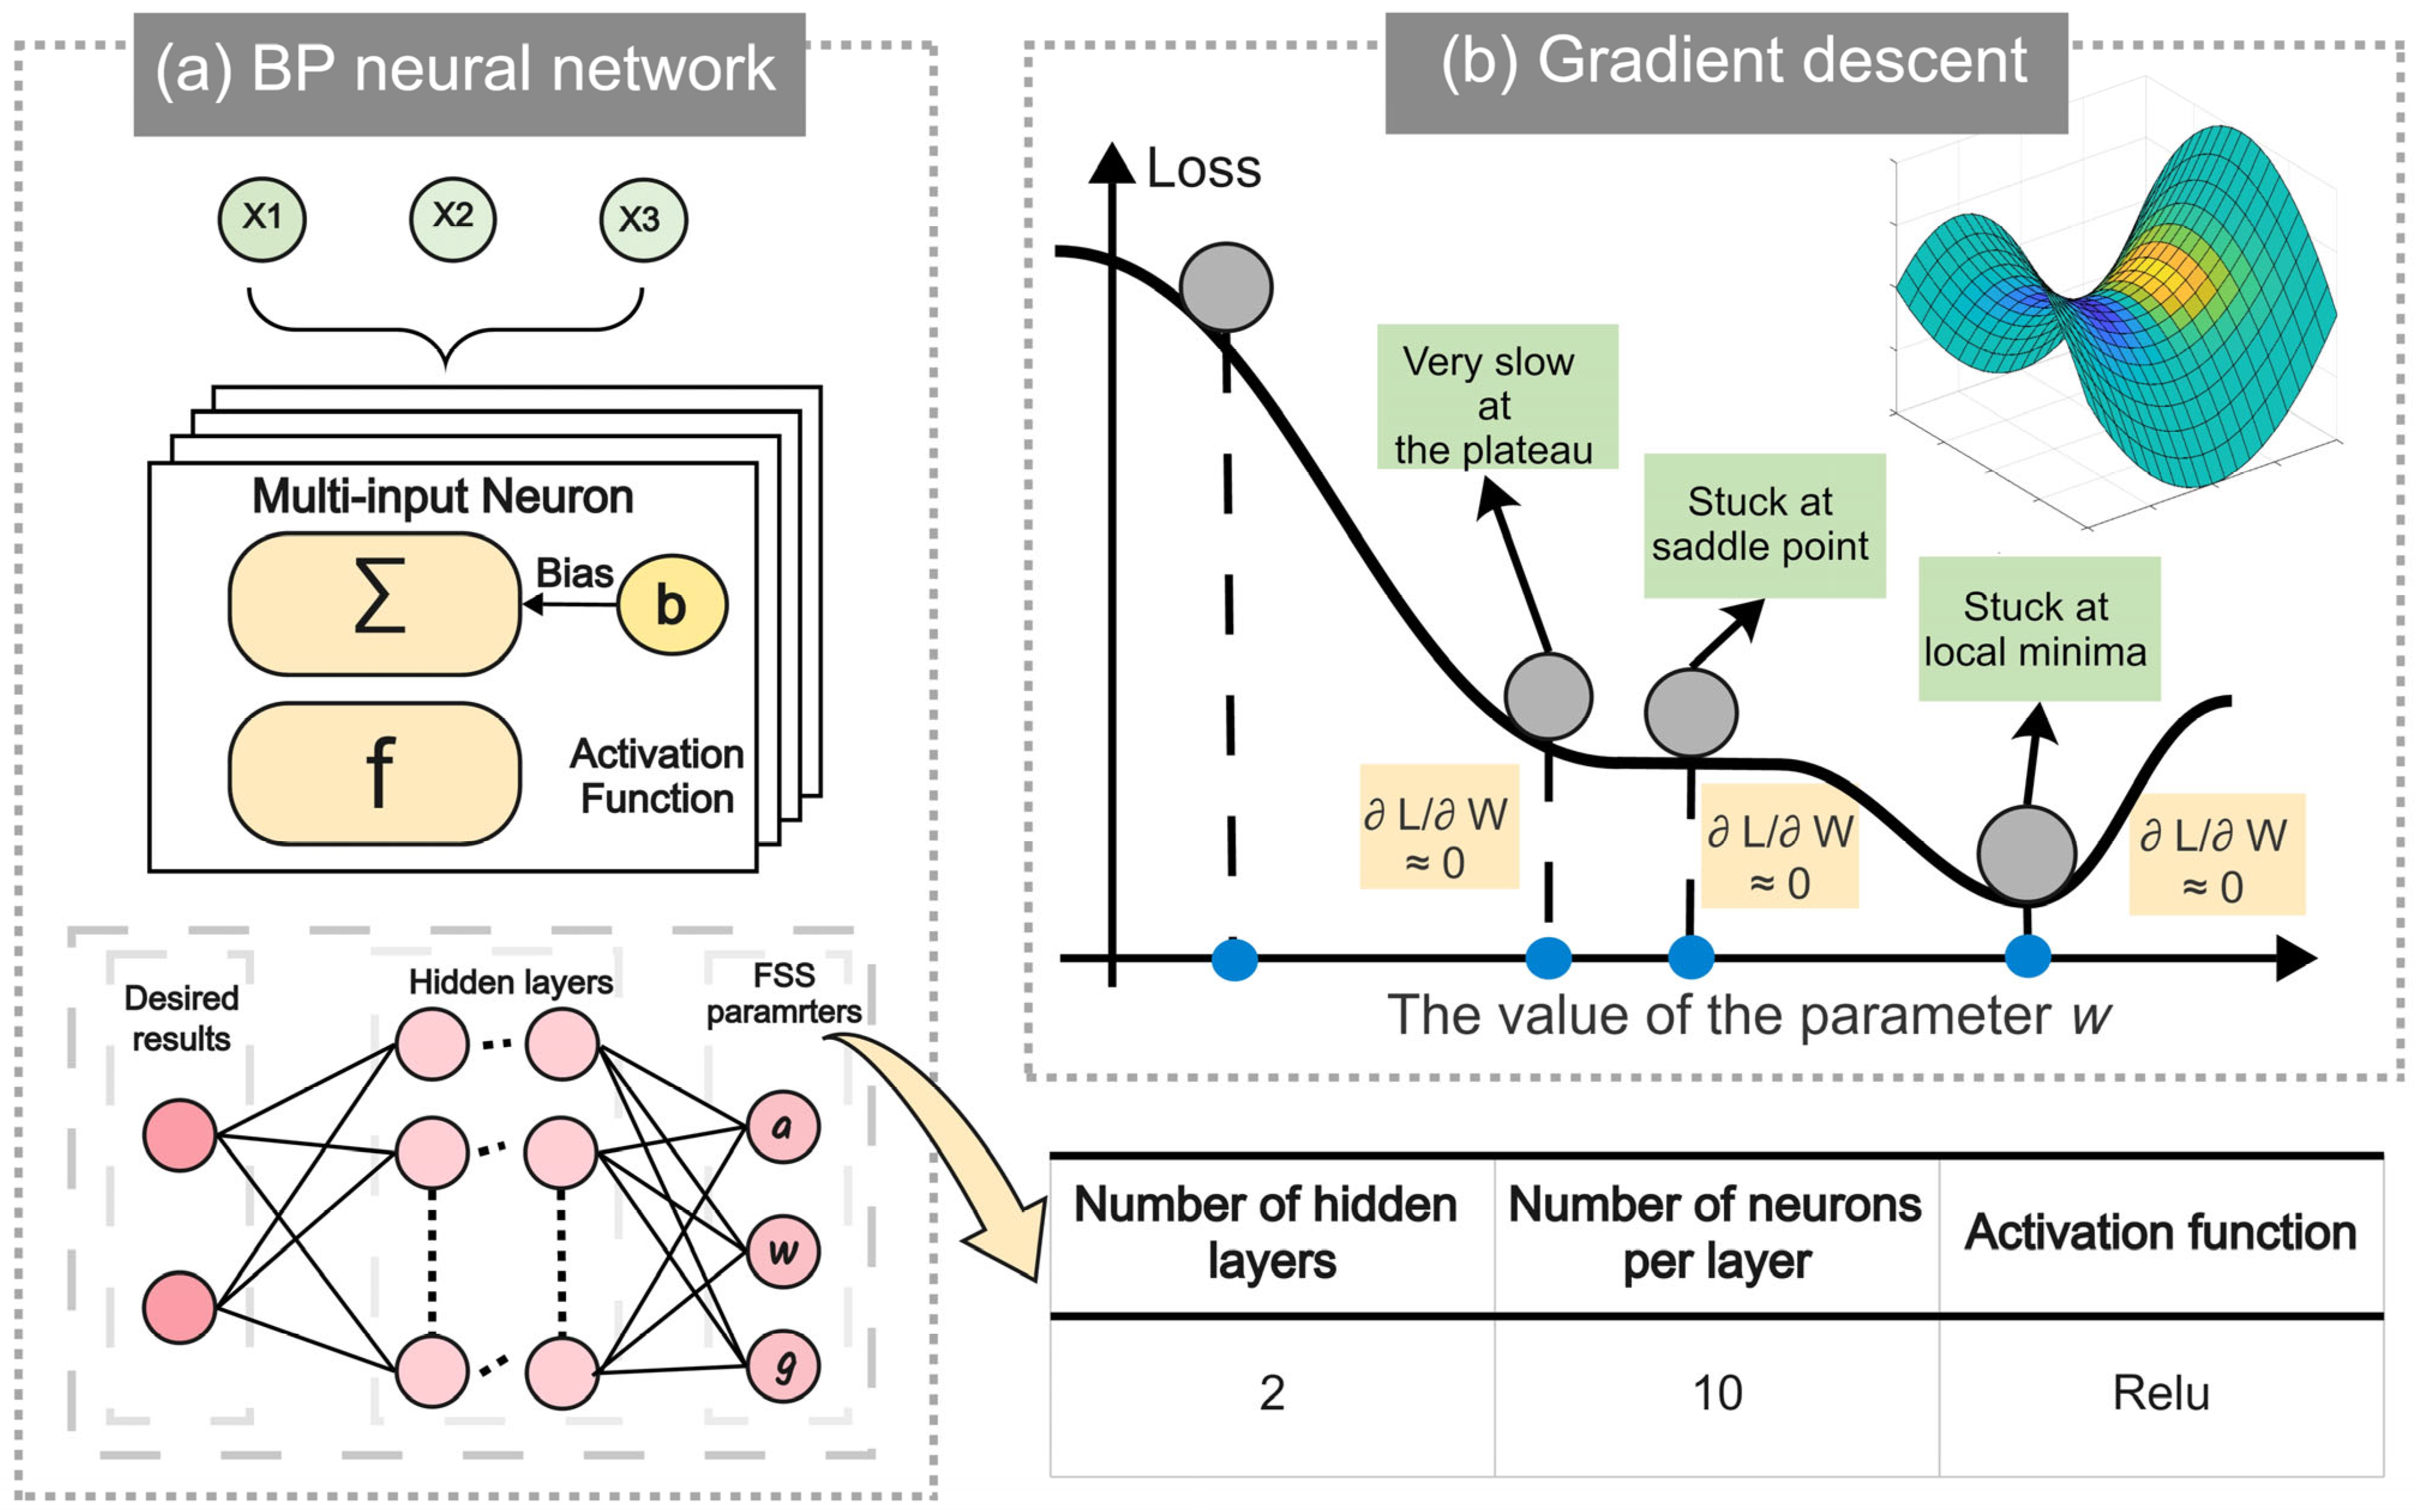
K values between 2024 and 2028, we employed a BP neural network to predict 2028 athlete numbers. This multi-layer perception utilizes error backpropagation and gradient descent optimization [
14], iteratively adjusting network weights to minimize mean squared error between predicted and actual outputs
Figure 7a.
After obtaining the total number of athletes participating in each country in 2028, we can determine the number of winners for each country in 2028 based on their strength coefficient. Finally, our ASI is defined as follows:
where
represents the total number of participants in the coming Olympics.
Because the Host effect has a significant impact on the total number of athletes participating in the competition in that country, in this neural network, we selected the year, the number of participants of a country, and whether it was a host country as input and output the total number of participants for each country in each Olympic Games.
The output form of this neural network is as follows:
where
X represents the matrix composed of the number of participating athletes and their corresponding years for all Olympic Games held before 2028,
W is the corresponding weight, and b is the bias,
Y is the output of the BP Neural Network, representing the total number of athletes participating in the 2028 Olympic Games.
The loss function is defined as follows:
We optimize network parameters (
W,
b) through gradient descent algorithms, iteratively updating along the negative gradient direction of the loss function to minimize prediction errors, thereby approximating neural network outputs to actual values. The iterative formula for parameter
W is as follows:
where
lr is called the learning rate [
14].
The schematic diagram of the gradient descent algorithm is shown in
Figure 7b. Along with the negative gradient direction, it can help the neural network quickly iterate and approach the ideal value, optimize the training path, and reduce training time [
15]. The optimal parameters of the neural network are shown in the table in
Figure 7.
2.3.4. Total Awards
Olympic medal totals vary across events, requiring predictive modeling of 2028 award quantities to analyze national medal distributions. This serves as a critical foundation for estimating future national medal allocations.
Given the evident upward trend in Olympic event data, we implemented the Augmented Dickey–Fuller (ADF) test to verify time series stationarity [
16]. This test assumes non-stationarity as the null hypothesis, examining whether statistical properties (mean, variance, autocorrelation) remain time-invariant to validate applicable modeling approaches.
The mathematical verification model of ADF is as follows:
where
represents the first difference in the number of medals in two adjacent years
,
representing the fixed level of the series,
is the trend term coefficient, indicating a linear trend over time,
is the critical coefficient for the lagged level term
,
is the coefficient for the lagged difference terms
(i = 1, 2, …,
p) added to eliminate autocorrelation in residuals,
is the lag order and
is the error term.
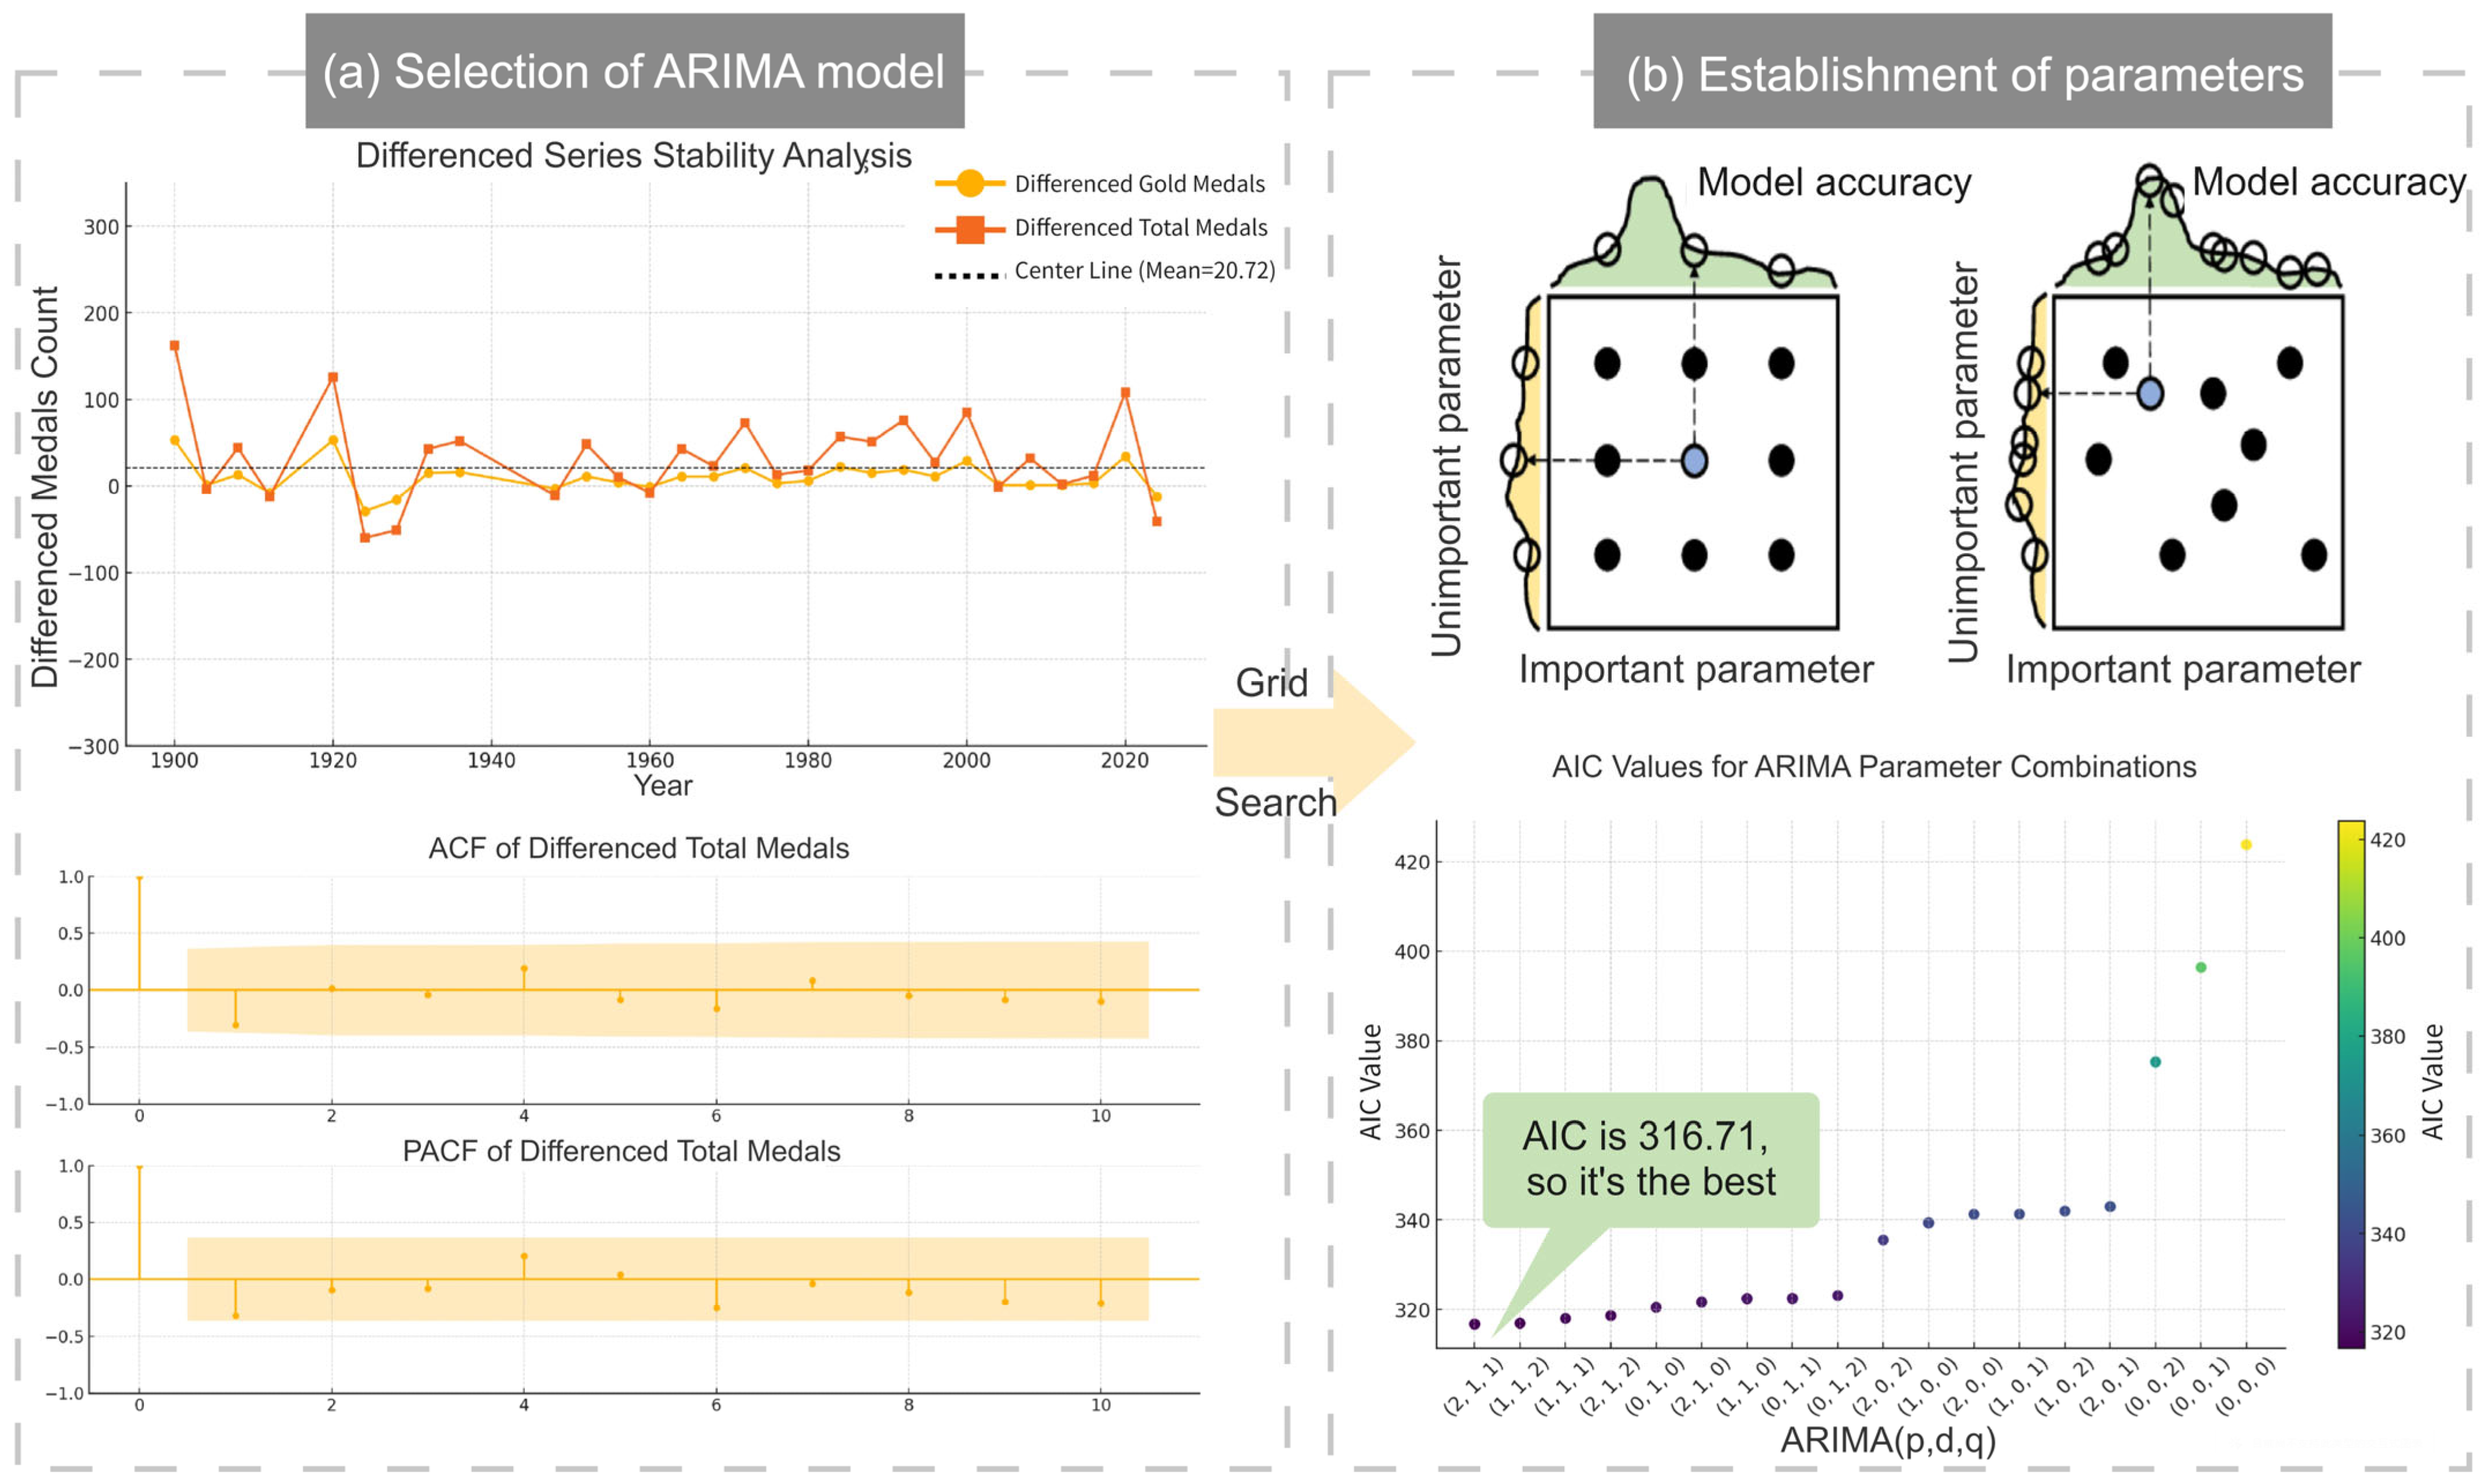
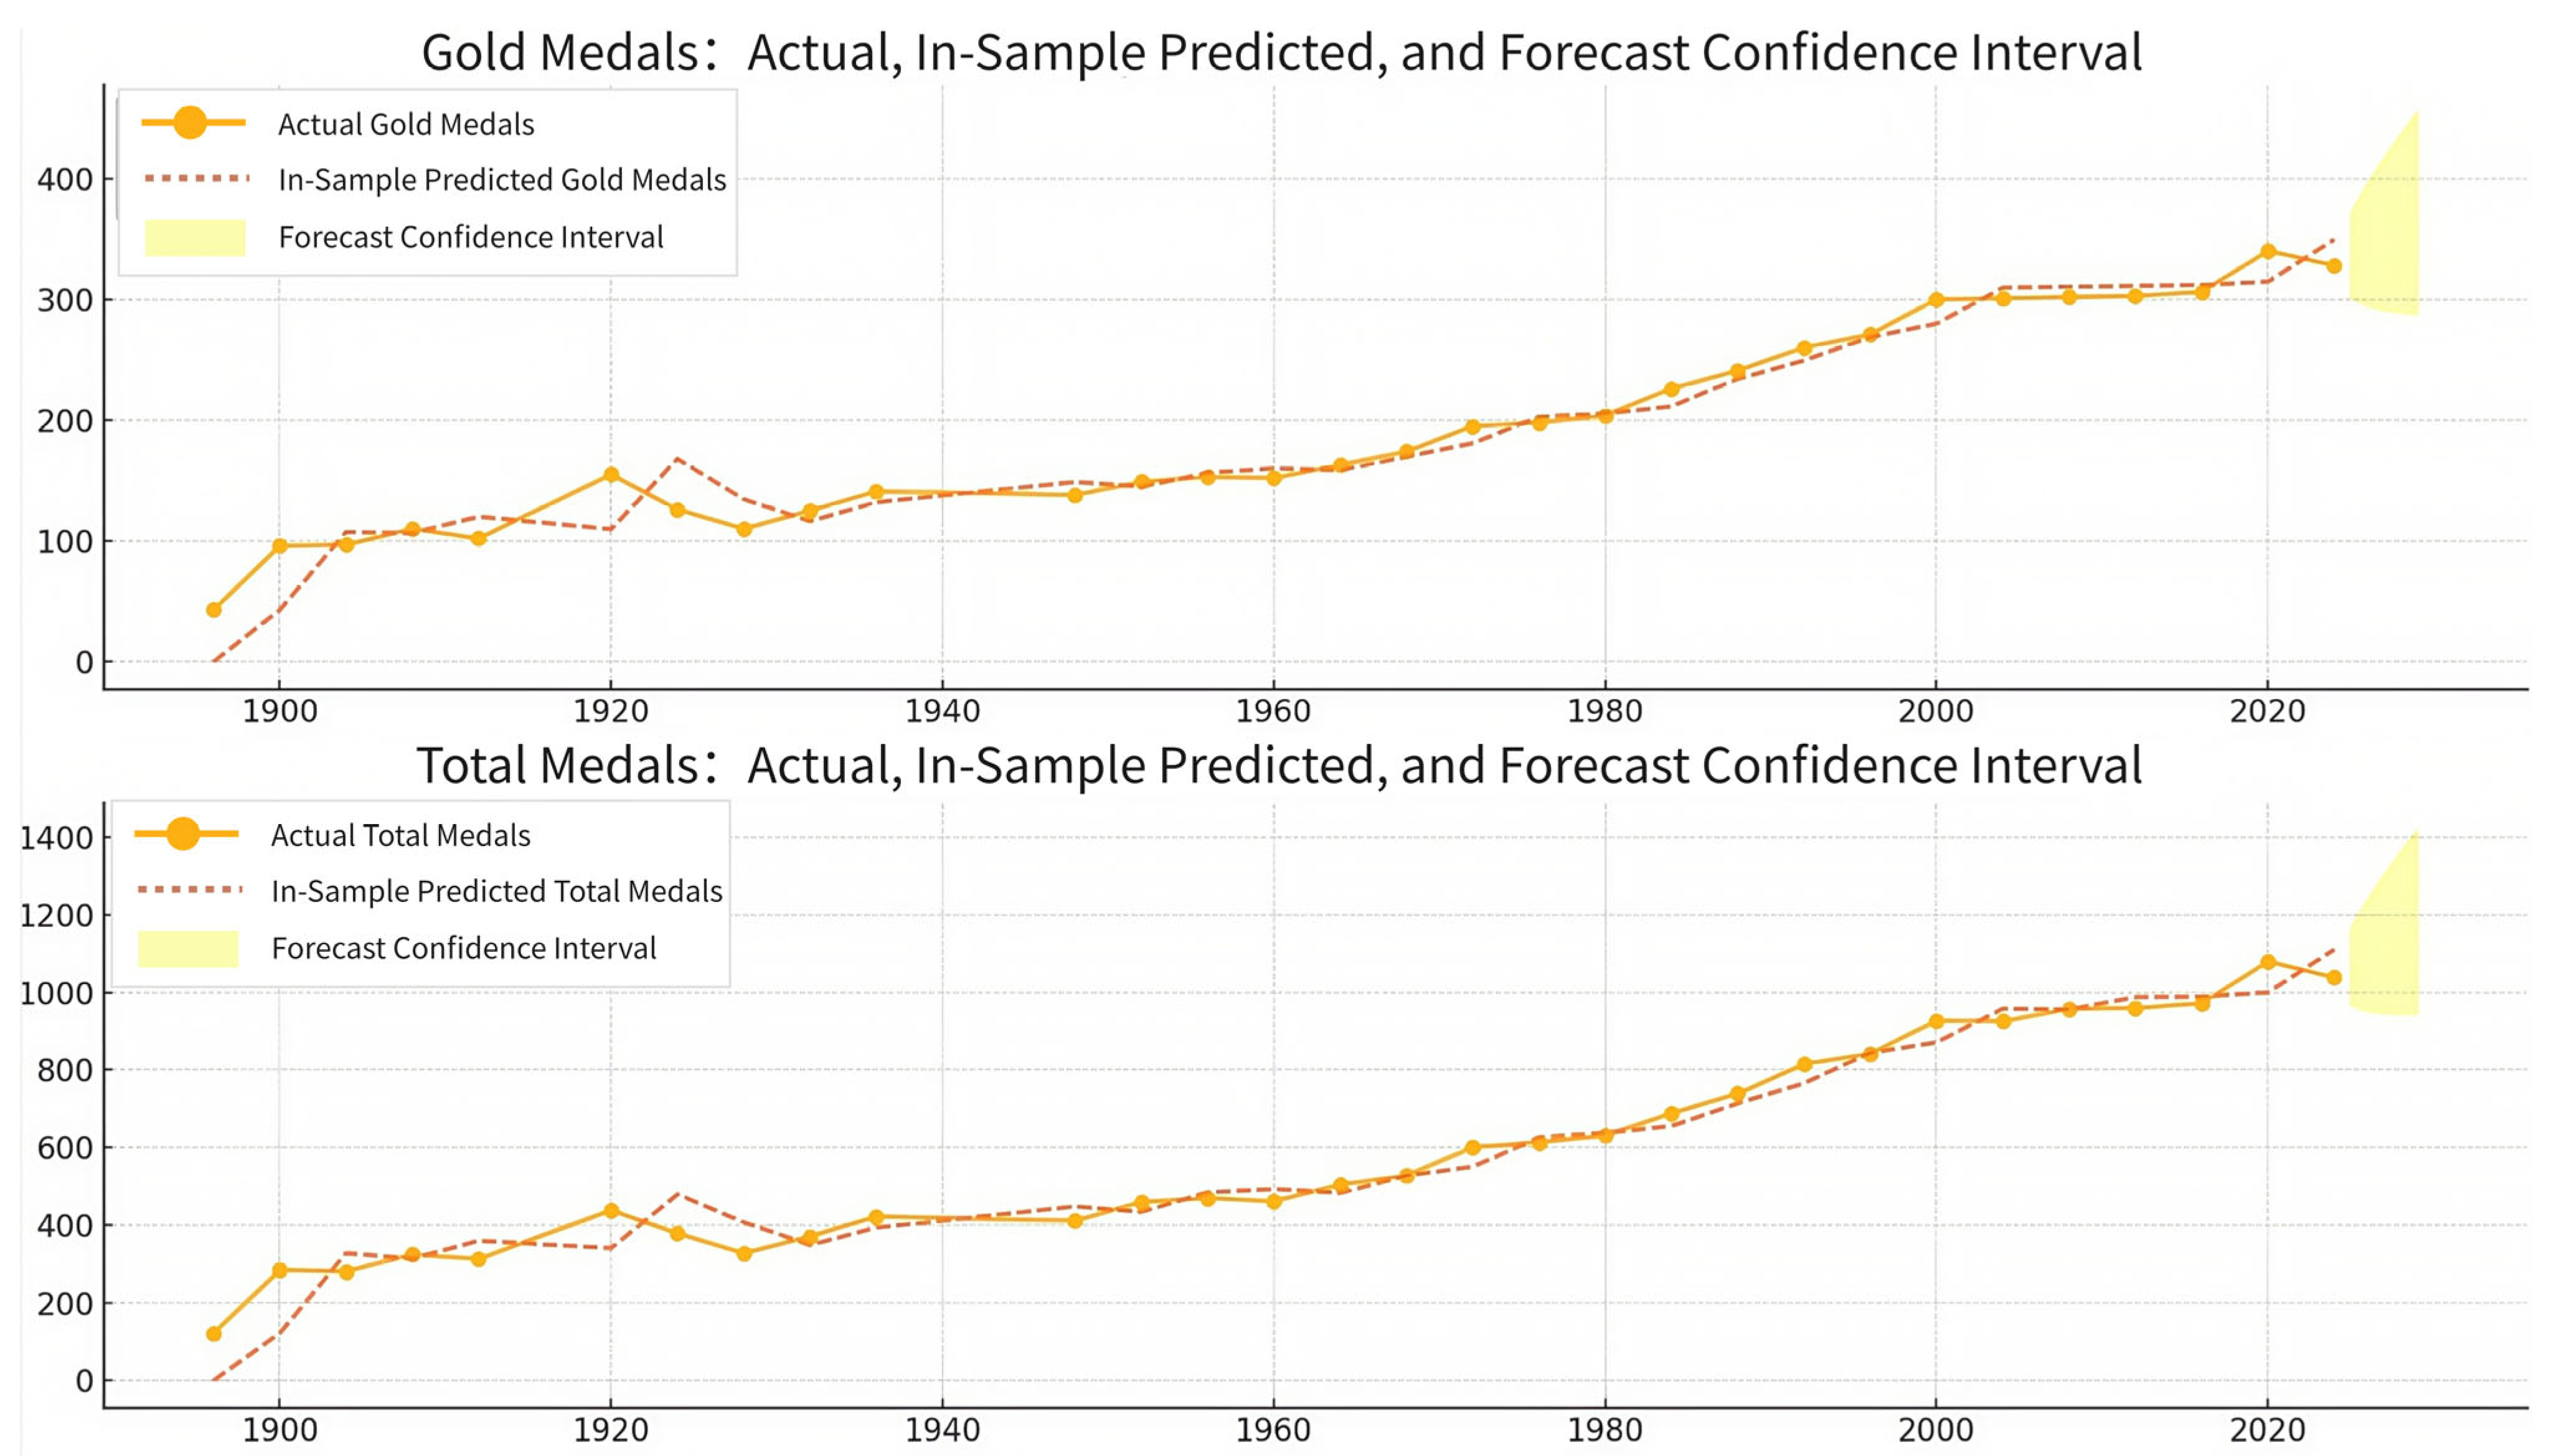
Based on the collected data, the p-values generated by the total number of medals and gold medals set for each year over time are 0.986 and 0.788, which cannot refute the null hypothesis (p > 0.05) and indicate that the data is non-stationary.
Addressing non-stationarity through first-order differencing (shown in
Figure 8), we obtained stationary data confirmed by ADF tests with
p-values 1.86 × 10
−12 and 6.25 × 10
−12 (both <0.05). This enabled ARIMA modeling, which effectively captures temporal patterns and seasonal variations. The model demonstrated strong performance in historical data validation, supporting its reliability for short-term Olympic medal predictions. Subsequent analysis details the ARIMA formulation [
16]:
where
represents the coefficients of the autoregressive (AR) component, which quantify the weighting influence of historical medal counts
on the current value;
denotes the coefficients of the moving average (MA) component, consisting of q parameters in
, which describes the linear combination of past error terms
on the current value;
L is the lag operator used to shift the time series backward by specific intervals;
is the observed value of the number of medals at time
t;
represents the white noise error term, following an independent distribution with zero mean, constant variance, and no autocorrelation;
d indicates the differencing order, which stabilizes the original series through
d order differencing; and
is the constant term reflecting the long-term trend or intercept shift in the amount of medals.
The ARIMA model, combining differencing, auto-regressive (AR), and moving average (MA) components [
16], was validated through ACF/PACF analysis (
Figure 8a), with grid search optimization identifying ARIMA(2,1,1) as the optimal configuration (lowest AIC = 316.71).
2.3.5. “Dark Horse” Effect
Logistic regression, a probabilistic classification method ideal for binary outcomes [
17], is suitable for predicting first-time medal-winning nations. To forecast 2028 debutants, we identify persistent non-medaling participants and extract critical predictors: historical medal counts, event diversity metrics, host-nation advantage, and Olympic participation frequency [
10]. Precise feature engineering ensures model accuracy by quantifying factors influencing medal attainment thresholds [
17].
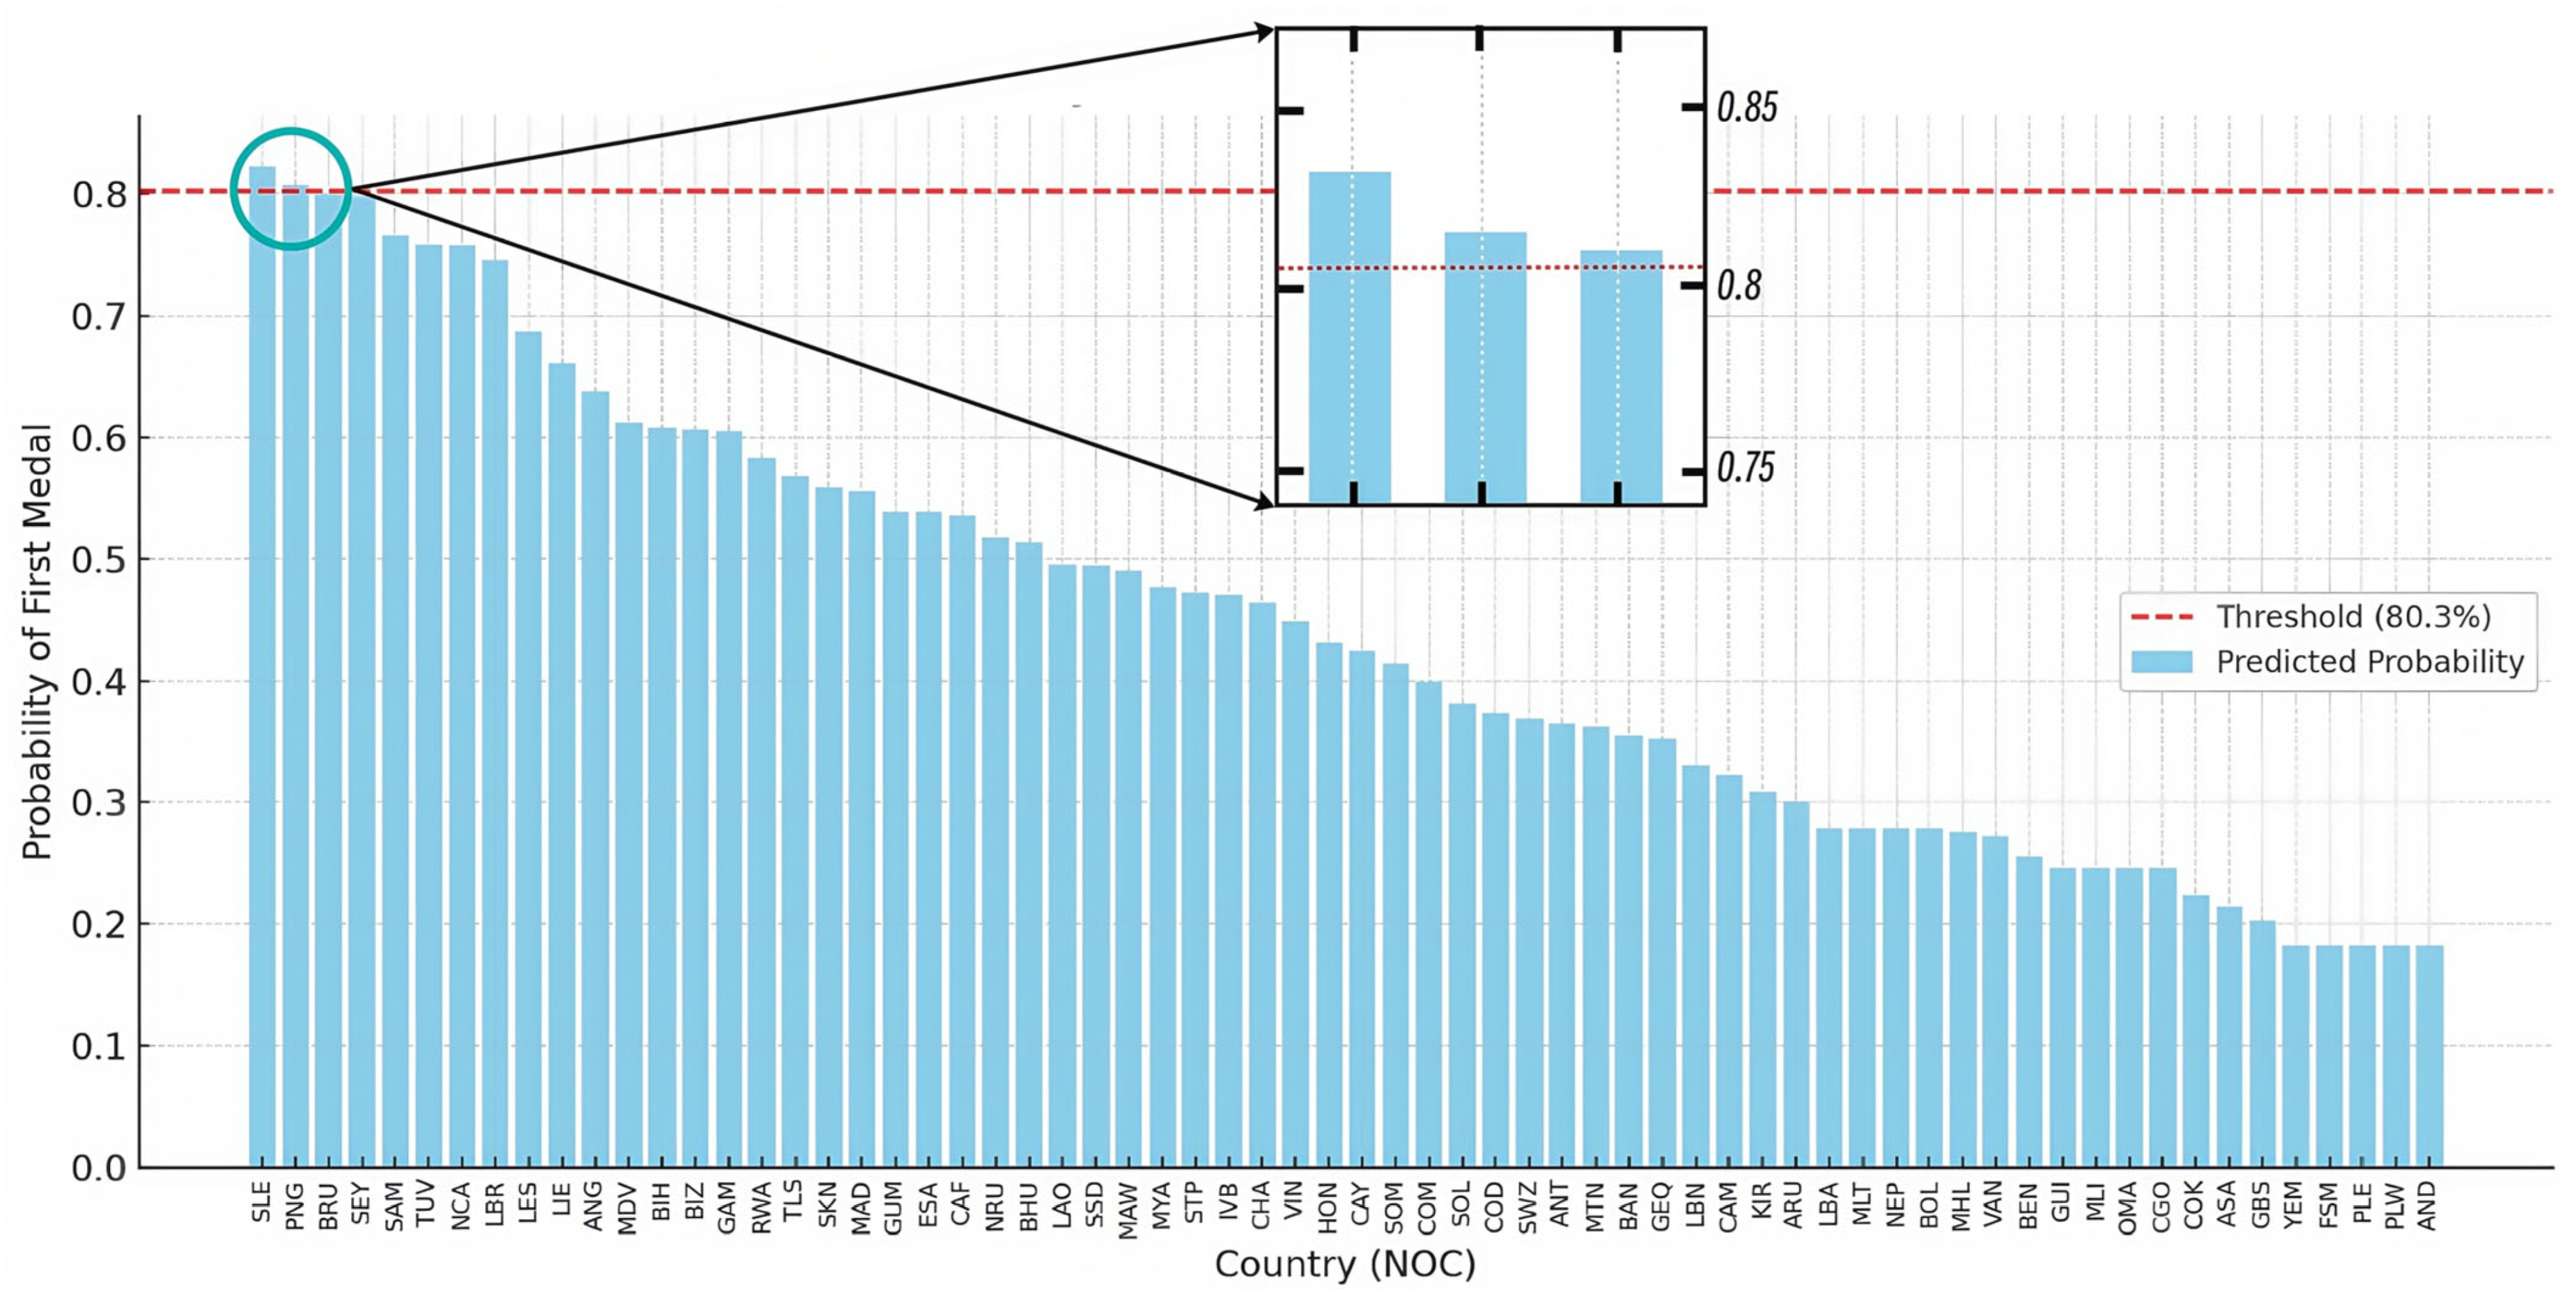
Logistic regression identifies historically medal-less nations with breakthrough potential (“Dark Horse”) by analyzing socioeconomic, athletic, and geopolitical predictors, achieving high predictive accuracy (AUC = 0.94) for unexpected Olympic success.
We chose logistic regression to construct a probability prediction model for predicting how many countries will win medals for the first time in 2028, and to calculate the probability of a country winning medals for the first time in 2028, denoted as
, where
represents whether a country will win its first medal. And the formula is as follows [
17]:
where
is the selected corresponding prediction features, which include historical medal counts, event diversity metrics, host-nation advantage, and Olympic participation frequency, and
is the weight of these features, and
α is a bias that ensures the probability is between 0 to 1.
2.3.6. “Great Coach” Effect
The “Great Coach” effect significantly influences athletic performance through coaches’ expertise in developing tailored training regimens, enhancing team cohesion, and maximizing athlete potential [
18]. Coaches’ technical proficiency, leadership effectiveness, and communication capabilities directly determine competitive outcomes. Transnational coaching mobility across nations introduces variability in evaluating countries’ future sporting success, as elite coaches frequently shift affiliations between Olympic cycles.
Here, random forest regression is used to quantify the nonlinear “Great Coach” effect, such as the U.S. women’s volleyball team’s performance under elite coaching, revealing how coaching resources enhance both sport-specific dominance (e.g., skill transfer to related disciplines) and overall medal outcomes.
According to the related hypothesis that the “Great Coach” effect mainly changes the overall medal performance by influencing the number and composition of medals in specific events [
18], if the impact of the number and composition of medals in a specific event on overall medal performance can be explained, it can prove the existence of the “Great Coach” effect.
To illustrate the impact of the number and composition of medals in specific events on global medal performance, taking the women’s volleyball event in the United States as an example, we used a random forest regression model to output a nonlinear mapping function curve of the total number of medals in the United States by taking the award situation of women’s volleyball indoor events as input [
10].
Next, we measured the relative contribution of each variable to the prediction results by calculating the importance of the features. Using random forest regression to optimize the features of the model by minimizing mean square error (MSE), the calculation method for the importance of the features is as follows [
19]:
where
Imp represents the importance of one factor,
CF represents reduction in MSE of certain feature, and
AF represents reduction in MSE of all features.
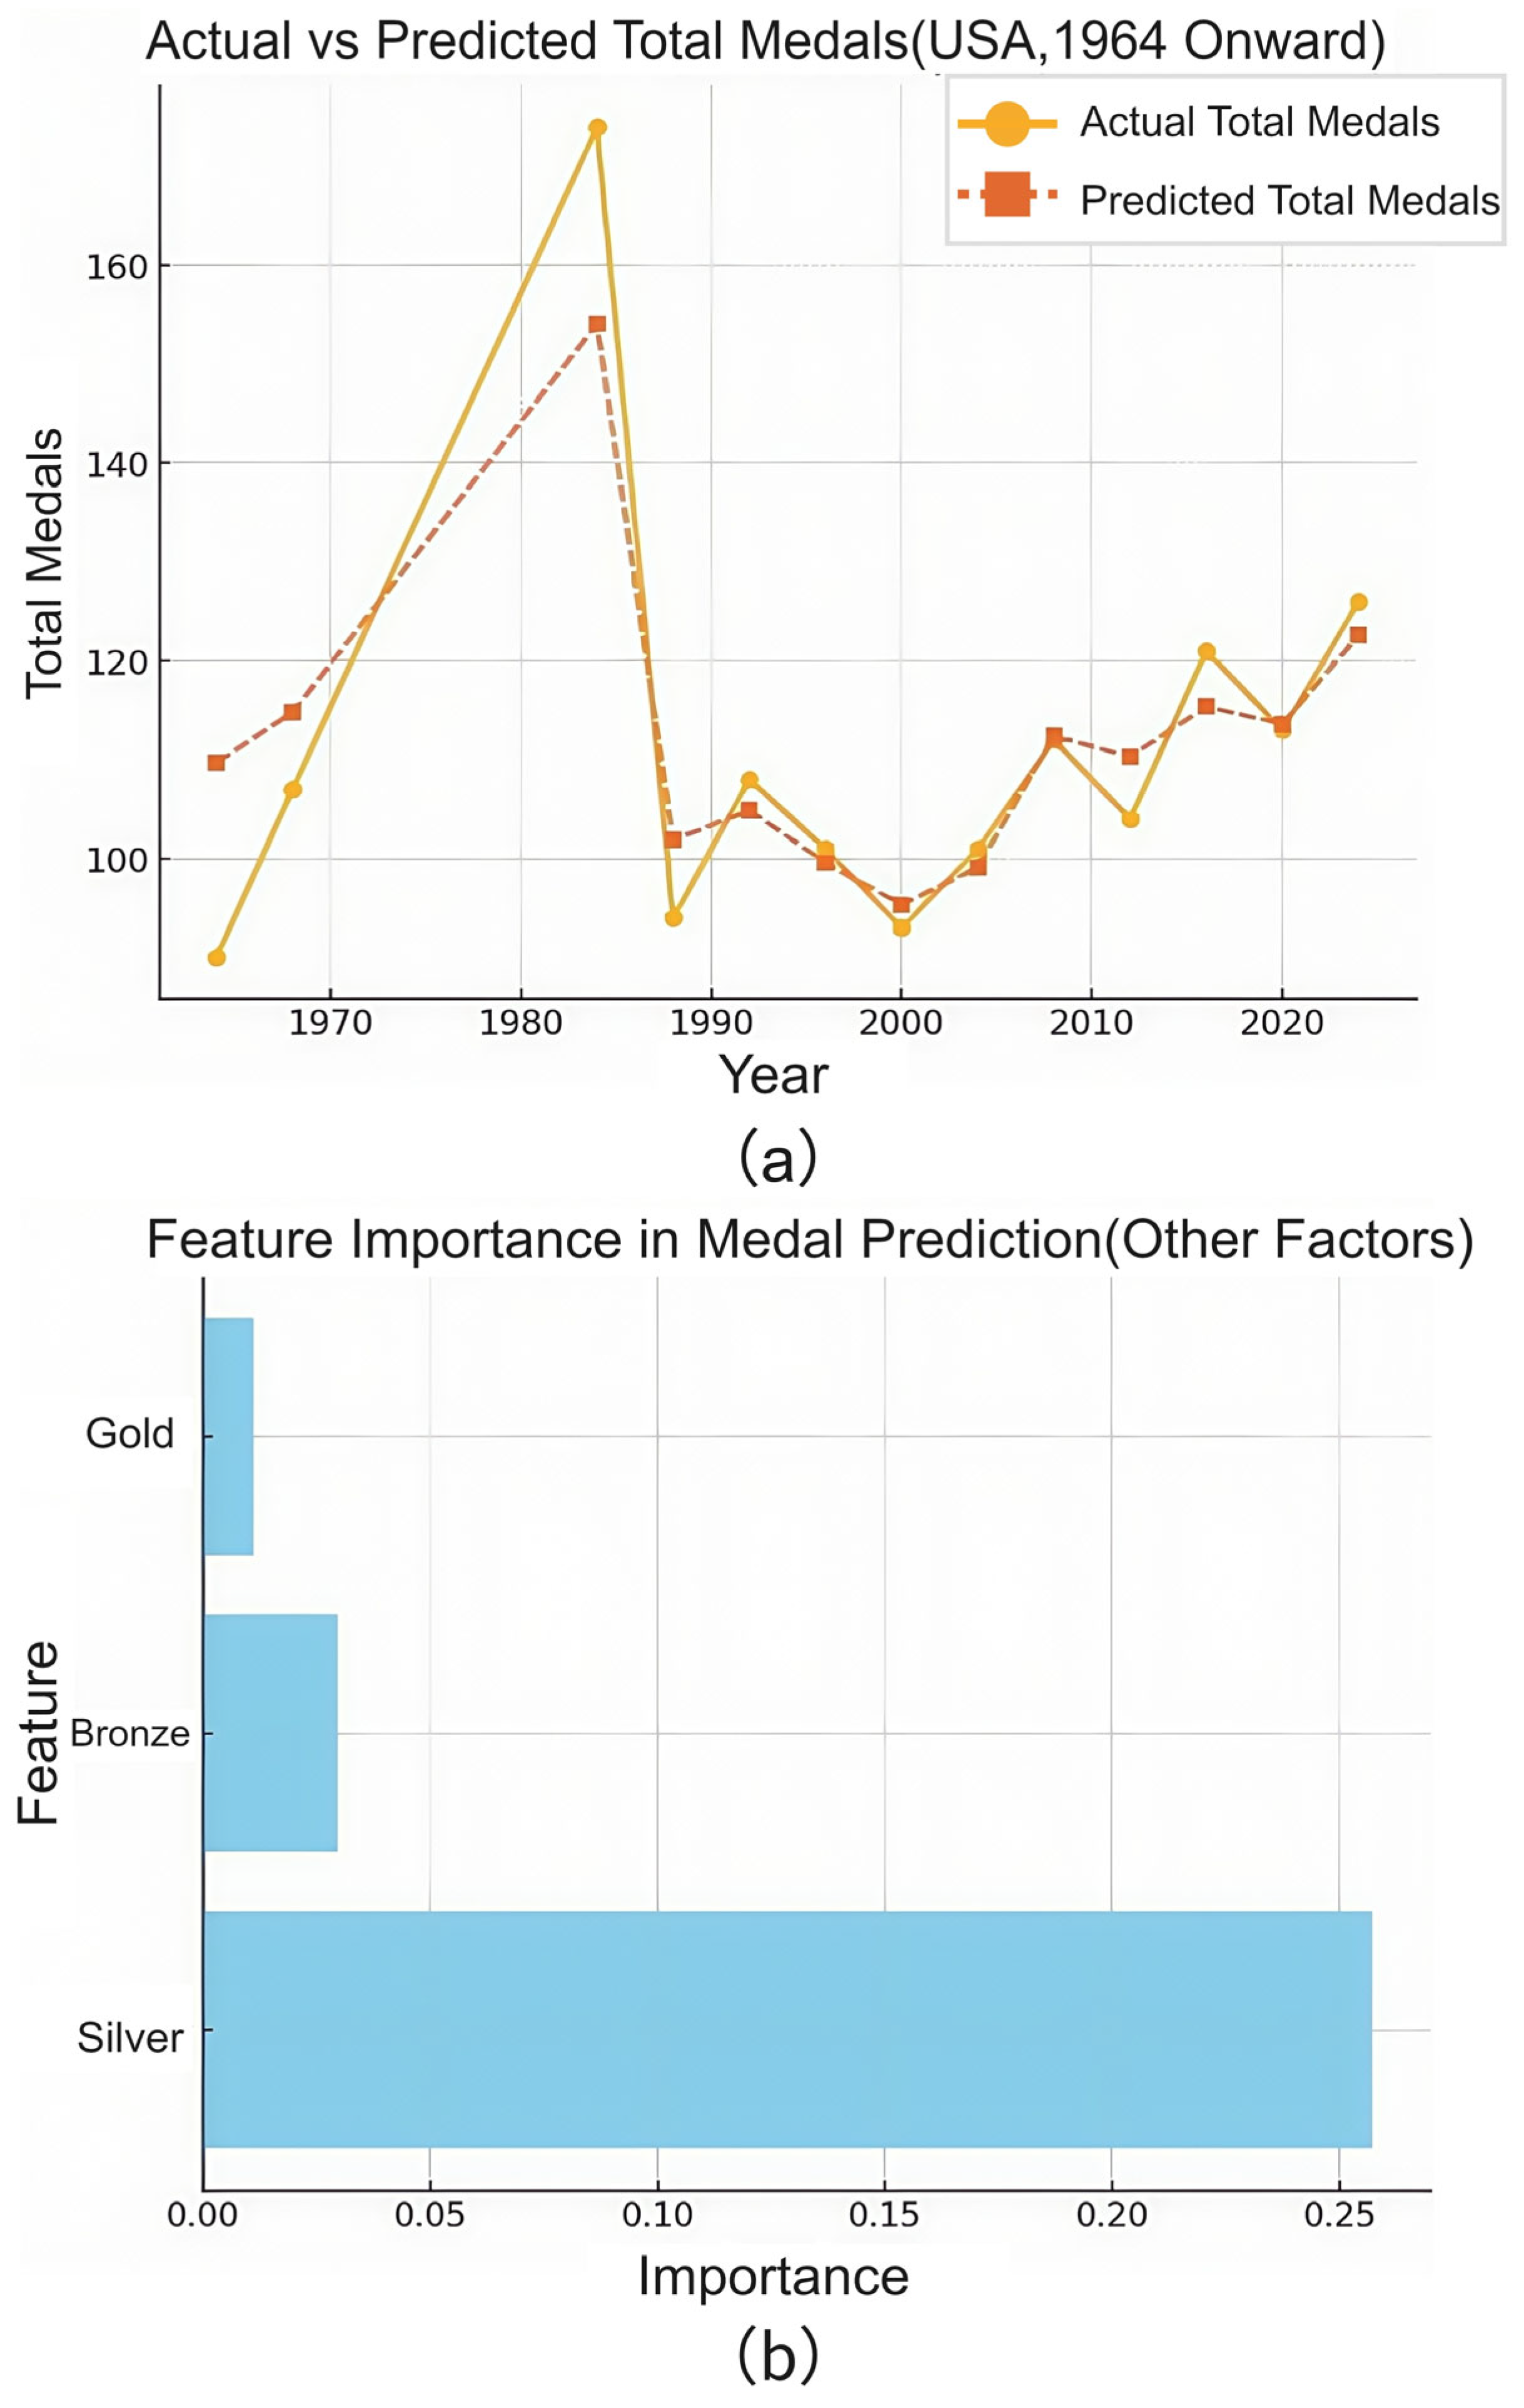
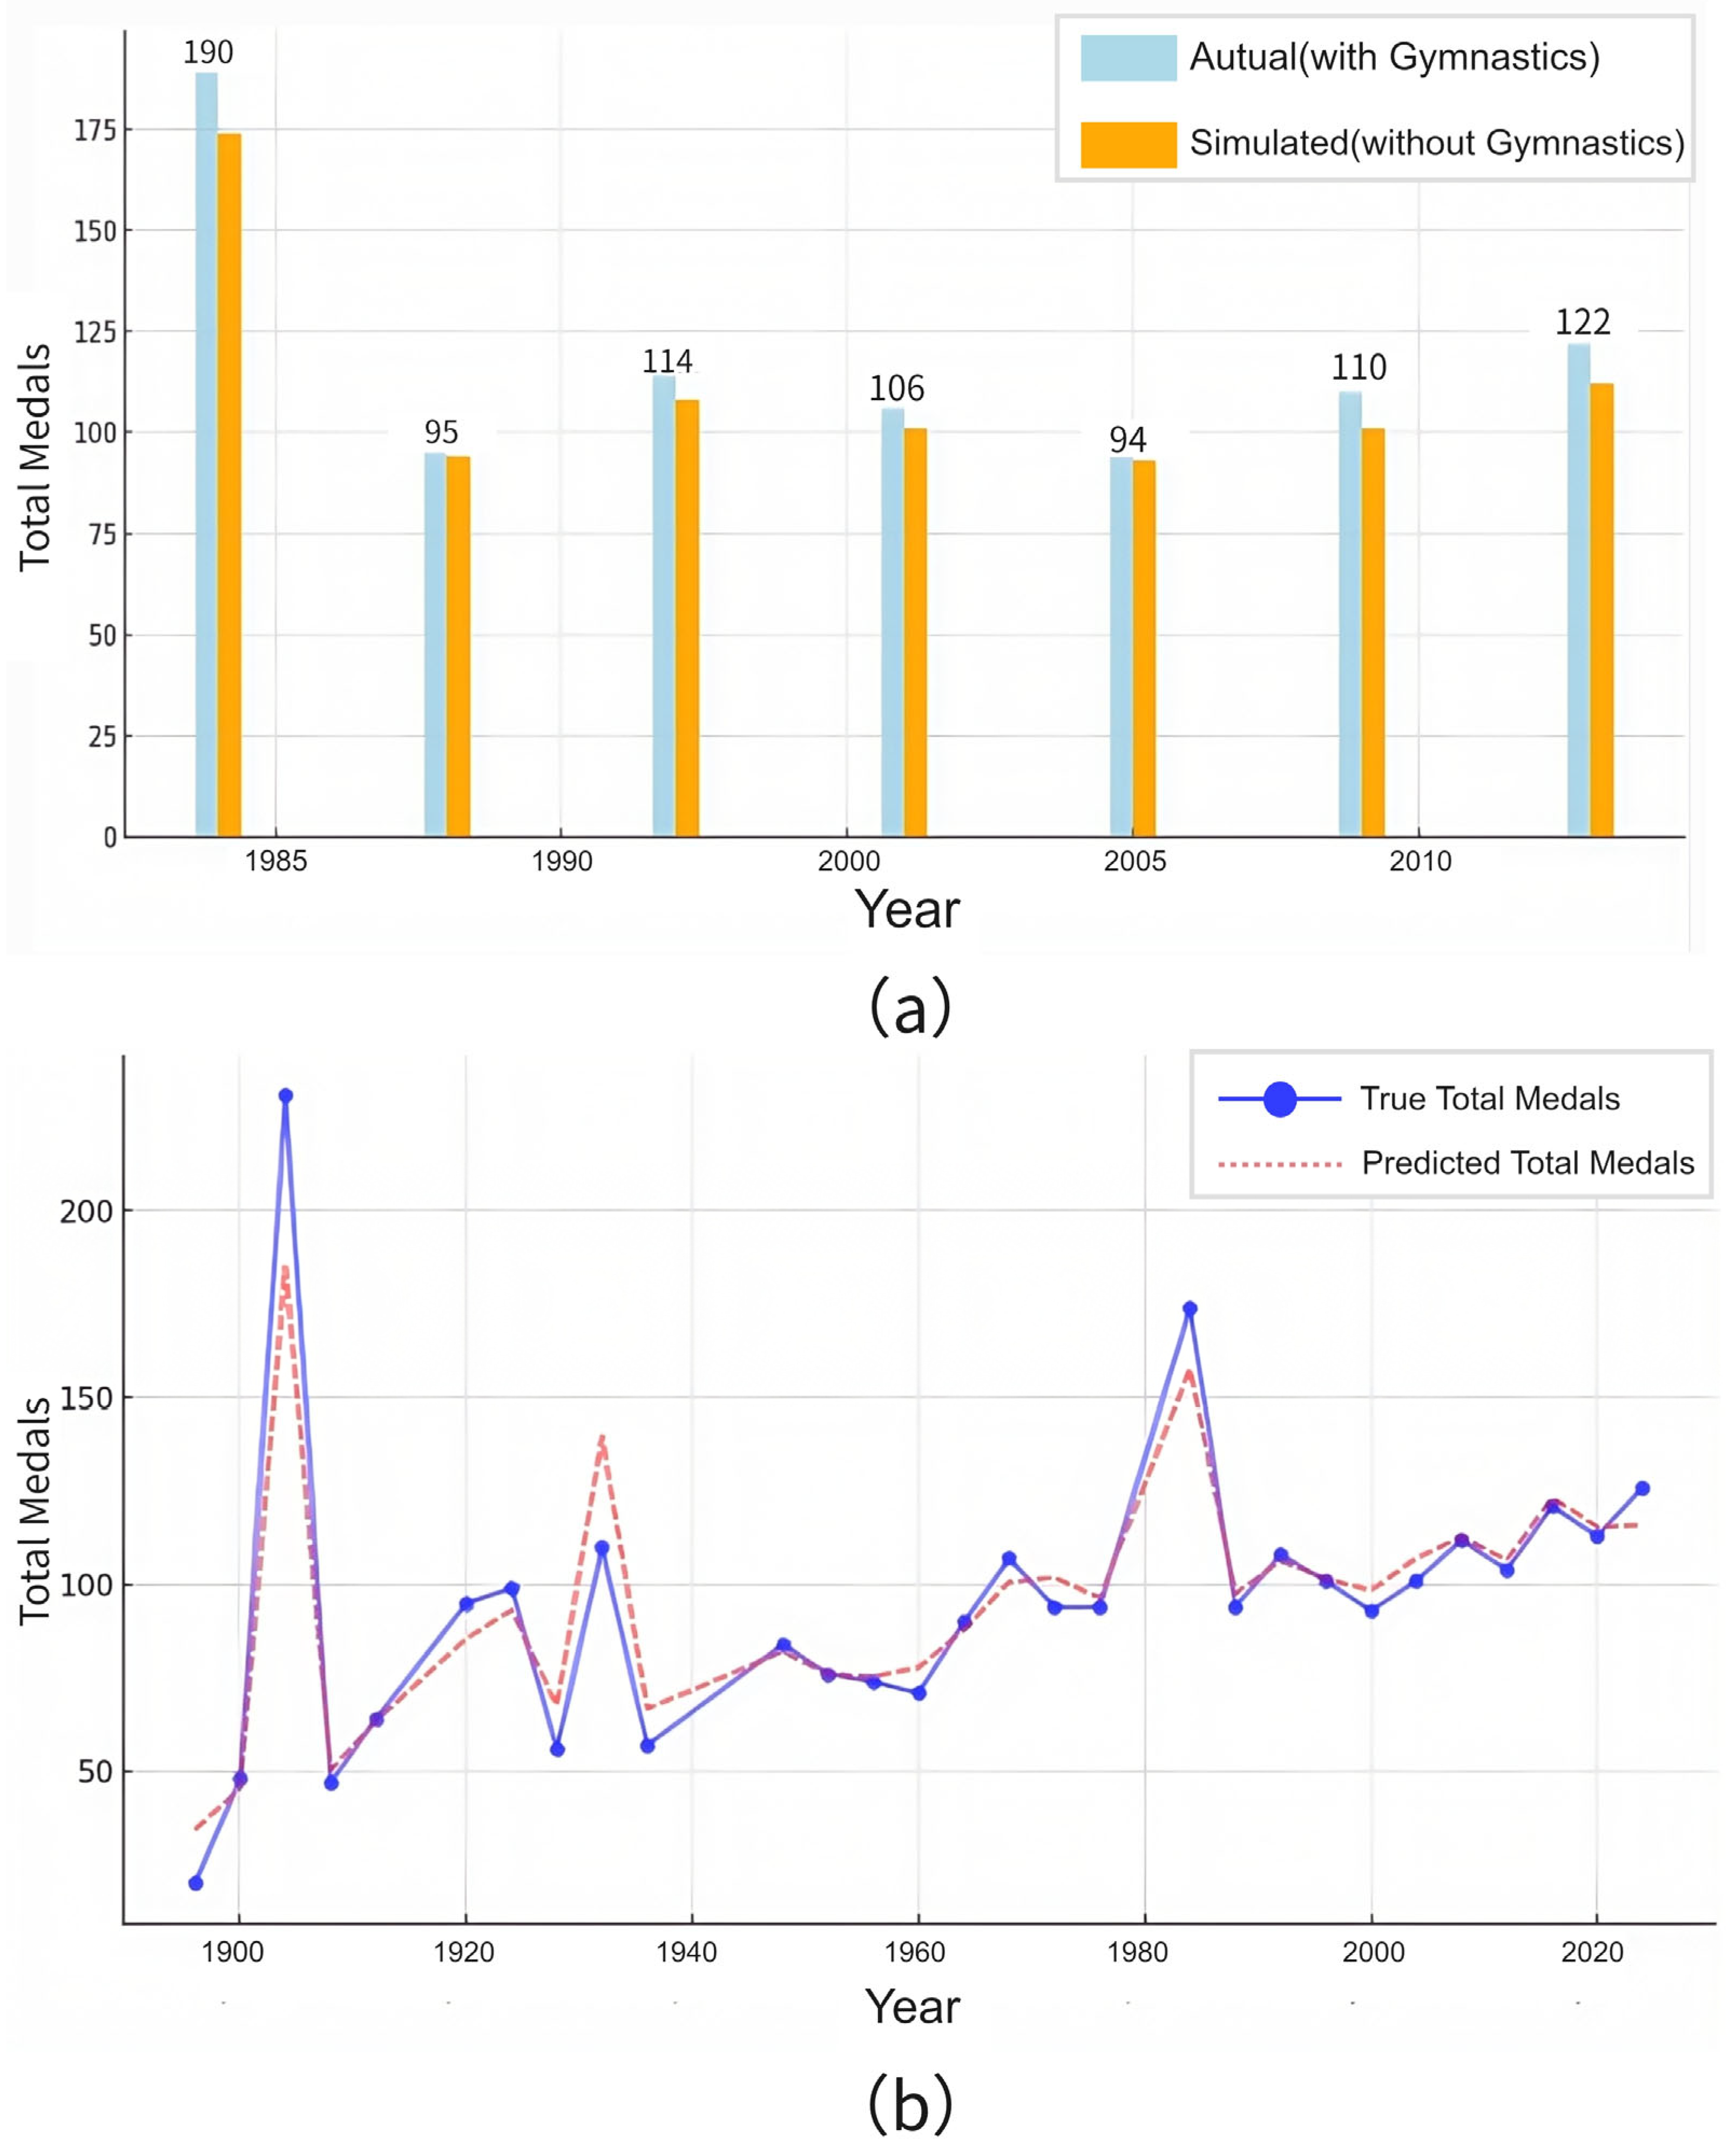
Plotting the calculation results into a bar chart, as shown in
Figure 9, the importance of the winning situation of the US indoor women’s volleyball team to the regression results is not zero, which reflects its certain impact on the changes in the total number of medals won by the United States.
This proves that the number of medals in a specific event does indeed have an impact on the overall medal performance. According to the hypothesis, this proves the “Great Coach” effect.
4. Model Validation
4.1. Error Analysis
To evaluate the effectiveness of the model we established and estimate its accuracy, we used data from 2020 and earlier to predict the medal table for 2024 and compared the actual values with the predicted values. The predicted and compared results are shown in
Table 2.
Based on the values given in the table, we can conclude that although there are some differences and fluctuations between the predicted values and the actual values, the overall quantity still tends to be close to the actual values, indicating that our model accuracy meets the requirements. Next, we quantify this uncertainty by calculating the root mean square error of the predicted gold medals and total medals [
20]. Based on:
where
Di represents Diff
2024gold or Diff
2024total of different countries, n represents the number of countries in the table.
where
δ represents the mean relative error,
Ti represents the actual number of medals (or gold medals) won by each country.
We can calculate the RMSE of the predicted gold medals and total medals were 3.21 and 4.32, respectively. The calculated MRE of the predicted gold medals and total medals was 17.6% and 8.04%, respectively. Our model’s prediction of gold medals deviates from the ideal value by an average of about 3 medals, and our model’s prediction of the total number of medals deviates from the ideal value by an average of about 4 medals.
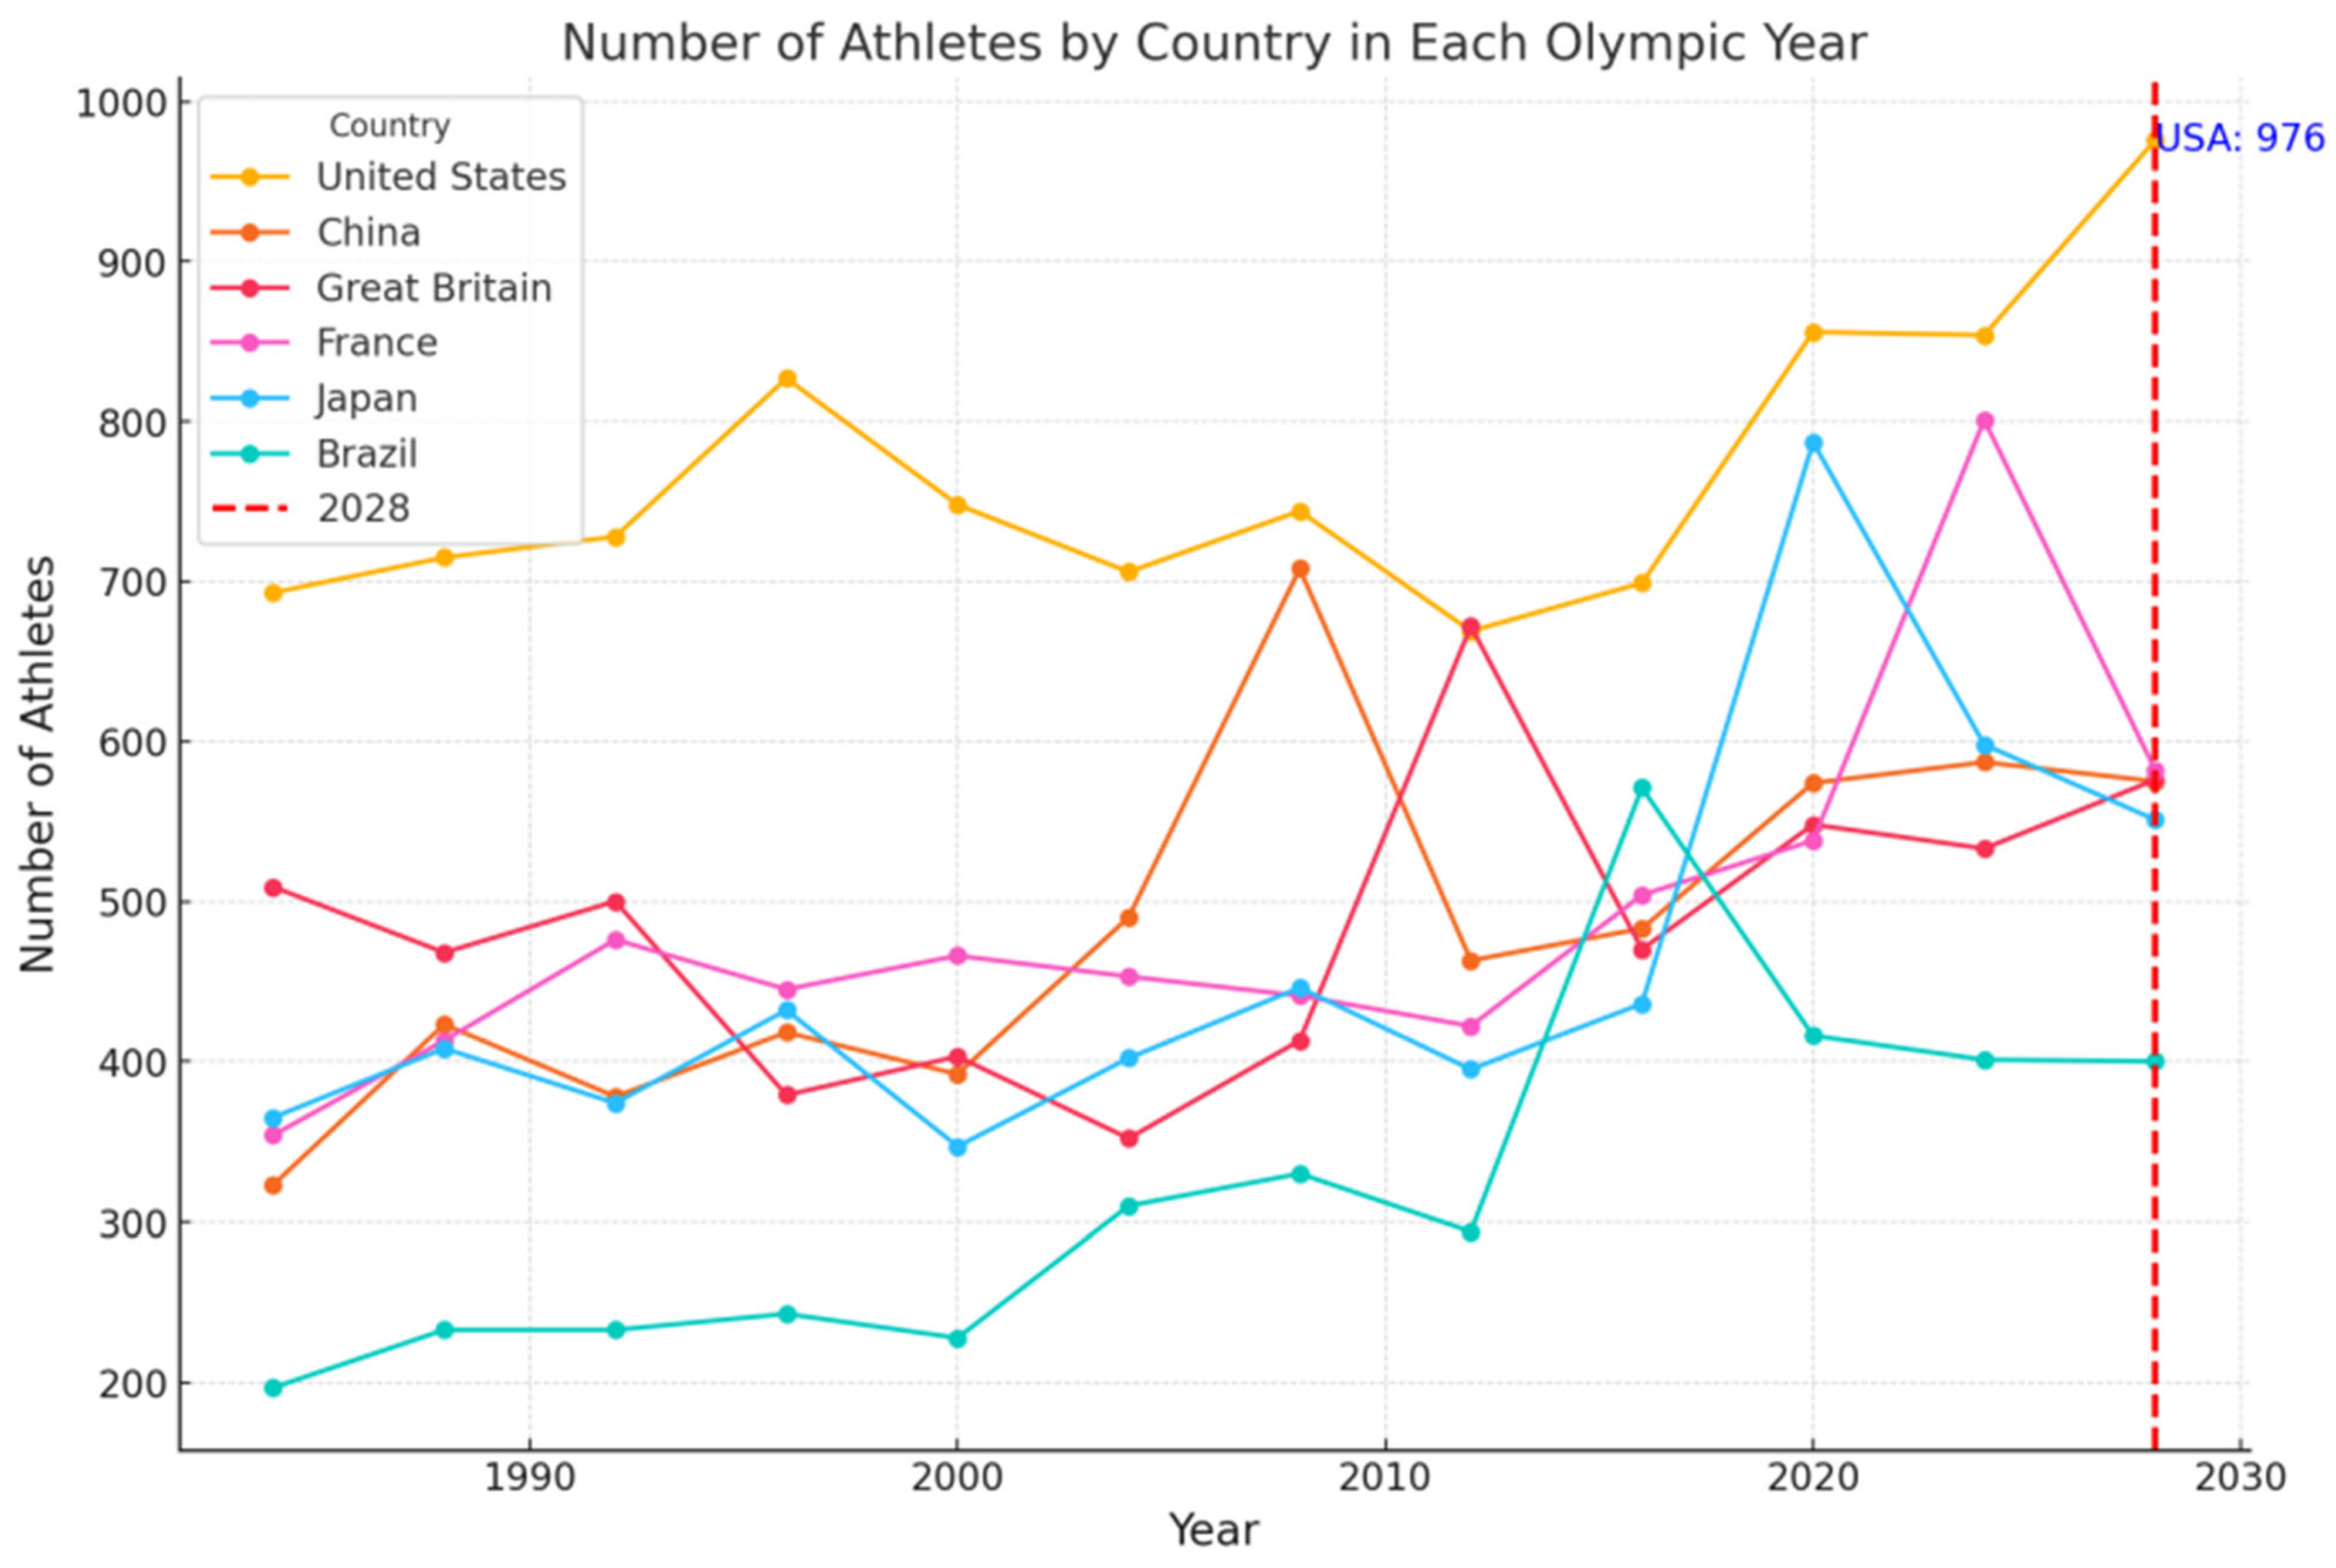
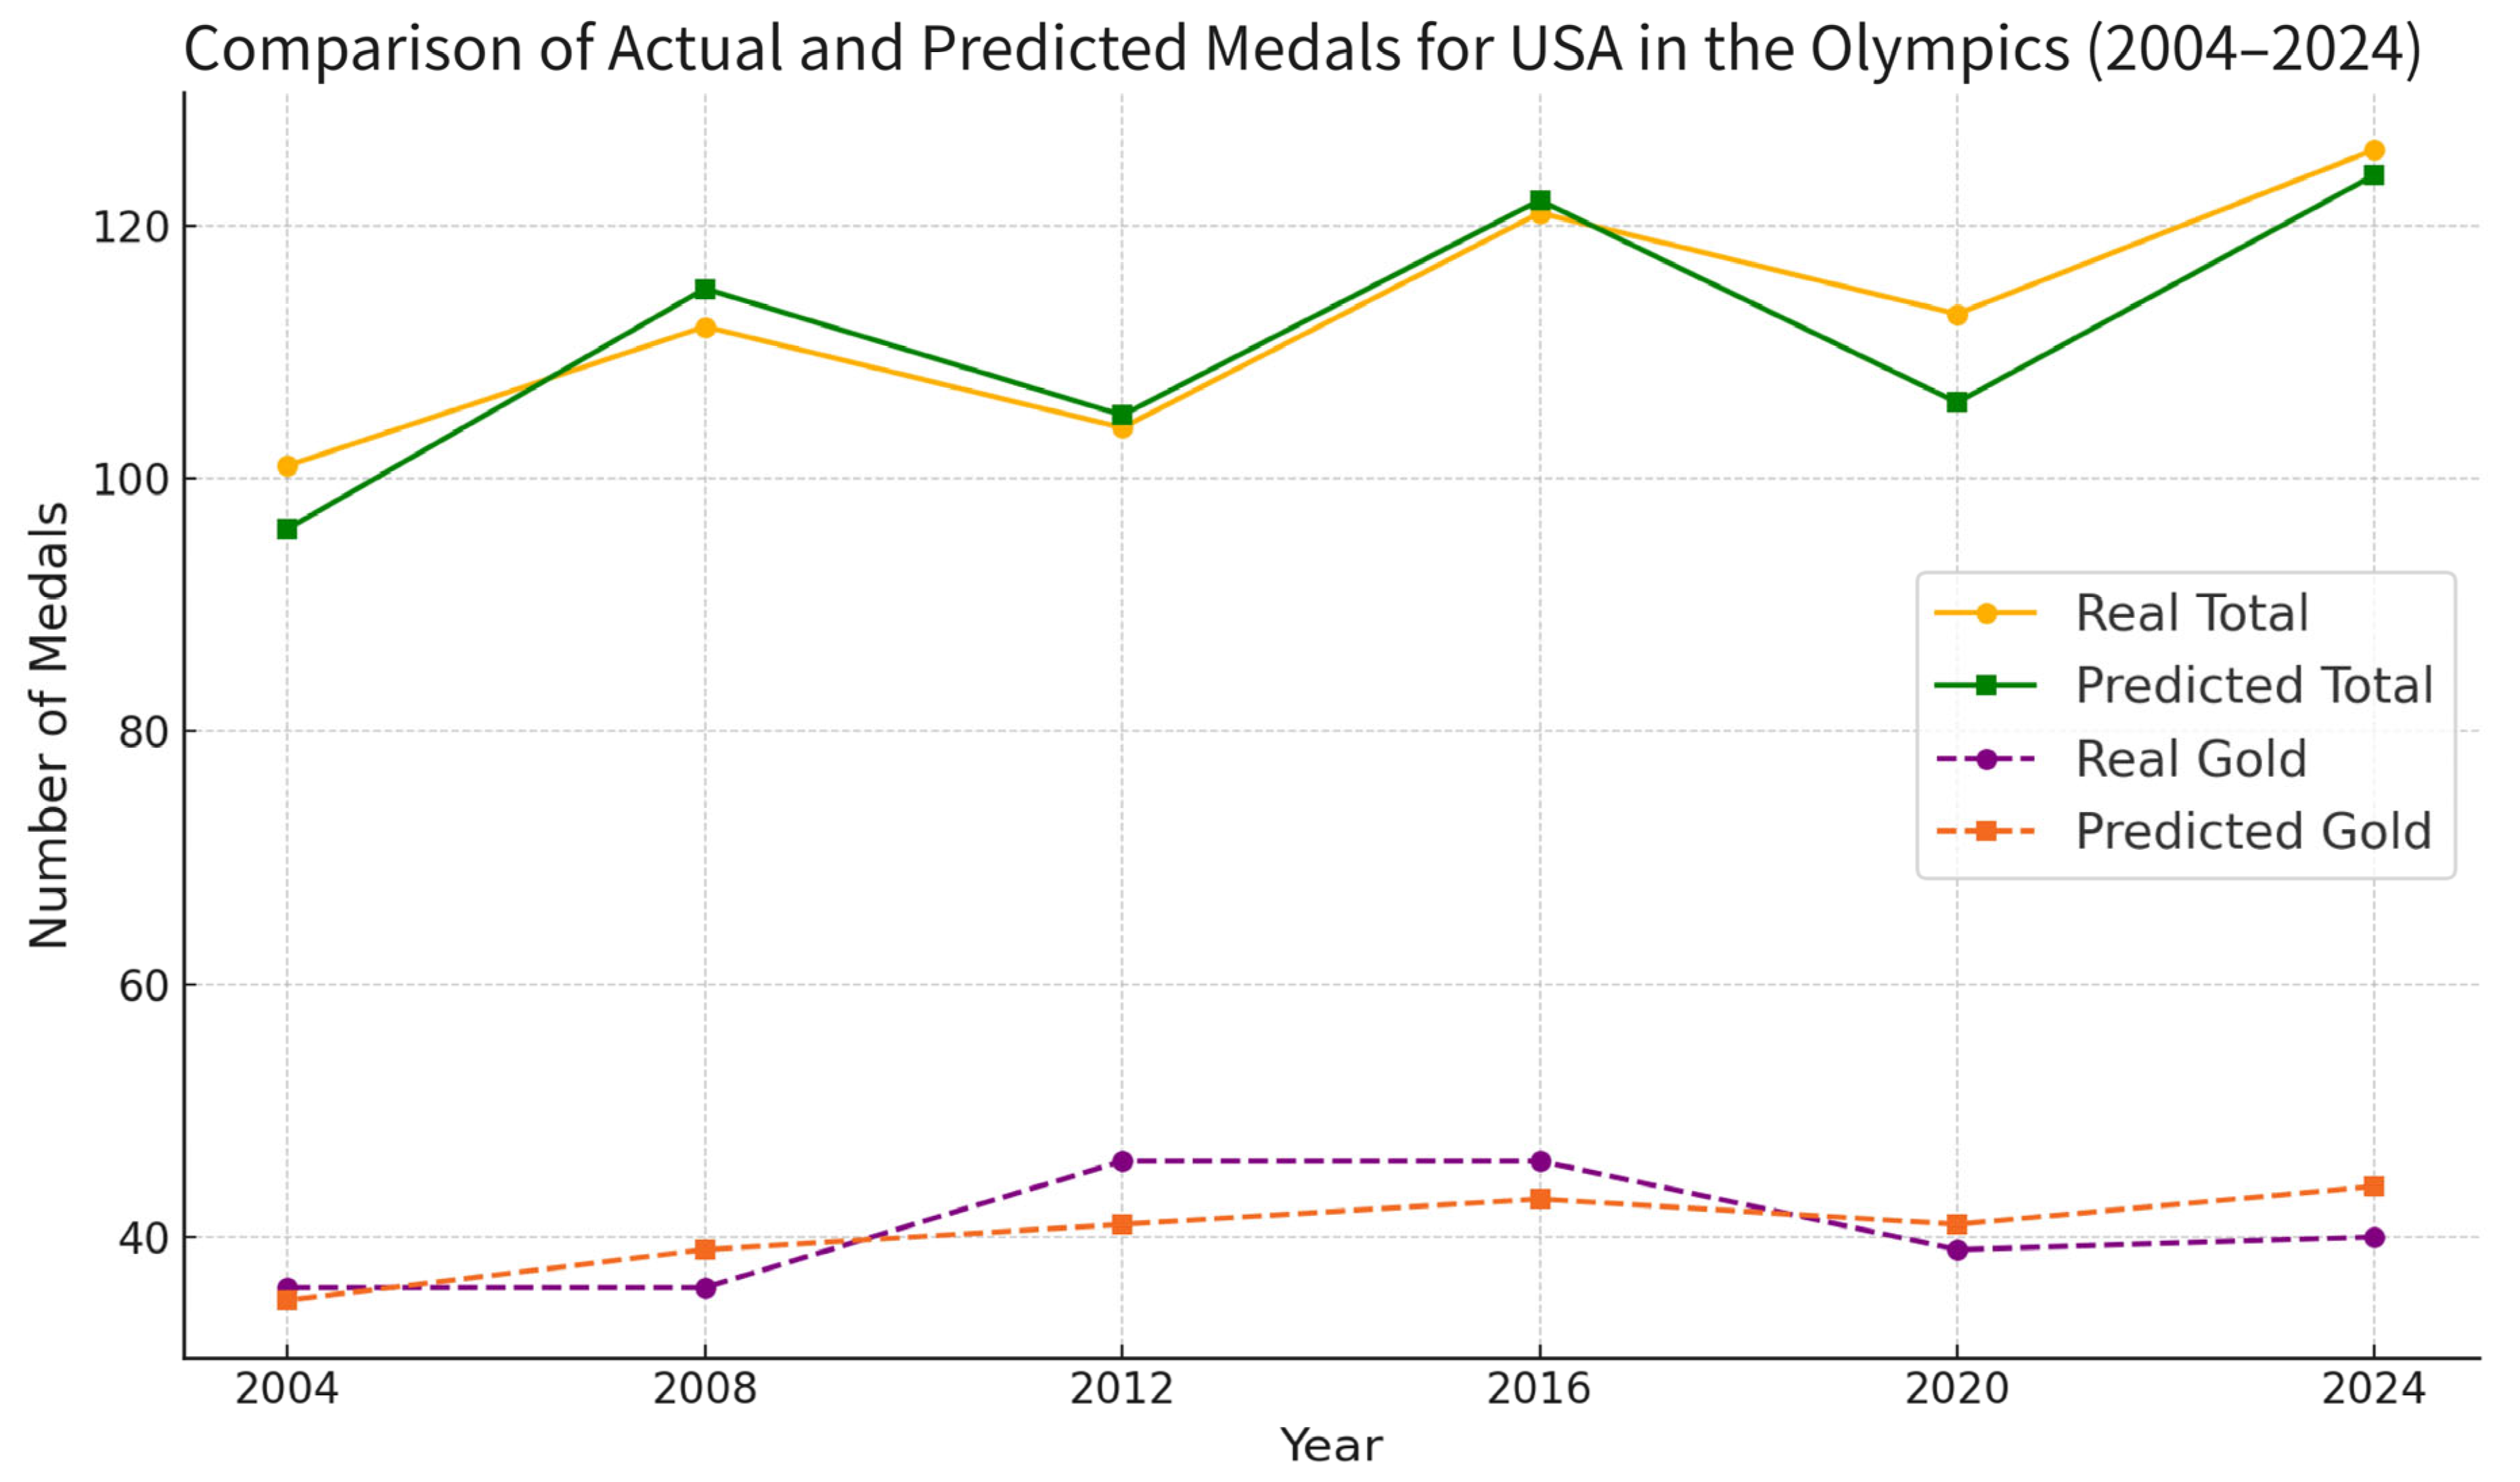
Next, to evaluate the effectiveness of the model we established on a large time scale, we use our model to calculate the total and gold medal counts of America from 2004 to 2024 and then compare these data with real medal counts. The results are shown in
Table 3 and
Figure 14.
We can calculate the RMSE of the calculated gold medals and total medals were 3.26 and 3.85, respectively. The calculated MRE of the predicted gold medals and total medals was 7.28% and 2.96%, respectively.
These errors may be caused by the nonlinear effect of event expansion, which is related to the Host effect mentioned above. The host country’s choice to increase, decrease, or maintain certain sports events may have a significant impact on the distribution of medals—a phenomenon referred to as the “Home Advantage” [
21]. By adding traditional advantageous events, the host country can gain more medals and shift the medal structure in its favor. For example, karate was introduced as a new event at the 2020 Tokyo Olympics, comprising eight medal events. Japan won three medals (one gold, one silver, and one bronze), while China won one silver medal. Although the event yielded a relatively small number of medals, its introduction demonstrates the nonlinear effect of event expansion—i.e., a single added sport can result in multiple medal opportunities due to multiple weight classes, genders, or disciplines.
More importantly, the impact of event selection extends beyond the host country and into neighboring countries with similar athletic traditions and training systems, due to a regional radiation effect. The addition of a culturally aligned sport like karate not only boosted Japan’s medal count but also benefited East Asian neighbors like China, who share similar combat sport foundations. Conversely, the removal of karate from the 2024 Paris Olympics will inevitably reduce medal opportunities for countries in this region, thereby affecting medal projections.
From a modeling perspective, this introduces a layer of systematic prediction error. If our model projects future medal counts based solely on historical athletes’ performance and macro indicators (e.g., GDP, population, and past medals), it may overestimate medal counts for countries like China by failing to account for the removal of beneficial events such as karate. Similarly, the model may underestimate France’s performance in 2024 if it does not incorporate the introduction or reinforcement of events in which the host country has a historical advantage (e.g., fencing, breaking, and sport climbing).
Therefore, the discrepancy between predicted and actual medal counts can partly be attributed to the nonlinear medal dynamics caused by event adjustments, as well as the regional propagation of performance boosts from host country-led decisions. These factors introduce a structural disturbance in the predictive landscape that traditional models often overlook. To improve accuracy and robustness, medal prediction models must dynamically incorporate host country event strategies, event-specific medal multiplicity, and regional similarity factors. Only then can they realistically capture the complexities introduced by the evolving structure of Olympic competitions.
4.2. Sensitivity Analysis
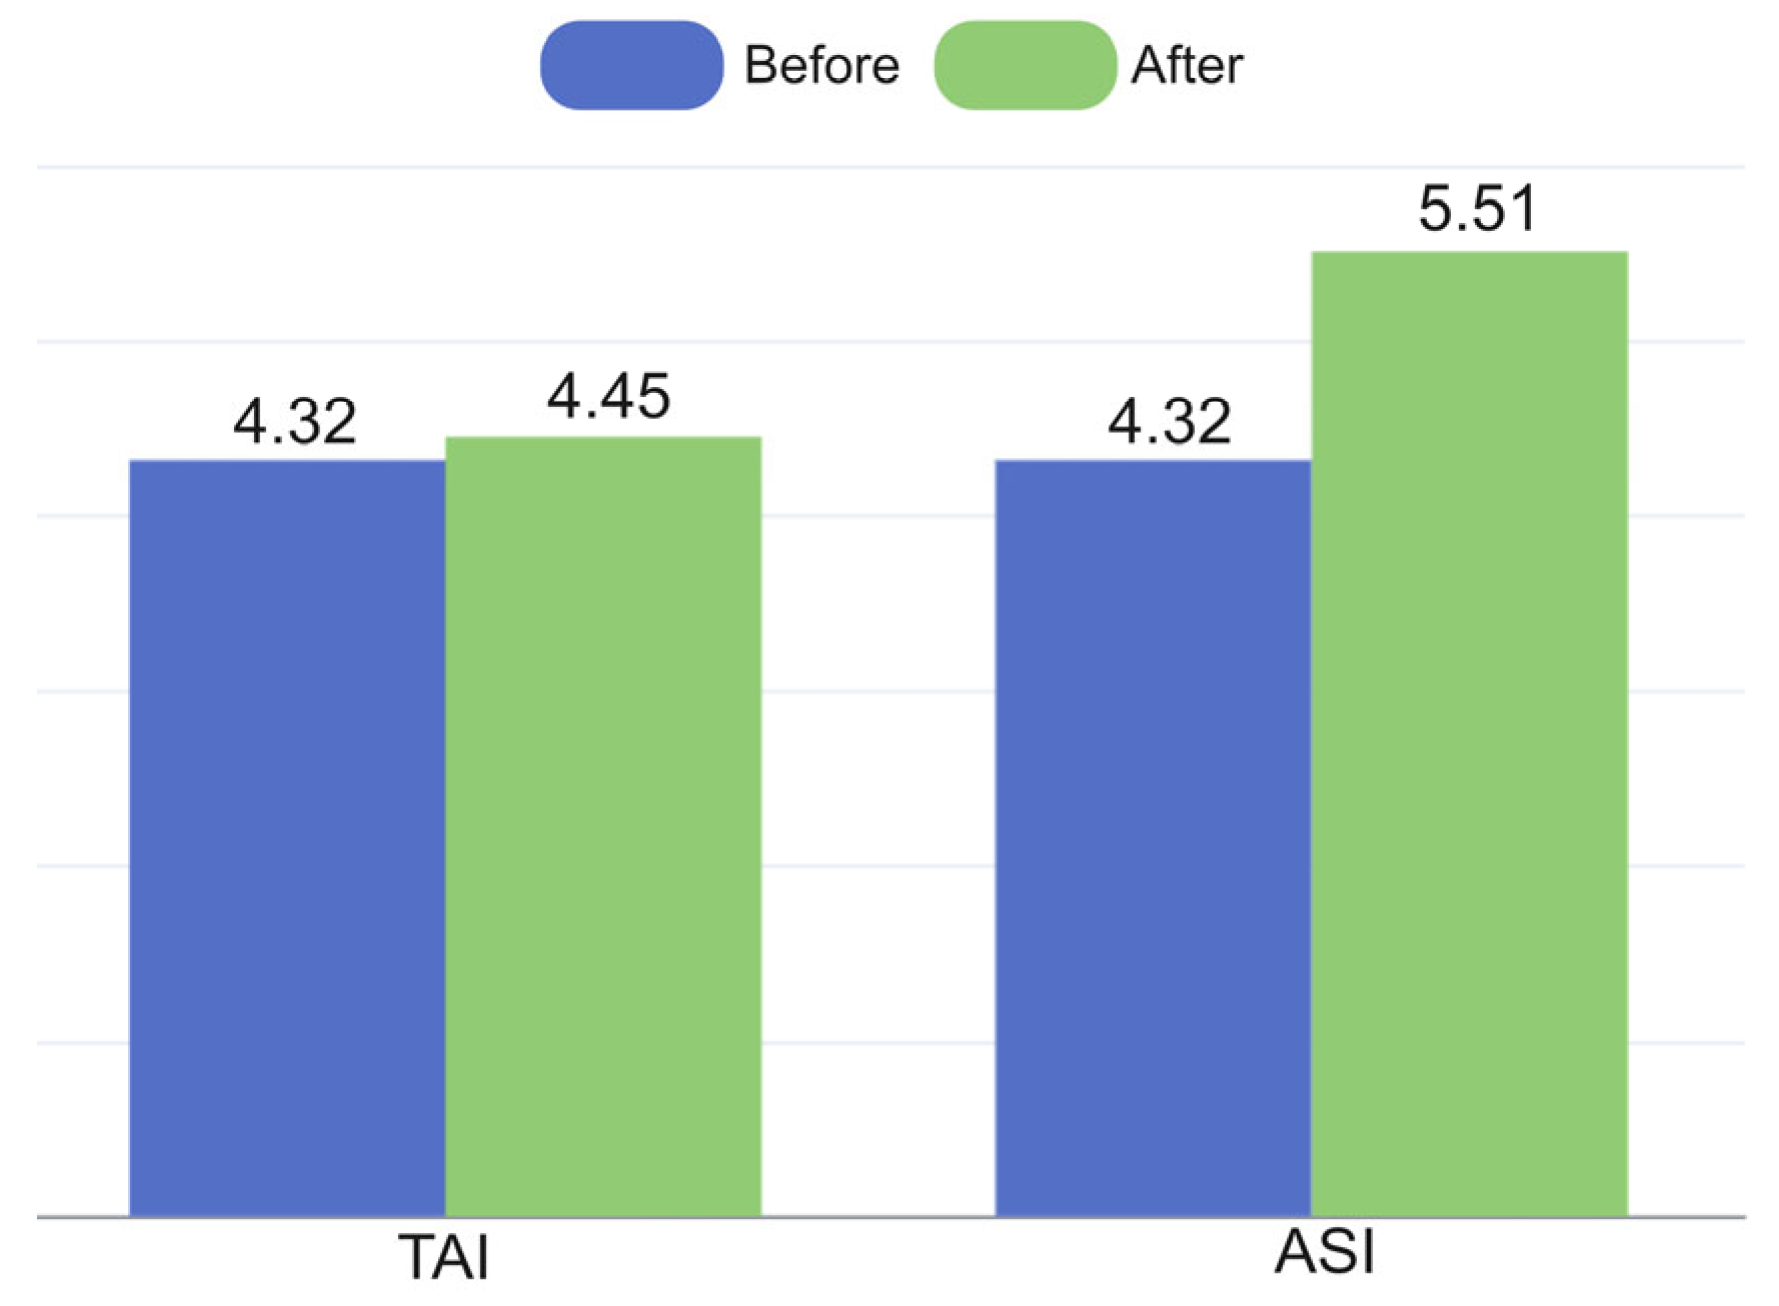
Sensitivity analysis only considers the impact of changes in the TAI and the ASI on the prediction results and uses the change in RMSE root mean square error as an indicator to evaluate the sensitivity. The raw data is based on the 2020 Olympic Games, comparing the projections for the 2024 Olympic Games with the actual performance of each country. Firstly, while ensuring the ASI and Host remain unchanged, we re-prepared the 2024 medal table and calculated a new RMSE. Then, we compare it with the RMSE before introducing noise, and the result is shown in
Figure 15. Our TAI model has good robustness and is not sensitive to the noise introduced.
Next, we revised the 2020 medal table to ensure that the total number of medals and gold medals for each country deviates by three–five from the actual value. While keeping TAI and Host unchanged, we re-prepared the 2024 medal table and calculated a new RMSE, and compared it with the RMSE before introducing noise, and the result is shown in
Figure 15. Because our model’s medal prediction for this Olympics relies heavily on the overall athlete performance of the previous Olympics, we can see that RMSE has increased by about one medal compared to before introducing bias.
Overall, our model has good robustness.
5. Conclusions
Under the backdrop of accelerating digital transformation and the increasing availability of multi-source data, this study presents a data-driven, intelligent framework for Olympic medal prediction that goes beyond traditional statistical extrapolation methods by integrating the principles of DIF Through the combination of diverse data sources—ranging from historical medal records and athlete participation data to coaching influence and geopolitical context—we constructed a robust predictive model that captures both long-term structural advantages and short-term dynamic fluctuations. At the heart of the model is the PS system, which encapsulates the TAI, ASI, Host effects, as well as the “Dark Horse” and “Great Coach” phenomena. These components are derived from a set of carefully selected algorithms, including K-means clustering, backpropagation neural networks, ARIMA time series forecasting, logistic regression, and random forest regression, each contributing to a different layer of analytical insight.
At the core of this framework lies the PS system, which synthesizes six primary factors: the TAI, ASI, Host effect, F, DH, and GC. Each factor contributes a unique predictive value—TAI captures long-term structural strengths through clustering of nation-event medal distributions, while ASI utilizes a backpropagation neural network to predict athlete participation and performance capacity in future events. The Host effect captures both boosts and retractions associated with being the Olympic host or adjacent participant, reflecting fluctuations often overlooked in static models. The predictive modules for DH and GC, based on logistic regression and random forest, respectively, further enhance the model’s capacity to anticipate dynamic shifts, such as the sudden emergence of first-time medalists and performance surges driven by coaching excellence.
Validation experiments using the 2024 Olympics as a test case confirmed the model’s accuracy, with gold and total medal RMSE of 3.21 and 4.32, respectively, and MRE of 17.6% and 8.04%. These performance metrics demonstrate that the model not only aligns closely with actual outcomes but also performs well under limited or incomplete input data. Furthermore, the framework was able to capture real-world dynamics such as the host-induced surge in athlete participation, the marginal yet non-negligible medal contributions of elite coaches, and the structural rise in nations with increasing event diversification.
Predictions for the 2028 Los Angeles Olympics suggest a competitive landscape characterized by a bipolar structure: the United States, leveraging both home advantage and deep event coverage, is projected to secure 46 golds and 139 total medals, while China, despite matching the U.S. in gold count, is predicted to fall behind in total medals due to event concentration. Countries such as South Korea and Germany are forecasted to improve through strategic coaching and athletic development, whereas France may experience a sharp decline driven by event reshuffling and demographic limitations. Such forecasts underscore the model’s value as a strategic planning tool—not just a forecasting engine.
Sensitivity analysis further confirmed the model’s robustness. Variations in TAI and ASI inputs led to only moderate increases in RMSE, affirming the model’s stability under parameter uncertainty. However, the study also highlights limitations in cross-cycle predictions due to data drift, athlete generational turnover, and evolving event structures. Notably, the non-integer nature of coaching contributions poses interpretive challenges and points to the need for finer-grained, event-specific attribution modeling in future iterations.
Overall, this study advances the field of Olympic medal forecasting by fusing statistical learning, machine intelligence, and domain-specific knowledge into an integrated prediction framework. Beyond its technical contributions, the model offers practical insights for Olympic committees, sports federations, and policy-makers, enabling them to optimize athlete selection, resource allocation, and coaching strategies. Looking ahead, this model lays the groundwork for broader applications in sports analytics and policy development. Future extensions may incorporate real-time data such as wearable sensor outputs, psychological indicators, and social sentiment to further refine predictions. Moreover, adapting this framework to other formats such as the Winter Olympics, continental games, or youth competitions could validate its adaptability and extend its impact. With advancements in machine learning techniques such as transfer learning, multi-modal fusion, and graph-based reasoning, the predictive architecture can evolve to better reflect the ever-changing landscape of global sports. In essence, this work advances Olympic medal forecasting from a retrospective exercise to a forward-looking decision support system, enabling smarter, more strategic engagement with high-performance sports at the international level.


