3.2. Tribological Behavior
The tribological performance of the BFRP composites was assessed under dry sliding conditions using a pin-on-disc tribometer with a chromium alloy steel counterbody (AISI 52100, Ø 12.7 mm), in accordance with ASTM A295. The tests were designed to investigate the influence of three key parameters—fiber weight fraction (50%, 65%, 70%), applied normal load (10 N, 20 N, 30 N), and sliding speed (0.1, 0.25, 0.36 m/s)—on COF, specific wear rate, and surface temperature.
The experimental setup and parameter combinations presented in
Table 4 ensured a comparative evaluation of the tribological behavior of the BFRP material with 50%, 65%, and 70% fiber weight fractions. The tribological responses were analyzed for steady-state conditions over the last 60 min of the 120 min testing interval.
3.2.1. Coefficient of Friction (COF)
The evolution of the coefficient of friction for the BFRP composites during dry sliding is illustrated in
Figure 3,
Figure 4 and
Figure 5.
Figure 3 shows the real-time variation in COF over the 120 min test period for all three fiber contents (50%, 65%, and 70%wf) under a constant load of 20 N and a sliding speed of 0.1 m/s. The BFRP 50% composite exhibited significant fluctuations in the initial run-in period, indicating unstable contact conditions and delayed formation of a tribolayer. By contrast, the BFRP 65% and especially the BFRP 70% samples transition more quickly into the steady-state regime, characterized by a more consistent COF. This difference highlighted the beneficial effect of higher fiber content on contact stability and load transfer efficiency.
Figure 4 compares the average steady-state COF values for each fiber fraction under a constant load of 20 N, providing a representative reference for comparative analysis. The results revealed a nonlinear relationship between fiber content and friction behavior. At 10 N, COF increased slightly with fiber content, suggesting that initial contact stresses were more effectively distributed in matrix-dominant compositions. However, under higher loads (20 N and 30 N), the BFRP 70% sample consistently demonstrated the lowest COF values, reflecting a more favorable tribological interaction. This could be attributed to enhanced interfacial bonding, better thermal conductivity, and reduced plastic deformation at the sliding interface.
Figure 5 provides a consolidated view of COF dependency on both fiber content and sliding speed. At low speed (0.1 m/s), all samples showed relatively higher COF values due to increased adhesion and insufficient frictional heating. As the sliding speed increased to 0.36 m/s, a noticeable reduction in COF was observed, particularly for the 65% and 70% fiber composites. This behavior suggested the formation of a more stable transfer film facilitated by frictional heat and increased surface activation. The BFRP 70% specimen exhibited the most consistent COF across all speeds and loads, supporting its superior tribological performance. The experimental results presented in
Figure 3,
Figure 4 and
Figure 5 were selected under a normal load of 20 N to provide a representative and balanced overview of the tribological behavior of the BFRP composites. This intermediate load level was intentionally chosen for detailed graphical analysis for several reasons.
First, 20 N offers a reliable balance between under-loading and overload conditions. At this load, the tribological system exhibits both run-in dynamics and steady-state stability without inducing excessive material failure or premature thermal degradation. Lower loads (e.g., 10 N) often result in less pronounced wear and insufficient frictional heating, which can obscure the differences in material performance. Conversely, high loads (30 N) tend to exaggerate wear mechanisms and accelerate surface breakdown, potentially masking the underlying trends of COF and temperature stabilization.
Second, the run-in and steady-state phases are more clearly observable at 20 N. The COF evolution at this load level shows a well-defined transition from initial surface adaptation (run-in) to stable contact conditions (steady-state), allowing for a consistent comparison across all fiber compositions. This transition is crucial for evaluating the formation of tribofilms, surface accommodation, and the material’s ability to stabilize friction over time.
Similarly, the temperature profiles recorded at 20 N reflect realistic heat generation conditions without reaching critical thermal thresholds that could damage the matrix or trigger anomalous responses. The heat accumulation observed during run-in and the thermal plateau in the steady-state provide meaningful insight into each composite’s thermal regulation capacity, an important parameter for applications involving repeated or prolonged dry contact.
In summary, selecting 20 N as the reference load for
Figure 3,
Figure 4 and
Figure 5 enables the most representative and interpretable comparison of tribological responses, highlighting the material’s behavior in both the early dynamic phase and under stabilized frictional conditions.
In summary, the COF results indicated that both the fiber content and operating conditions significantly affected the tribological response of BFRP composites. A higher fiber content promoted early stabilization of friction, lower steady-state COF, and reduced sensitivity to changes in speed and load. These findings highlighted the effectiveness of basalt fiber reinforcement in improving frictional behavior under dry sliding conditions
3.2.2. Specific Wear Rate
The specific wear rate values of the BFRP composites were analyzed under varying loads and fiber weight fractions to assess the material’s volumetric wear resistance during dry sliding. The variation in the specific wear rate (K) as a function of fiber content and applied load is presented in
Table 4. These data allowed for a comparative assessment of volumetric wear resistance across the tested BFRP composites under different frictional conditions.
Overall, the wear rate values exhibited a nonlinear dependency on both the applied load and the amount of reinforcement, indicating a complex interaction between fiber architecture, matrix behavior, and frictional conditions.
At 10 N, the BFRP 50% sample demonstrated a relatively low wear rate (3.25 × 10⁻⁵ mm3/Nm), but this increased significantly to 8.69 × 10⁻⁵ mm3/Nm at 30 N, reflecting the material’s limited ability to withstand high contact pressures. The pronounced increase suggested matrix softening, fiber pull-out, and poor energy dissipation at higher load levels. This behavior was consistent with SEM observations showing widespread delamination and matrix degradation in BFRP 50%.
For BFRP 65%, the wear rate followed a different trend: starting at 6.91 × 10⁻⁵ mm3/Nm (10 N), it rose slightly to 9.34 × 10⁻⁵ mm3/Nm at 20 N, then dropped to 7.69 × 10⁻⁵ mm3/Nm at 30 N. The reduction under maximum load suggested a more efficient load-bearing mechanism, possibly due to improved fiber distribution and the formation of a stable tribological film that protected the surface from further degradation. This result indicated a transitional behavior in which the reinforcement began to dominate over the matrix in terms of wear resistance.
The BFRP 70% specimen exhibited the most stable wear behavior across all load conditions, with values ranging between 4.08 × 10⁻⁵ mm3/Nm and 8.03 × 10⁻⁵ mm3/Nm. These results confirmed the superior wear resistance of the highly reinforced composite, especially at medium and high loads. The higher fiber volume contributed to increased structural rigidity and reduced the contact area of the soft matrix, thereby limiting material removal. Additionally, the enhanced thermal conductivity of the fiber-rich composite likely mitigated frictional heating, further improving performance under dry sliding conditions.
Comparative analysis of the wear rate data across fiber fractions revealed that the most significant improvement occurred when the fiber content increased from 50% to 65%, suggesting a threshold beyond which reinforcement dominated the tribological response. The improvement from 65% to 70% fiber content was more moderate, indicating a point of diminishing returns due to potential challenges such as matrix starvation or fiber misalignment at very high reinforcement levels.
The wear rate trends aligned with both the COF behavior and the 3D profilometric analysis, reinforcing the conclusion that higher basalt fiber content enhanced tribological durability. These findings validated the role of fiber reinforcement in controlling material loss during frictional loading and provided quantitative confirmation of the microscopic damage mechanisms observed in SEM analysis.
3.2.3. Contact Temperature
The results of contact temperature under various test conditions are summarized in
Table 4. Surface temperature during sliding is a critical parameter under dry friction conditions, as it directly influences material softening, interfacial adhesion, and tribofilm formation.
Figure 6a illustrates the evolution of contact temperature over the 120 min testing period for BFRP composites with different fiber weight fractions, tested at 30 N load and 0.36 m/s sliding speed—the most severe test condition.
Figure 6b summarizes the final average temperatures measured at the end of each test for all composite configurations.
The BFRP 50% composite exhibited the highest temperature rise, reaching 65.2 °C under the highest load and speed combination. This substantial increase was attributed to the lower thermal conductivity of the epoxy-rich matrix, leading to heat accumulation at the sliding interface. The reduced ability of the matrix to dissipate frictional heat resulted in local softening, which may have contributed to higher wear rates and unstable COF, as confirmed by the data presented in
Section 3.2.1 and
Section 3.2.2.
By contrast, the BFRP 65% and 70% composites demonstrated significantly lower surface temperatures. For BFRP 65%, the peak temperature reached under maximum load was 58.4 °C, while the peak temperature of BFRP 70% remained below 52 °C across all conditions. The reduced thermal response of these highly reinforced composites was primarily due to the presence of a continuous and dense basalt fiber network, which improved heat conduction and distributed thermal energy more evenly across the contact surface. This thermal buffering effect delayed matrix softening and supported the formation of more stable tribological films, contributing to the lower and more stable COF and wear rates observed in the previous subsections.
At low load (10 N) and speed (0.1 m/s), all composites maintained relatively low and comparable surface temperatures (ranging from 29 to 35 °C), with no significant differences among fiber contents. However, as load and sliding speed increased, differences became more pronounced. This confirmed that thermal performance was highly dependent on reinforcement level, especially under demanding frictional regimes where heat generation intensified.
The temperature data also aligned with the observations from SEM and EDS analyses, where the BFRP 70% specimen showed reduced signs of matrix degradation and adhesive wear. Lower operating temperatures likely contributed to the preservation of surface integrity and the minimization of thermal damage at the fiber–matrix interface.
In summary, increasing the basalt fiber content enhanced the thermal resistance of the composite system under dry sliding conditions, reducing surface temperature rise and stabilizing tribological behavior. These results emphasized the dual function of basalt fibers—not only as mechanical reinforcements but also as thermal conductors mitigating friction-induced heating. The temperature-induced surface changes discussed here were further evidenced in the SEM images (
Figure 6), where differences in matrix degradation and fiber exposure aligned with the recorded thermal loads.
3.2.4. Wear Mechanism Analysis
To better understand the origin of the wear behavior observed in the BFRP composites, a detailed surface characterization was conducted by performing scanning electron microscopy (SEM) and energy-dispersive X-ray spectroscopy (EDS) on the wear tracks. The goal was to identify dominant degradation mechanisms and assess the evolution of the contact interface under dry sliding conditions.
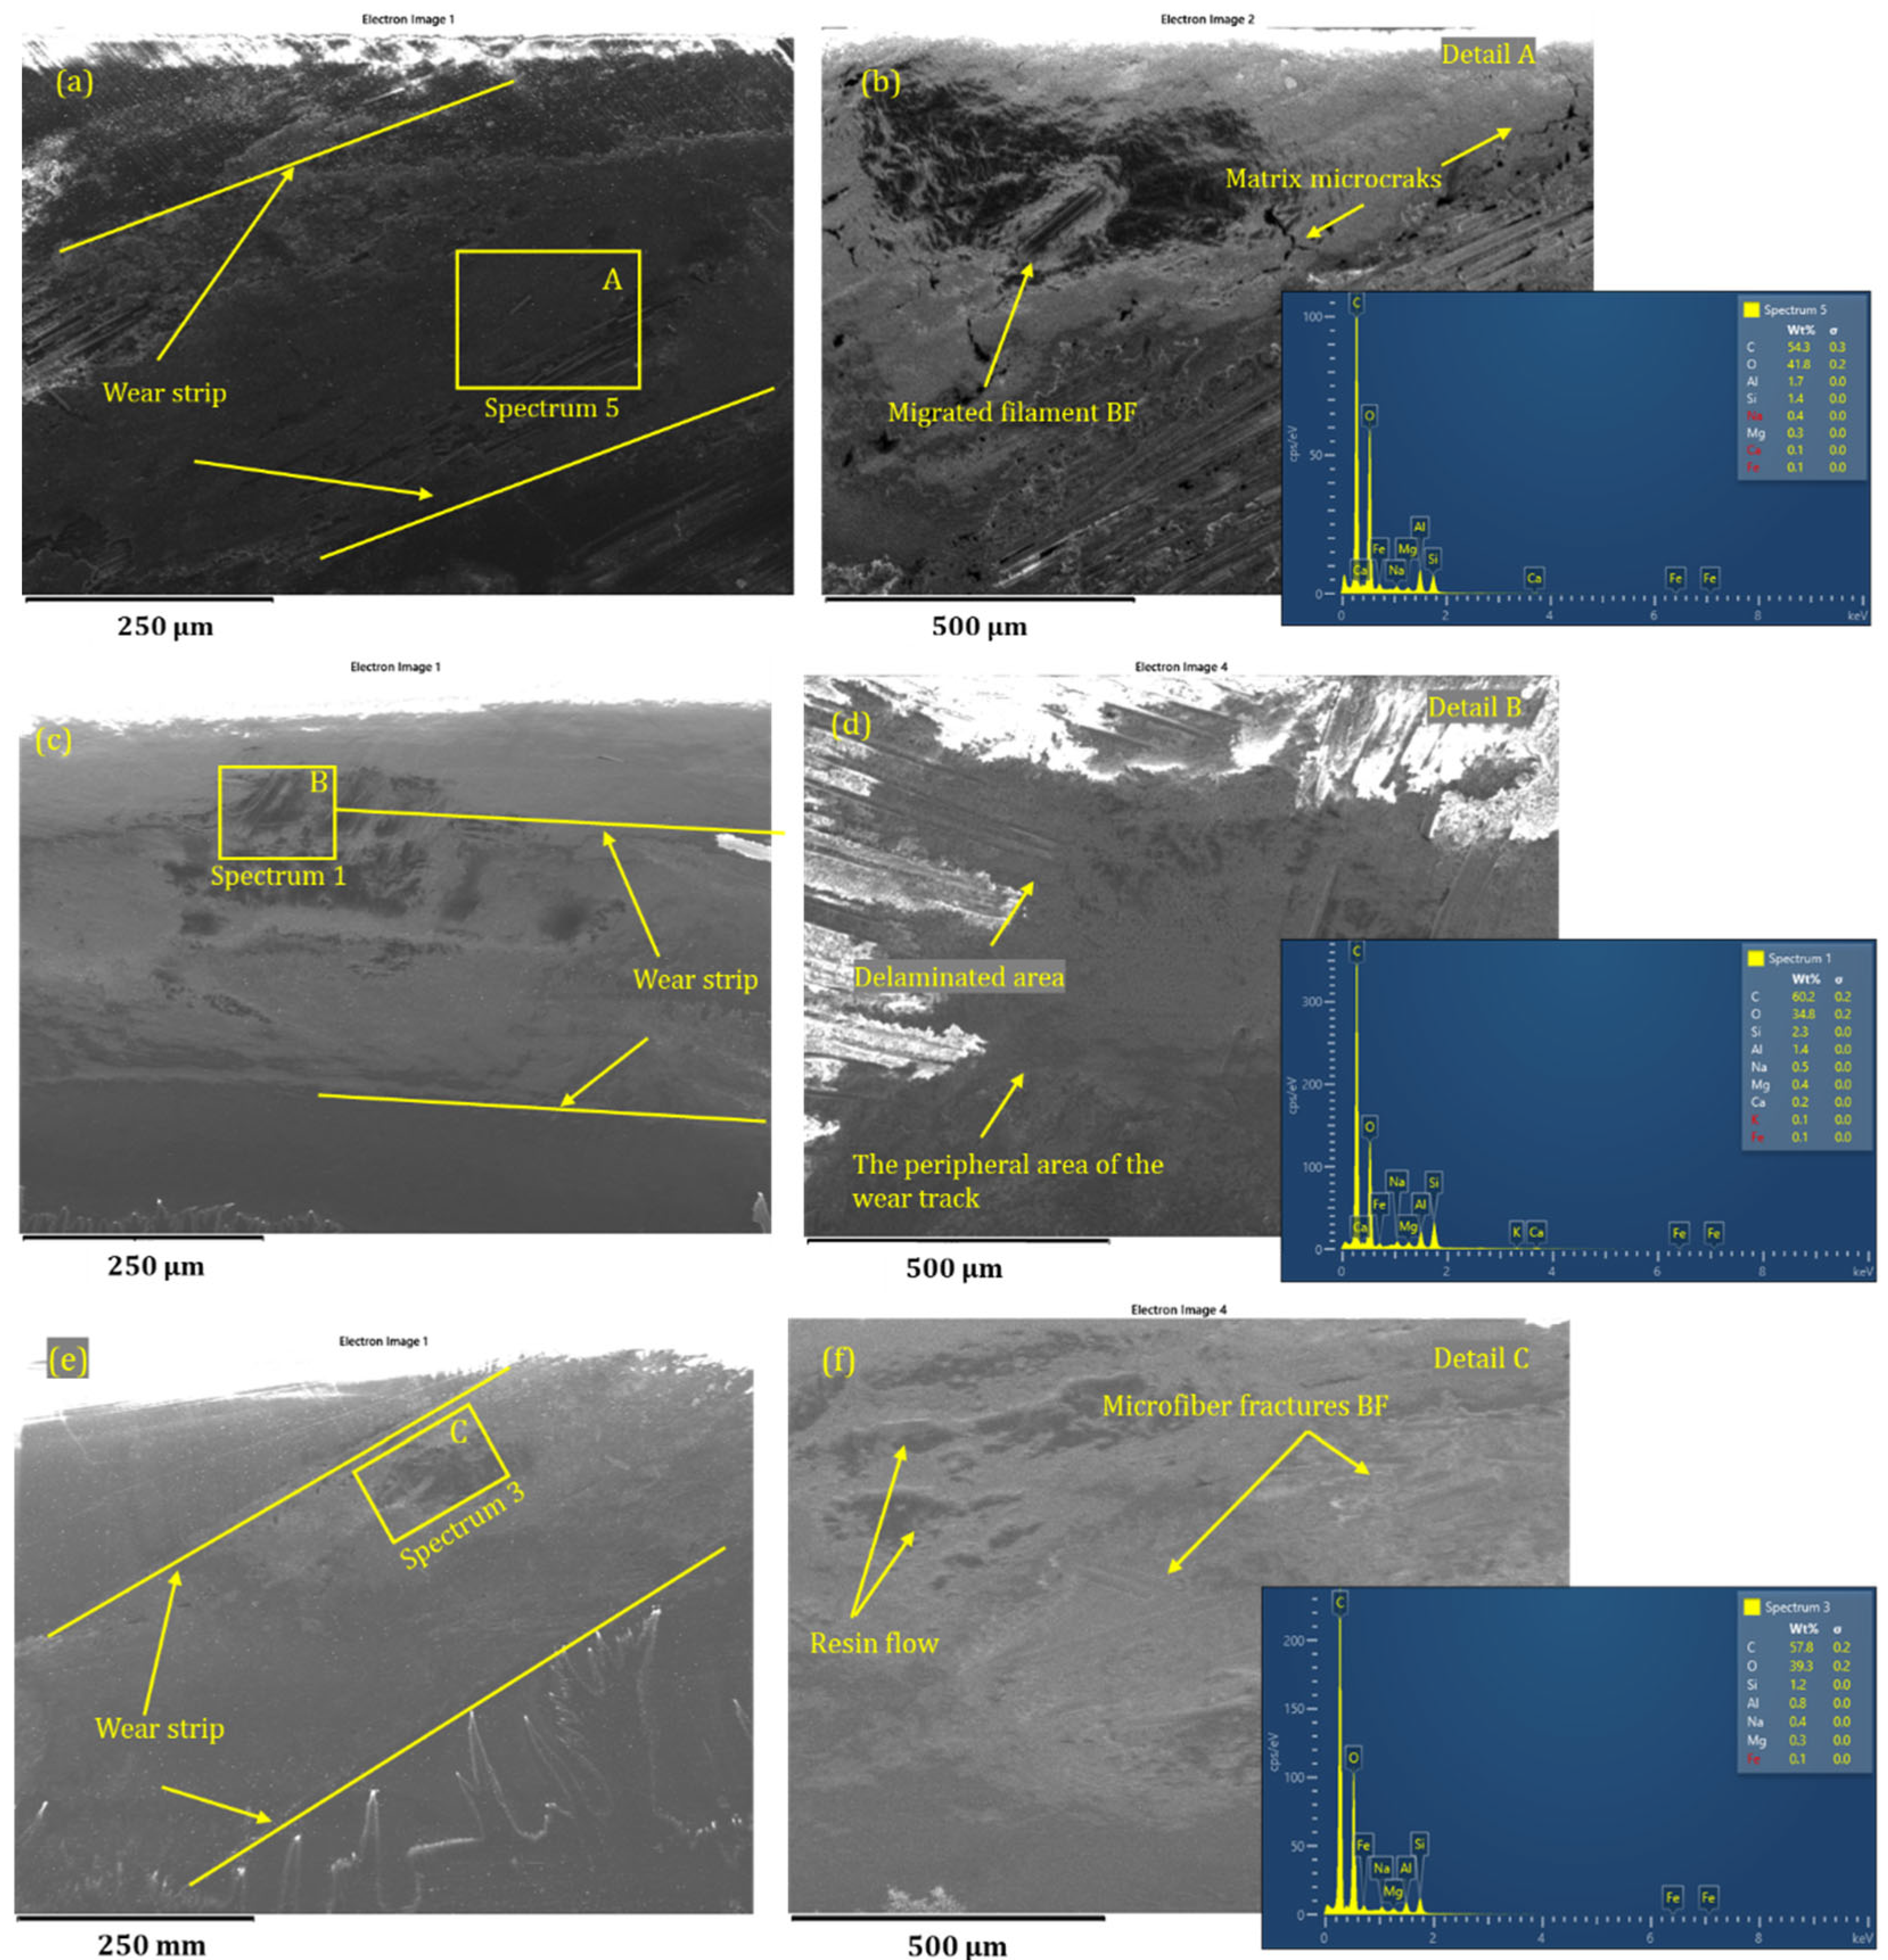
Figure 6 presents representative SEM images of the worn surfaces for BFRP specimens tested at 30 N and 0.25 m/s. The BFRP 50% sample (
Figure 6a,b) exhibited severe matrix degradation, transverse and longitudinal microcracks, and clear signs of fiber pull-out and debonding. The resin-rich nature of the composite made it more susceptible to softening, leading to extensive delamination and material loss. The presence of irregular fiber fragments and exposed voids suggested that the interface between fibers and the matrix failed under repeated contact stress and frictional heating.
In the BFRP 65% specimen (
Figure 6c,d), the wear surface showed more compact and organized morphology, with reduced matrix tearing and fewer detached fibers. However, localized matrix removal and limited fiber breakage were still observed, indicating partial interfacial failure. The improved reinforcement ratio likely contributed to better load distribution, reducing the extent of localized deformation and fiber–matrix separation.
The BFRP 70% surface (
Figure 6e,f) displayed a much more uniform wear track, with intact fiber–matrix regions and minimal visible damage. The worn surface was smoother and fiber breakage was rare, suggesting that the high reinforcement density effectively mitigated surface damage and promoted better stress transfer. The reduced presence of microcracks and ploughing traces confirmed the role of fiber architecture in absorbing mechanical energy and resisting wear propagation.
The scanning electron microscopy (SEM) images presented in
Figure 6, which show the morphology of the wear tracks on BFRP composites—were obtained under a normal load of 30 N and a sliding speed of 0.25 m/s, after 120 min of dry sliding. This high-load condition was intentionally selected to capture and highlight the dominant wear mechanisms in their most developed and distinguishable form.
At 30 N, the tribological system was subjected to maximum mechanical stress among all tested conditions, which amplified the effects of fiber–matrix interaction, surface degradation, and thermal buildup. These severe conditions facilitated the emergence of critical features such as matrix delamination, fiber pull-out, microcracking, and interfacial debonding—phenomena that were more subtle or even absent at lower loads.
By focusing the SEM analysis on this load level, it became possible to clearly distinguish differences in damage morphology between the BFRP samples with 50%, 65%, and 70% fiber contents. The extent and type of surface failure, whether dominated by matrix wear, fiber fracture, or cohesive failure—were more visible and diagnostic under high-stress conditions, enabling a comparative evaluation of reinforcement efficiency and interfacial integrity.
Moreover, since tribological degradation is load-dependent, selecting the most critical scenario (30 N) ensured that the observed damage mechanisms are representative of worst-case operational behavior, offering valuable insights into the composite’s long-term durability and failure modes in demanding applications. In summary, the use of 30 N as the reference load for SEM imaging allowed for enhanced visualization of surface damage, better differentiation among composite types, and a more meaningful interpretation of wear mechanisms under critical working conditions.
Figure 7 shows the analysis of the wear tracks, where iron and chromium peaks were detected, particularly in the BFRP 50% sample. This indicated material transfer from the steel counterbody, which was consistent with adhesive wear and poor thermal dissipation. By contrast, the metallic residue was significantly lower in the BFRP 65% sample and nearly absent in the BFRP 70% sample, suggesting a more stable contact surface and reduced adhesive interaction. The presence of silicon, oxygen, and aluminum in all samples confirmed the exposure of basalt fibers and residual epoxy degradation.
The overall tribological results demonstrated that increasing the basalt fiber content from 50% to 70% significantly improved frictional stability, reduced the wear rate, and enhanced thermal resistance. BFRP 70% exhibited the best performance under all testing conditions, with rapid transition to steady-state behavior, stable COF, and minimal material loss. These findings underlined the reinforcing effect of basalt fibers in tribological contacts, making BFRP composites with high fiber content suitable for demanding applications involving high loads and sliding speeds.
To further elucidate the wear mechanisms involved in the tribological behavior of the BFRP composites, post-test analyses were performed using scanning electron microscopy (SEM), energy-dispersive X-ray spectroscopy (EDS), and 3D optical profilometry. These methods allowed for the detailed observation of worn surfaces, identification of damage modes, and assessment of material transfer or surface degradation.
The images (
Figure 7) collected from the wear track regions revealed traces of iron and chromium on the BFRP sample surfaces, indicating material transfer from the steel counterbody during sliding. This was consistent with adhesive wear and tribochemical interactions at the contact interface. The amount of transferred metallic elements decreased with increasing fiber content, supporting the hypothesis that BFRP 70% provided a more stable tribological interface with lower adhesion and improved thermal dissipation.
Additionally, silicon and oxygen peaks corresponding to the basalt fibers and the epoxy matrix were identified consistently in all samples, further validating the structural integrity of the tested composites and the reliability of the SEM/EDS mapping.
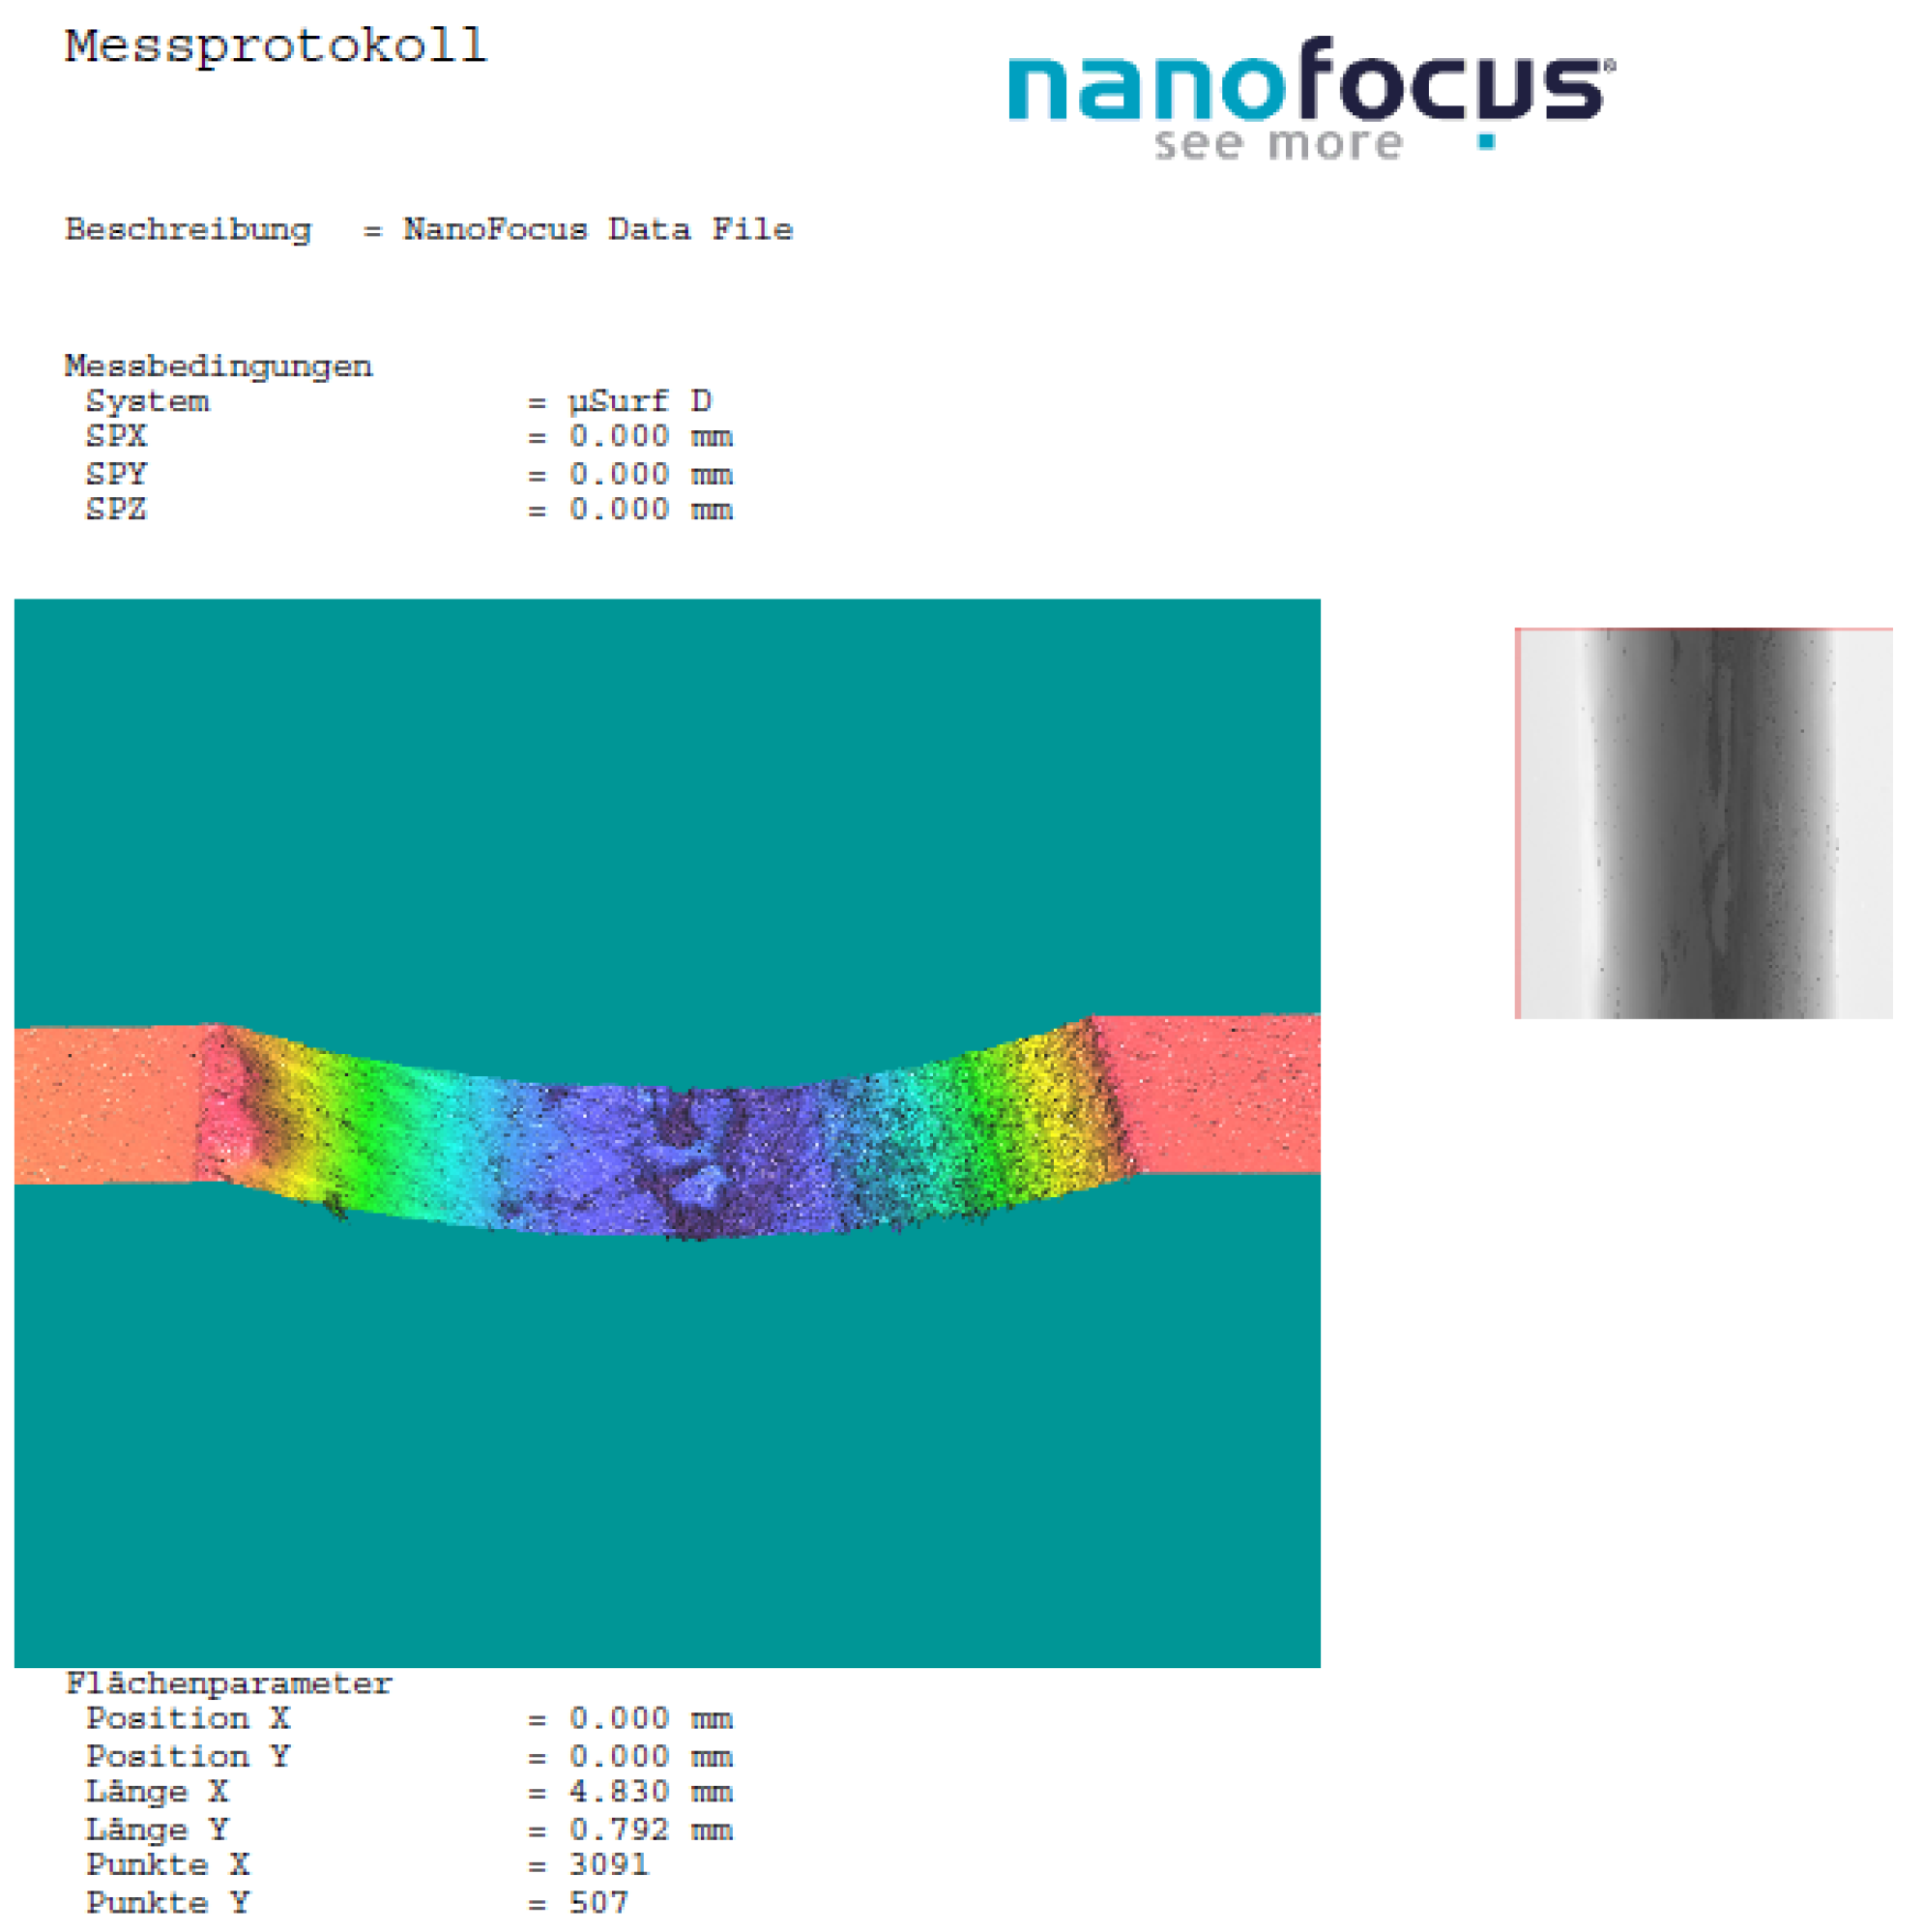
3.3. 3D Profilometry
Three-dimensional surface profilometry, using an optical profilometry system (Alicona InfiniteFocus, Bruker Alicona, Graz, Austria), was used to measure the depth of the wear tracks. A comprehensive analysis of the worn surfaces using optical profilometry provided further insight into the degradation mechanisms and wear behavior under dry sliding conditions. The BFRP 50% composite exhibited the most severe wear track, with deeper grooves and higher surface irregularities, confirming the extensive material loss observed in the wear rate measurements. The BFRP 65% sample showed moderate wear depth with more uniform profiles, while the BFRP 70% composite had the shallowest and smoothest track, demonstrating its superior wear resistance.
As part of this investigation,
Figure 8 and
Figure 9 present illustrative 3D surface scans, showcasing representative wear morphologies for the BFRP 50% composite tested under a load of 20 N and sliding speed of 0.1 m/s over a 120 min period. This condition was selected as a standardized and balanced testing regime across all profilometric evaluations, applied consistently for all three composite types (BFRP 50%, BFRP 65%, and BFRP 70%). The load of 20 N provided a realistic frictional contact condition where measurable surface damage can occur without causing extensive surface rupture or deformation that would hinder the optical scanning process. Likewise, the relatively low sliding speed of 0.1 m/s minimized the effects of frictional heating and ensured that the topographical features resulting from wear were well preserved, allowing accurate 3D reconstruction and comparison.
Thus,
Figure 8 and
Figure 9 are presented as reference examples of the profilometry-based method used to measure wear track volume, from which the specific wear rate values (K) were obtained. Similar profilometry scans were performed for the other fiber configurations, and the results are shown in
Table 4. The visualizations highlighted the surface degradation patterns associated with different fiber contents and substantiated the quantitative findings related to wear rate and surface roughness, thus contributing to a more complete understanding of the composite behavior under frictional loading.
This approach allowed the study to maintain methodological uniformity and focus on the influence of fiber content on surface integrity and wear depth while avoiding variability introduced by changing test parameters. Therefore, the selected condition served both as a benchmark for comparative analysis and as a good practice reference for tribological surface characterization in polymer matrix composites. The correlation between profilometric data, SEM morphology, and wear rate confirmed the critical role of fiber content in improving surface integrity and reducing wear damage.
3.4. Results of Statistical Analysis
The main results of the statistical analysis for coefficient of friction, specific wear rate, and temperature are shown in
Table 5. The significant influence of the control factors on the targets was obtained in the case of
p-values lower than the significance level of 0.05.
The ANOVA results revealed that the most influential factor affecting COF was the fiber weight fraction (wf), contributing 42.78%, followed by the applied force, with 17.28%, and the interaction between wf and sliding speed (v), with 15.91%, as presented in
Table 5. Other interactions and the individual effect of sliding speed showed notably lower contribution levels to COF.
By contrast, for the specific wear rate (K), the sliding speed emerged as the dominant factor, with a contribution of 77.69%, followed by the applied load, which accounted for 10.12%. Interactions among the control factors had minimal impact on the wear rate, as also detailed in
Table 5.
When analyzing contact temperature (T), the most significant contributors were the sliding speed (32.79%), the applied force (26.74%), and the interactions of force–speed (F-v) and fiber content–force (wf-F), contributing 17.81% and 15.78%, respectively, as shown in
Table 5.
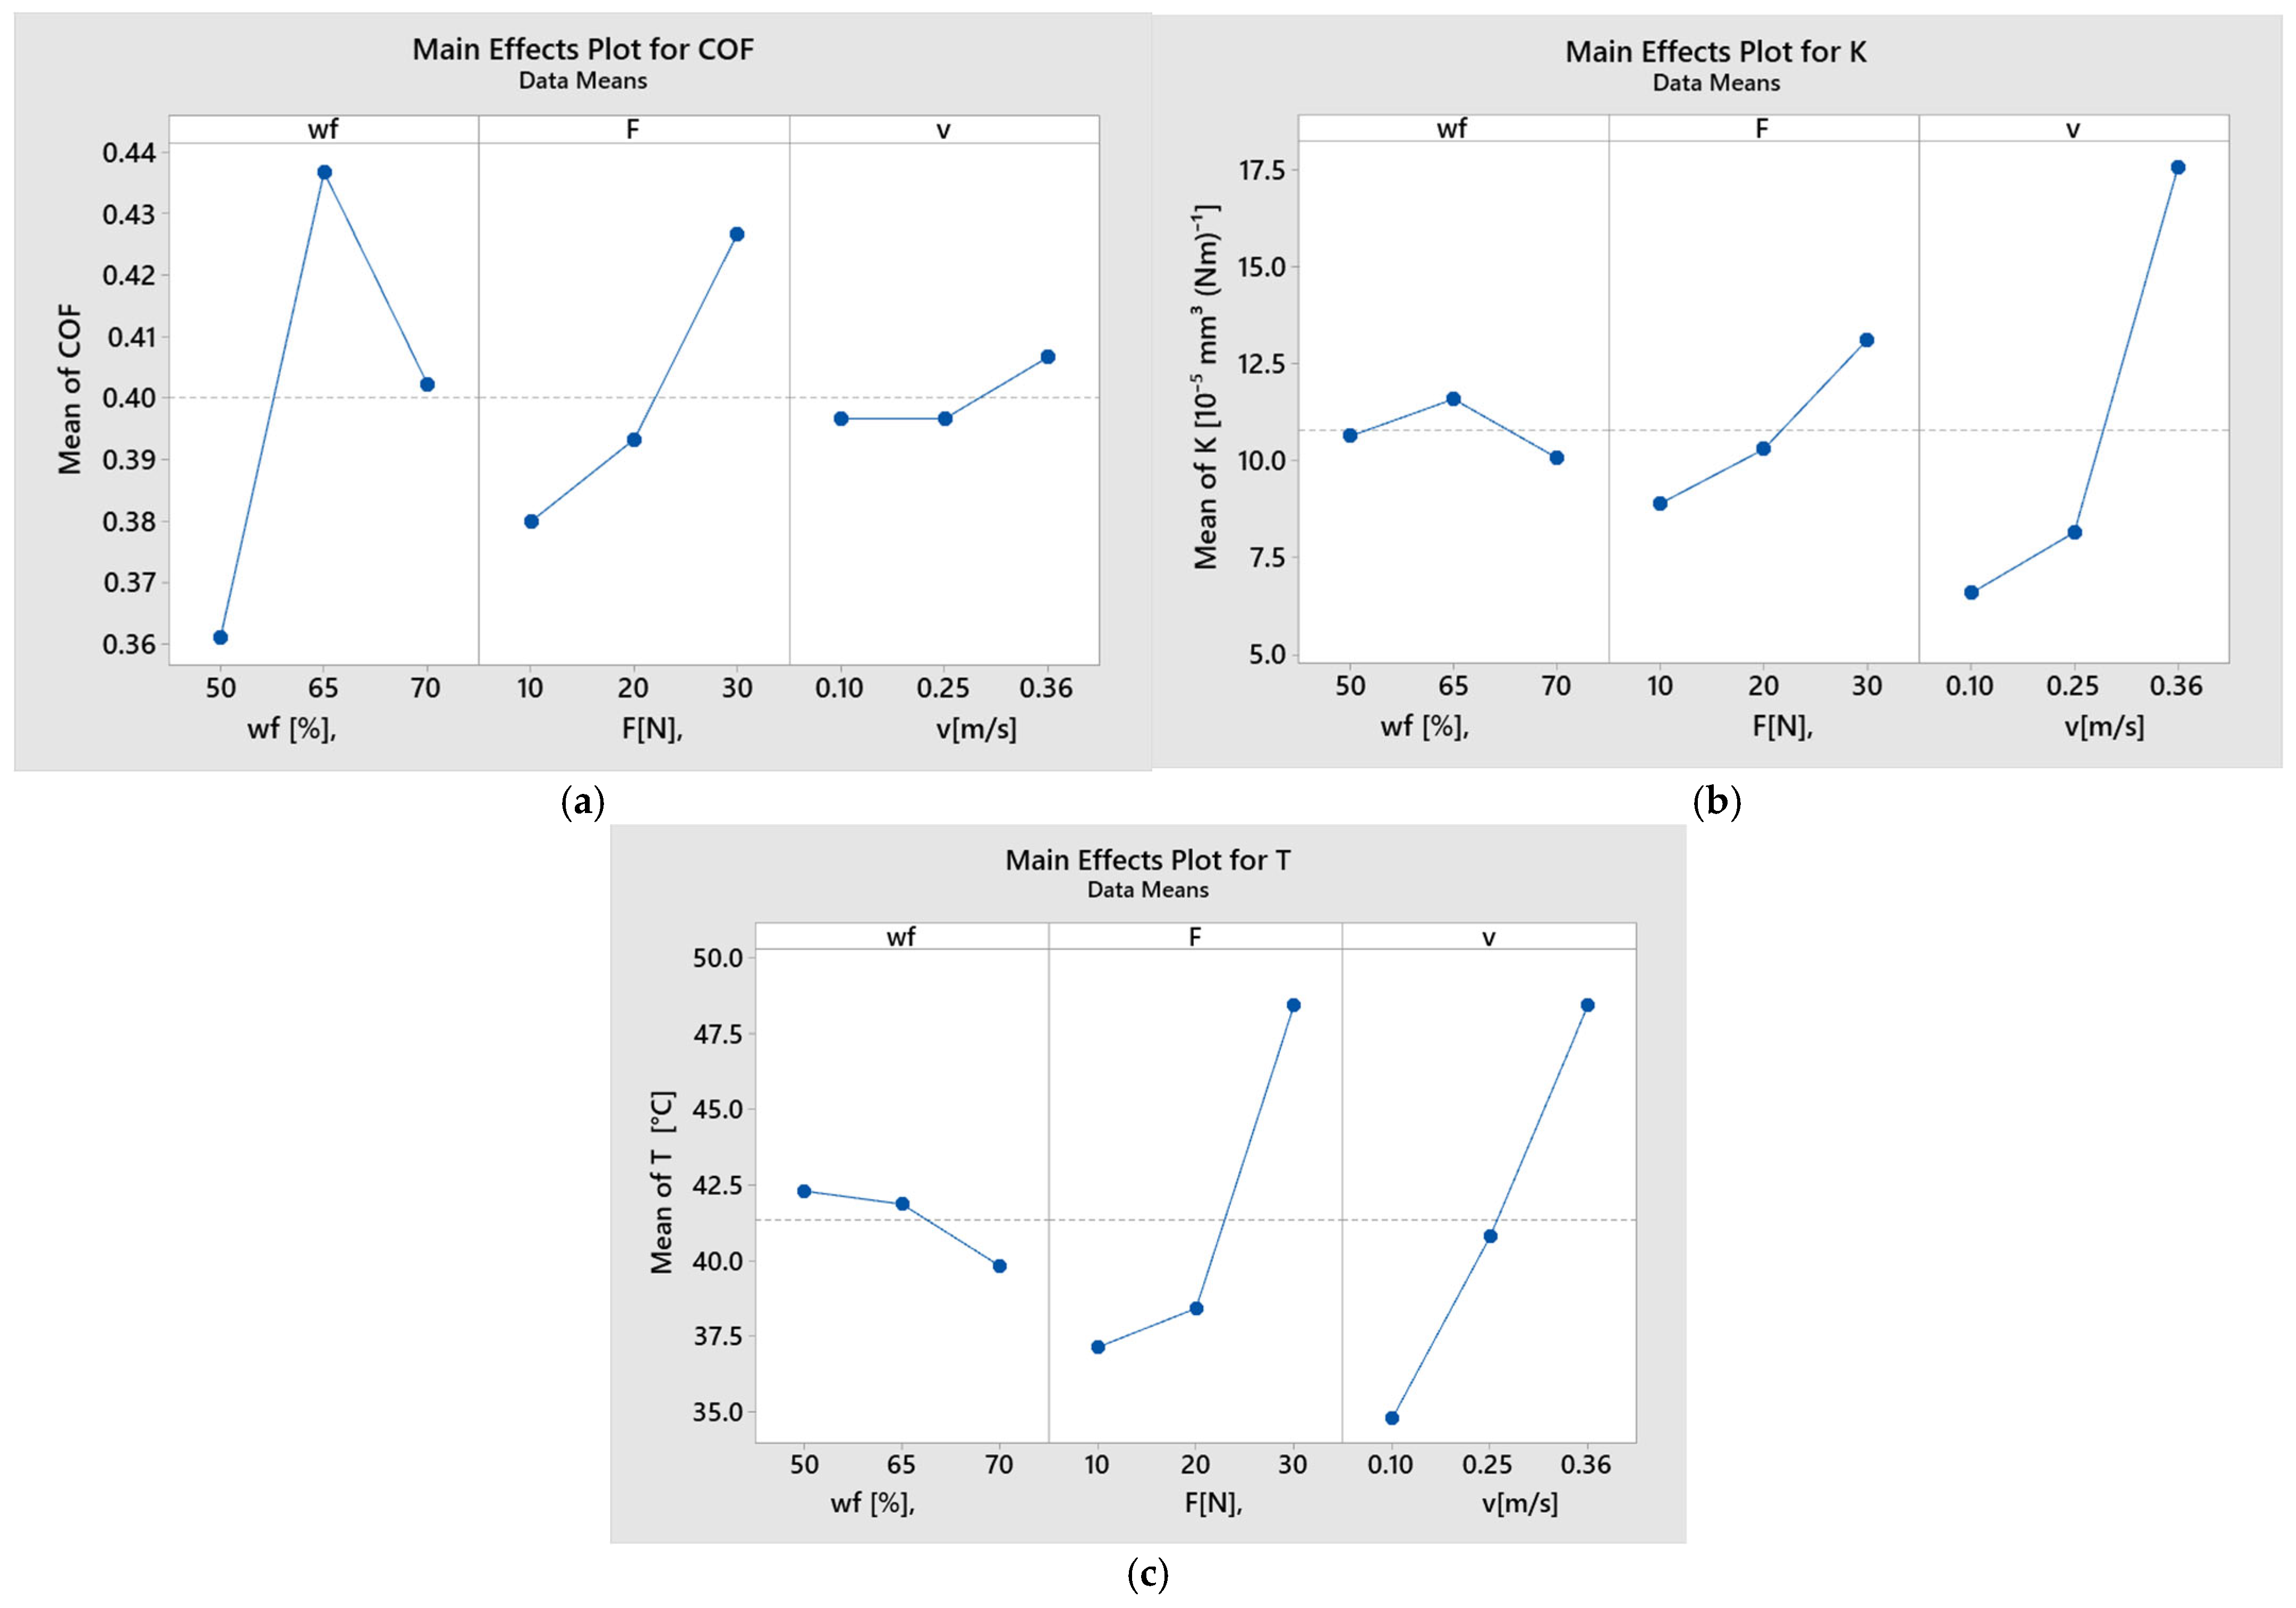
To further interpret these findings, graphical representations such as main effects plots, interaction plots, and interval plots were used to visualize the influence of each control factor on the three response variables: COF, K, and T.
According to the main effects plot for COF (
Figure 10a), the highest mean values were observed when wf was 65%, force was 30 N (level 3), and sliding speed was 0.25 m/s (level 2). A nonlinear trend was evident, where COF increased with fiber content up to 65% but slightly decreased when the fiber content reached 70%. Additionally, COF showed a rising tendency with increasing applied force, and a marginal increase was observed with increasing sliding speed. The lowest COF values corresponded to wf of 50%, F of 10 N, and v of 0.1 m/s.
In terms of specific wear rate,
Figure 10b illustrates that the lowest average values of K occurred at wf of 70%, F of 10 N (level 1), and v of 0.1 m/s (level 1). The wear rate exhibited a mild increase with increasing fiber content, followed by a decrease, suggesting a nonlinear relationship. The wear rate also rose with increasing load, and a significant jump in K was observed when the sliding speed increased from 0.1 m/s to 0.25 m/s.
For temperature, as shown in
Figure 10c, the maximum mean values were obtained at wf of 50%, F of 30 N (level 3), and v of 0.36 m/s (level 3). The temperature values exhibited a decreasing trend with increasing fiber content, which could be attributed to improved thermal conductivity and heat dissipation in the more densely reinforced composites.
As illustrated in
Figure 11a and supported by the data in
Table 5, the interaction between fiber weight fraction (wf) and sliding speed (v) had a notable impact on the coefficient of friction. By contrast, interaction effects were less prominent in the case of the specific wear rate, as seen in
Figure 11b, indicating a more independent influence of individual factors in this case.
For the temperature response, significant interaction effects were observed between wf and applied load (F), as well as between F and v, both of which are clearly depicted in
Figure 11c. These interactions suggested that the combined effects of mechanical loading and reinforcement level played a key role in thermal behavior during sliding.
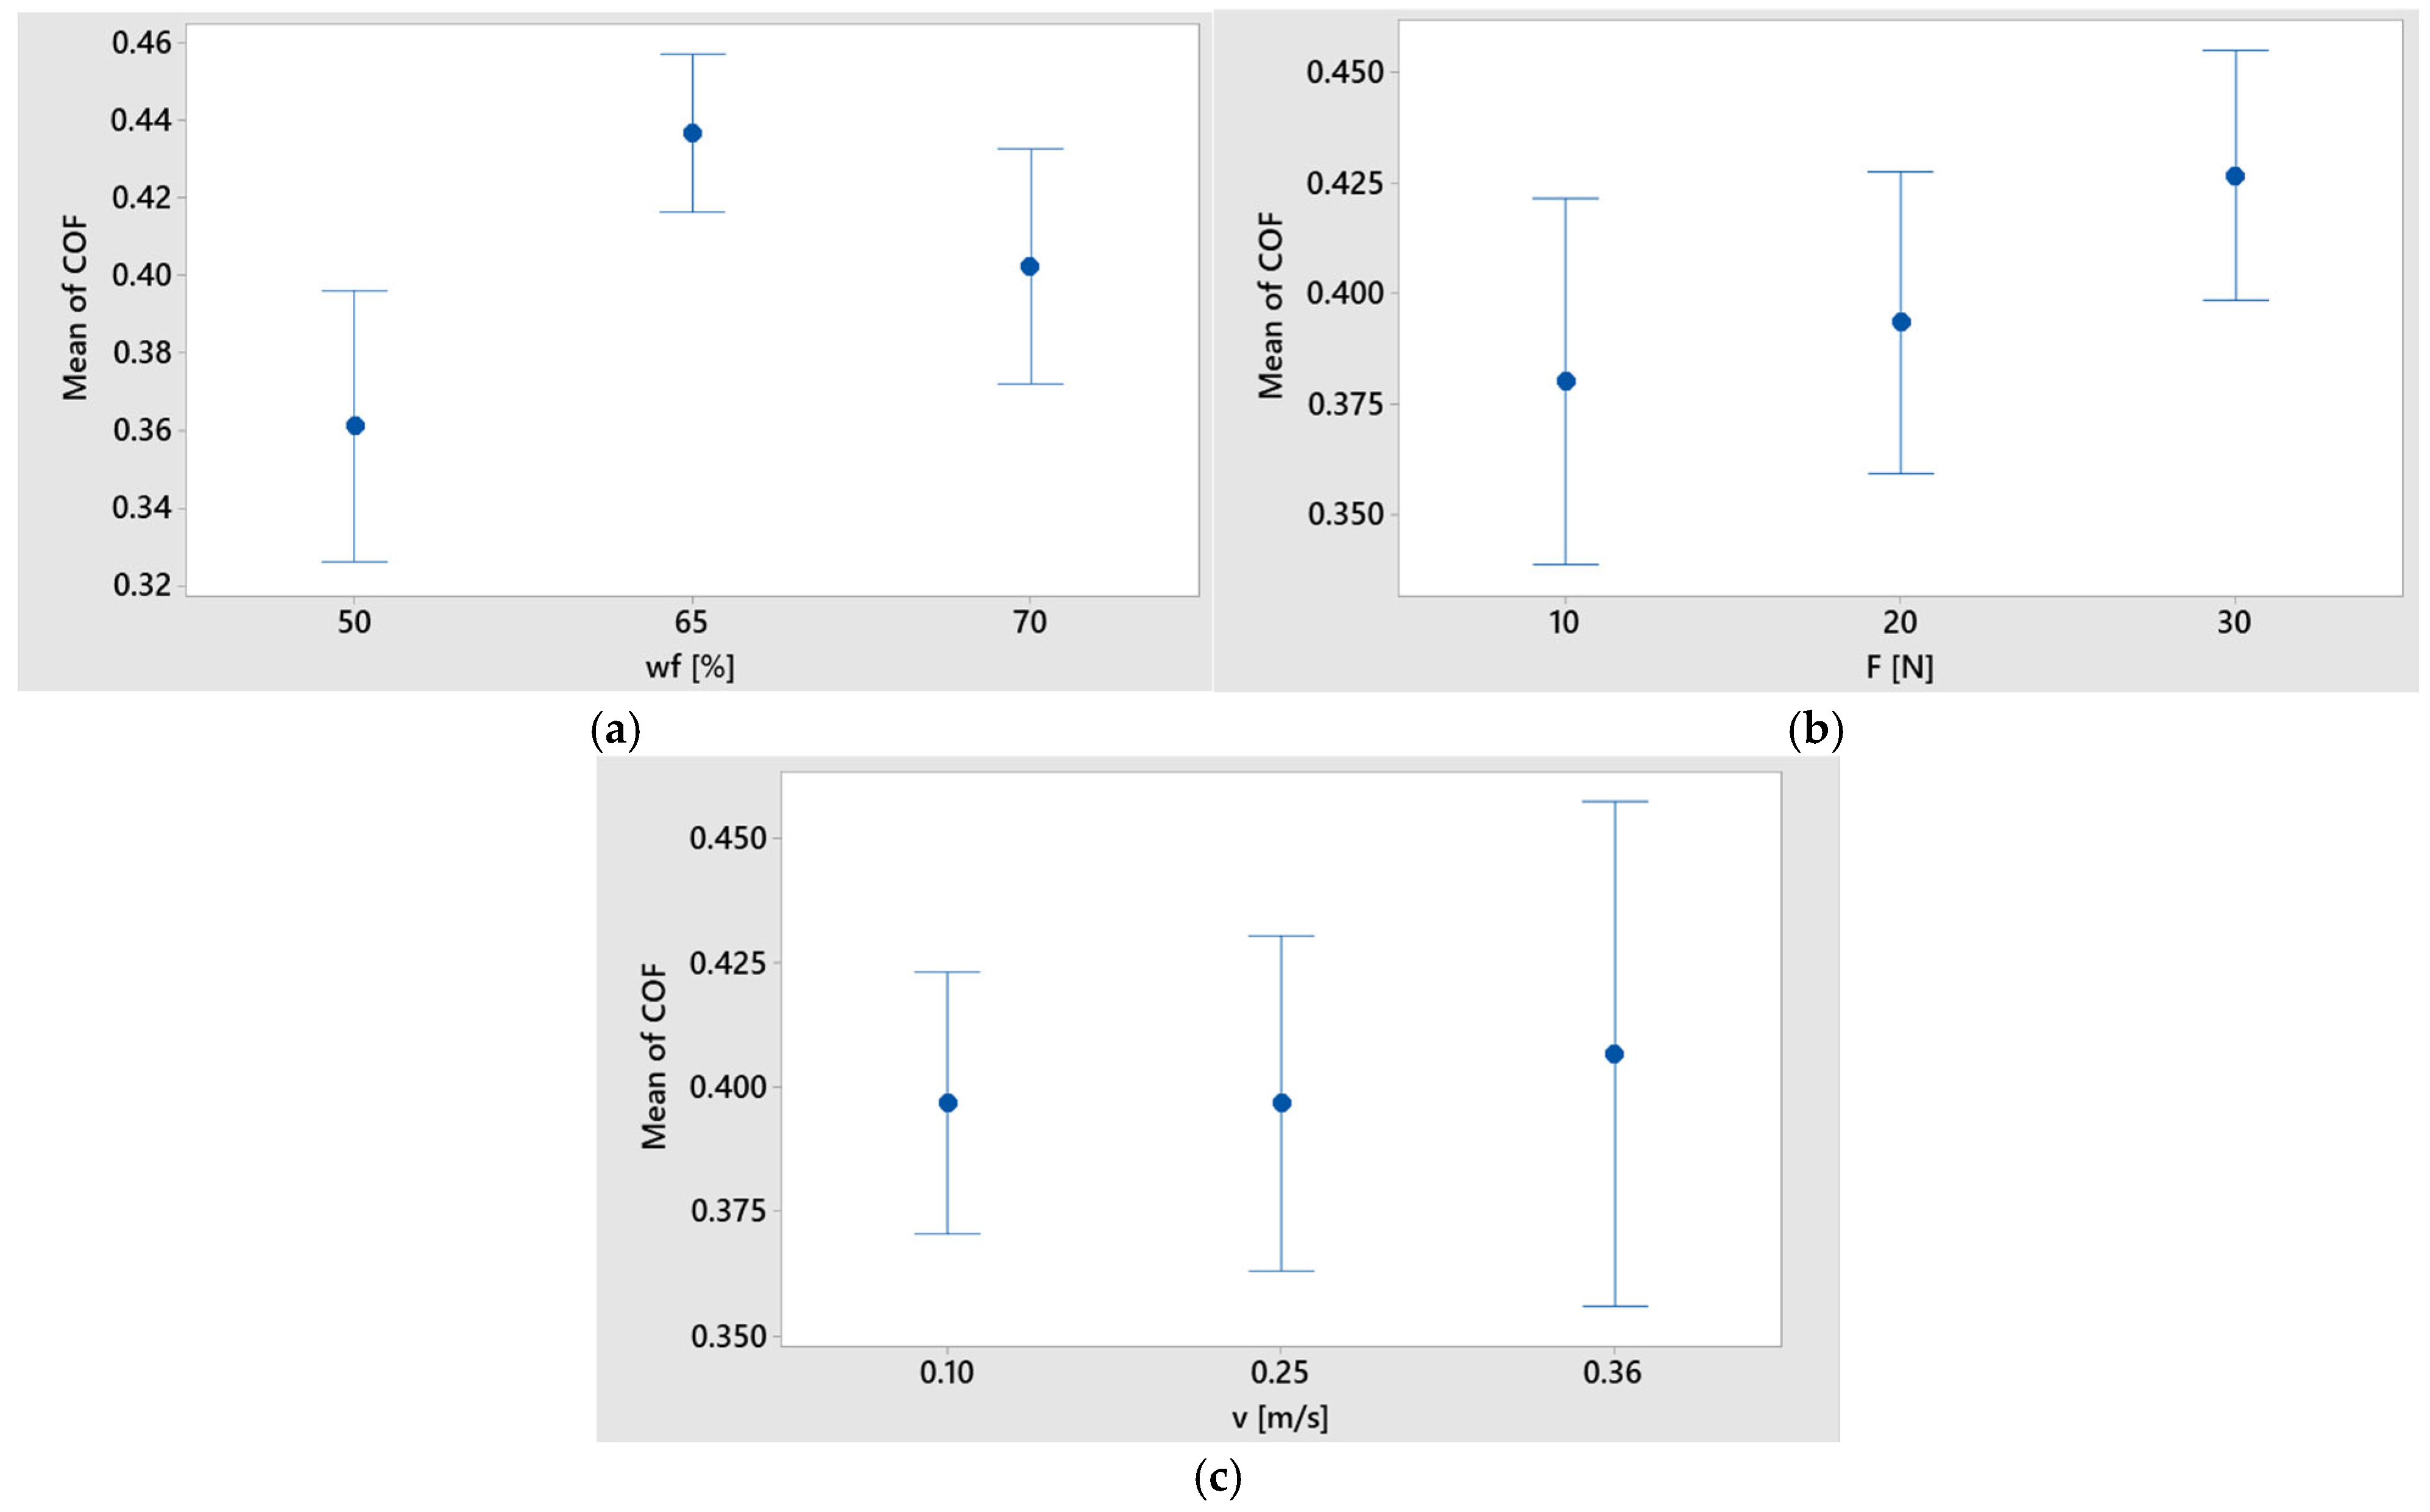
Figure 12 presents the interval plots, including standard error bars, illustrating the relationship between each control factor and the coefficient of friction. As shown in
Figure 12a, the mean values of COF for different levels of basalt fiber content (wf) were statistically distinct, indicated by the non-overlapping confidence intervals. This confirmed that wf had a significant effect on COF.
Conversely, in
Figure 12b,c, the interval bars corresponding to applied force and sliding speed displayed considerable overlap. This suggested that the observed differences in mean COF for these two factors were likely not statistically significant under the tested conditions.
The interval plots of factors versus specific wear rate are shown in
Figure 13. The difference between the means of K in sliding speed (level 3) were significant because the interval bars did not overlap with the others.
The interval plots of each factor versus temperature are shown in
Figure 14. The difference between the means for temperature in v was significant because the interval bars did not overlap for levels 1 and 3.
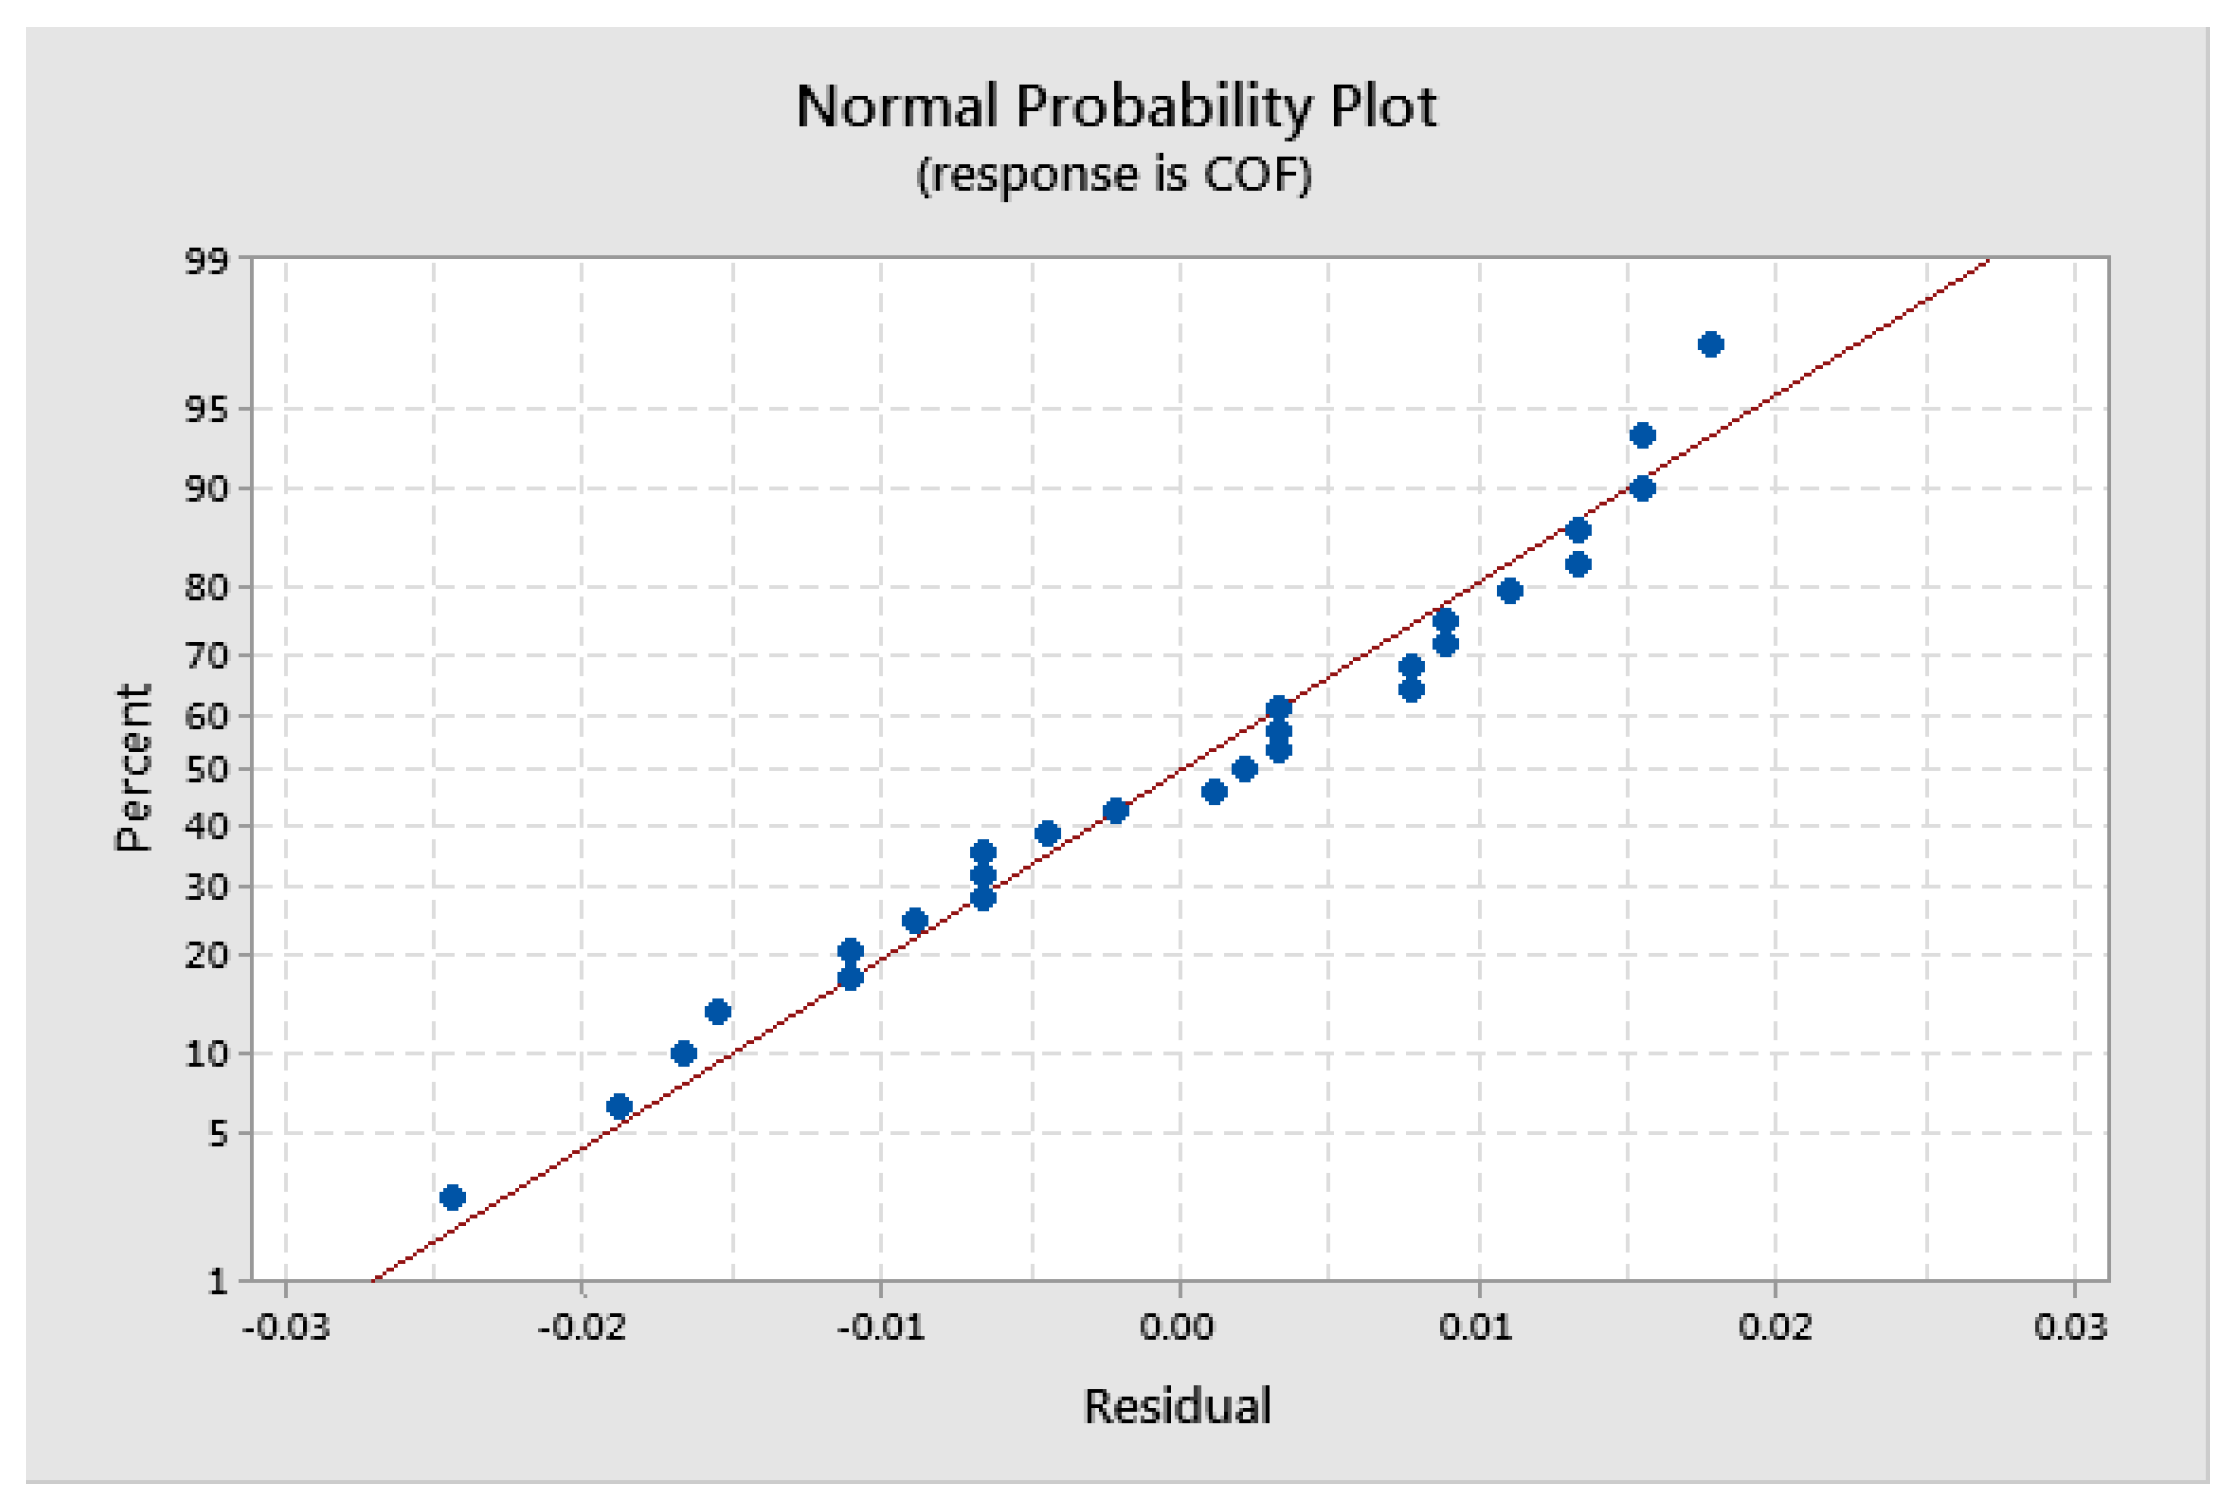
The normal probability plots generated for the residuals of the response variables, COF, specific wear rate (K), and temperature (T), demonstrated that the applied generalized linear model (GLM) was statistically appropriate and met the normality assumption, as supported by [
26]. The normal probability plot for COF is illustrated in
Figure 15, with similar distribution patterns observed for the residuals of K and T, confirming the validity of the model fits for all three outputs.
Figure 16,
Figure 17 and
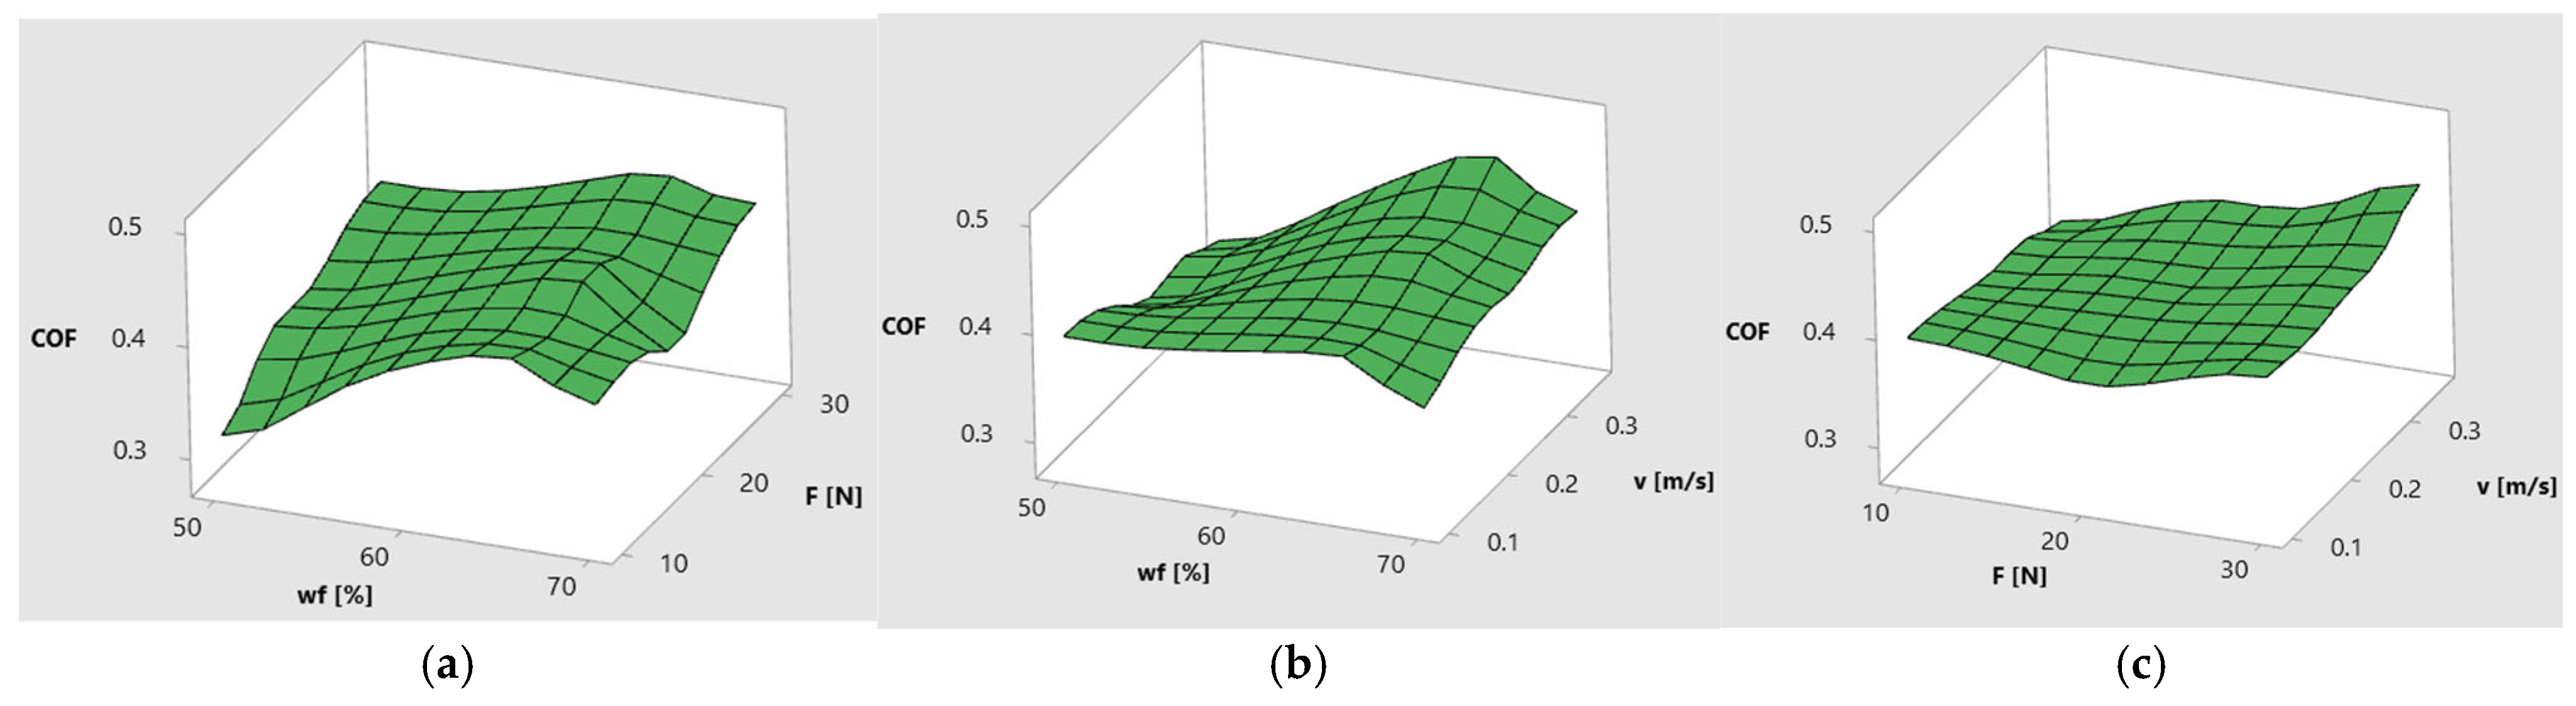
Figure 18 illustrate the response surface plots obtained from the statistical modeling, showing the influence of fiber weight fraction (wf), normal load (F), and sliding speed (v) on the three primary tribological outcomes: coefficient of friction (COF), specific wear rate (K), and contact temperature (T).
Figure 16 presents the variation in COF as a function of two-factor interactions. In
Figure 16a, COF increased with applied load, particularly at lower fiber content, where matrix-dominated surfaces exhibited greater instability during frictional contact. The lowest COF values were observed at 70% fiber content and low loads, suggesting that a dense fiber network promoted the formation of a stable tribofilm and ensured consistent frictional behavior.
Figure 16b indicates that COF was higher at lower sliding speeds and lower fiber contents, which may have been attributed to insufficient frictional heating and poor thermal regulation. At higher fiber fractions, COF remained more stable across all speeds.
Figure 16c shows that increasing both load and speed could slightly raise COF, although the effect was mitigated in highly reinforced composites.
Figure 17 illustrates the response surface plots for the specific wear rate (K) in relation to the main experimental factors: fiber weight fraction (wf), applied load (F), and sliding speed (v). These visualizations offer a comprehensive overview of how each factor pair influences the tribological performance of BFRP composites, highlighting the nonlinear behavior and interactions among control variables. In
Figure 17a, the wear rate was highest in the region with low fiber content (50%) and high load (30 N), confirming that matrix-rich composites suffered significant material loss under stress. As the fiber content increased, the wear rate decreased substantially, especially at low to medium loads. This indicated that when the composite was resin-dominant, the matrix was more susceptible to thermal softening and surface damage under mechanical stress. Conversely, the lowest wear values were concentrated in the region corresponding to high wf and low F, confirming that increased fiber content improved wear resistance by reducing matrix exposure and enhancing load support.
Figure 17b shows that at low fiber content and high speed, wear increased due to insufficient structural support and thermal degradation. By contrast, BFRP 70% maintained a low and stable wear rate even as speed increased.
Figure 17c reveals that wear increased sharply with both speed and load, particularly in weakly reinforced samples, whereas high fiber content moderated this effect.
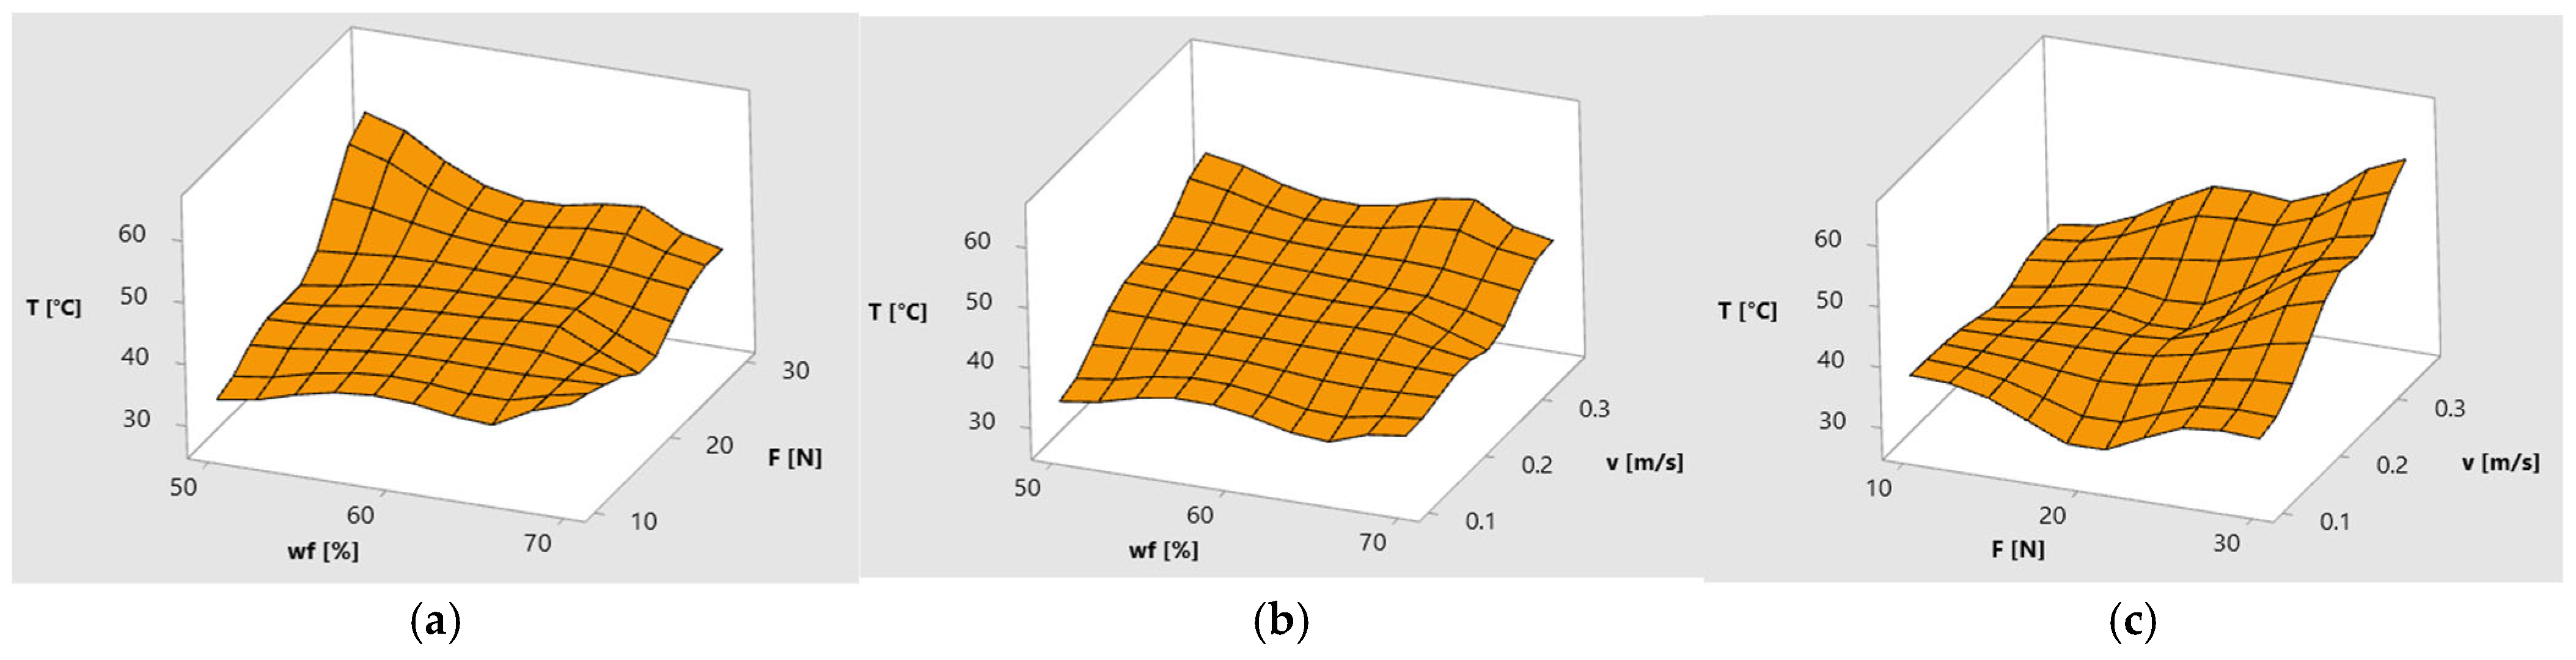
Figure 18 highlights the evolution of contact temperature. In
Figure 18a, the temperature was highest for the BFRP 50% composite under maximum load, where thermal conductivity was limited and heat accumulated rapidly. At 70% fiber content and low load, the contact temperature remained minimal, indicating effective thermal management.
Figure 18b reinforces this pattern: high speeds combined with low fiber content resulted in peak surface temperatures, while high fiber content provided thermal buffering even at elevated speeds.
Figure 18c confirms that both load and speed increased surface temperature, with the most severe thermal response observed under combined high load and speed conditions.
Overall, these surface response plots provided strong visual confirmation of the statistical results discussed earlier. They demonstrated that while sliding speed had the most substantial individual impact on wear and temperature, fiber reinforcement played a critical role in stabilizing tribological behavior across a range of operating conditions. The optimal performance, characterized by low friction, minimal wear, and moderate temperature rise, was consistently achieved at high fiber weight fractions (70%), under low to medium loads and moderate speeds.


