Abstract
The persistent issue of unemployment and the mismatch between graduate skills and labor market demands has drawn increasing attention from academics and educational institutions, especially in light of rapid advancements in technology. Emerging technologies such as Artificial Intelligence (AI) and Machine Learning (ML) offer valuable opportunities to analyze job market dynamics. In this work, we present a novel framework aimed at predicting graduate employability using current labor market data from Morocco. Our approach combines Multi-Criteria Decision-Making (MCDM) techniques with ML-based predictive models. AHP prioritizes employability factors and TOPSIS ranks skill demands—together forming input features for machine learning models. 2100 job listings obtained through web scraping, we trained and evaluated several ML models. Among them, the K-Nearest Neighbors (KNN) classifier demonstrated the highest accuracy, achieving 99.71% accuracy through 5-fold cross-validation. While the study is based on a limited dataset, it highlights the practical relevance of combining MCDM methods with ML for employability prediction. This study is among the first to integrate AHP–TOPSIS with KNN for employability prediction using real-time Moroccan labor market data.
1. Introduction
In today’s rapidly evolving industrial landscape, the job market is undergoing continuous and significant transformations, particularly driven by the Industry 4.0 revolution and the advancement of emerging technologies [1]. These developments have reshaped the employment environment, creating new and immediate demands for a workforce that is both skilled and adaptable [2]. Each Higher Educational Institution (HEI) holds a pivotal responsibility in preparing graduates with the competencies necessary to meet the requirements of the modern labor market [3]. In Morocco, youth unemployment [4] remains a critical concern, especially among ICT graduates, for whom skill mismatches and sector-specific volatility represent challenges [5]. Despite this, numerous studies have consistently emphasized a persistent gap between the skills that graduates possess and those expected by employers, raising serious concerns regarding the effectiveness of current educational strategies [6]. For HEIs to address this gap effectively, it has become essential to predict employability and accurately identify the skills that are most in demand at present. Doing so can enable institutions to refine their curricula, focus on enhancing student capabilities, and directly contribute to improving employment outcomes. Recent research strongly supports the idea that both technical expertise and soft skills—such as communication, adaptability, and problem-solving—must be developed in tandem to improve graduates’ chances of securing employment. In response to these challenges, this study presents an integrated framework that synergizes MCDM strategies and machine learning techniques for predicting graduate employability. Specifically, AHP is employed to prioritize evaluation criteria based on expert judgment, and TOPSIS is utilized to order skills according to market relevance. These classifications are then integrated into machine learning models as additional input features to strengthen their predictive power. By merging the AHP-TOPSIS approach with machine learning, this framework offers a robust methodology for employability prediction based on the current snapshot of job market demands. A real-world case study from Morocco was conducted, where job offer data were gathered through automated data extraction from Moroccan job portals. This information was utilized to train and validate different machine learning models. The predictive performances of ten different models were compared using standard evaluation metrics, based on standard performance metrics, such as precision, recall, F1-measure, and area under the ROC curve, to determine the most effective approach for employability prediction. The paper proceeds with the following structure. Section 2 reviews the concept of employability, exploring its definitions and the primary factors that influence it. Section 3 presents the evolution of machine learning applications in employability prediction and introduces the AHP-TOPSIS methodology for skill classification. Section 4 provides the case study details, including data collection, feature engineering, and the machine learning implementation. Section 5 delivers a comprehensive discussion, summarizing the benefits, limitations, and possible future directions of this research. The goal of this study is to support educators, policymakers, and employers in better aligning educational programs with the current demands of the labor market, ultimately aiming to improve graduate employability and reduce the existing skill mismatches.
2. Related Work
2.1. Employability Factors
Employability is widely recognized as a dynamic and multidimensional concept, yet its precise definition continues to generate debate among scholars and practitioners. It is defined by Choi-Lundberg et al. as the capacity to gain and retain formal employment [7], while Rothwell and Arnold describe it as the possession of the skills and attributes that enable one to secure and sustain desired work [8]. Some papers define employability as the satisfaction graduates derive from their jobs, emphasizing the alignment between educational outcomes and career fulfillment [9,10]. Other papers extend this view by emphasizing continuous adaptation, lifelong learning, personal dispositions, and the influence of broader social and contextual factors [11,12,13]. The issue of unemployment has been addressed from various perspectives in the literature, underscoring the importance of bridging the skills gap between educational institutions and labor market demands [7].
For the purpose of this study, we adopt a more comprehensive definition of employability as the result of a dynamic interaction among higher educational institutions’ strategic positioning and reputation, companies’ skills requirements and collaborative roles, students’ expectations and efforts, educators’ engagement, course relevance and innovative design, and the effective integration of digital resources [13,14]. This dynamic interaction collectively enhances graduates’ readiness and adaptability for the labor market. Indeed, according to Fossatti et al., employability is shaped by the interaction of multiple interconnected elements, which can be grouped into six primary categories: Higher Educational Institutions (HEIs), Companies, Students, Educators, Academic Programs, and Technological Tools (Figure 1) [14].
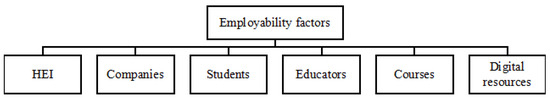
Figure 1.
Fossatti et al.’s employability major factors.
2.2. Higher Educational Institutions (HEIs)
HEIs play a central role in shaping graduate employability by balancing two major challenges: meeting labor market demands and addressing the expectations of new generations of students [12]. These challenges are reflected in two key sub-factors:
- Positioning: HEIs are increasingly evaluated based on national and international rankings, which are often driven by Key Performance Indicators (KPIs). Effective positioning enhances an institution’s competitiveness, reputation, and the perceived value of its degrees in the job market.
- Image: The reputation of an HEI significantly influences how prospective students and employers perceive its graduates. A positive institutional image attracts top-tier students and fosters stronger partnerships with industries.
2.3. Companies
Companies have a direct and significant impact on employability through two primary roles:
- Skill Specification: The evolving nature of industries and competitive pressures drive companies to constantly update their skill requirements. Identifying and communicating these needs to educational institutions is crucial to ensure graduates possess relevant competencies.
- Collaboration with HEIs: Strong industry–academia partnerships enable HEIs to align curricula with market demands. Such collaboration facilitates internships, co-creates projects, and enables development of practical skills essential for graduates’ success [12].
2.4. Students
Student-related factors influencing employability include:
- Expectations of New Generations: Modern students are increasingly selective when choosing HEIs, prioritizing institutions that offer career-oriented programs, experiential learning opportunities, and technological integration. These expectations vary significantly across regions and cultural contexts.
- Skill Acquisition: The range and quality of skills students acquire during their education vary even within the same institution. Factors such as individual motivation, engagement in extracurricular activities, and exposure to real-world experiences contribute to this variability [12].
2.5. Educators
The role of educators extends beyond knowledge dissemination. High-quality teaching, characterized by active engagement and direct interaction with students, significantly enhances learning outcomes and employability prospects. Recent studies highlight that positive student–educator relationships improve student satisfaction, increase motivation, and reduce dropout rates [14].
2.6. Courses
Courses serve as the primary medium through which knowledge and skills are transferred. Their design and delivery affect both learning experiences and employability outcomes [12]. Four key dimensions define effective course structure:
- What to Educate: Focuses on the relevance and adaptability of the curricula to meet industry needs.
- How to Educate: Emphasizes innovative teaching methods, including project-based learning and authentic assessments that simulate real-world tasks [15].
- Where to Educate: Incorporates both classroom learning and practical experiences such as internships and field projects.
- Who Should Educate: Advocates for the involvement of not only qualified educators but also industry professionals through guest lectures, workshops, and collaborative projects.
2.7. Digital Resources
In recent years, digital resources have emerged as transformative tools in higher education. While they cannot fully replace face-to-face instruction, digital platforms significantly enhance the learning experience and boost employability by providing students with flexible, accessible, and interactive learning opportunities. Numerous studies confirm how digital learning enhances academic outcomes and facilitates skill development [9,16].
3. Machine Learning and Employability
Machine Learning (ML), a subfield of Artificial Intelligence (AI), encompasses algorithms that automatically identify patterns in data and improve task performance without the need for explicit programming instructions. According to [17], exploring AI’s role in employability analysis remains a developing area of research. Until May 2025, only 76 documents have been published in English on this topic in the Scopus database, including 29 conference papers, 30 journal articles, three books, 11 book chapters, two reviews, and one editorial (Figure 2).
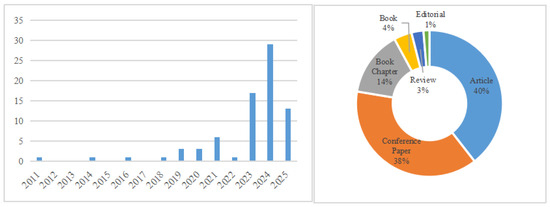
Figure 2.
Research evolution on “AI” and “employability” until 2025.
Among the 76 scholarly documents exploring employability trends influenced by Artificial Intelligence (AI), several studies underline how AI-driven changes are reshaping the labor market dynamics and employability perceptions [18,19]. Specifically, AI is described as a significant disruptor that compels educational institutions and companies to reevaluate and update their skill requirements, curricula, and teaching methodologies to align with emergent competencies [12].
Higher Educational Institutions (HEIs) play a pivotal role, with various studies emphasizing their responsibility in improving employability through strategic positioning, reputation management, and effective engagement with industry [20]. HEIs are increasingly expected to adapt quickly to market demands, leveraging key performance indicators (KPIs) and rankings to maintain relevance and competitive advantage.
Several documents highlight the essential role of digital resources and learning environments in improving student employability. These studies collectively argue that integrating digital learning not only enhances skill acquisition but also provides flexible and accessible learning experiences, preparing students effectively for the digital workplace [8].
Industry’s role in defining and communicating relevant skill sets is a recurring theme. Companies’ collaboration with HEIs through internships, co-created projects, and direct industry involvement in curriculum development is shown to significantly enhance practical skill acquisition, thereby boosting graduates’ employability prospects [19].
The role of educators also emerges as critical. High-quality teaching practices characterized by student engagement, interactive methodologies, and positive student–educator relationships significantly enhance learning outcomes, motivation, and employability [14,21].
In summary, the reviewed literature collectively underscores a holistic approach to employability enhancement involving integrated efforts by HEIs, industry stakeholders, educators, strategic use of digital resources, and dynamic course design.
This study investigates the employment landscape for computer science graduates in Morocco, emphasizing qualification criteria, prior experience expectations, and critical technical skills to support accurate employability forecasting.
Recent years have seen a notable surge in research focused on predicting graduate employability using Artificial Intelligence (AI) and machine learning techniques. This growing interest is closely linked to the broader transformation of labor markets driven by Industry 4.0, which has amplified the need for real-time, data-informed tools to evaluate how well graduates align with evolving job requirements. The number of studies addressing employability has steadily increased over the past four decades, with a sharp rise after 2004 (Figure 3) and an acceleration in AI-based approaches particularly starting from 2023 (Figure 4). While traditional approaches previously dominated, the current trend highlights growing academic interest in AI-powered employability assessment tools.
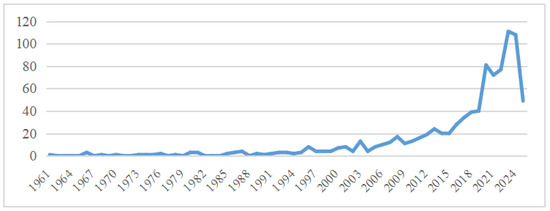
Figure 3.
Distribution of 908 publications on “employability prediction” per 3 years.
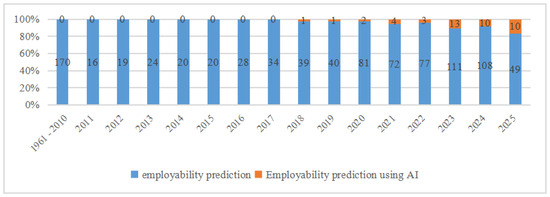
Figure 4.
Percentage of publications on “employability prediction” using AI vs. other methods.
3.1. Chronological Synthesis: Evolution of Employability Research and AI Integration
Table 1 provides a chronological overview of major advancements and related literature in employability prediction. Before 1990—Traditional Foundations: Early research (1961–1989) predominantly relied on qualitative and theoretical methodologies. Studies during this era emphasized foundational theories of employability, exploring employment outcomes through socio-economic contexts and educational frameworks, with limited or no mention of technological tools [22].

Table 1.
Evolution of employability research and AI integration.
1991–2009—Emergence of Quantitative Methods and Initial Technological Interest: During this period, there was a significant methodological shift towards quantitative approaches, incorporating structured surveys and statistical analyses. Early technological interest emerged, notably in assessing employability factors and initial use of computational tools. However, the explicit application of AI remained minimal and mostly theoretical or speculative [23].
2010–2015—Growth of AI Integration and Soft Skills Recognition: This period marked the growing acknowledgment of soft skills (e.g., communication, problem-solving) as critical employability attributes. Concurrently, initial integrations of AI were experimental, focusing on preliminary predictive modeling, using simpler AI methodologies like logistic regression and basic decision trees [24].
2016–2020—Expansion and Maturation of Machine Learning Applications: Research increasingly adopted advanced Machine Learning techniques, including Neural Networks and Random Forest algorithms, to analyze complex employability data from multiple sources, such as institutional datasets and online job market data. This period witnessed a notable rise in the number of studies employing AI to predict employment outcomes, driven by greater data availability and computing capabilities [25,26].
2021–Present—AI Mainstream in Real-Time Predictive Analytics: From 2021 onward, AI applications in employability research have become mainstream, extensively utilizing real-time data from platforms like LinkedIn and job portals. Research increasingly focuses on sophisticated predictive analytics to support policy-making, curriculum development, and individual employability strategies. The industry 4.0 context further accentuates the demand for agile, responsive AI-driven solutions to manage workforce skills gaps effectively [27].
AI becomes central in employability research. Machine Learning models such as KNN, Random Forest, and Neural Networks are now used to predict graduate-job matching. Data sources include job portals, LinkedIn profiles, and employer requirements scraped in real time. Research increasingly supports policy-making and curriculum design. Industry 4.0 dynamics have accelerated the need for responsive, data-driven solutions to bridge the skills gap.
3.2. Research Gap and Positioning
According to the literature, the convergence of Artificial Intelligence, labor market analytics, and higher education outcomes has become an increasingly relevant topic [8,18,20,28]. While previous studies laid the foundation for understanding employability factors and the evolving role of AI in the labor market, few have combined real-time job market analysis with granular Machine Learning models tailored to specific sectors, such as computer science graduates in regional tabor markets [29,30,31,32,33]. To address the persistent disconnect between graduate skills and labor market expectations, this study focuses on developing an AI-supported employability prediction framework tailored to the Moroccan context. While previous studies have applied Machine Learning (ML) techniques to predict employability outcomes, they often lack mechanisms to systematically prioritize skills based on local labor market relevance. In particular, few works have combined ML with Multi-Criteria Decision-Making (MCDM) methods to enhance interpretability and ensure contextual alignment with regional needs. To bridge this methodological gap, the proposed framework integrates sector-specific skill mapping, experience analysis, and degree requirements using a hybrid approach that combines the Analytic Hierarchy Process (AHP) and the Technique for Order Preference by Similarity to Ideal Solution (TOPSIS). These expert-driven MCDM techniques are employed to assign weights and rank job market indicators, which are then incorporated into a K-Nearest Neighbors (KNN) classifier for predicting graduate employability. By merging structured decision-making with data-driven modeling, this AHP-TOPSIS-KNN framework offers a novel and robust solution for aligning educational outcomes with sector-specific employment demands.
4. Methodology
The workflow of this study, as presented in Figure 5, was systematically designed to predict employability based on job market data. Initially, job postings from Moroccan websites were collected, including details such as job title, company, city, contract type, required skills, experience, soft skills, and language proficiency. The collected data were preprocessed by handling missing values, encoding categorical variables, selecting relevant features, and applying feature scaling. A Multi-Criteria Decision-Making (MCDM) approach using AHP-TOPSIS was applied to weigh and rank skills based on two criteria: the number of occurrences of each skill and their frequency in employable offers. The resulting skill rankings were incorporated into the dataset as a new feature called Global SkillScore. Subsequently, ten Machine Learning models were trained using the modified dataset, and their performances were evaluated based on accuracy, recall, F1-score, and ROC-AUC. Through this evaluation, the KNN classifier was selected as the best-performing model.
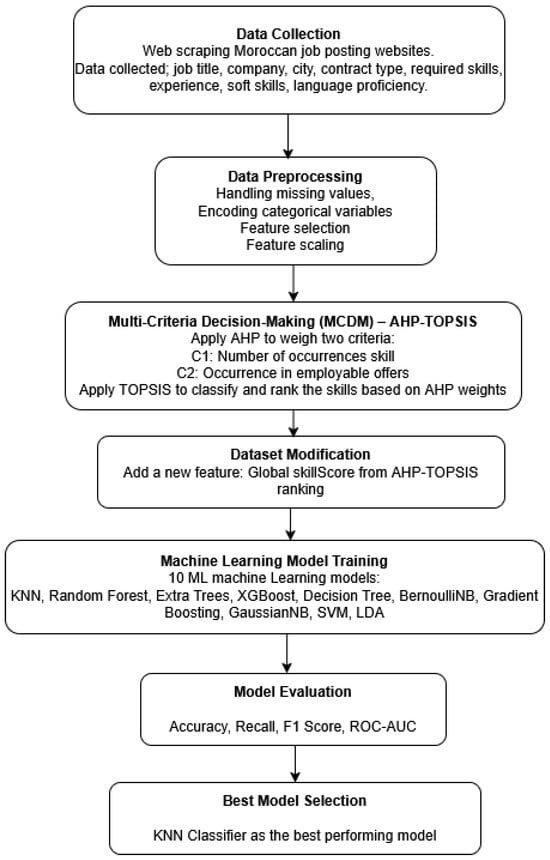
Figure 5.
AHP-TOPSIS-ML-based workflow for employability prediction.
4.1. Multi-Criteria Decision-Making (MCDM) Methods
Multi-criteria methods represent powerful decision-support tools for dealing with situations or systems where several criteria are used together at the same time, such as performance management, quality management, or even risk management. However, there are many MCDM methods. Here, we cite in this section, the most popular: AHP, ELECTRE, PROMETHEE, MACBETH, and TOPSIS [34,35]. Some methods are used only for classification, others are used for weighting the used criteria before classification, and there are some methods used for both classification and weighting. In the next section, we present a preview of these popular MCDM methods [34].
4.1.1. AHP
The Analytic Hierarchy Process (AHP), developed by Thomas Saaty, is a widely used multi-criteria decision-making (MCDM) method [36]. It helps analyze complex decisions by performing pairwise comparisons of criteria and alternatives, and by calculating priority weights through an algebraic process. Its popularity is due to its simplicity, flexibility, and broad applicability across domains, such as business, engineering, IT, education, and environmental management.
The AHP process involves four main steps:
- Define the decision hierarchy, including the goal, criteria, and alternatives.
- Pairwise comparison of elements using a scale (typically from 1 to 9) to assess their relative importance, resulting in a comparison matrix :
- Calculate numerical weights for each criterion using the Geometric Mean Method (GMM):
- Checking Consistency of Judgments: Since human judgments may introduce inconsistencies, AHP uses a Consistency Ratio (CR) to validate the reliability of the comparisons. The Consistency Index (CI) is first calculated using the formula:where is the largest eigenvalue of the matrix. The Consistency Ratio is then computed as:where is a standard value based on random matrices. A CR less than 0.1 indicates acceptable consistency. This step ensures the logical coherence of the assigned weights and strengthens the credibility of the decision-making process.
- Aggregate the weights to evaluate each alternative—though in this study, this step is replaced by the TOPSIS method.
4.1.2. ELECTRE
The ELECTRE methodology, developed by the French researcher Bernard Roy in 1971, includes a family of decision-making tools such as ELECTRE I, II, III, IV, IS…This approach compares alternatives based on a set of criteria using importance coefficients and veto thresholds. At its core, ELECTRE employs systematic pairwise comparisons to establish preference relations among alternatives. It uses concordance indices to measure the degree of agreement and discordance indices to capture the extent of disagreement between alternatives, thereby determining which options are more favorable.
4.1.3. PROMETHEE
The PROMETHEE (Preference Ranking Organization Method for Enrichment Evaluations) method, introduced by Jean-Pierre Brans in 1982, marked a significant advancement in the field of multi-criteria decision analysis (MCDA). PROMETHEE I generates partial rankings of alternatives, while PROMETHEE II extends the approach to provide complete rankings. Subsequent developments expanded its capabilities: PROMETHEE III introduced an interval-based approach to handle indifference in classifications, and PROMETHEE IV addressed problems involving continuous actions. Further extensions, such as PROMETHEE V, VI, and the Group Decision Support System (GDSS), were developed to tackle more complex decision-making scenarios.
4.1.4. MACBETH
In the early 1990s, researchers Carlos Bana e Costa and Jean-Claude Vansnick introduced MACBETH (Measuring Attractiveness by a Categorical Based Evaluation Technique), a multi-criteria evaluation methodology grounded in constructivist epistemology. The method employs interactive visual software (M-MACBETH) to build numerical interval scales that quantify the relative attractiveness of alternatives. Through a structured question-and-answer process, decision-makers perform pairwise comparisons to express qualitative judgments of attractiveness differences, categorized on a semantic scale ranging from C0 (no difference) to C6 (extreme difference).
4.1.5. TOPSIS
TOPSIS (Technique for Order Preference by Similarity to Ideal Solution) is a multi-criteria decision-making approach that identifies the optimal alternative by calculating the Euclidean distance between the existing alternatives of a positive hypothetical ideal solution and a negative hypothetical ideal solution (Anti-ideal).
As depicted in Figure 6, C1 and C2 correspond to Criterion 1 and Criterion 2, respectively. While Alternative A performs best on C2 but worst on C1, the opposite is true for Alternative E. With the positive and negative ideal solutions established, the Euclidean distance of each alternative from these reference points can be computed. The graph illustrates that Alternative C is closest to the ideal solution, whereas Alternative D is the farthest from the negative ideal. Based on these distances, TOPSIS determines the most preferable alternative.
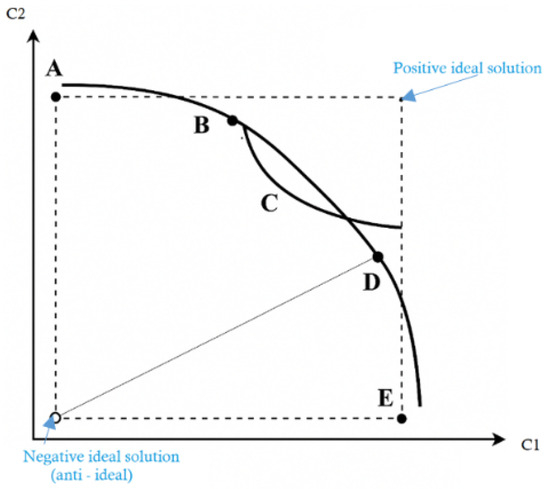
Figure 6.
Graphical representation of the TOPSIS example. Points A–E represent alternative options evaluated based on criteria and , with the positive and negative ideal solutions shown at the corners.
The following figure illustrates the TOPSIS steps for application [37].
Step 1: Construct normalized decision matrix
where and are the original and normalized scores of the decision matrix, respectively.
Step 2: Determine the positive ideal and negative ideal solutions
- Positive ideal solution ():
- where: (benefit criteria), (cost criteria)
- Negative ideal solution ():
- where: (benefit criteria), (cost criteria)
Step 3: Calculate the separation measures for each alternative
- Separation from positive ideal alternative:
- Separation from negative ideal alternative:
Step 4: Calculate the relative closeness to the ideal solution ()
- Select the alternative with closest to 1.
4.1.6. MCDM Choice
In this study, our objective was to identify job market trends across various domains, such as computer science, industry, and law. This task is inherently complex, as each domain involves multiple evaluation criteria with varying levels of importance. To address this challenge, we employed Multi-Criteria Decision-Making (MCDM) methods. However, the unequal importance of criteria led us to adopt a hybrid MCDM approach, designed to both assign appropriate weights and classify alternatives effectively. Specifically, we implemented a hybrid method that combines the Analytic Hierarchy Process (AHP)—known for its robust weighting capabilities—with the Technique for Order Preference by Similarity to Ideal Solution (TOPSIS), which excels in classification.
This methodological choice was made following a comparative analysis of the most widely used MCDM techniques (Table 2). AHP not only enables accurate weighting but also includes a Consistency Ratio (CR) check to ensure logical coherence in the pairwise comparisons. Meanwhile, TOPSIS ranks alternatives based on their distance from the ideal solution, as detailed in the preceding section. Together, these methods allowed us to effectively identify domain-specific job market trends within the Moroccan context.
Table 2.
Qualitative comparison between five known MCDM methods.
5. Materials, Methods, and Results
This study aims to identify job market trends in Morocco using a hybrid MCDM framework, integrating AHP for prioritization and TOPSIS for ranking alternatives based on ideal similarity. This combined strategy supports structured assessment across various job market categories. Furthermore, ten distinct Machine Learning algorithms were applied to estimate graduate employability outcomes using data acquired through automated extraction from Moroccan job portals. The AHP-TOPSIS method facilitated relevant feature selection, and these were used to train and evaluate ML models. The performance of each model was assessed using key evaluation metrics including precision, recall, F1-score, and ROC-AUC, to determine the most suitable predictive model for graduate employability (Figure 7).
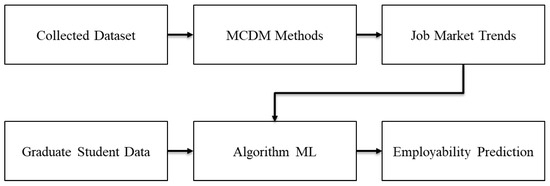
Figure 7.
Hybrid framework.
The experiments in this study were conducted using the Anaconda platform with the Python programming language. Key libraries included Pandas for data management and manipulation, NumPy for numerical operations and array handling, and Scikit-learn for implementing Machine Learning models and performing dataset preprocessing. Additionally, Matplotlib and Seaborn were utilized for data visualization and graphical representation. The computations were performed on a personal computer equipped with an Intel Core i5 processor running at 3.30 GHz and 6 GB of RAM.
5.1. Data Collection and Preparation
The dataset used in this study was collected through web-scraping techniques from Moroccan recruitment websites with job postings. This method served as a secondary data collection approach, allowing the extraction of publicly available job-related information without direct interaction with the data sources.
A total of 2100 job postings were compiled and processed to ensure data relevance and consistency. These were scraped in January 2025 and cover job offers posted over the previous three months in three leading Moroccan recruitment platforms, using only publicly accessible job offers.
To illustrate the dataset’s structure, a sample excerpt is provided in Table 3 and Table 4 within the data preprocessing subsection. This sample presents key attributes such as job title, company ID, city, required experience, selected technical skills, and contract type. Post-scraping, we performed data cleaning to remove duplicate entries, incomplete records, and non-technical job advertisements to retain only relevant job offers for analysis.
Table 3.
Sample of Job Postings Dataset (basic job information).
Table 4.
Sample of Job Postings Dataset (experience and technical skills).
Furthermore, descriptive statistics and categorical distributions were generated based on the collected dataset to offer a comprehensive understanding of the Moroccan job market landscape. In the Job Postings dataset (Table 3), the term ingenieur refers to an engineer, CDI is a permanent contract, and stage refers to an internship.
In this study, we followed a straightforward and structured process, as illustrated in Figure 8.

Figure 8.
Phases of dataset processing.
Data Collection via Web Scraping: A custom real-time web-scraping algorithm was developed to extract data from selected Moroccan job offer platforms. The collected data include the job title, a descriptive summary of the role, and the sector of activity, such as automotive, electronics, law, computer science or agriculture. It also captures the function of the role within the organization (e.g., finance, marketing, engineering), as well as the city where the job is located. Additionally, the required educational level is specified, often ranging from technical diplomas to advanced university degrees. In terms of experience, the dataset provides both qualitative and quantitative details. The experience category indicates whether the employer is seeking a junior, mid-level, or senior profile, while the columns exp_min, exp_max, and exp_moyenne give numeric values for the expected years of experience. These features allow for fine-grained analysis of how education and experience levels interact with employability. Altogether, this foundational information sets the stage for combining contextual, educational, and professional indicators in predictive modeling. In addition to contextual and background details, the dataset captures a diverse set of skills and job requirements. Binary indicators were used to represent technical skills requirements (e.g., Python, SQL, Machine Learning, Deep Learning, Power BI, Excel, Tableau, Cloud Computing) allowing precise identification of technological demands. It also covers soft skills like communication, leadership, time management, adaptability, and teamwork, which are increasingly valued by employers. Language proficiency is tracked through variables like French and English, reflecting the linguistic expectations for each position. Additional fields indicate working conditions, such as the availability of remote work and the type of contract offered (e.g., permanent, temporary or just an internship). The classification variable is the contract offered (distinguishing between offers leading to full employment and those limited to internships). The objective was to predict the employment outcome (full-time job versus internship) based on the candidate’s profile. To collect real-time job offer data, we developed a custom web-scraping script that targeted three major Moroccan job portals: ReKrute, AmalJob, and Emploi.ma, extracting only publicly available job postings. No personal or sensitive user data were accessed or stored. This data collection complied with the national law on data protection (Loi 09-08), ensuring that ethical standards regarding transparency, anonymity, and data privacy were fully respected.
Handling Missing Values: Missing values in the city and number of posts columns were replaced with the most frequent value, and missing values in the experience column were replaced by the mean.
Categorical Data Processing: Categorical variables (degree, city, post title, target) were processed using LabelEncoder and OneHotEncoder.
Feature Selection: The most relevant features were identified by evaluating their statistical association with the target label.
Feature Scaling: Applied to normalize features with varying value ranges.
Data Splitting: The dataset was split into training and testing sets for model evaluation.
5.2. AHP-TOPSIS
As explained, this research employs a combined MCDM strategy, integrating AHP for prioritizing factors and TOPSIS for ranking alternatives based on similarity to an optimal solution. AHP is employed to weight two key criteria (the total number of skill occurrences, and their frequency in employable offers) while TOPSIS is used to classify and rank the skills, thereby identifying emerging job market trends, as illustrated in Figure 9: Integrated AHP-TOPSIS Methodology for Job Market Trends Analysis and Ranking. Consensus was reached using a two-round Delphi survey where experts rated criteria independently, and final weights were computed only after convergence of opinions (CR < 0.1). The integrated AHP-TOPSIS methodology begins with a ranking, proposing a systematic structure for the model (Figure 10), in which the AHP is used to assign weights to the selected criteria: C1 (total occurrences of a skill) and C2 (occurrences in employable job offers). Subsequently, a pairwise comparison matrix (Table 5) was constructed based on expert judgments. A questionnaire was distributed to eight experts (four academic researchers and four practitioners), who rated the relative importance of each criterion using the preference scale shown in Table 6.
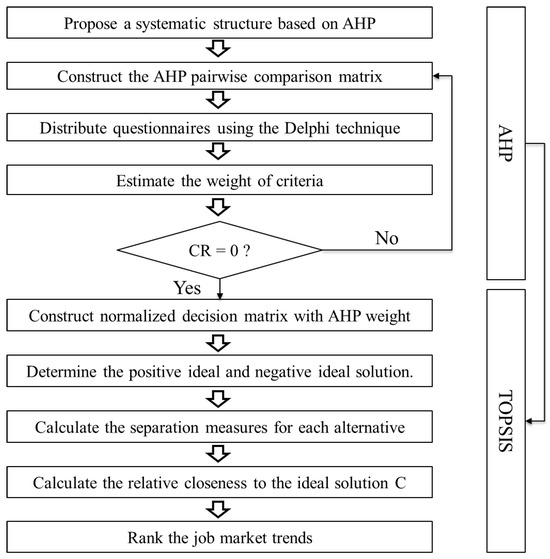
Figure 9.
Integrated AHP-TOPSIS methodology for job market trends analysis and ranking.
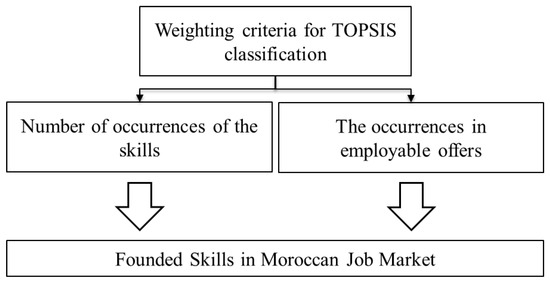
Figure 10.
Weighting criteria for TOPSIS classification.
Table 5.
AHP pairwise comparison matrix.
Table 6.
The used scale for comparison between criteria.
Pairwise Comparison Matrix: The pairwise comparison matrix constructed for criteria and is presented in Table 5.
Comparison Scale: To establish pairwise comparisons among the evaluation criteria, the study has adopted a fundamental scale of preference that quantifies the relative importance between two factors. As presented in Table 6, this scale has ranged from 1 (equal preference) to 9 (extreme preference), with reciprocal values assigned to represent the inverse comparison. This structured scale has provided a systematic basis for constructing the comparison matrix in the AHP process.
The aggregated pairwise comparison matrix resulted in final weights of 25% for C1 and 75% for C2, with a consistency ratio (CR) of 0, indicating high consistency in expert evaluations. After weighting the criteria based on AHP, we used those weights in TOPSIS in order to classify skills by domain and identify the trends of each domain using an example of an application based on computer science skills. The next phase involved the application of TOPSIS, which began with the normalization of the decision matrix (as described in the following equation), followed by multiplication of each normalized value by its corresponding AHP-derived weight.
In this step, the framework establishes the positive ideal solution and the negative ideal solution for each criterion. In our situation, we seek to maximize both occurrences in all offers and occurrences in employable offers. With this in mind, the framework selects the maximum value for each criterion, as illustrated in Table 7.
Table 7.
Example of result without weight.
Based on the Euclidean distance in the third step, the separation from the ideal () and anti-ideal () solutions was calculated for each alternative (6) and (7).
The AHP weighted results of skill occurrences in both job offers and employable offers are shown in Table 8.
Table 8.
AHP weighted results of skill occurrences in job offers and employable offers.
The normalized values of skill occurrences in job offers and employable offers are presented in Table 9.
Table 9.
Normalized skill occurrences in job offers and employable offers.
Finally, we evaluate the skills according to their relative proximity to the ideal solution (Equation (8) ). The separation measures and the relative closeness to the ideal solution for each skill are summarized in Table 10.
Table 10.
Separation measures and relative closeness to the ideal solution for each skill.
Using this hybrid framework, AHP-TOPSIS (Figure 11) allows us to achieve two important goals:
- Identify the Moroccan job market trends of each domain.
- Enhance the dataset by introducing a new variable Global_SkillScore, which represents the aggregated value obtained by combining the weighted criteria with the skills present in each offer. This new feature makes the dataset particularly useful for developing employability prediction models, as it incorporates the impact of market trends into the prediction process. While preliminary trends from the GlobalSkillScore correlate with high-frequency skill demands, future work will include statistical validation against employer surveys and established skill indices.

Figure 11.
Hybrid analysis framework.
Figure 11.
Hybrid analysis framework.

The final skill rankings obtained from the AHP-TOPSIS model closely align with the observed demands of the Moroccan labor market. Skills such as Python, JavaScript, and SQL not only scored highest in our MCDM framework but were also frequently associated with full-time job postings. This convergence between expert opinion and job board data reinforces the practical value of our approach for guiding employability-focused curriculum reforms and training programs.
5.3. Machine Learning Algorithms
This experiment aims to predict graduate employability based on the enhanced dataset incorporating AHP-TOPSIS outputs. In order to achieve this classification goal, we applied 10 Machine Learning models of classification: BernoulliNB [43,44], GradientBoostingClassifier GBC [45], GaussianNB, Support Vector Classification SVC [46], KNN classifier [47], Linear Discriminant Analysis LDA [48], RandomForestClassifier [49], Extra Trees Classifier [50], XGBClassifier [51], and Decision Tree Classifier [52].
The performance of the ten Machine Learning models is further evaluated using the following metrics:
- Accuracy measures the proportion of correct predictions out of all predictions made.
- Recall evaluates how well the model identifies actual positives among all relevant instances.
- F1-score balances precision and recall through their harmonic mean.
- The ROC-AUC curve is also used to assess each model’s ability to distinguish between the two classes.
The dataset contained a moderately imbalanced distribution of classes (approximately 60% full-time jobs and 40% internships). To account for this, we reported class-sensitive metrics, such as F1-score and recall, in addition to accuracy. The dataset was stratified during splitting, and models were evaluated for their ability to handle this imbalance. The consistently high performance of the KNN classifier across all three metrics indicates robust classification despite this imbalance. This experiment aims to identify the most suitable Machine Learning model for the proposed case study. As presented in Table 9, the KNN classifier outperformed all other models, achieving an accuracy of 99.71%, a recall of 99.81%, and an F1-score of 98.76%. Figure (Table 9) further highlights the model’s strong ability to accurately distinguish between employability and internship outcomes. These results demonstrate that the KNN classifier is well suited for employability prediction in the context of this study.
KNN Model Confusion Matrix. Figure 12 presents the confusion matrix for a representative fold of the KNN classifier, selected from the cross-validation process as it closely reflects the overall performance metrics reported in Table 11 (accuracy: 99.71%, recall: 99.81%, F1-score: 98.76%). The classification task involves distinguishing between full-time job offers (positive class) and internships (negative class).
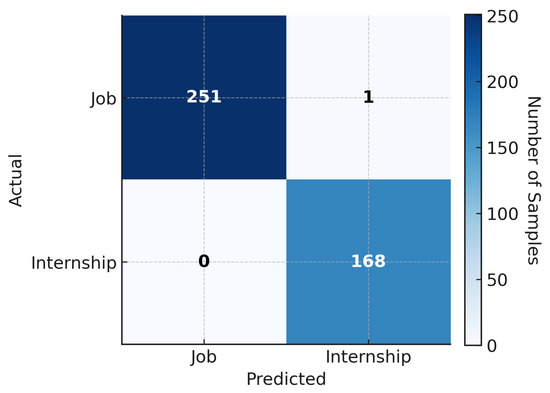
Figure 12.
Confusion matrix for a representative fold of the KNN classifier.
Table 11.
Comparative performance metrics of evaluated classification models.
As shown, the classifier correctly identified 251 out of 252 actual full-time job offers, with only one case misclassified as an internship (False Negative). Likewise, all 168 internship offers were correctly classified, yielding zero false positives. The dark diagonal cells represent correct predictions, while the very light off-diagonal cells indicate minimal misclassification.
This result reflects excellent sensitivity and perfect specificity. The absence of false positives confirms the model’s reliability in distinguishing internships from jobs, while the single false negative demonstrates its near-perfect capability in detecting full-time positions. These findings align closely with the performance metrics reported in Figure 12, providing visual confirmation of the KNN model’s robustness in handling a moderately imbalanced dataset (approximately 60% jobs vs. 40% internships).
6. Discussion
The present study employed a hybrid Multi-Criteria Decision-Making (MCDM) and Machine Learning (ML) methodology to predict graduate employability within the Moroccan context, where graduates face growing difficulties in accessing the job market amid the rapid changes driven by the Industry 4.0 revolution [53,54]. To address this issue, the study integrated Multi-Criteria Decision-Making (MCDM) techniques—specifically, the Analytic Hierarchy Process (AHP) and the Technique for Order of Preference by Similarity to Ideal Solution (TOPSIS)—with Machine Learning algorithms to develop a robust employability prediction framework [38,39]. The proposed hybrid model, as depicted in Figure 7 and Figure 9, utilized expert judgments through the Delphi technique, ensuring high consistency with a CR value of 0. Through the careful application of AHP-TOPSIS, the study effectively identified and prioritized skills that are currently in high demand in the job market, based on two critical criteria: the frequency of skill occurrence in all job offers and the frequency of skill occurrence specifically in employable positions. It is important to emphasize that the analysis in this study focused strictly on the current state of the Moroccan job market, without attempting to track changes in skill requirements over time. The structured data processing pipeline, as illustrated in Figure 8, played a fundamental role in ensuring data quality and consistency. Real-time web-scraping techniques were employed to collect a comprehensive dataset that captured a wide range of job market features, including technical and soft skills, experience requirements, and educational qualifications. To prepare the dataset for analysis, missing data were handled using established imputation techniques, while categorical variables were carefully encoded using LabelEncoder and OneHotEncoder methods. Additional preprocessing steps such as feature selection, data normalization, and splitting the dataset into training and testing subsets further contributed to the robustness of the predictive models. While stratified sampling and class-sensitive metrics were used in this study, future work could explore the application of oversampling techniques, such as SMOTE, to further mitigate class imbalance.
Among the ten Machine Learning algorithms evaluated, the K-Nearest Neighbors (KNN) classifier delivered the best performance, achieving an accuracy of 99.71%, a recall of 99.81%, and an F1-score of 98.76% (see Figure 13 and Table 11). These results confirm the effectiveness of the feature engineering and selection strategies applied in this study, as well as the consistency of the collected dataset. Although the 99.71% accuracy was achieved using 5-fold cross-validation, this high performance may still carry risks of overfitting. Future work should incorporate independent holdout sets and additional metrics to validate model generalization. Other models, including RandomForestClassifier, ExtraTreesClassifier, XGBClassifier, and DecisionTreeClassifier, also demonstrated strong performance, although they did not surpass the predictive accuracy of the KNN classifier. In contrast, the GaussianNB model performed considerably worse, indicating that it may not be well suited for this particular prediction task. While ROC curves were used in this study to evaluate classification performance, future work may consider using precision–recall curves as a complementary metric, especially given the presence of class imbalance in the dataset. Despite the encouraging results, several limitations of the study should be acknowledged. The concept of employability used in this research is relatively narrow, focusing solely on whether a graduate is likely to secure a job or an internship, without considering broader qualitative factors such as job satisfaction, career development, or employment stability. The current binary classification (job vs. internship) limits the scope of employability assessment. Future research should consider underemployment and job quality as additional indicators to provide a more comprehensive understanding of graduate outcomes. As emphasized by Rothwell and Arnold [55,56], employability is a complex, multidimensional construct that cannot be fully captured through simple employment outcomes alone. Additionally, the selection of skills incorporated into the dataset is subject to interpretation and may vary depending on the research context, methodology, or geographical focus [57,58,59]. These considerations raise important questions regarding whether a universal set of employability skills can be defined across different contexts or whether such skills should be weighted and selected based on specific domains. These open questions provide valuable directions for future studies. Moreover, this research establishes a foundation for the development of intelligent decision-support systems that can assist Higher Education Institutions (HEIs) and policymakers in aligning academic programs with job market needs. Future work may include expanding the dataset to incorporate qualitative data sources such as employer surveys or interviews, applying deep learning techniques to capture more complex patterns, or developing a real-time AI-driven platform to support dynamic labor market analysis.
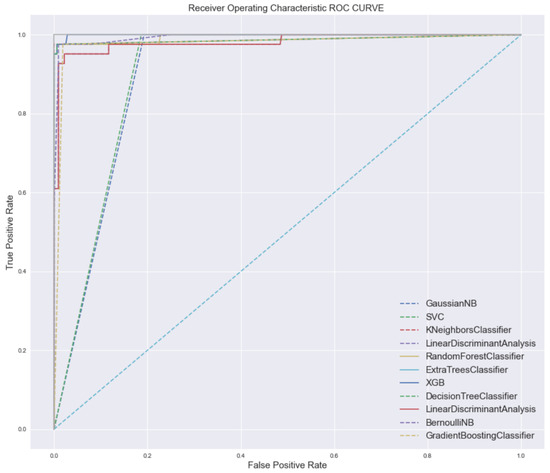
Figure 13.
ROC AUC curves demonstrating the classification performance of the applied models.
A higher AUC value reflects superior classification performance (Figure 13). The ROC AUC measures the model’s discriminative ability by evaluating how effectively it differentiates between class 0 and class 1 predictions. Thus, an increased Area Under the Curve indicates a stronger overall capability of the model in distinguishing between the two classes.
7. Conclusions
This study presents a hybrid analytical framework that combines Multi-Criteria Decision-Making (MCDM) methods with Machine Learning (ML) algorithms to predict graduate employability in the Moroccan job market. By focusing on the most frequently required skills in current employment offers, the approach provides timely and actionable insights for Higher Education Institutions (HEIs) and policymakers, enabling them to better align academic programs with labor market demands. The integration of the Analytic Hierarchy Process (AHP) and the Technique for Order Preference by Similarity to Ideal Solution (TOPSIS) enabled effective weighting and classification of key employability criteria, which were then incorporated into Machine Learning models to enhance predictive performance.
In addition to the Moroccan labor market analysis, comparisons with labor markets in Tunisia and Egypt assess the broader applicability of the findings. Similar to Morocco, both Tunisia and Egypt face challenges with youth unemployment and a mismatch between graduate skills and labor market demands. While Morocco’s job market is heavily focused on software development and data analytics, Egypt emphasizes engineering and technical roles, reflecting its industrial economy. Tunisia, by contrast, exhibits a demand for business management and marketing skills, particularly in the services sector. These regional variations underscore the importance of tailoring employability predictions and curricula to meet local market needs, while reinforcing the broader applicability of the proposed framework in addressing regional labor market challenges.
Unlike longitudinal studies examining the evolution of skill requirements, this research analyzes the present-day job market through real-time data collected via web scraping. The framework effectively identified and prioritized skills currently valued by employers, demonstrating high predictive accuracy—particularly through the K-Nearest Neighbors (KNN) classifier. The incorporation of AHP-TOPSIS-based skill classification into machine learning models proved invaluable in enhancing prediction quality. It is important to note that the study uses a relatively focused definition of employability, based on job or internship offers. Broader aspects of employability, such as job satisfaction, long-term career advancement, or employment stability, were not explored. Additionally, the findings are specific to the Moroccan job market and reflect conditions at the time of data collection, without accounting for potential future shifts in skill demands.
These findings can inform targeted curriculum reforms, prioritize digital skills, and foster HEI–industry partnerships to bridge the education–employment gap. The proposed framework offers a valuable decision-support tool that can assist educators and institutional leaders in making informed adjustments to academic programs in response to labor market needs. While this study offers a robust performance evaluation of the KNN classifier using 5-fold cross-validation, future research may consider incorporating an independent holdout set to further assess the model’s generalization capability. The reported 99.71% accuracy, derived from stratified cross-validation, reflects stable performance across multiple folds. Given the distributed nature of this evaluation, confusion matrices for individual folds were not included, as they may not fully represent the model’s overall behavior. Instead, future work will focus on enhancing interpretability through additional metrics such as class-wise precision, recall, and F1-score under holdout-based evaluation settings. Additionally, further improvements can be made by experimenting with deep learning architectures (e.g., LSTM or Transformer-based models) to capture more complex patterns. Expanding the dataset to include qualitative sources, such as employer surveys or interviews, would provide richer insights into the skills most valued in the labor market.
Future research may also explore the use of longitudinal, time-stamped datasets for genuine trend analysis over time, helping to capture evolving skill demands. The development of real-time AI-driven platforms to continuously monitor and analyze labor market trends will also be pursued.
Finally, exploring the explainability of deep learning models using tools like SHAP and LIME could offer valuable insights into why certain skills are prioritized, enhancing model interpretability for stakeholders such as HEIs and policymakers.
By extending this work and incorporating these elements, we anticipate creating a more robust, dynamic system for predicting graduate employability in real time, while better adapting the system to meet the evolving needs of regional labor markets.
Author Contributions
Conceptualization, data curation, formal analysis, funding acquisition, investigation, methodology, project administration, resources, software, supervision, validation, visualization, writing—original draft, H.N.; Investigation, methodology, project administration, H.Q.; formal analysis, resources, supervision, validation, M.B.A.; Writing—review and editing, S.J.C.; Conceptualization, methodology, validation, A.M. All authors have read and agreed to the published version of the manuscript.
Funding
This research received no external funding.
Institutional Review Board Statement
Our data collection process complied with national regulations, specifically, Loi 09-08 (Law No. 09-08 on the Protection of Individuals with Regard to the Processing of Personal Data) (Available online: https://www.dgssi.gov.ma/fr/loi-09-08-relative-la-protection-des-personnes-physiques-legard-du-traitement-des (accessed on 7 July 2025)).
Informed Consent Statement
Not applicable.
Data Availability Statement
Data are available upon request from the corresponding author.
Conflicts of Interest
The authors declare no conflicts of interest.
Abbreviations
The following abbreviations are used in this manuscript:
| AHP | Analytic Hierarchy Process |
| TOPSIS | Technique for Order Preference by Similarity to Ideal Solution |
| KNN | K-Nearest Neighbors |
| MCDM | Multi-Criteria Decision-Making |
| ML | Machine Learning |
References
- Azahari, L.M.; Ahmad, F.A.; Ramlee, N.S. Industry 4.0 and its Implication on the Job Market: A Conceptual Review. Asia Proc. Soc. Sci. 2023, 11, 37–41. [Google Scholar] [CrossRef]
- Ra, S.; Shrestha, U.; Khatiwada, S.; Yoon, S.W.; Kwon, K. The rise of technology and impact on skills. Int. J. Train. Res. 2019, 17, 26–40. [Google Scholar] [CrossRef]
- Chiuariu, D.A.; Babaliga, M.O.; Paleu, V. TIE-M Plus: Alignment of Higher Education with Labor Market Demands. In Proceedings of the 2024 IEEE 30th International Symposium for Design and Technology in Electronic Packaging (SIITME), Sibiu, Romania, 16–18 October 2024; IEEE: Piscataway, NJ, USA, 2024; pp. 87–90. [Google Scholar] [CrossRef]
- Nouib, H.; Lamii, N.; El Bouzekri El Idrissi, Y.; Moumen, A. Using a Machine Learning Model for Employability Prediction: A Moroccan Case Study. In Proceedings of the 6th International Conference on Networking, Intelligent Systems & Security, Larache, Morocco, 24–26 May 2023; pp. 1–5. [Google Scholar] [CrossRef]
- Sellamy, K.; El Farouki, M.; Sabri, Z.; Nouib, H.; Qostal, A.; Fakhri, Y.; Moumen, A. Exploring the IT’s Needs in Morocco Using Online Job Ads. In Proceedings of the International Symposium on Automatic Control and Emerging Technologies, Singapore, 4–7 July 2023; Springer Nature: Singapore, 2023; pp. 665–677. [Google Scholar] [CrossRef]
- Hegde, S.; Kavade, P. Bridging Skill Gap: A Study on Industry Expectations vs. Graduate Competencies. Int. J. Multidiscip. Res. 2025, 7, 44225. [Google Scholar] [CrossRef]
- Choi-Lundberg, D.; Douglas, T.; Bird, M.L.; Coleman, B.; Greenwood, M.; Martin, R.; Prior, S.; Saghafi, F.; Roehrer, E.; Waddingham, S.; et al. Employability learning and teaching research: A twenty year structured narrative review. J. Univ. Teach. Learn. Pract. 2024, 21, 1–38. [Google Scholar] [CrossRef]
- Ren, C.; Li, B.; Binti Mustafa, Z.; Zhang, G. Exploring Digital Learning Environments to Improve Employability Skills of Vocational College Students: The Mediating Role of Artificial Intelligence Applications. In Proceedings of the 2024 9th International Conference on Intelligent Information Processing (ICIIP 2024), Bucharest, Romania, 21–23 November 2024; Association for Computing Machinery: New York, NY, USA, 2024; pp. 162–168. [Google Scholar] [CrossRef]
- Draissi, Z.; Rong, Y.; Suliman, M.A.E. Employability and Education Mismatch in the Moroccan Urban Workplace. SAGE Open 2023, 13, 21582440231217890. [Google Scholar] [CrossRef]
- Lanchava, E.; Kacharava, T. The Alignment of Individual and Organization Strategies in the Career Management Ecosystem. Proc. Azerb. High Tech. Educ. Inst. J. 2025. [Google Scholar] [CrossRef]
- Cheng, M.; Adekola, O.; Albia, J.; Cai, S. Employability in Higher Education: A Review of Key Stakeholders’ Perspectives. High. Educ. Eval. Dev. 2022, 16, 16–31. [Google Scholar] [CrossRef]
- Nouib, H.; Qadech, H.; Benatiya Andaloussi, M.; Moumen, A. Exploring the Dimensions of Employability: A Qualitative Approach. Societies 2025, 15, 51. [Google Scholar] [CrossRef]
- Nouib, H.; Andaloussi, M.; Moumen, A. Factors of Employability Prediction: Conceptual Framework. Contemp. Readings Law Soc. Justice 2024, 16, 1023–1035. [Google Scholar]
- Fossatti, P.; Jabbour, C.J.C.; Ratten, V.; Pereira, G.M.; Borchardt, M.; Milan, G.S.; Eberle, L. What Do (Should) We Know to Leverage Students’ Employability and Entrepreneurship? A Systematic Guide to Researchers and Managers. Int. J. Manag. Educ. 2023, 21, 100788. [Google Scholar] [CrossRef]
- Gilmore, A.; McAuley, A.; Miles, M.P.; Pattinson, H. Four Questions of Entrepreneurial Marketing Education: Perspectives of University Educators. J. Bus. Res. 2020, 113, 189–197. [Google Scholar] [CrossRef]
- Burvill, S.; Owens, S.; Organ, K. The Digital Explosion: It’s Impact on International Student Achievement. Int. J. Manag. Educ. 2022, 20, 100585. [Google Scholar] [CrossRef]
- Mezhoudi, N.; Alghamdi, R.; Aljunaid, R.; Krichna, G.; Düştegör, D. Employability Prediction: A Survey of Current Approaches, Research Challenges and Applications. J. Ambient. Intell. Humaniz. Comput. 2023, 14, 1489–1505. [Google Scholar] [CrossRef]
- Lissitsa, S.; Ben-Porat, C.S. Lifelong Learning Across Generations: AI Competence and Perceived Employability in Generations X, Y, and Z. In Proceedings of the 17th Annual International Conference of Education, Research and Innovation (ICERI 2024), Seville, Spain, 11–13 November 2024; IATED Academy: Valencia, Spain, 2024; pp. 621–625, ISBN 978-84-09-63010-3. [Google Scholar] [CrossRef]
- Pandey, A.; Dhand, S. The Future Consequences of Artificial Intelligence in Context to Employability in Resilient Industry. In The Framework for Resilient Industry: A Holistic Approach for Developing Economies; Emerald Publishing Limited: Bingley, UK, 2024; pp. 163–175. [Google Scholar]
- Ndhlovu-Nemaxwi, N.J.; Goosen, L. Advancing Student Employability through Higher Education Using Artificial Intelligence (AI) Applications: Studying Open Distance E-Learning in South Africa. In Prioritizing Skills Development for Student Employability; IGI Global: Hershey, PA, USA, 2024; pp. 120–141. [Google Scholar]
- Sharma, P.; Lilhore, U.K. A better approach for students’ employability indexing using machine learning. In Proceedings of the 2023 10th International Conference on Signal Processing and Integrated Networks (SPIN), Noida, India, 23–24 March 2023; Institute of Electrical and Electronics Engineers (IEEE): Piscataway, NJ, USA, 2023; pp. 795–799. [Google Scholar]
- Sigelman, C.K.; Elias, S.F.; Danker-Brown, P. Interview Behaviors of Mentally Retarded Adults as Predictors of Employability. J. Appl. Psychol. 1980, 65, 67–73. [Google Scholar] [CrossRef] [PubMed]
- Tan, K.; Rahman, N.A.A.; Lim, C.K. A Comparative of Predictive Model of Employability. Int. J. Innov. Technol. Explor. Eng. 2019, 8, 375–378. [Google Scholar]
- Dubey, A.; Mani, M. Using Machine Learning to Predict High School Student Employability—A Case Study. In Proceedings of the 2019 IEEE International Conference on Data Science and Advanced Analytics (DSAA), Washington, DC, USA, 5–8 October 2019; IEEE: Piscataway, NJ, USA, 2019; pp. 604–605. [Google Scholar] [CrossRef]
- Gatbonton, T.M.C.; Aguinaldo, B.E. Employability predictive model evaluator using PART and JRIP classifier. In Proceedings of the 6th International Conference on Information Technology: IoT and Smart City (ICIT 2018), Hong Kong, China, 29–31 December 2018; Association for Computing Machinery (ACM): New York, NY, USA, 2018; pp. 307–310. [Google Scholar]
- Harari, M.B.; McCombs, K.; Wiernik, B.M. Movement capital, RAW model, or circumstances? A meta-analysis of perceived employability predictors. J. Vocat. Behav. 2021, 131, 103657. [Google Scholar] [CrossRef]
- Liu, H.; Mao, M.; Li, X.; Gao, J. Model interpretability on private-safe oriented student dropout prediction. PLoS ONE 2025, 20, e0317726. [Google Scholar] [CrossRef]
- Mgaiwa, S.J. Fostering Graduate Employability: Rethinking Tanzania’s University Practices. SAGE Open 2021, 11, 1–14. [Google Scholar] [CrossRef]
- Bhattacherjee, A.; Kukreja, V. Employability Prediction: A Machine Learning Model for Computer Science Students. In Emerging Trends in Computer Science and Its Applications; CRC Press: Boca Raton, FL, USA, 2025; pp. 299–303. [Google Scholar] [CrossRef]
- Casuat, C.D.; Castro, J.C.; Evangelista, D.C.P.; Merencilla, N.E.; Atal, C.P. StEPS: A Development of Students’ Employability Prediction System Using Logistic Regression Model Based on Principal Component Analysis. In Proceedings of the 2020 IEEE 10th International Conference on System Engineering and Technology (ICSET), Shah Alam, Malaysia, 9 November 2020; IEEE: Piscataway, NJ, USA, 2020; pp. 17–21. [Google Scholar] [CrossRef]
- Celine, S.; Dominic, M.M.; Devi, M.S. Logistic Regression for Employability Prediction. Int. J. Innov. Technol. Explor. Eng. 2020, 9, 2471–2478. [Google Scholar] [CrossRef]
- Cruz, M.E.L.T.; Encarnacion, R.E. Analysis and prediction of students’ academic performance and employability using data mining techniques: A research travelogue. Eurasia Proc. Sci. Technol. Eng. Math. 2021, 16, 117–131. [Google Scholar] [CrossRef]
- ElSharkawy, G.; Helmy, Y.; Yehia, E. Employability Prediction of Information Technology Graduates using Machine Learning Algorithms. Int. J. Adv. Comput. Sci. Appl. 2022, 13, 359–367. [Google Scholar] [CrossRef]
- Figueira, J.; Greco, S.; Ehrogott, M. Multiple Criteria Decision Analysis: State of the Art Surveys; Springer Science & Business Media: Berlin/Heidelberg, Germany, 2005. [Google Scholar]
- Cavallaro, F. An Integrated Multi-Criteria System to Assess Sustainable Energy Options: An Application of the Promethee Method. SSRN Electron. J. 2005. [Google Scholar] [CrossRef]
- Saaty, T.L. A Scaling Method for Priorities in Hierarchical Structures. J. Math. Psychol. 1977, 15, 234–281. [Google Scholar] [CrossRef]
- Behzadian, M.; Otaghsara, S.K.; Yazdani, M.; Ignatius, J. A state-of the-art survey of TOPSIS applications. Expert Syst. Appl. 2012, 39, 13051–13069. [Google Scholar] [CrossRef]
- Saaty, T.L. The Analytic Hierarchy Process (AHP). J. Oper. Res. Soc. 1980, 41, 1073–1076. [Google Scholar]
- Hwang, C.L.; Yoon, K. Methods for Multiple Attribute Decision Making. In Multiple Attribute Decision Making; Lecture Notes in Economics and Mathematical Systems; Springer: Berlin/Heidelberg, Germany, 1981; Volume 186, pp. 58–191. [Google Scholar] [CrossRef]
- Bana e Costa, C.A.; Vansnick, J.C. The MACBETH Approach: Basic Ideas, Software, and an Application. In Advances in Decision Analysis, Vol. 4, Mathematical Modelling: Theory and Applications; Meskens, N., Roubens, M., Eds.; Springer: Dordrecht, The Netherlands, 1999; pp. 131–157. [Google Scholar]
- Roy, B. The Outranking Approach and the Foundations of ELECTRE Methods. Theory Decis. 1991, 31, 49–73. [Google Scholar] [CrossRef]
- Brans, J.P.; Vincke, P. Note—A Preference Ranking Organisation Method. Manag. Sci. 1985, 31, 647–656. [Google Scholar] [CrossRef]
- Ding, S.; Li, R.; Wu, S. A Novel Composite Forecasting Framework by Adaptive Data Preprocessing and Optimized Nonlinear Grey Bernoulli Model for New Energy Vehicles Sales. Commun. Nonlinear Sci. Numer. Simul. 2021, 99, 105847. [Google Scholar] [CrossRef]
- Saeed, M.; Javed, K.; Babri, H.A. Machine Learning Using Bernoulli Mixture Models: Clustering, Rule Extraction and Dimensionality Reduction. Neurocomputing 2013, 119, 366–374. [Google Scholar] [CrossRef]
- Chakrabarty, N.; Kundu, T.; Dandapat, S.; Sarkar, A.; Kole, D.K. Flight Arrival Delay Prediction Using Gradient Boosting Classifier. In Emerging Technologies in Data Mining and Information Security, Advances in Intelligent Systems and Computing; Springer: Singapore, 2019; pp. 651–659. [Google Scholar]
- Liu, T.; Jin, L.; Zhong, C.; Xue, F. Study of Thermal Sensation Prediction Model Based on Support Vector Classification (SVC) Algorithm with Data Preprocessing. J. Build. Eng. 2022, 48, 103919. [Google Scholar] [CrossRef]
- Wang, L. Research and implementation of machine learning classifier based on KNN. Iop Conf. Ser. Mater. Sci. Eng. 2019, 677, 052038. [Google Scholar] [CrossRef]
- Castro Guzman, G.E.; Fujita, A. Convolution-Based Linear Discriminant Analysis for Functional Data Classification. Inf. Sci. 2021, 581, 469–478. [Google Scholar] [CrossRef]
- Abdulkareem, N.M.; Abdulazeez, A.M. Machine Learning Classification Based on Radom Forest Algorithm: A Review. Int. J. Sci. Bus. 2021, 5, 128–142. [Google Scholar]
- Sharaff, A.; Gupta, H. Extra-Tree Classifier with Metaheuristics Approach for Email Classification. In Advances in Computer Communication and Computational Sciences; Bhatia, S.K., Tiwari, S., Mishra, K.K., Trivedi, M.C., Eds.; Advances in Intelligent Systems and Computing; Springer: Singapore, 2019; pp. 189–197. [Google Scholar]
- Chang, C.-C.; Li, Y.-Z.; Wu, H.-C.; Tseng, M.-H. Melanoma Detection Using XGB Classifier Combined with Feature Extraction and K-Means SMOTE Techniques. Diagnostics 2022, 12, 1747. [Google Scholar] [CrossRef]
- Navada, A.; Ansari, A.N.; Patil, S.; Sonkamble, B.A. Overview of Use of Decision Tree Algorithms in Machine Learning. In Proceedings of the 2011 IEEE Control and System Graduate Research Colloquium (ICSGRC), Shah Alam, Malaysia, 27–28 June 2011; IEEE: Piscataway, NJ, USA, 2011; pp. 37–42. [Google Scholar] [CrossRef]
- Arora, D.; Waiters, B.A.; Goel, L. Accelerated Digital Transformation: A Framework for Leading Digital Innovation and Change. In Leadership Strategies for the Hybrid Workforce: Best Practices for Fostering Employee Safety and Significance; IGI Global: Hershey, PA, USA, 2022; pp. 119–131. [Google Scholar] [CrossRef]
- Miah, M.T.; Erdei-Gally, S.; Dancs, A.; Fekete-Farkas, M. A Systematic Review of Industry 4.0 Technology on Workforce Employability and Skills: Driving Success Factors and Challenges in South Asia. Economies 2024, 12, 35. [Google Scholar] [CrossRef]
- Rothwell, A.; Arnold, J. Self-perceived Employability: Development and Validation of a Scale. Pers. Rev. 2007, 36, 23–41. [Google Scholar] [CrossRef]
- Fugate, M.; Kinicki, A.J.; Ashforth, B.E. Employability: A psycho-social construct, its dimensions, and applications. J. Vocat. Behav. 2004, 65, 14–38. [Google Scholar] [CrossRef]
- Christiansen, B.; Even, A.M. Prioritizing Skills Development for Student Employability; IGI Global: Hershey, PA, USA, 2024. [Google Scholar]
- Dalton, R.; Crawford, P.; Weiss, L.; Fink, W. Exploring how women and men prioritize employability skills for communication, decision making and self-management. NACTA J. 2018, 62, 298–307. [Google Scholar]
- Paredes, A.A.P.; Rodriguez, A.J. Employability skills and geographical location. J. Organ. Psychol. 2021, 21, 101–120. [Google Scholar] [CrossRef]


Disclaimer/Publisher’s Note: The statements, opinions and data contained in all publications are solely those of the individual author(s) and contributor(s) and not of MDPI and/or the editor(s). MDPI and/or the editor(s) disclaim responsibility for any injury to people or property resulting from any ideas, methods, instructions or products referred to in the content. |
© 2025 by the authors. Licensee MDPI, Basel, Switzerland. This article is an open access article distributed under the terms and conditions of the Creative Commons Attribution (CC BY) license (https://creativecommons.org/licenses/by/4.0/).