

Intelligent Battery Management in a Hybrid Photovoltaic Using Fuzzy Logic System


 ,
, 
Abstract
1. Introduction
- Low Management—This management level primarily involves the manual measurement and periodic monitoring of battery parameters, typically suited for single-cell lead–acid batteries. It necessitates regular manual maintenance to ensure proper operation and safety.
- Basic Management—Provides the real-time online monitoring of essential external battery parameters, offering protection against overcharging and over-discharging scenarios. This level is suitable for managing small sets of batteries, ensuring improved reliability and lifespan through basic protective functionalities.
- Enhanced Management—Explicitly designed for onboard battery systems in electric vehicles (EVs), this advanced management level encompasses comprehensive battery modeling, precise state estimation, sophisticated fault diagnosis, and optimized control strategies. It is tailored to handle battery modules, significantly enhancing performance, safety, and overall system efficiency.
- Develop a comprehensive monitoring system that tracks and analyzes energy generation, distribution, and priority-based load management in real time;
- Design and implement a real-time intelligent battery management framework using advanced sensors integrated with computational intelligence algorithms to enhance energy distribution efficiency and optimize utilization;
- Evaluate the overall performance of the intelligent battery management system (i-BMS) by comparing the energy generated versus energy demand utilization.
2. Review of Related Studies and Works
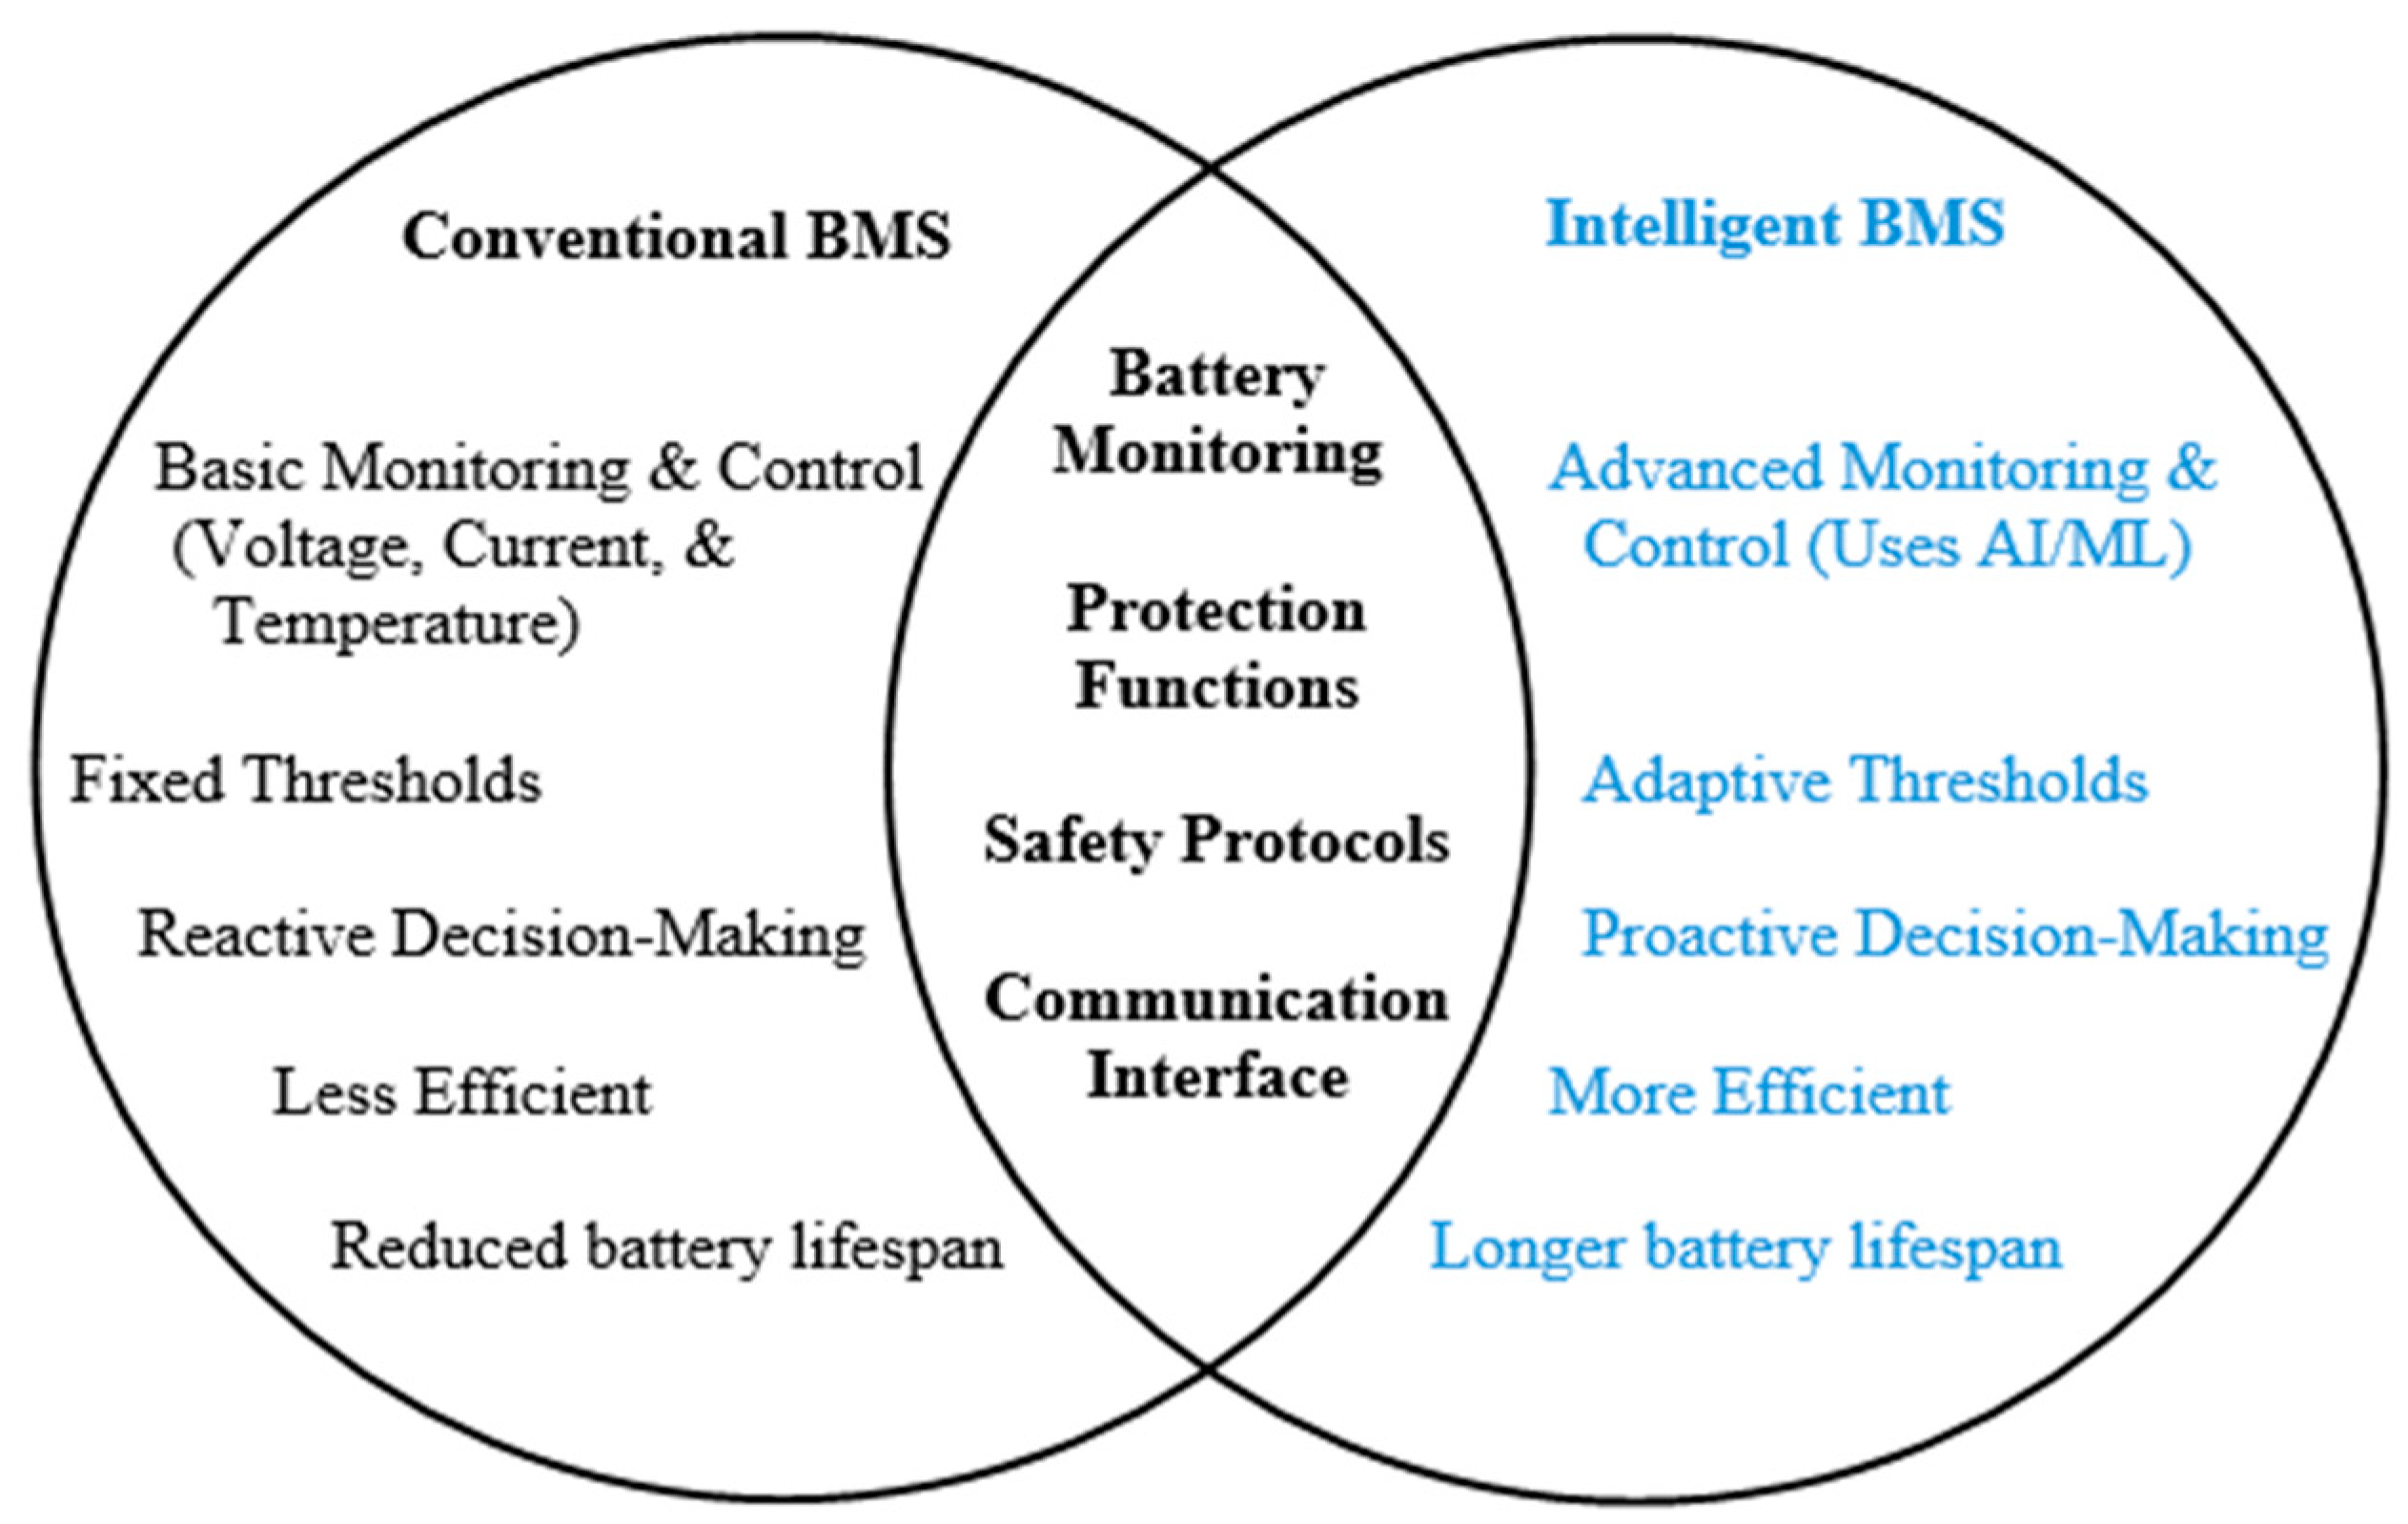
2.1. BMS: An Overview
BMS Core Functions
- Monitoring and Sensing—A smart BMS constantly checks the battery’s condition using built-in sensors. When batteries are connected in a series, they lose their balance through repeated overcharging and over-discharging cycles. This scenario might lead to cell voltage imbalance and overheating, eventually shortening battery lifespan in the long run [19]. With this, voltage sensors are used to monitor the voltage level on each cell so it stays within safe limits and balanced [20]. Temperature sensors look for heat build-up to prevent thermal runaway. Current sensors track how much charge flows in and out, accurately showing battery use [21]. These measurements let the BMS protect the pack and extend its life.
- State Estimation—It refers to the informational backbone of BMS, including SOC, SOH, state of energy (SOE), state of power (SOP), state of safety (SOS), state of temperature (SOT), and remaining useful life (RUL) [22]. Accurate battery state estimates are critical for optimal charging control, temperature, and overall battery health.
- Control and Protection—The BMS can detect and keep the batteries from experiencing over-voltage (OV), under-voltage (UV), over-current (OC), short-circuit (SC), over-temperature (OT), under-temperature (UT) status and prevent further damage [23].
- Diagnosis—It is vital for the optimal operation of batteries and is useful for identifying and detecting whenever a fault has occurred in the cell or pack. It can be used for state estimation [24], data monitoring and analysis [25], machine learning, and advanced algorithms [26], fault detection and isolation [27,28].
2.2. Smart Farming Technologies
2.3. Hybrid Photovoltaic Systems
2.4. Synthesis, Research Gap, and Novel Contributions
- Millisecond scale fuzzy i-BMS control running directly on embedded hardware;
- Three-tier load prioritization (essential/regular/non-essential) integrated into the rule base.
- Integrated i-BMS architecture that couples photovoltaic input, battery bank, and utility grid while sampling voltage, current, SOC, and cell temperature at a millisecond resolution;
- Embedded three-level load prioritization algorithm woven into the fuzzy rule set to allocate energy dynamically among essential, regular, and non-essential loads.
3. Materials and Method
3.1. Dataset
- Battery Pack Health
- Load Category Power Metrics
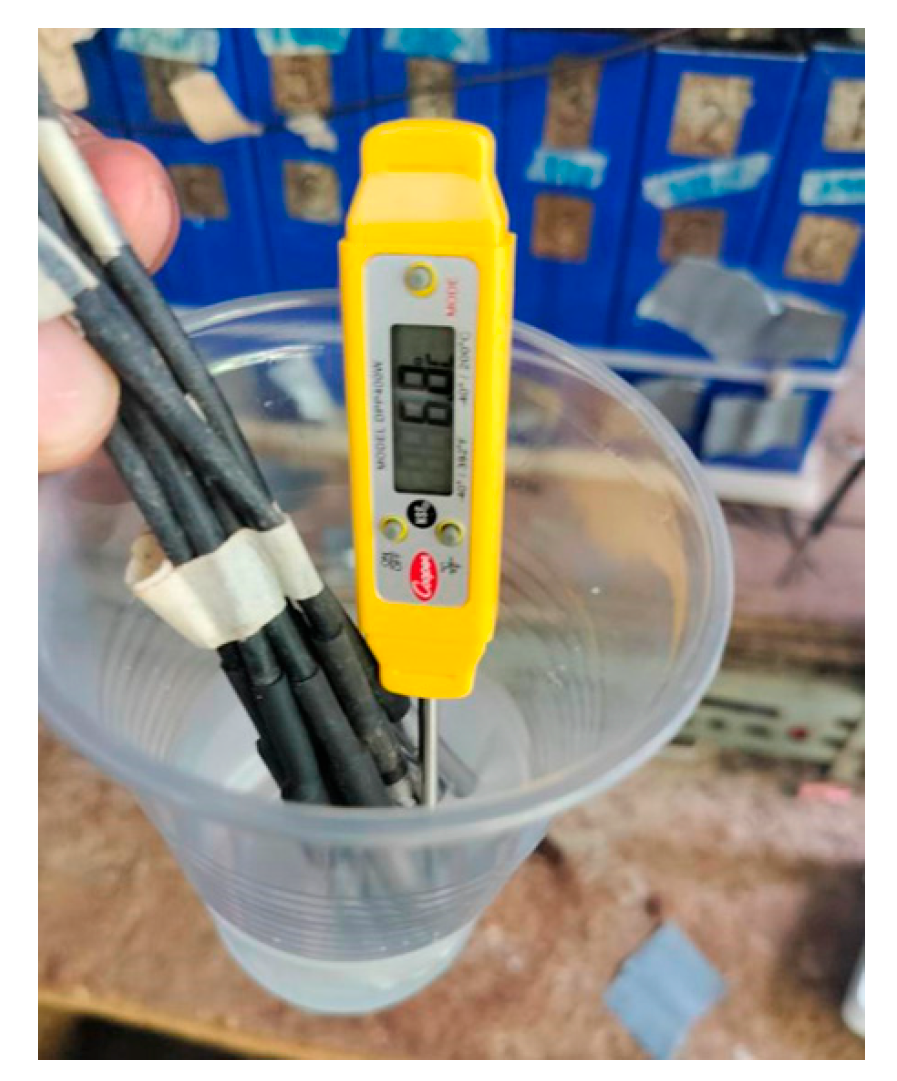
3.2. System Calibration
3.3. Site Climate and Environmental Conditions
- A mean daily maximum air temperature (T2M_MAX) of 29.6 °C;
- A mean daily minimum temperature (T2M_MIN) of 24.7 °C;
- An average 2 m relative humidity of 88.5%.
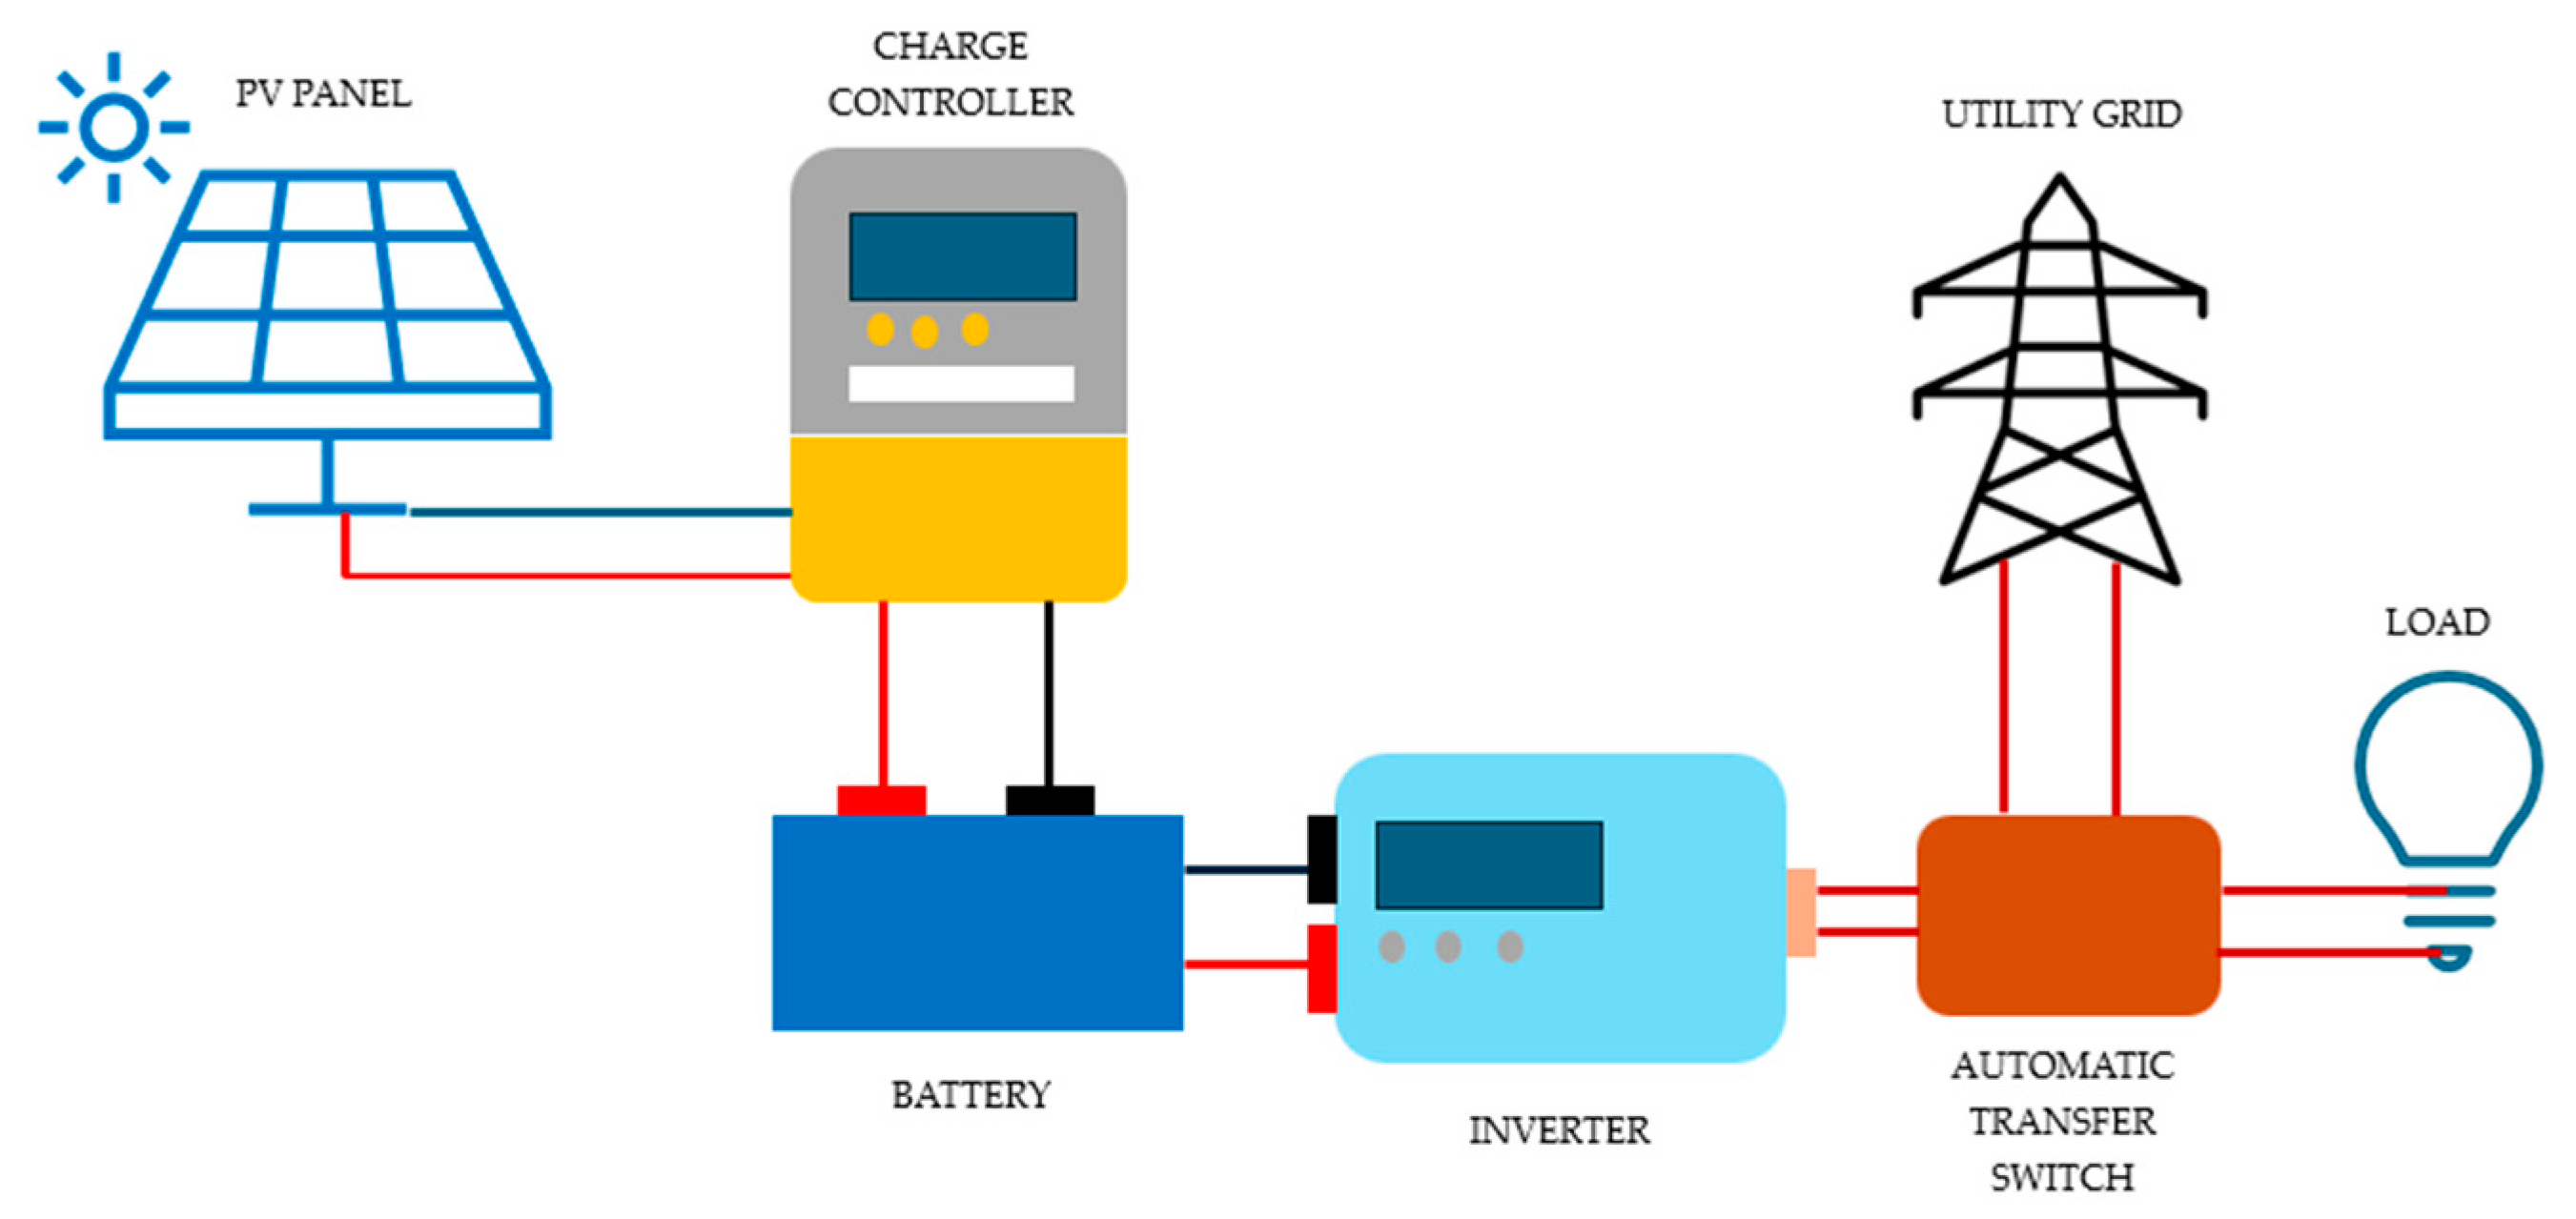
3.4. System Architecture Overview of i-BMS
- PV coupling—Connect or isolate the PV array from the charge controller;
- Battery dispatch—Engage or disconnect batteries for charging or discharging;
- Load prioritization—Energize or defer loads according to their priority class;
- Grid interchange—Transfer the bus to or from the utility grid via an automatic transfer switch (ATS).
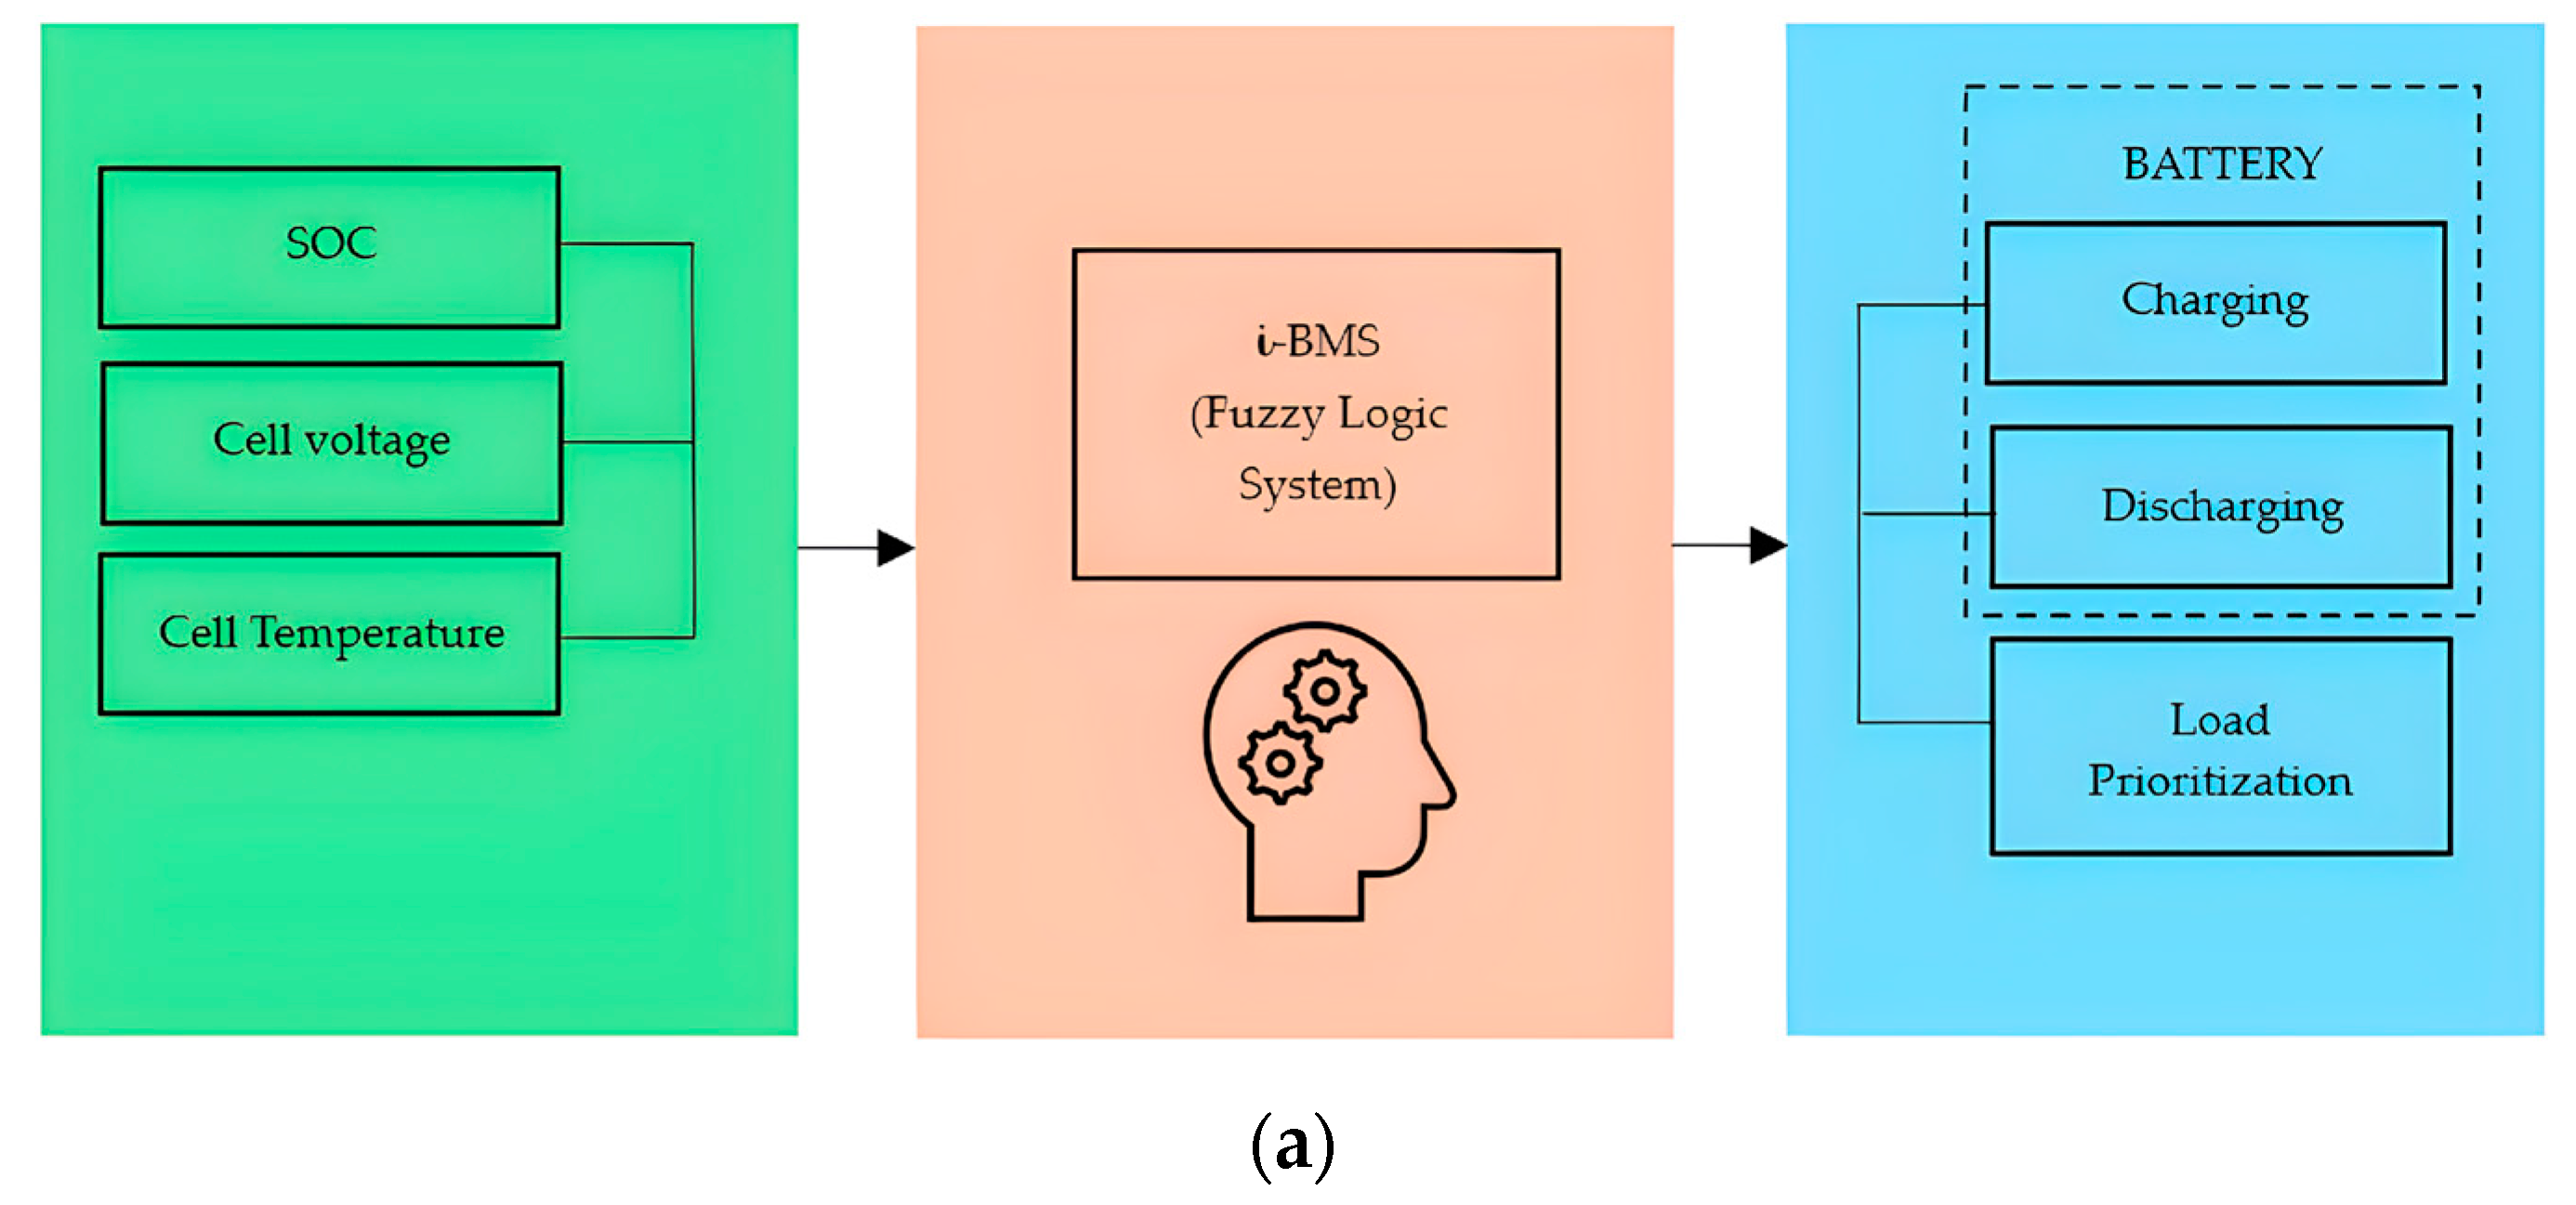
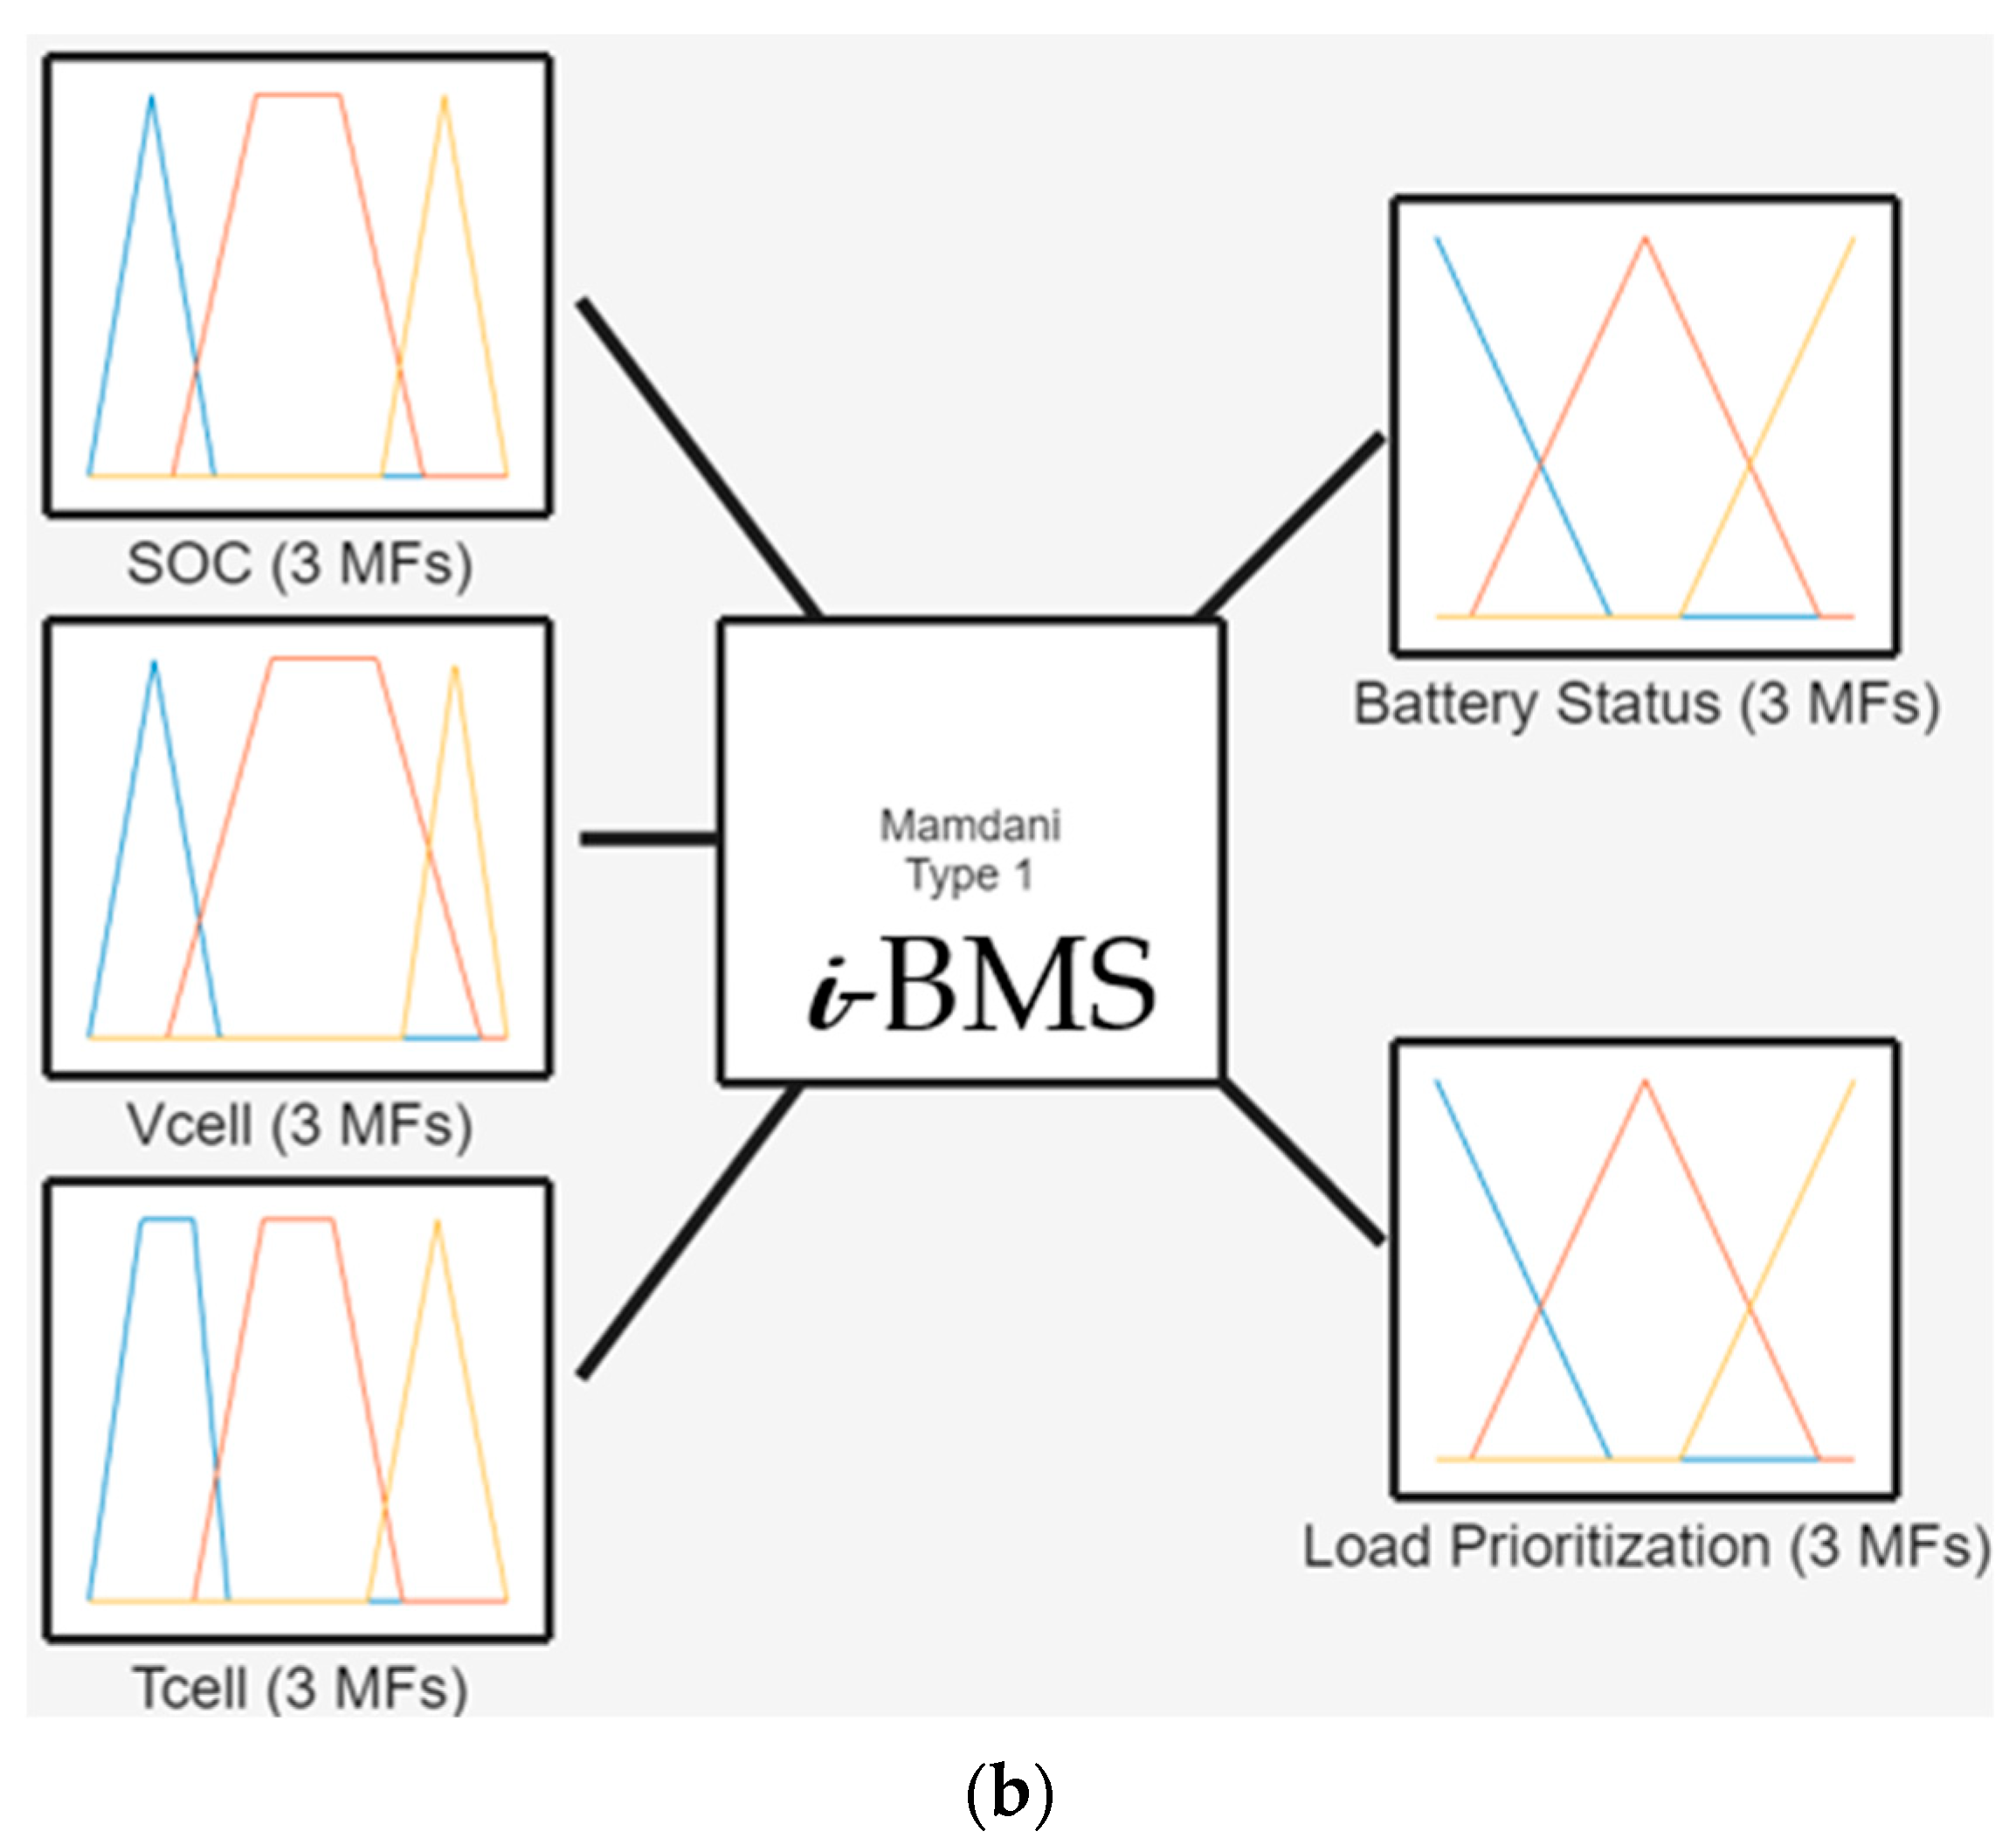
3.5. Application of Fuzzy Logic in i-BMS
- Low, where batteries are almost depleted;
- Moderate, where the battery is partially charged;
- High, indicating a battery close to full capacity.
- Low, which corresponds to an undervoltage region where the battery risks deep discharge;
- Moderate refers to the typical operational range; and
- High is the near or at maximum charge voltage, signifying a fully charged cell.
- Low is the level where battery performance may be reduced but not dangerously high;
- Moderate pertains to the optimal band for regular operation;
- High temperatures are approaching the upper safety threshold, potentially risking battery degradation.
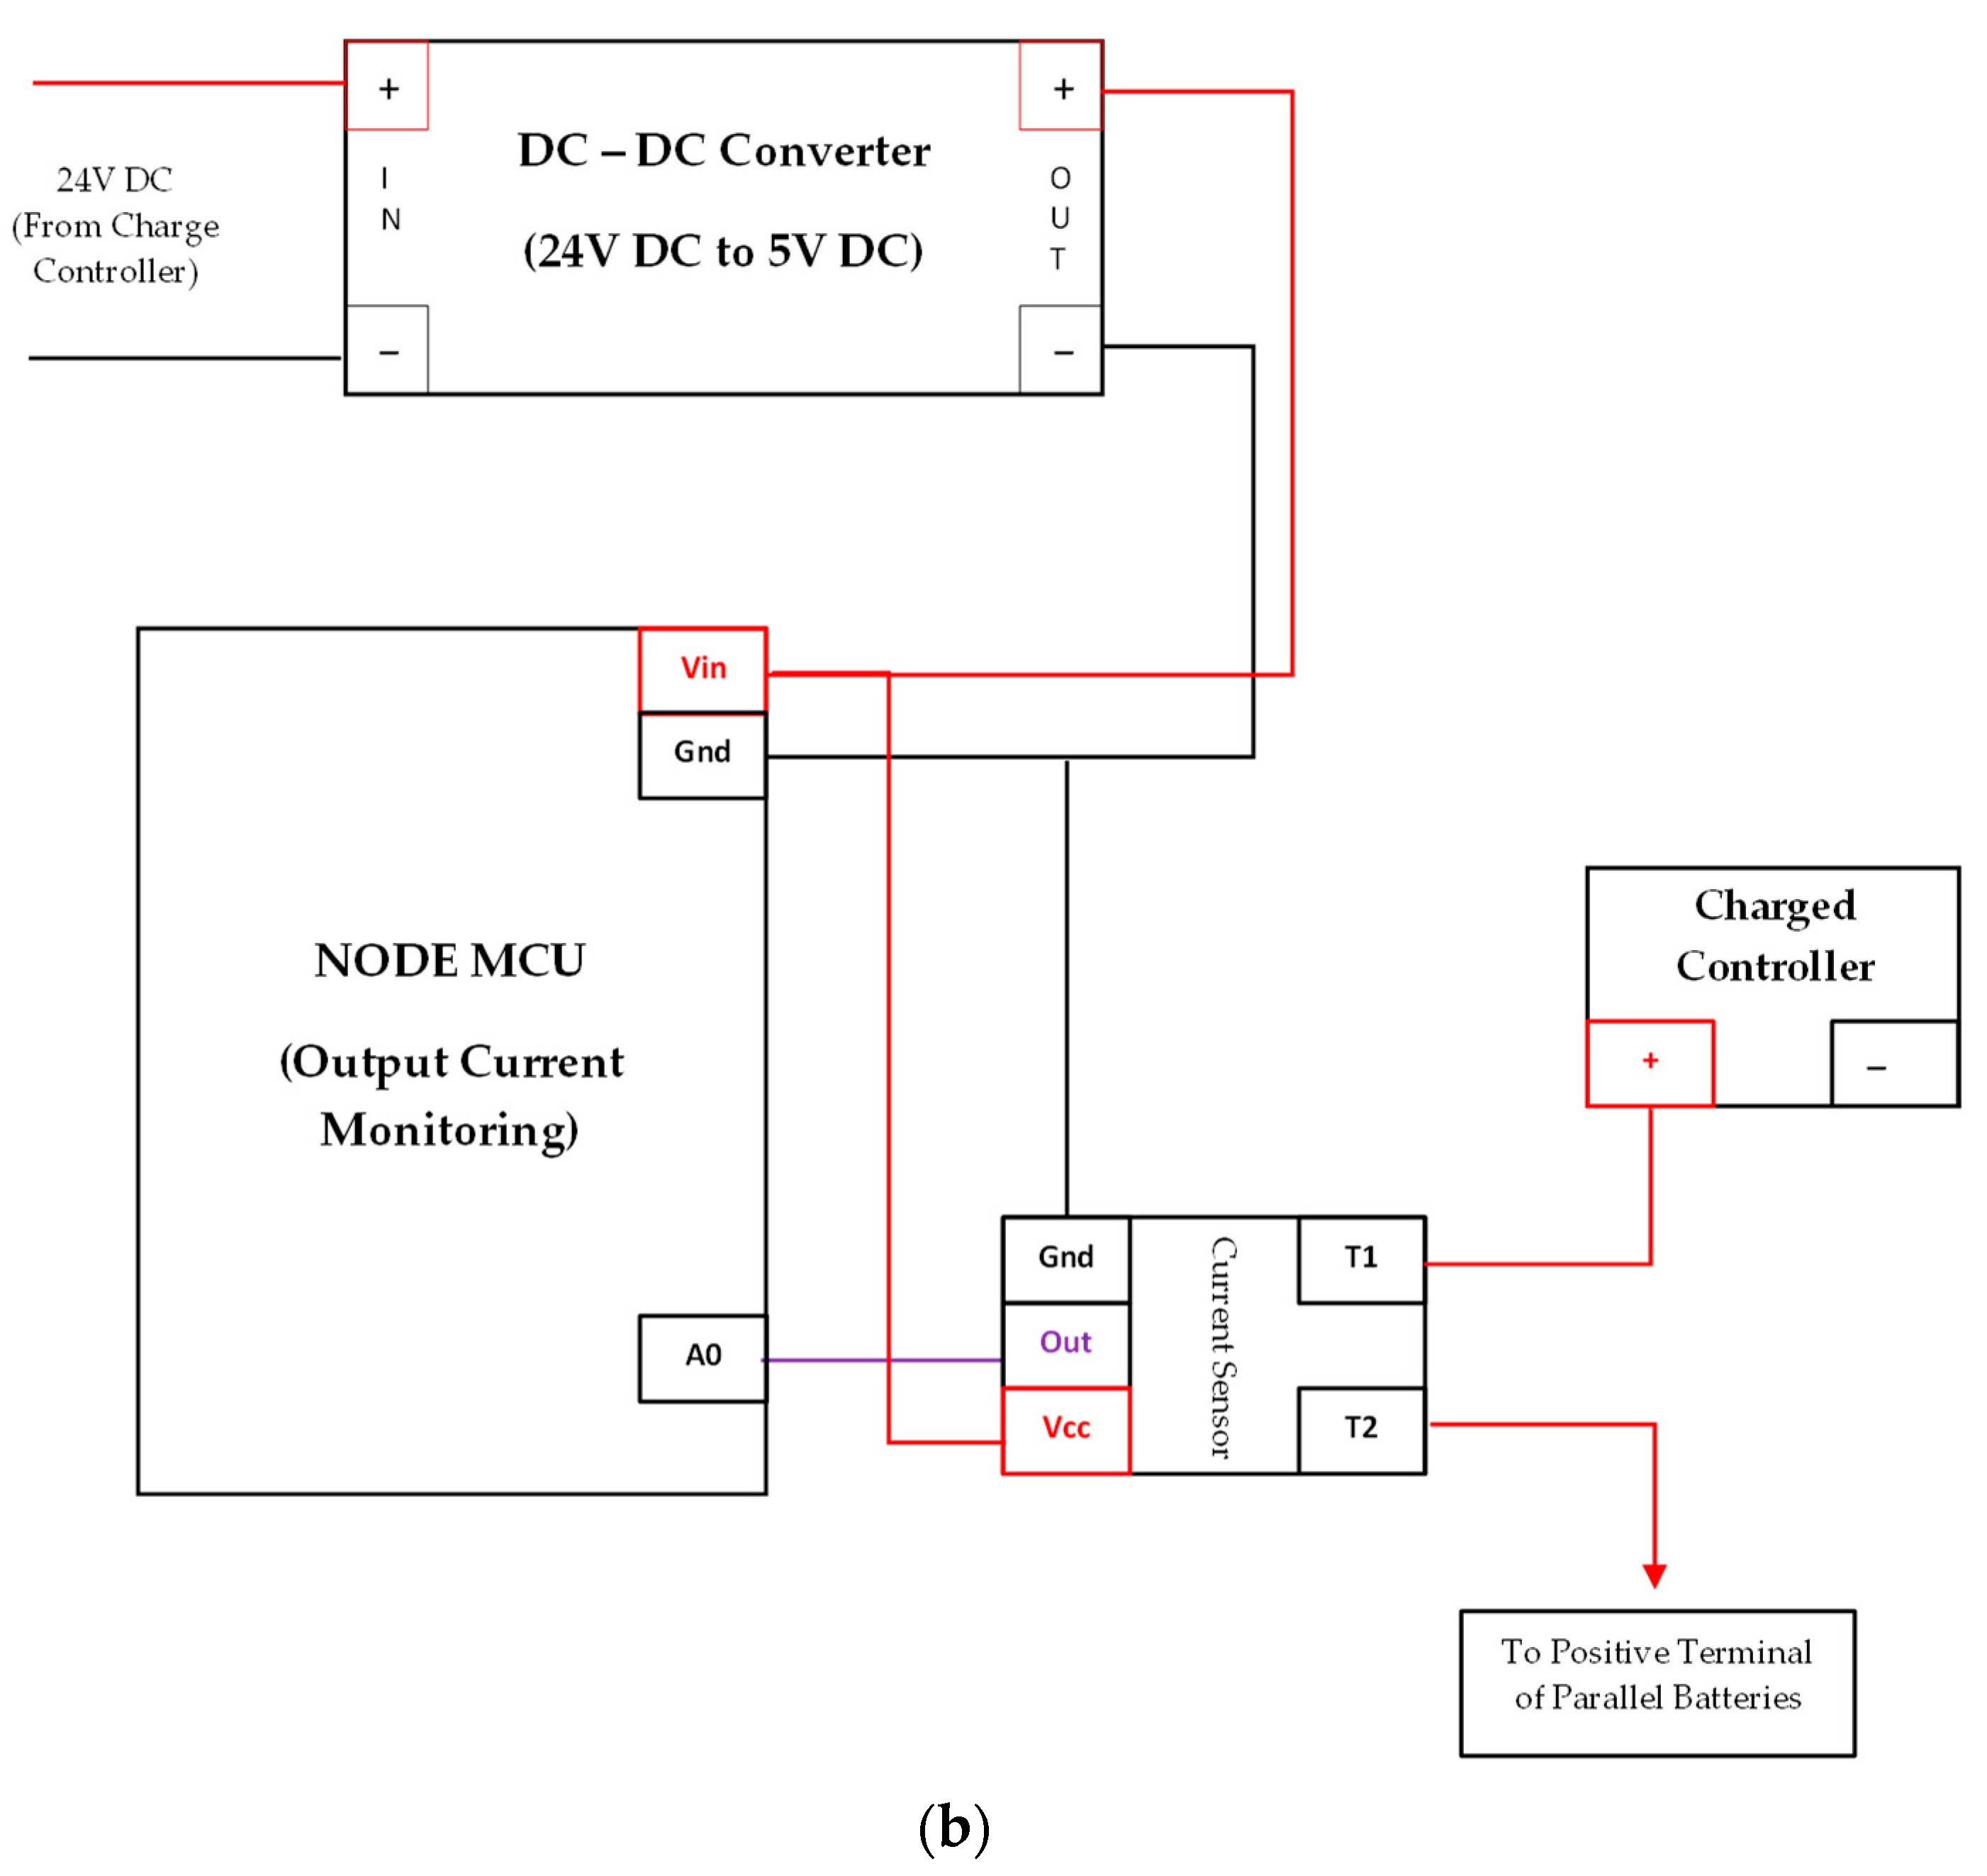
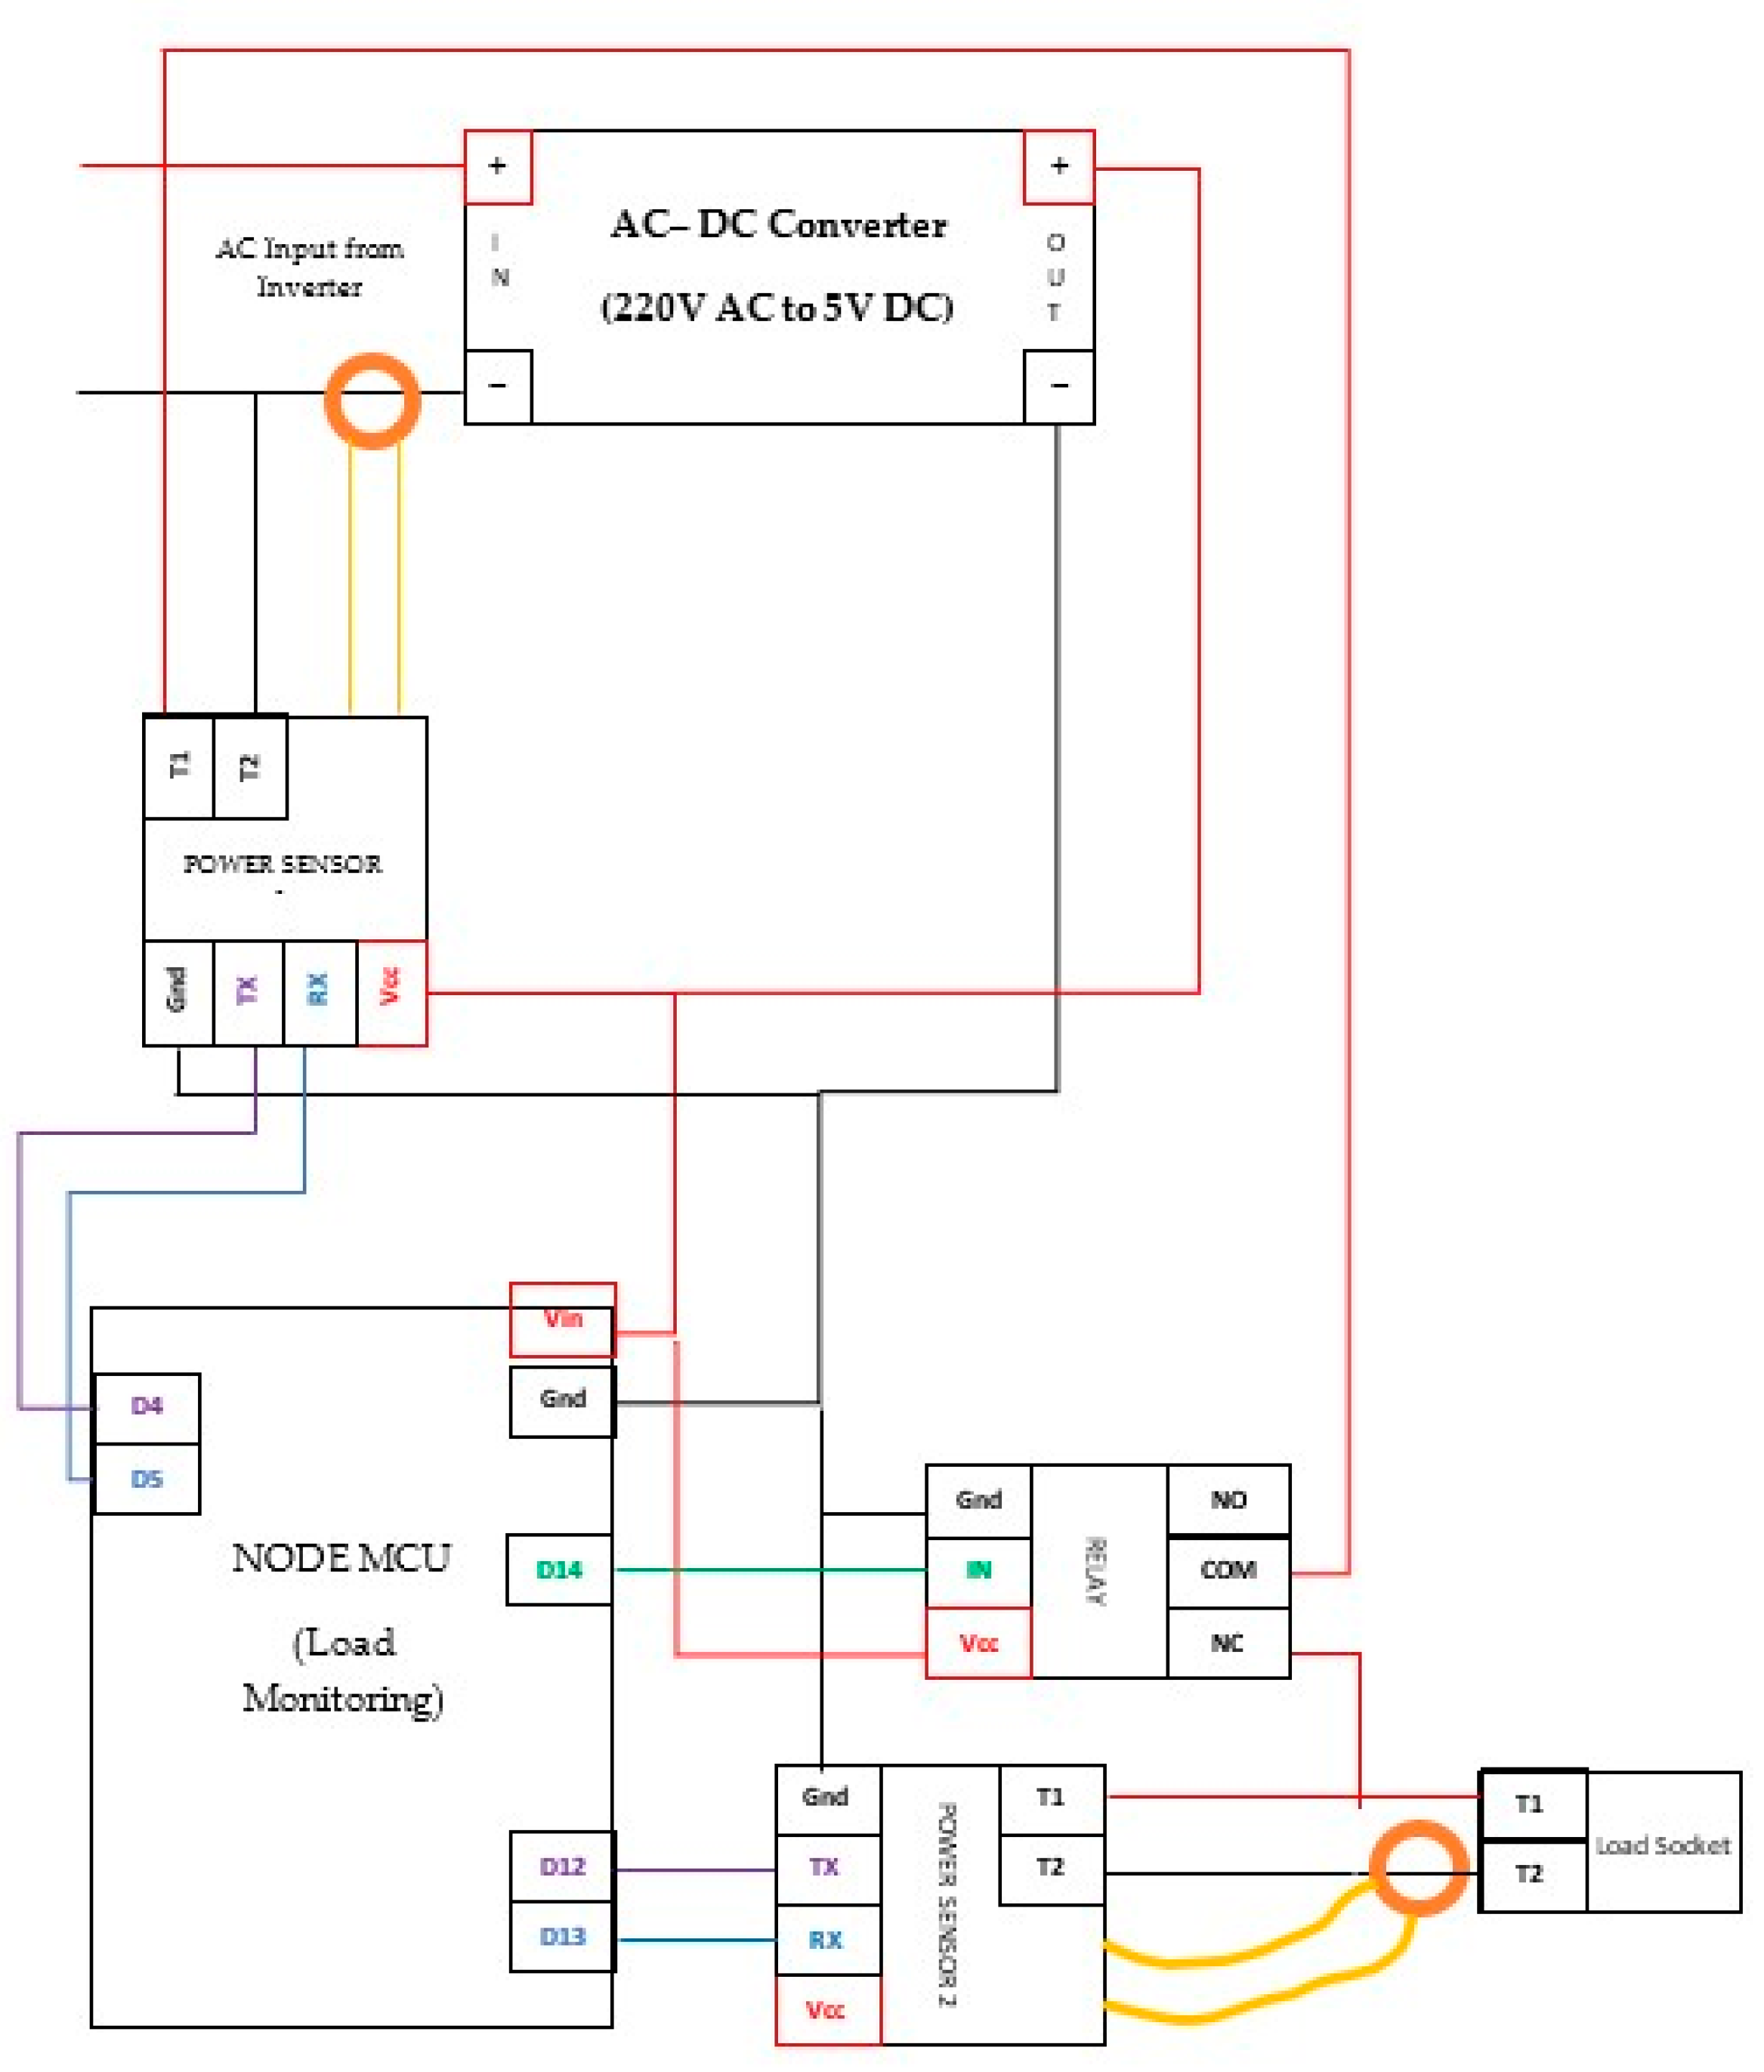
3.6. The i-BMS Electrical Circuit Design
3.7. On-Site Deployment of the Hybrid PV Systems with the i-BMS
- Solar charge controller (top right)—Regulates the voltage and current coming from the solar panels to prevent overcharging [48];
- Automatic transfer switch (middle section)—Controls the transfer of energy sources between solar and utility grid [49];
- Inverter (center, blue box)—Converts the stored DC power from the batteries into ac [50];
- Essential loads—These loads are mission-critical and require uninterrupted power supply due to their operational requirements. They include life support systems for aquaculture tanks and security systems such as CCTV. They are last to shed, first to restore.
- Regular loads—These are operationally necessary loads, and short outages are tolerable, leaving no severe damage or impact on system operations. Loads include irrigation pumps, data logging servers, and IoT gateways.
- Non-essential loads—These loads are usually not vital to smart farm operations and thus pertain to convenience or discretionary loads. They may operate only when surplus energy exists. This may include electric vehicles, decorative lighting, or household loads.
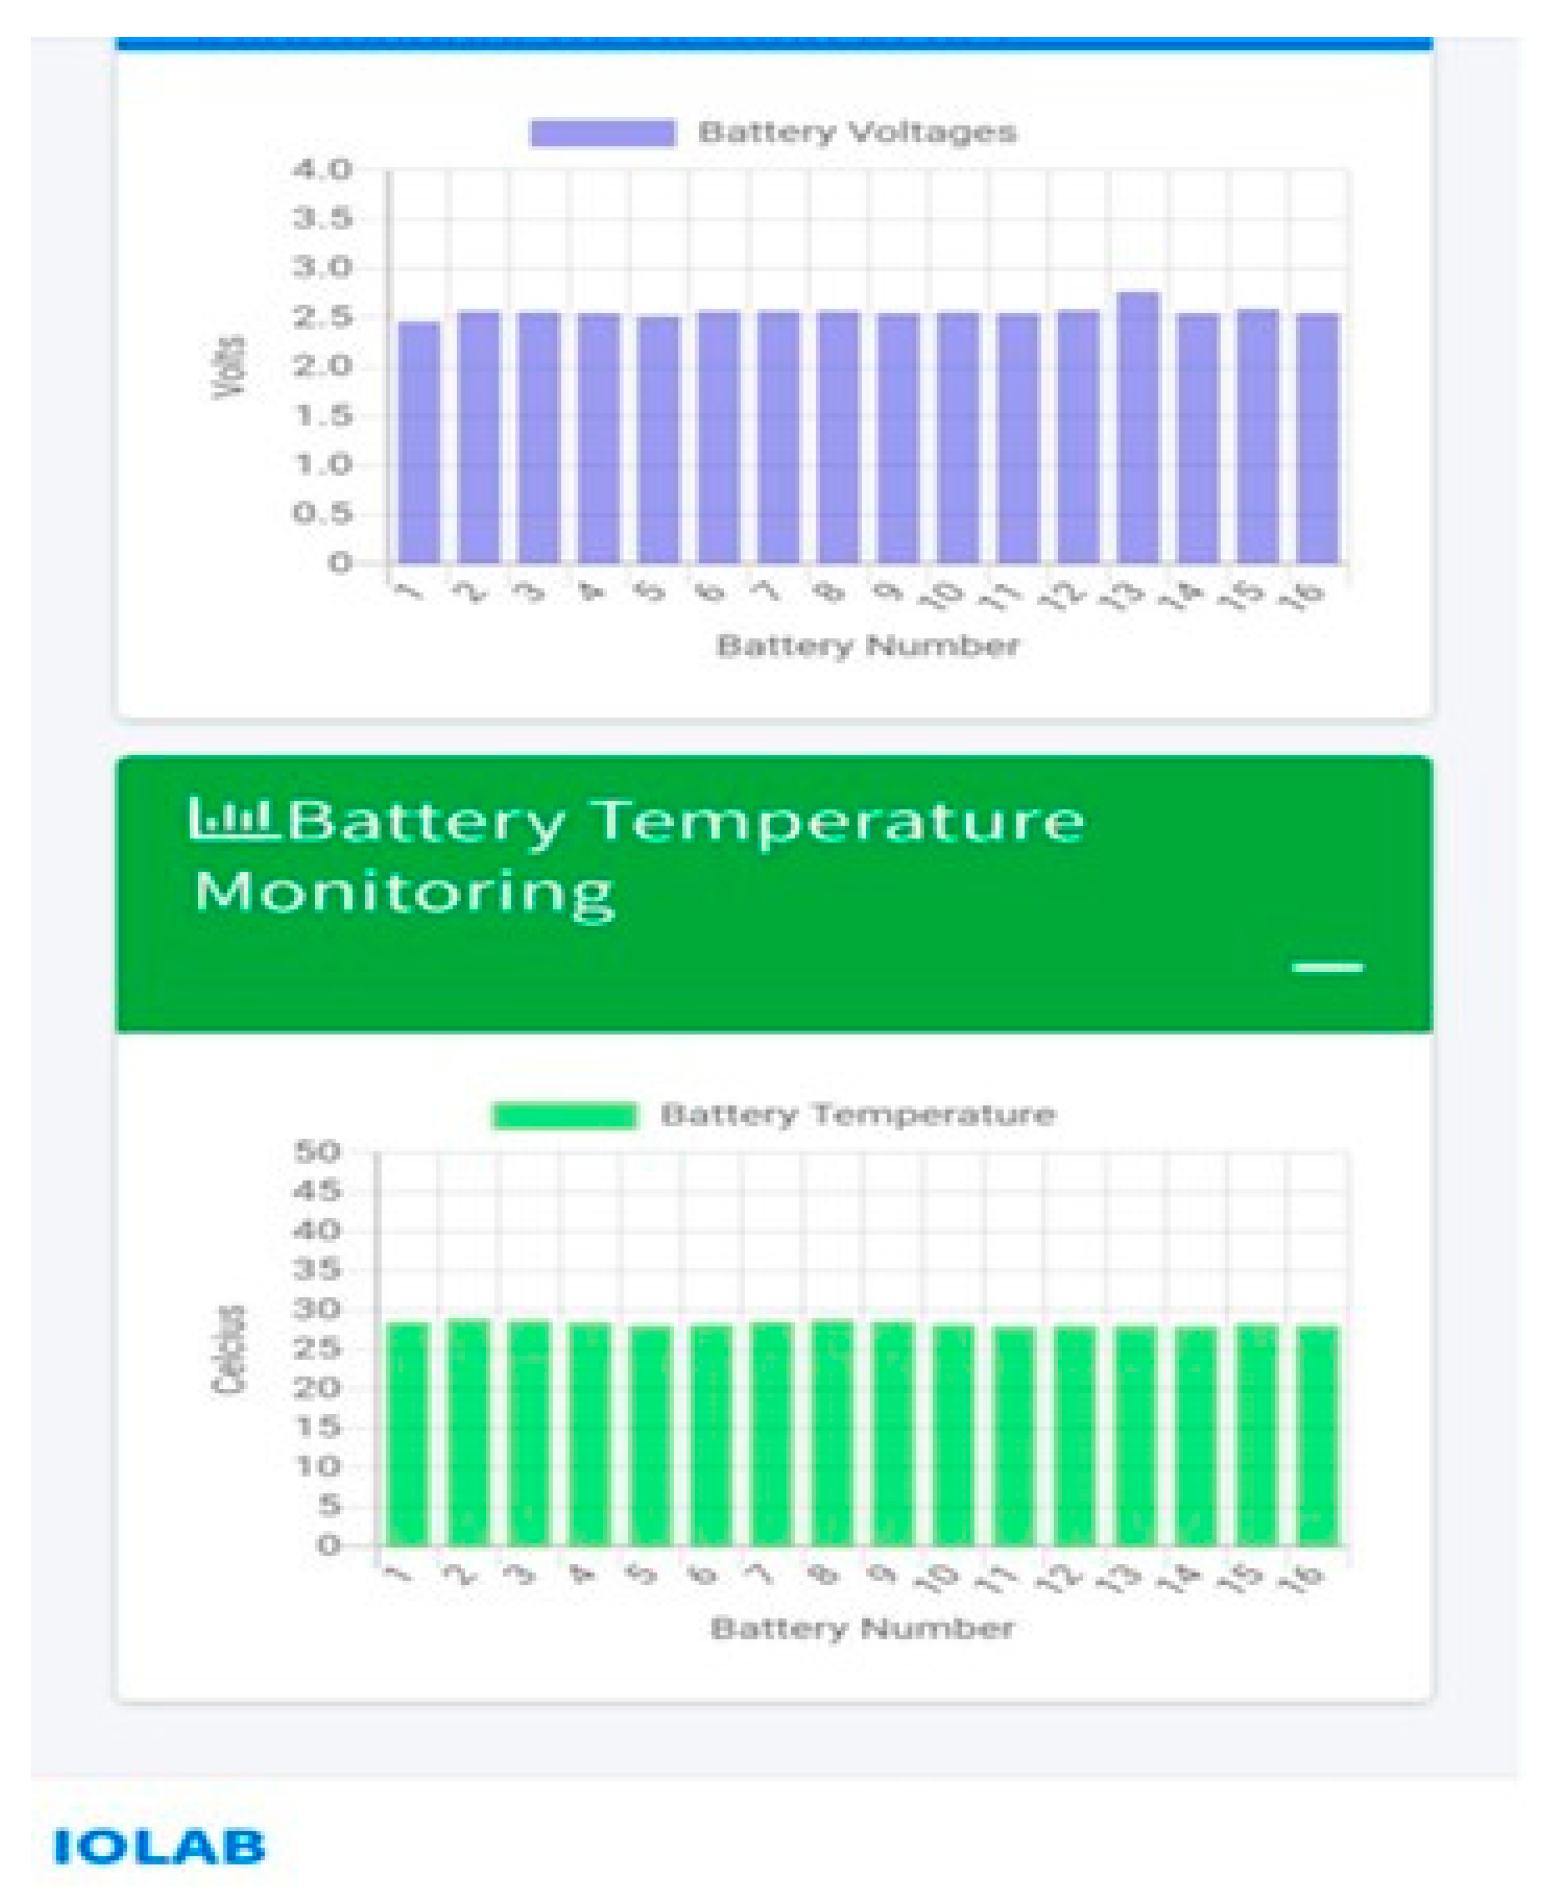
3.8. Real-Time i-BMS Monitoring System
3.9. i-BMS Data Transmission
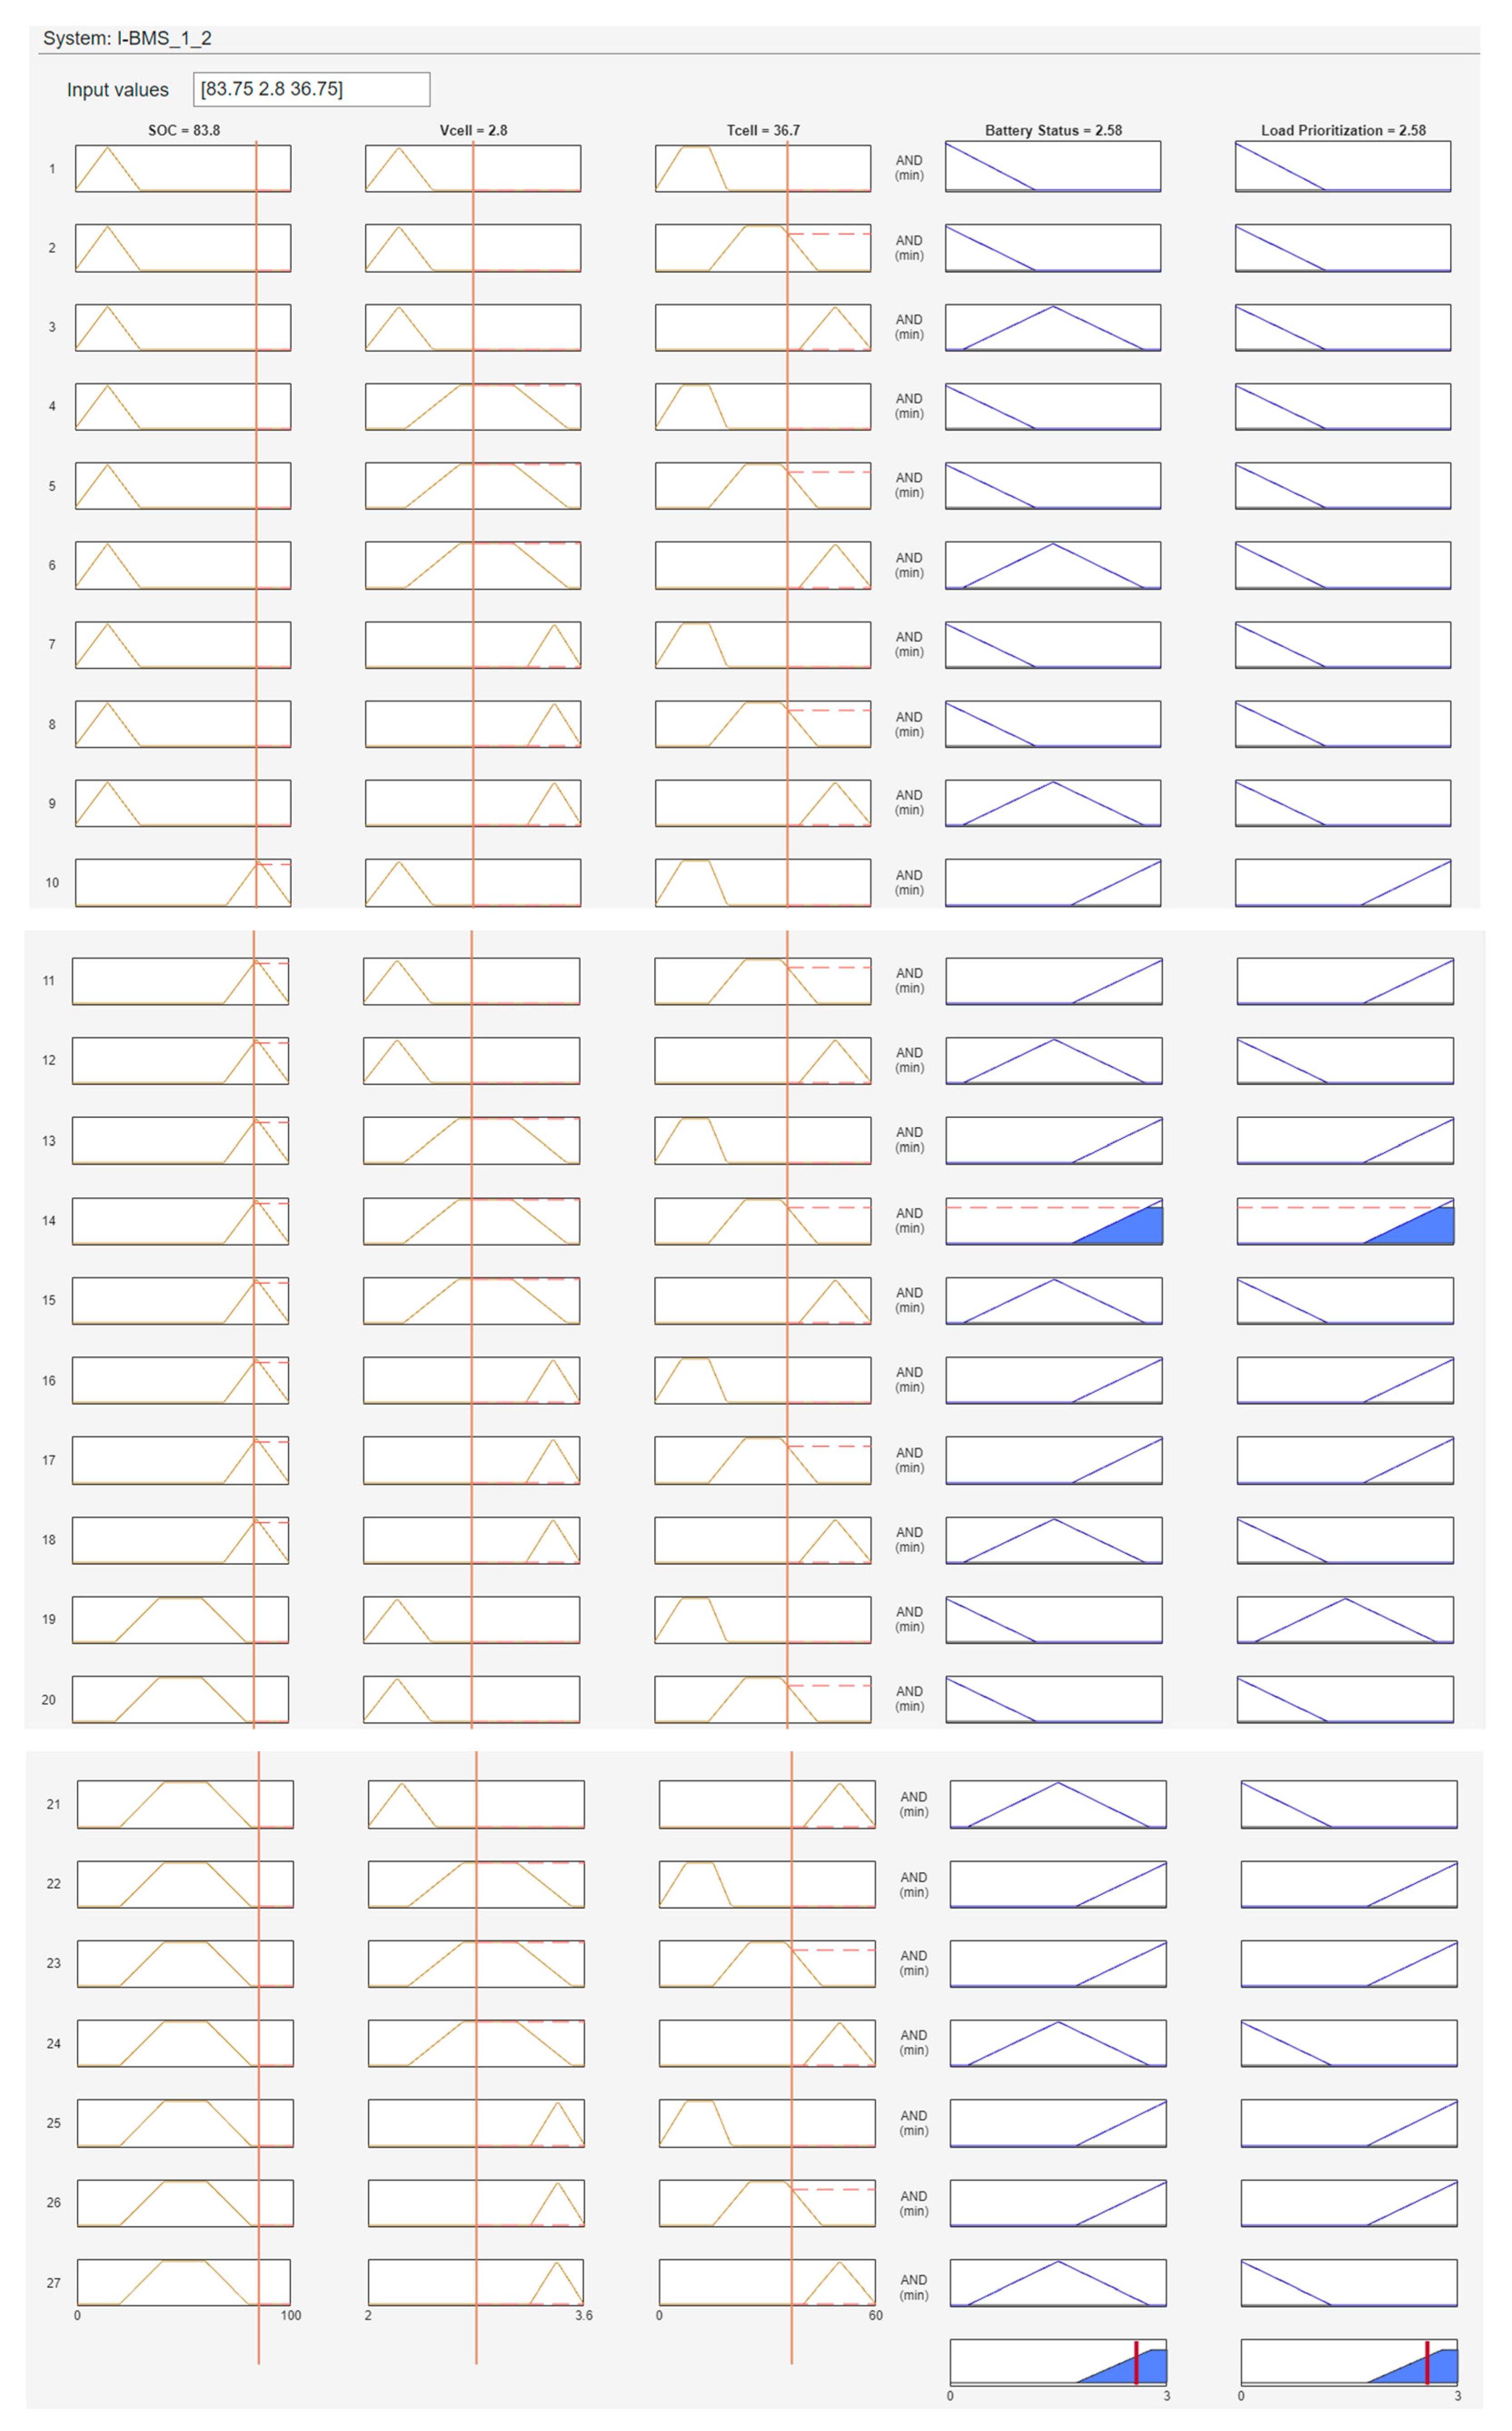
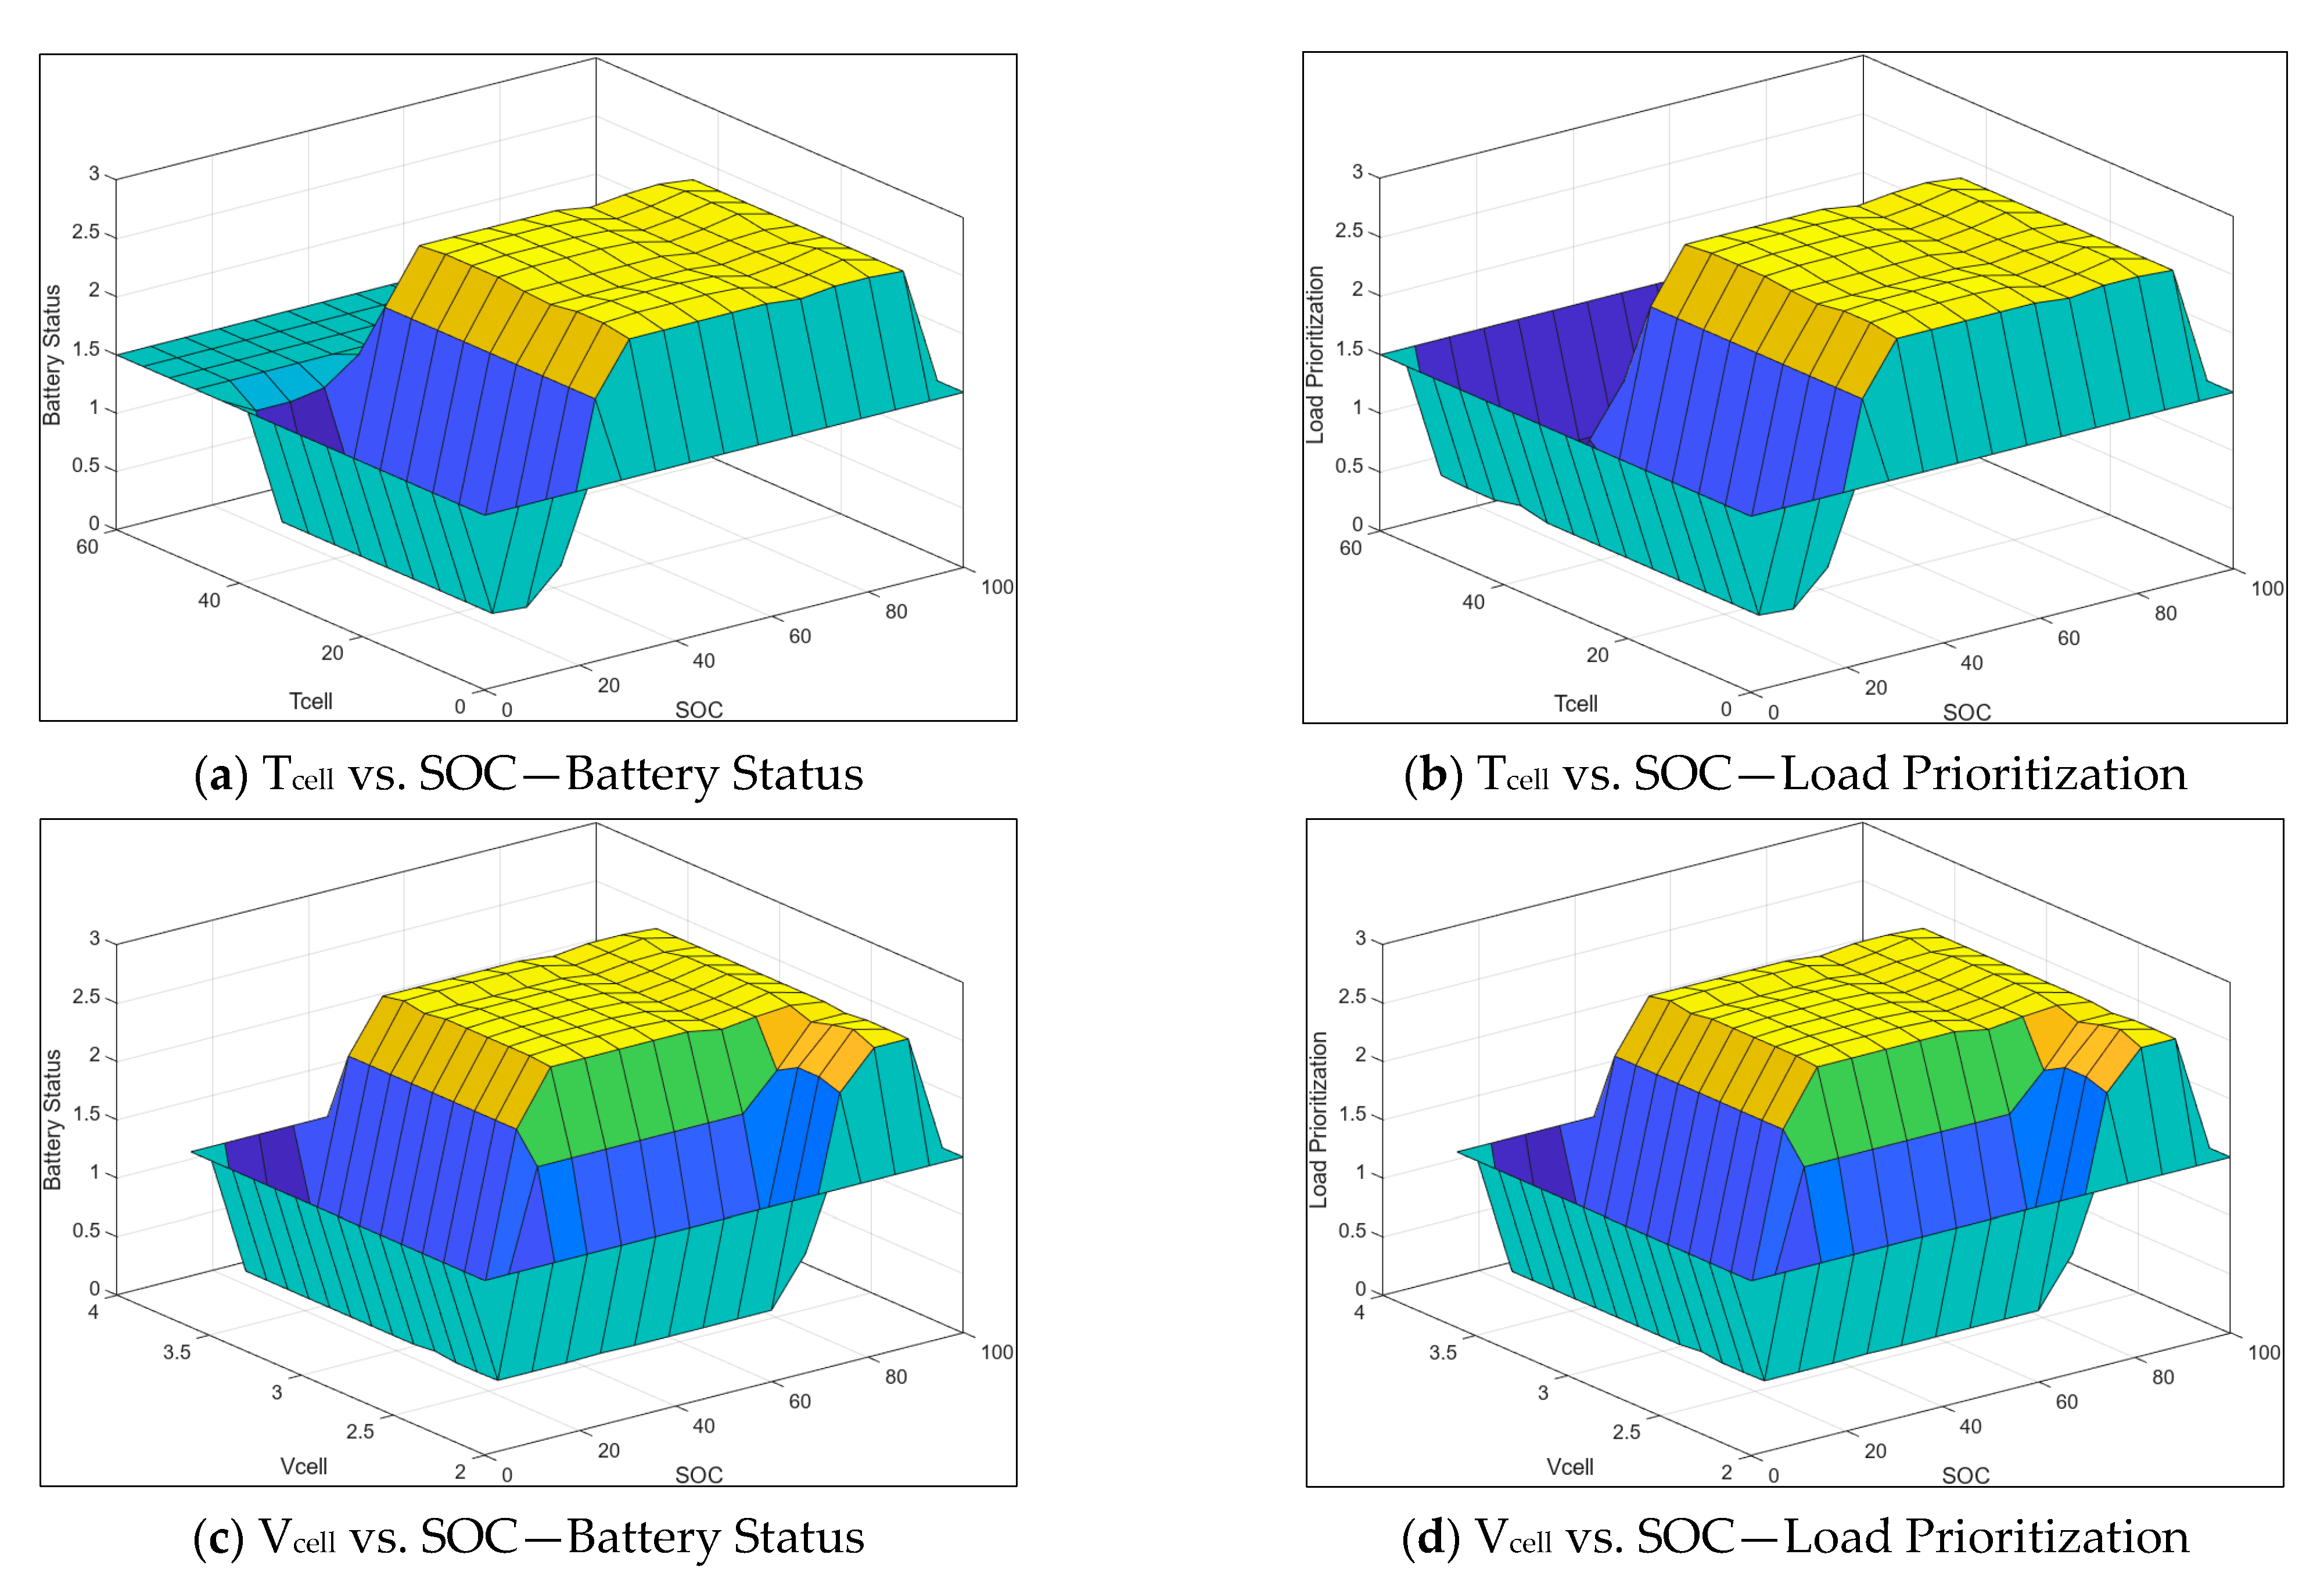
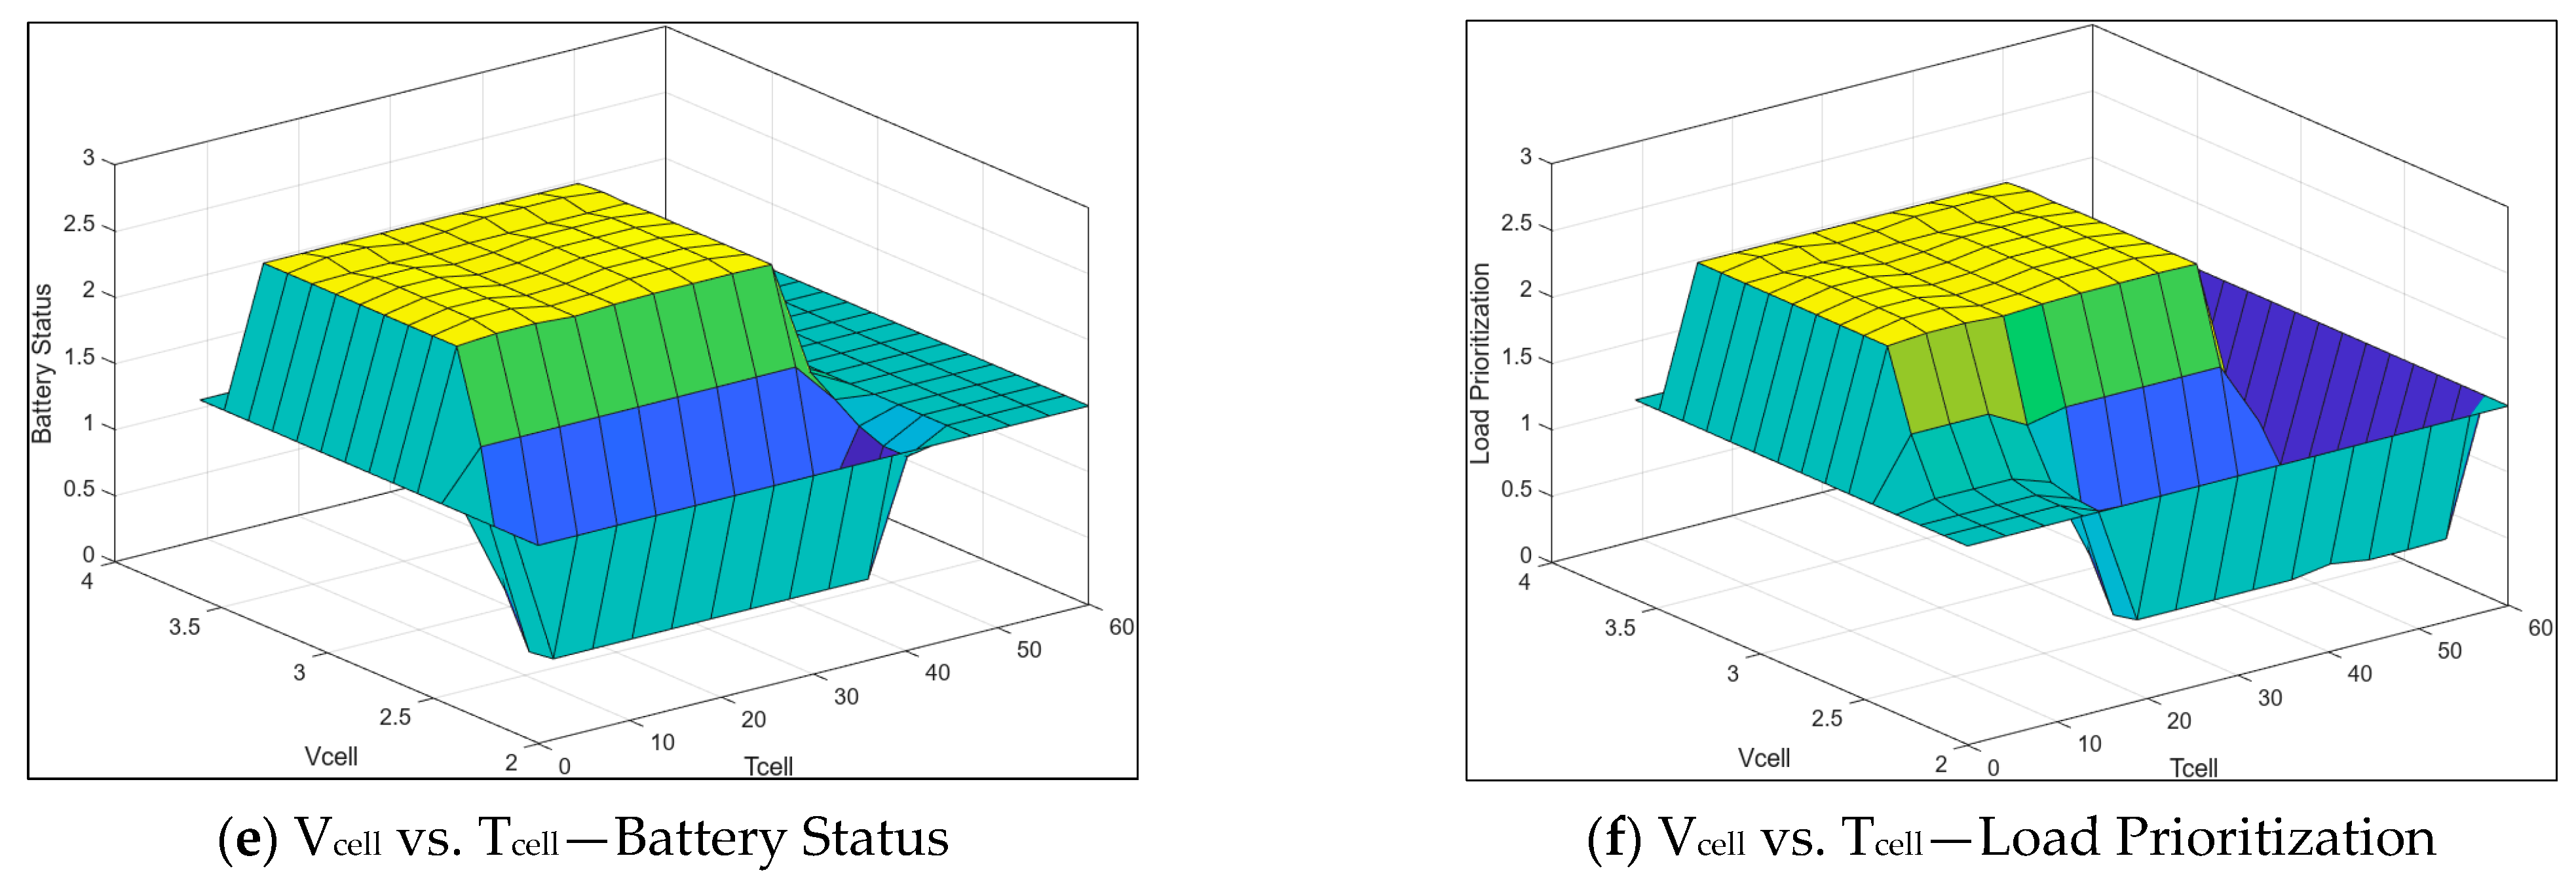
4. Fuzzy Logic-Based i-BMS Learning Structure
- The battery is healthy within its safe operating limits;
- Ample stored energy is available to power the entire farm—essential, regular, and non-essential loads—without drawing from the grid.
- Load prioritization companions (Figure 23d,f) mirror this progression, sequentially enabling essential, then regular, and finally non-essential loads in lock-step with the battery’s dispatch state.
5. Results and Discussion
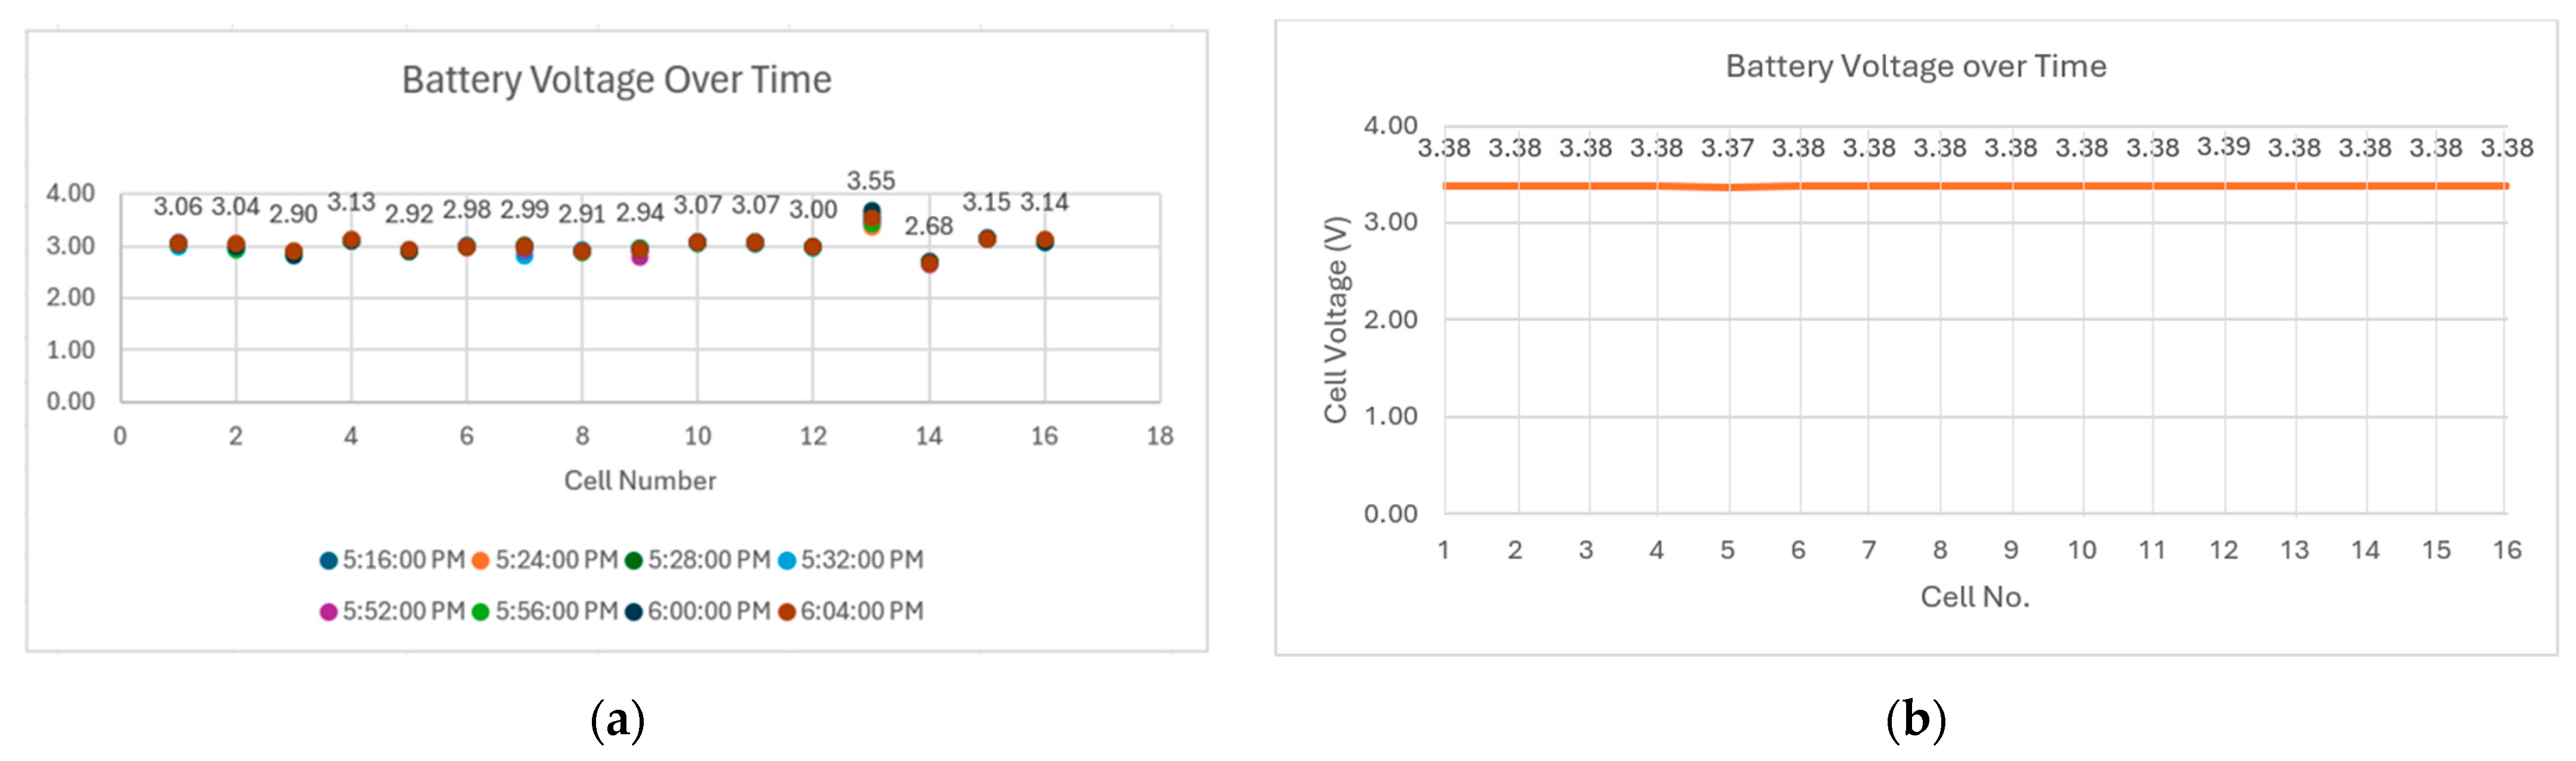
- There is a sufficient dataset for the experiment.
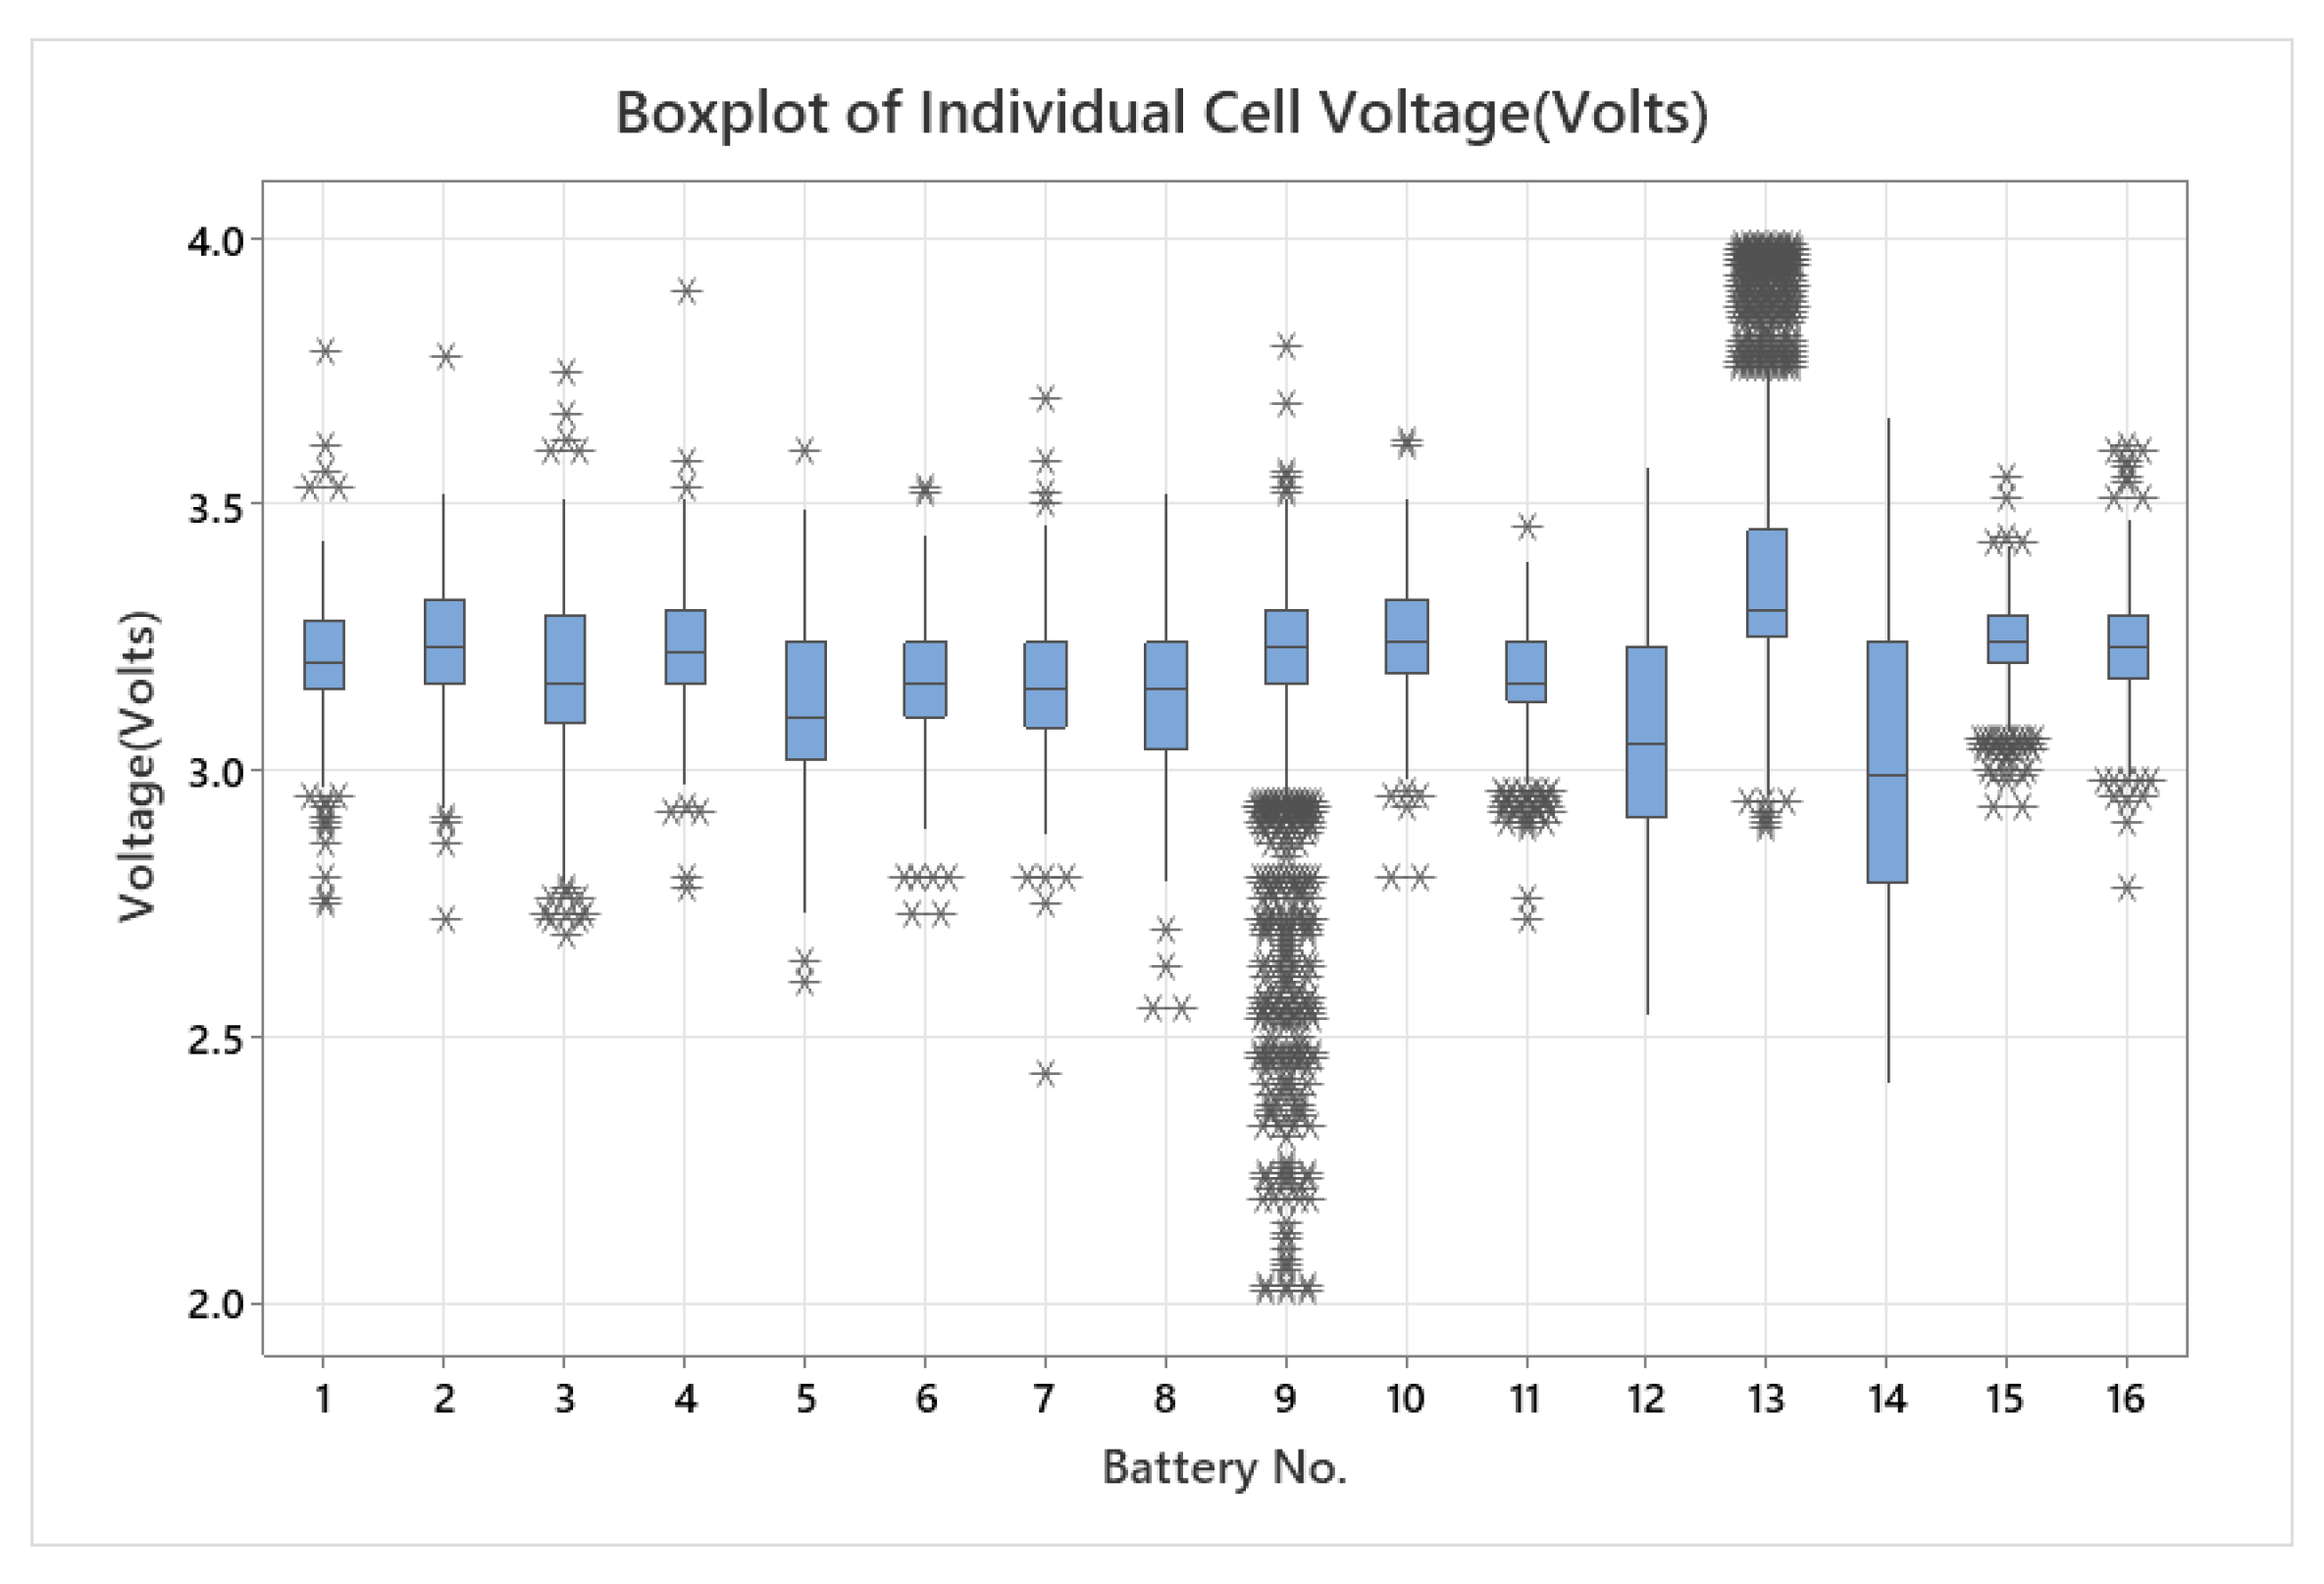
- The mean for all the batteries is within the safe region. However, the minimum cell voltage for batteries numbered 7, 9, and 14 is below the lower cut-off voltage.
- The maximum voltage for batteries numbered 1–4, 7,9, and 13–14 goes beyond the upper threshold voltage.
- The pack is not well balanced: the difference between the highest and lowest mean cell voltages is ~0.35 V.
- Several cells have experienced unsafe voltage extremes (>3.65 V or <2.5 V), which can shorten life or pose safety risks.
- Cells 9, 12, 13, and 14 stand out for their high variability; Cell 14 is the weakest, and Cell 13 is the most overcharged.
- To restore uniformity and pack longevity, a balancing routine, stricter charge/discharge cut-offs, or replacing the outlier cells is advisable.
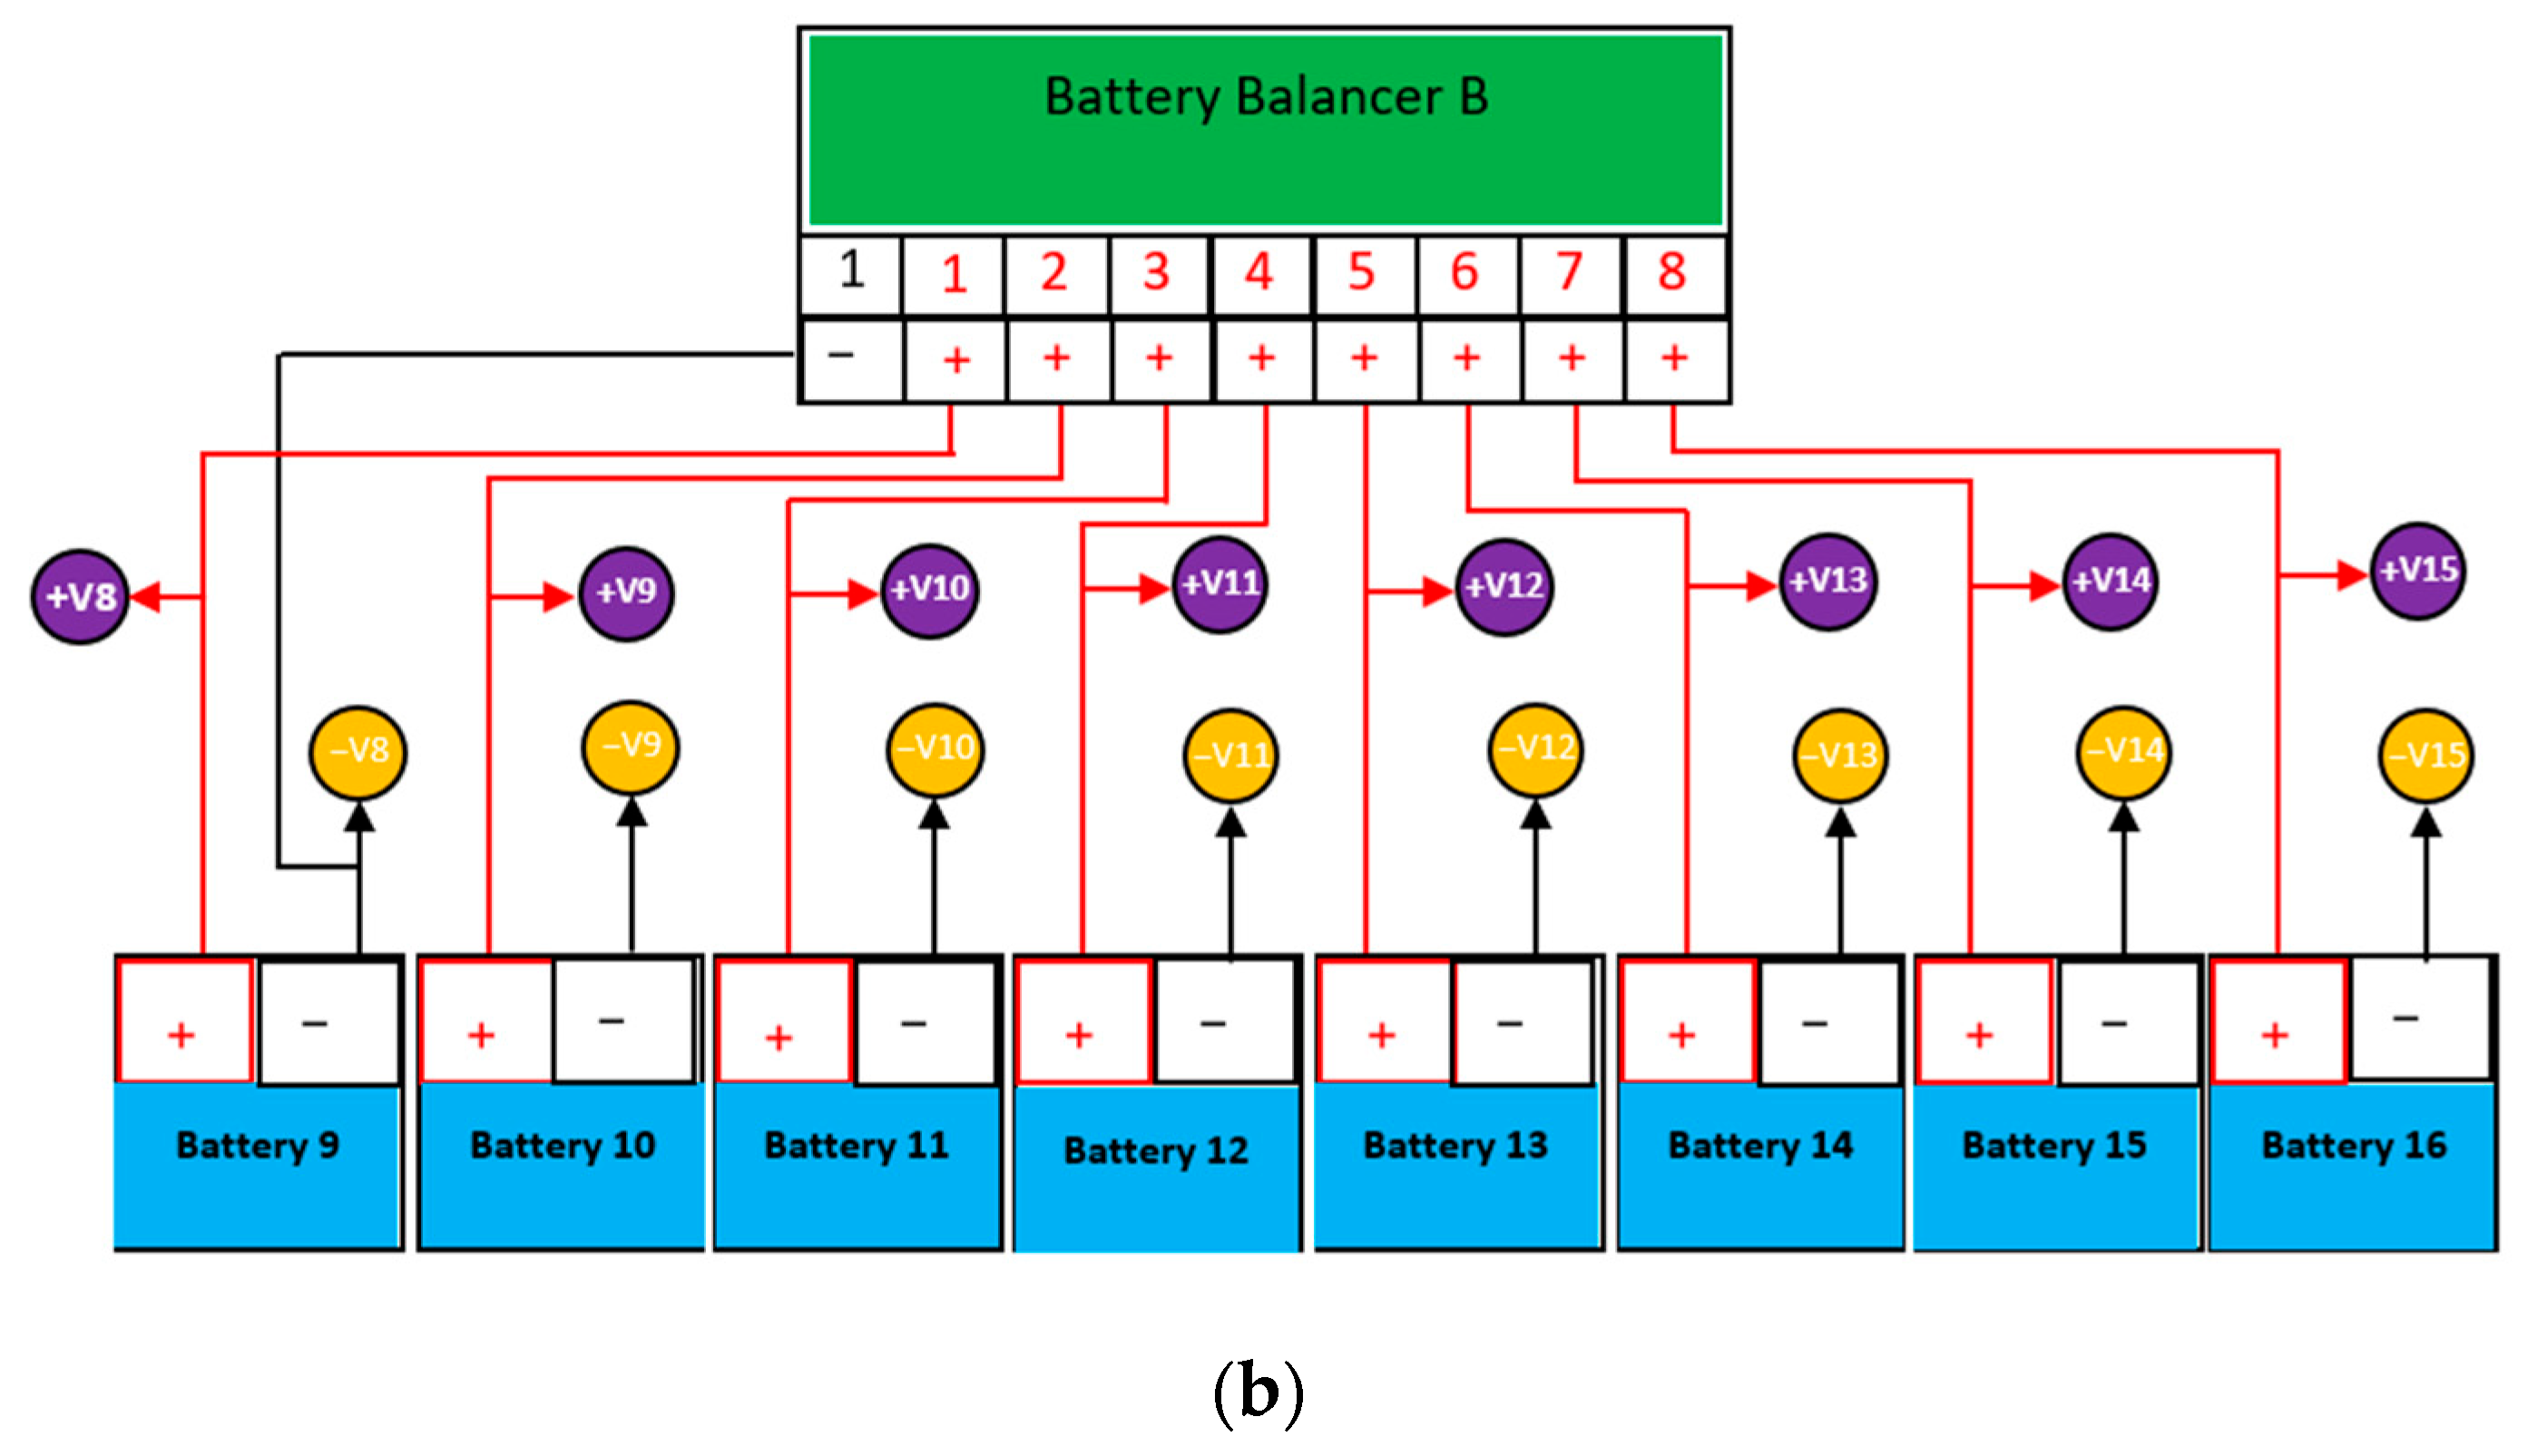
- The system successfully balanced the voltage across the batteries, ensuring uniform energy distribution and reducing the risk of overcharge or undercharge conditions.
- This monitoring system remotely tracked battery voltage, temperature, and power distribution. By prioritizing power distribution based on predefined levels, the system maintained optimal performance under varying operational loads.
- This intelligent control system is effective and reliable in decision-making, handling uncertainties in the sensor data, and adapting to fluctuating load operating conditions without compromising performance.
- Voltage sensors experienced frequent malfunctions, leading to replacement.
- Loose circuit connections resulted in repetitive system failures.
- The automatic transfer switch malfunctioned two times, resulting in replacement.
- Battery terminals began to show signs of rust.
- Batteries also experienced imbalances, most of the time.
- Several batteries exhibited bloating.
- The prepaid Wi-Fi limits the number of devices that can be connected simultaneously, hindering the whole system operation at the farm.
6. Conclusions and Recommendations
Author Contributions
Funding
Institutional Review Board Statement
Informed Consent Statement
Data Availability Statement
Acknowledgments
Conflicts of Interest
Abbreviations
| BMS | Battery Management System |
| IBMS | Intelligent Battery Management System |
| PV | Photovoltaic |
| SF | Smart Farming |
References
- Solangi, Y.A.; Magazzino, C. Evaluating financial implications of renewable energy for climate action and sustainable development goals. Renew. Sustain. Energy Rev. 2025, 212, 115390. [Google Scholar] [CrossRef]
- Ganguly, A.; Biswas, P.K.; Sain, C.; Ustun, T.S. Modern DC–DC Power Converter Topologies and Hybrid Control Strategies for Maximum Power Output in Sustainable Nanogrids and Picogrids—A Comprehensive Survey. Technologies 2023, 11, 102. [Google Scholar] [CrossRef]
- Dehghani-Sanij, A.R.; Tharumalingam, E.; Dusseault, M.B.; Fraser, R. Study of energy storage systems and environmental challenges of batteries. Renew. Sustain. Energy Rev. 2019, 104, 192–208. [Google Scholar] [CrossRef]
- Rasentharah, K.K.; Hassan, M.K.; Hoque, M.A.; Hajjo, A. Lithium Iron Phosphate (LiFePo4) Batteries Health Prognosis via Plateau Identification during High-Rate Charging and Discharging. In Proceedings of the 2023 IEEE 13th International Conference on System Engineering and Technology (ICSET), Shah Alam, Malaysia, 2 October 2023; pp. 182–187. [Google Scholar] [CrossRef]
- Kumar, J.; Neiber, R.R.; Park, J.; Soomro, R.A.; Greene, G.W.; Mazari, S.A.; Seo, H.Y.; Lee, J.H.; Shon, M.; Chang, D.W.; et al. Recent progress in sustainable recycling of LiFePO4-type lithium-ion batteries: Strategies for highly selective lithium recovery. Chem. Eng. J. 2022, 431, 133993. [Google Scholar] [CrossRef]
- Lu, Y. Study on the performance of lithium iron phosphate battery based on its application in transportation field. J. Phys. Conf. Ser. 2024, 2798, 012019. [Google Scholar] [CrossRef]
- Murlidharan, S.; Ravulakole, V.; Karnati, J.; Malik, H. Battery Management System: Threat Modeling, Vulnerability Analysis, and Cybersecurity Strategy. IEEE Access 2025, 13, 37198–37220. [Google Scholar] [CrossRef]
- Magsumbol, J.A.V.; Rosales, M.A.; Palconit, M.G.; Concepcion, R.S., II; Bandala, A.A.; Vicerra, R.R.P.; Sybingco, E.; Culaba, A.; Dadios, E.P. A Review of Smart Battery Management Systems for LiFePO4: Key Issues and Estimation Techniques for Microgrids. J. Adv. Comput. Intell. Intell. Inform. 2022, 26, 824–833. [Google Scholar] [CrossRef]
- Dai, H.; Jiang, B.; Hu, X.; Lin, X.; Wei, X.; Pecht, M. Advanced battery management strategies for a sustainable energy future: Multilayer design concepts and research trends. Renew. Sustain. Energy Rev. 2021, 138, 110480. [Google Scholar] [CrossRef]
- Krishna, G.; Singh, R.; Gehlot, A.; Akram, S.V.; Priyadarshi, N.; Twala, B. Digital Technology Implementation in Battery-Management Systems for Sustainable Energy Storage: Review, Challenges, and Recommendations. Electronics 2022, 11, 2695. [Google Scholar] [CrossRef]
- Zhou, L.; Lai, X.; Li, B.; Yao, Y.; Yuan, M.; Weng, J.; Zheng, Y. State Estimation Models of Lithium-Ion Batteries for Battery Management System: Status, Challenges, and Future Trends. Batteries 2023, 9, 131. [Google Scholar] [CrossRef]
- Vennam, G.; Sahoo, A.; Ahmed, S. A survey on lithium-ion battery internal and external degradation modeling and state of health estimation. J. Energy Storage 2022, 52, 104720. [Google Scholar] [CrossRef]
- Masakure, A.; Gill, A.; Singh, M. The Impact of Battery Charging and Discharging Current Limits on EV Battery Degradation and Safety. In Proceedings of the 2023 3rd Asian Conference on Innovation in Technology (ASIANCON), Ravet IN, India, 25–27 August 2023; pp. 1–5. [Google Scholar] [CrossRef]
- Vinodkumar; Singha, N.S. Battery Management System Health Monitoring Using Artificial Intelligence. In Proceedings of the 2023 International Conference on Sustainable Emerging Innovations in Engineering and Technology (ICSEIET), Ghaziabad, India, 14–15 September 2023; pp. 31–35. [Google Scholar] [CrossRef]
- Wang, H.; Tsang, K.F.; Wu, C.K.; Wei, Y.; Liu, Y.; Lai, C.S. IEEE P2668 Compatible Evaluation Strategy for Smart Battery Management Systems. Sensors 2022, 22, 6057. [Google Scholar] [CrossRef] [PubMed]
- E. Committee, I. Power, E. Society. IEEE Recommended Practice for Battery Management Systems in Stationary Energy Storage Applications. 2024. Available online: https://ieeexplore.ieee.org/browse/standards/collection/ieee (accessed on 13 May 2025).
- Plett, G.L. Battery Management System: Equivalent Circuit Methods; Artech House: Norwood, MA, USA, 2016; Volume 2. [Google Scholar]
- Hannan, M.A.; Lipu, M.S.H.; Hussain, A.; Mohamed, A. A review of lithium-ion battery state of charge estimation and management system in electric vehicle applications: Challenges and recommendations. Renew. Sustain. Energy Rev. 2017, 78, 834–854. [Google Scholar] [CrossRef]
- Lee, H.; Park, J.; Kim, J. Incremental capacity curve peak points-based regression analysis for the state-of-health prediction of a retired LiNiCoAlO2 series/parallel configured battery pack. Electronics 2019, 8, 1118. [Google Scholar] [CrossRef]
- Song, Z.; Yang, X.G.; Yang, N.; Delgado, F.P.; Hofmann, H.; Sun, J. A study of cell-to-cell variation of capacity in parallel-connected lithium-ion battery cells. ETransportation 2021, 7, 100091. [Google Scholar] [CrossRef]
- Lelie, M.; Braun, T.; Knips, M.; Nordmann, H.; Ringbeck, F.; Zappen, H.; Sauer, D.U. Battery management system hardware concepts: An overview. Appl. Sci. 2018, 8, 534. [Google Scholar] [CrossRef]
- Hu, X.; Feng, F.; Liu, K.; Zhang, L.; Xie, J.; Liu, B. State estimation for advanced battery management: Key challenges and future trends. Renew. Sustain. Energy Rev. 2019, 114, 109334. [Google Scholar] [CrossRef]
- Kumar, R.; Das, K. Lithium battery prognostics and health management for electric vehicle application—A perspective review. Sustain. Energy Technol. Assess. 2024, 65, 103766. [Google Scholar] [CrossRef]
- Pastor-Fernández, C.; Widanage, W.D.; Chouchelamane, G.H.; Marco, J. A SoH diagnosis and prognosis method to identify and quantify degradation modes in Li-ion batteries using the IC/DV technique. In Proceedings of the 6th Hybrid and Electric Vehicles Conference (HEVC 2016), London, UK, 2–3 November 2016; pp. 1–6. [Google Scholar] [CrossRef]
- Li, X.; Lin, N.; Wang, Z.; Chen, K.; Zhang, Z.; Li, Q. Identification of electric vehicle susceptible to thermal runaway based on risk accumulation. Heliyon 2025, 11, e42562. [Google Scholar] [CrossRef]
- Dini, P.; Paolini, D. Exploiting Artificial Neural Networks for the State of Charge Estimation in EV/HV Battery Systems: A Review. Batteries 2025, 11, 107. [Google Scholar] [CrossRef]
- Lombardi, W.; Zarudniev, M.; Lesecq, S.; Bacquet, S. Sensors fault diagnosis for a BMS. In Proceedings of the 2014 European Control Conference (ECC), Strasbourg, France, 24–27 June 2014; pp. 952–957. [Google Scholar] [CrossRef]
- Tran, M.K.; Fowler, M. A review of lithium-ion battery fault diagnostic algorithms: Current progress and future challenges. Algorithms 2020, 13, 62. [Google Scholar] [CrossRef]
- Muangprathub, J.; Boonnam, N.; Kajornkasirat, S.; Lekbangpong, N.; Wanichsombat, A.; Nillaor, P. IoT and agriculture data analysis for smart farm. Comput. Electron. Agric. 2019, 156, 467–474. [Google Scholar] [CrossRef]
- Grogan, A. Smart farming. Eng. Technol. 2012, 7, 38–40. [Google Scholar] [CrossRef]
- de Ocampo, A.L.P.; Dadios, E.P. Integrated weed estimation and pest damage detection in solanum melongena plantation via aerial vision-based proximal sensing. Philipp. J. Sci. 2021, 150, 1039–1050. [Google Scholar] [CrossRef]
- De Ocampo, A.L.P.; Bandala, A.A.; Dadios, E.P. Coverage Path Planning on Multi-Depot, Fuel Constraint UAV Missions for Smart Farm Monitoring. In Proceedings of the 2018 IEEE Region Ten Symposium (Tensymp), Sydney, NSW, Australia, 4–6 July 2018; pp. 13–18. [Google Scholar] [CrossRef]
- Alejandrino, J.; Concepcion, R.; Almero, V.J.; Palconit, M.G.; Bandala, A.; Dadios, E. A Hybrid Data Acquisition Model using Artificial Intelligence and IoT Messaging Protocol for Precision Farming. In Proceedings of the 2020 IEEE 12th International Conference on Humanoid, Nanotechnology, Information Technology, Communication and Control, Environment, and Management (HNICEM), Manila, Philippines, 3–7 December 2020. [Google Scholar] [CrossRef]
- Obi Reddy, G.P.; Dwivedi, B.S.; Ravinda, C.G. Applications of Geospatial and Big Data Technologies in Smart Farming. In Smart Agriculture for Developing Nations Status, Perspectives and Challenges; Springer: Singapore, 2023. [Google Scholar] [CrossRef]
- Javaid, M.; Haleem, A.; Singh, R.P.; Suman, R. Enhancing smart farming through the applications of Agriculture 4.0 technologies. Int. J. Intell. Netw. 2022, 3, 150–164. [Google Scholar] [CrossRef]
- Lauguico, S.C.; Concepcion, R.S.; Alejandrino, J.D.; Tobias, R.R.; Macasaet, D.D.; Dadios, E.P. A comparative analysis of machine learning algorithms modeled from machine vision-based lettuce growth stage classification in smart aquaponics. Int. J. Environ. Sci. Dev. 2020, 11, 442–449. [Google Scholar] [CrossRef]
- Hoeren, T.; Kolany-Raiser, B. Big Data in Context Legal, Social and Technological Insights; Springer Open: London, UK, 2018. [Google Scholar] [CrossRef]
- Yépez-Ponce, D.F.; Salcedo, J.V.; Rosero-Montalvo, P.D.; Sanchis, J. Mobile robotics in smart farming: Current trends and applications. Front. Artif. Intell. 2023, 6, 1213330. [Google Scholar] [CrossRef]
- Vangala, A.; Sutrala, A.K.; Das, A.K.; Jo, M. Smart Contract-Based Blockchain-Envisioned Authentication Scheme for Smart Farming. IEEE Internet Things J. 2021, 8, 10792–10806. [Google Scholar] [CrossRef]
- Praveen, P.; Shaik, M.A.; Kumar, T.S.; Choudhury, T. Smart Farming: Securing Farmers Using Block Chain Technology and IOT. In Blockchain Applications in IoT Ecosystem; EAI/Springer Innovations in Communication and Computing; Springer: Cham, Switzerland, 2021; pp. 225–238. [Google Scholar] [CrossRef]
- Bayod-Rújula, A.A. Solar Photovoltaics (PV); Elsevier Inc.: Amsterdam, The Netherlands, 2019. [Google Scholar] [CrossRef]
- Usman, Z.; Tah, J.; Abanda, H.; Nche, C. A Critical Appraisal of Pv-Systems’ Performance. Buildings 2020, 10, 192. [Google Scholar] [CrossRef]
- Singh, A.K.; Agrawal, A.K.; Vohra, S.; Thakur, S.S.; Patel, G. Solar Charge Controller. Int. J. Acad. Res. Dev. 2017, 2, 994–1001. [Google Scholar]
- Alaoui, C. Modular energy efficient and solid-state Battery Thermal Management System. In Proceedings of the 2017 International Conference on Wireless Technologies, Embedded and Intelligent Systems (WITS), Fez, Morocco, 19–20 April 2017; pp. 1–6. [Google Scholar] [CrossRef]
- Shridhar, S.M.; Reddy, S.; Kishore, Y.K. Modeling and Simulation Analysis of Cell Voltage Balancing Techniques for Lithium-Ion EV Battery. In Proceedings of the 2024 Third International Conference on Distributed Computing and Electrical Circuits and Electronics (ICDCECE), Ballari, India, 26–27 April 2024. [Google Scholar] [CrossRef]
- Baicu, L.M.; Andrei, M. Microcontroller-Based Platform for Lithium-Ion Battery Charging and Experimental Evaluation of Charging Strategies. Technologies 2025, 13, 178. [Google Scholar] [CrossRef]
- Niculuţǎ, M.C.; Veje, C. Analysis of the thermal behavior of a LiFePO4 battery cell. J. Phys. Conf. Ser. 2012, 395, 012013. [Google Scholar] [CrossRef]
- Kar, M.K.; Patra, B.N. Design and Analysis of MPPT Charge Controller. In Proceedings of the 2021 International Conference on Simulation, Automation & Smart Manufacturing (SASM), Mathura, India, 20–21 August 2021; pp. 1–4. [Google Scholar] [CrossRef]
- Hidayat, M.N.; Munir, A.F.; Nugroho, A.; Muzakhim, A. Automatic Transfer Switch for Hybrid Sources On Portable E-bike Charging Station. In Proceedings of the 2023 International Conference on Electrical and Information Technology (IEIT), Malang, Indonesia, 14–15 September 2023; pp. 152–158. [Google Scholar] [CrossRef]
- Solanki, S.G.; Ramasamy, M.; Manzoor, S.; Ganesalingam, U.K.R. Design & Development for off grid Solar Inverter. In Proceedings of the 2018 IEEE 4th International Symposium in Robotics and Manufacturing Automation (ROMA), Perambalur, India, 10–12 December 2018. [Google Scholar] [CrossRef]
- Suyanto, H.; Erlina; Diantari, R.A.; Al Rasyid, H. Study on Optimization of System Management Battery for Lithium Batteries and Lead Acid Batteries at the New and Renewable Energy Research Center IT PLN. In Proceedings of the 2021 IEEE 5th International Conference on Information Technology, Information Systems and Electrical Engineering (ICITISEE), Purwokerto, Indonesia, 24–25 November 2021; pp. 213–218. [Google Scholar] [CrossRef]
- Mirela, O.; Pereus, D.; Simionas, A. Comparative Analysis of Active Balancing Types for Lithium-Ion Cells. In Proceedings of the 2024 IEEE 30th International Symposium for Design and Technology in Electronic Packaging (SIITME), Sibiu, Romania, 16–18 October 2024; pp. 352–357. [Google Scholar] [CrossRef]


| i-BMS Parameter | Purpose |
|---|---|
| Cell temperature | Detect thermal stress and prevent thermal runaway |
| Cell voltage | Track cell balance and health status |
| Pack current | Compute charge/discharge rates |
| SOC | Estimate remaining capacity |
| Instantaneous load demand | Match supply with priority loads |
| i-BMS Subsystem Module | Function |
|---|---|
| CPU | Aggregates sensor data, executes fuzzy rules, and broadcasts control signals to all subordinate units. |
| BMCU | Measures cell temperature, voltage, current, and SOC; manages balancing circuits and charge relays. |
| SMCU | Reads PV power output and governs PV to controller connection through a dedicated relay. |
| LMCU | Track consumption for three loads—essential, regular, and non-essential—and switch each via separate relays. |
| ATSCU | Commands the ATS to toggle the DC bus between the PV system and the utility grid. |
| No. | Input Linguistic Variable | Conditions | Unit | ||
|---|---|---|---|---|---|
| 1 | SOC | Low 0–30 | Moderate 20–80 | High 70–100 | % |
| 2 | Vcell | Low 2.0–2.5 | Moderate 2.3–3.5 | High 3.2–3.6 | V |
| 3 | Tcell | Low 0–20 | Moderate 15–45 | High 40–60 | °C |
| Parameter | Description | ||
|---|---|---|---|
| 1 | 2 | 3 | |
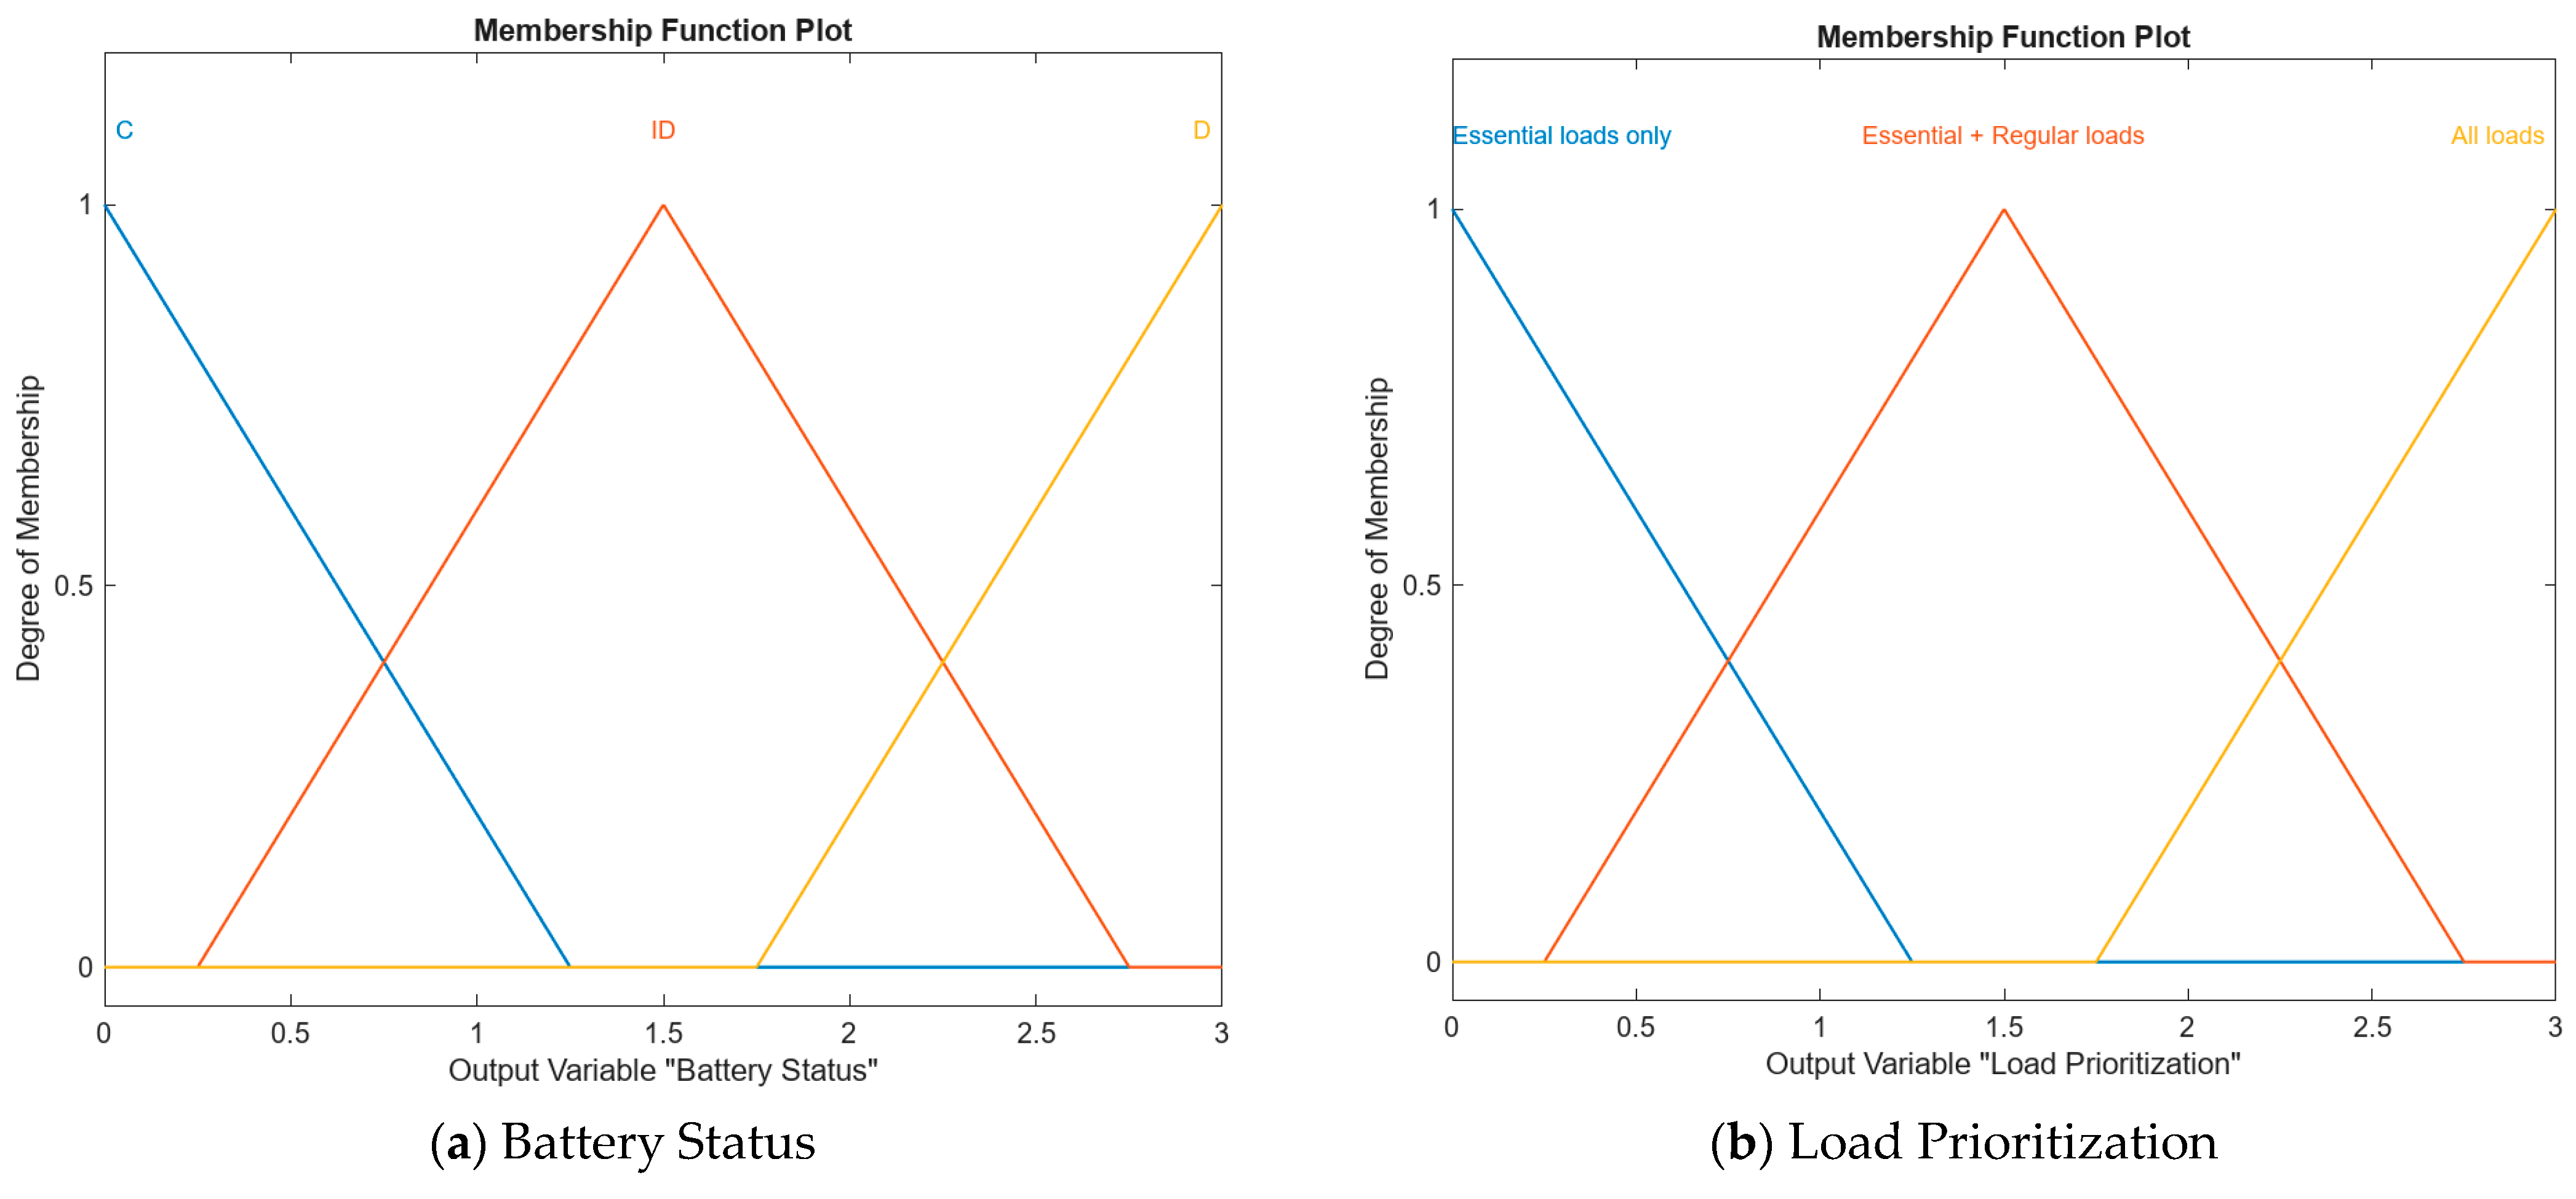
| Battery Status | C | ID | D |
| Load Prioritization | E | E + R | All |
| Rule | Input Linguistic Variable IF | Output Status THEN | |||
|---|---|---|---|---|---|
| SOC | Vcell | Tcell | Battery Status | Load Prioritization | |
| 1 | Low | Low | Low | C | E |
| 2 | Low | Low | Mod | C | E |
| 3 | Low | Low | High | ID | E |
| 4 | Low | Mod | Low | C | E |
| 5 | Low | Mod | Mod | C | E |
| 6 | Low | Mod | High | ID | E |
| 7 | Low | High | Low | C | E |
| 8 | Low | High | Mod | C | E |
| 9 | Low | High | High | ID | E |
| 10 | High | Low | Low | D | All |
| 11 | High | Low | Mod | D | All |
| 12 | High | Low | High | ID | E |
| 13 | High | Mod | Low | D | All |
| 14 | High | Mod | Mod | D | All |
| 15 | High | Mod | High | ID | E |
| 16 | High | High | Low | D | All |
| 17 | High | High | Mod | D | All |
| 18 | High | High | High | ID | E |
| 19 | Mod | Low | Low | C | E + R |
| 20 | Mod | Low | Mod | C | E |
| 21 | Mod | Low | High | ID | E |
| 22 | Mod | Mod | Low | D | All |
| 23 | Mod | Mod | Mod | D | All |
| 24 | Mod | Mod | High | ID | E |
| 25 | Mod | High | Low | D | All |
| 26 | Mod | High | Mod | D | All |
| 27 | Mod | High | High | ID | E |
| Parameter | Typical Value |
|---|---|
| Nominal Capacity | 202 Ah |
| Nominal Voltage | 3.2 V |
| Internal Resistance | ≤0.4 mΩ |
| Max. Charging Current | 0.5 C (Continuous), 1 C (30 s) |
| Charging Voltage | 3.65 V |
| Max. Discharging Current | 0.5 C (Continuous), 1 C (30 s) |
| Discharging Cut-off Voltage | 2.5 V (>0 °C), 2.0 V (≤0 °C) |
| Operating temperature | Charging: −20 °C~55 °C |
| Discharging: −30 °C~55 °C | |
| Dimension | 54 × 173 × 205 mm |
| Cycle life | ≥2000 cycles |
| Device | Model | Parameter | Typical Value |
|---|---|---|---|
| Voltage sensor | Voltage Detection Sensor Module 25 V Sensor | Input Voltage range | DC 0 to 25 V |
| Voltage detection range | DC 0.02445 V to 25 V | ||
| Analog Voltage resolution | 0.00489 V (5 V/1023) | ||
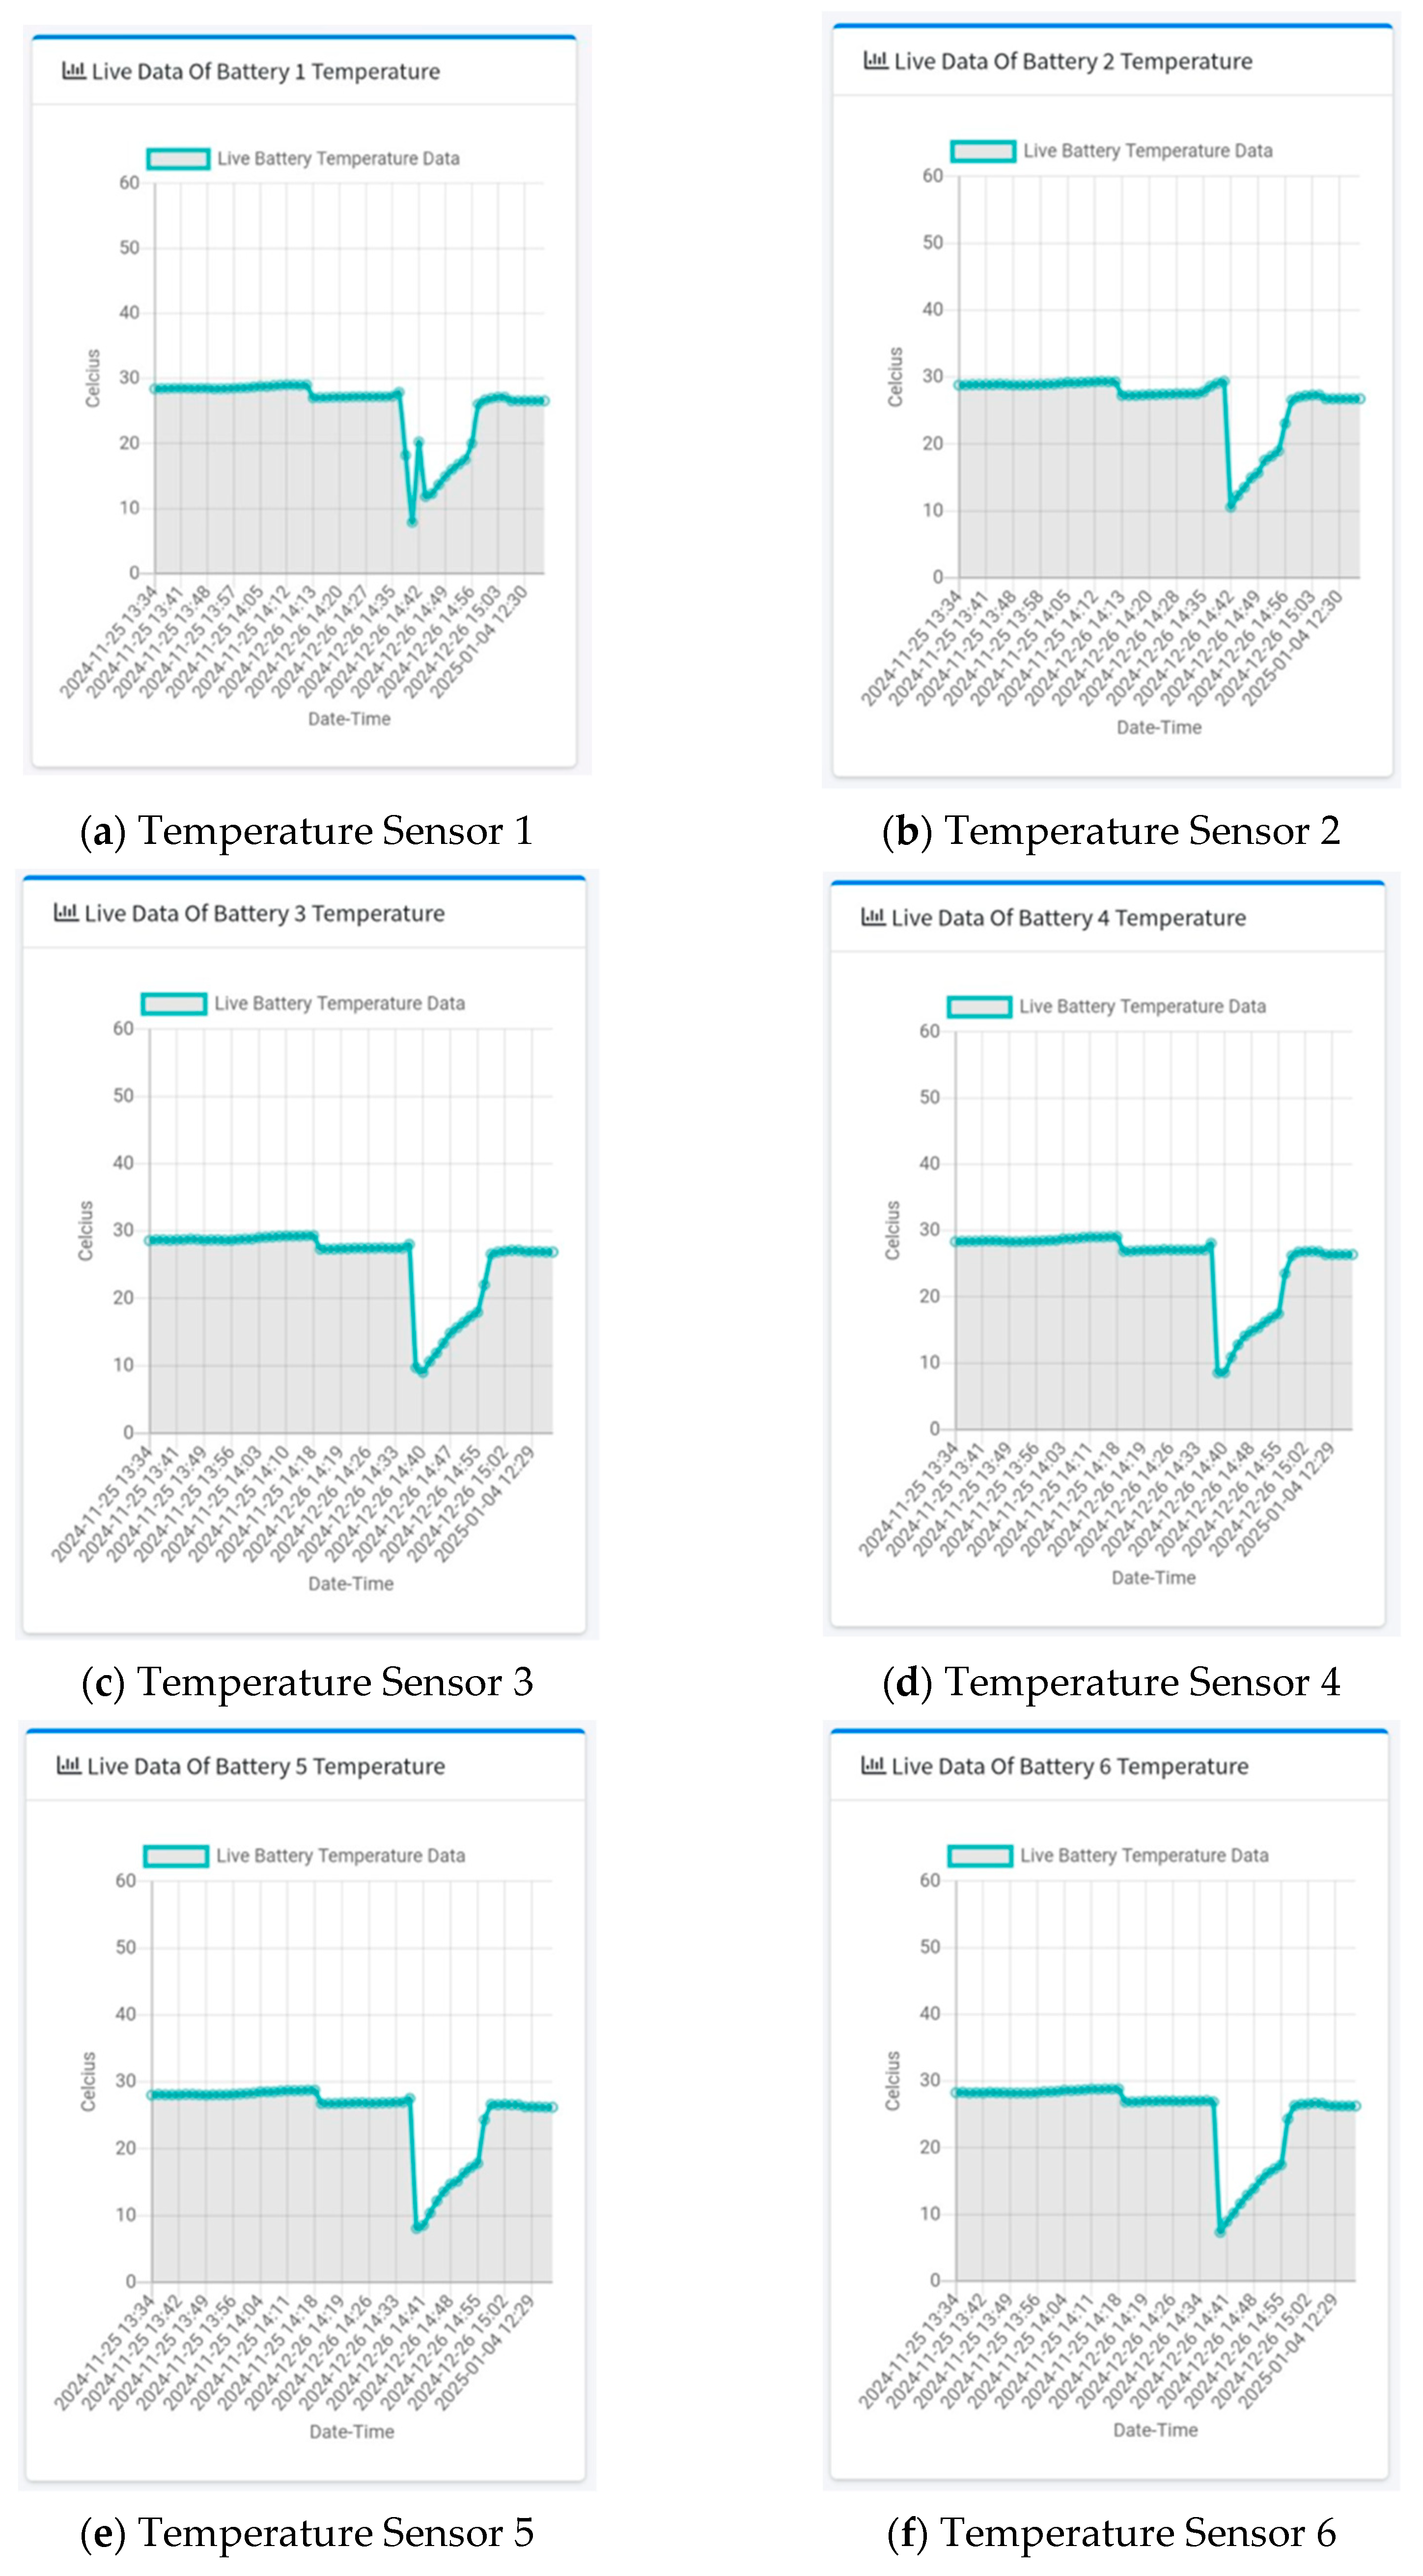
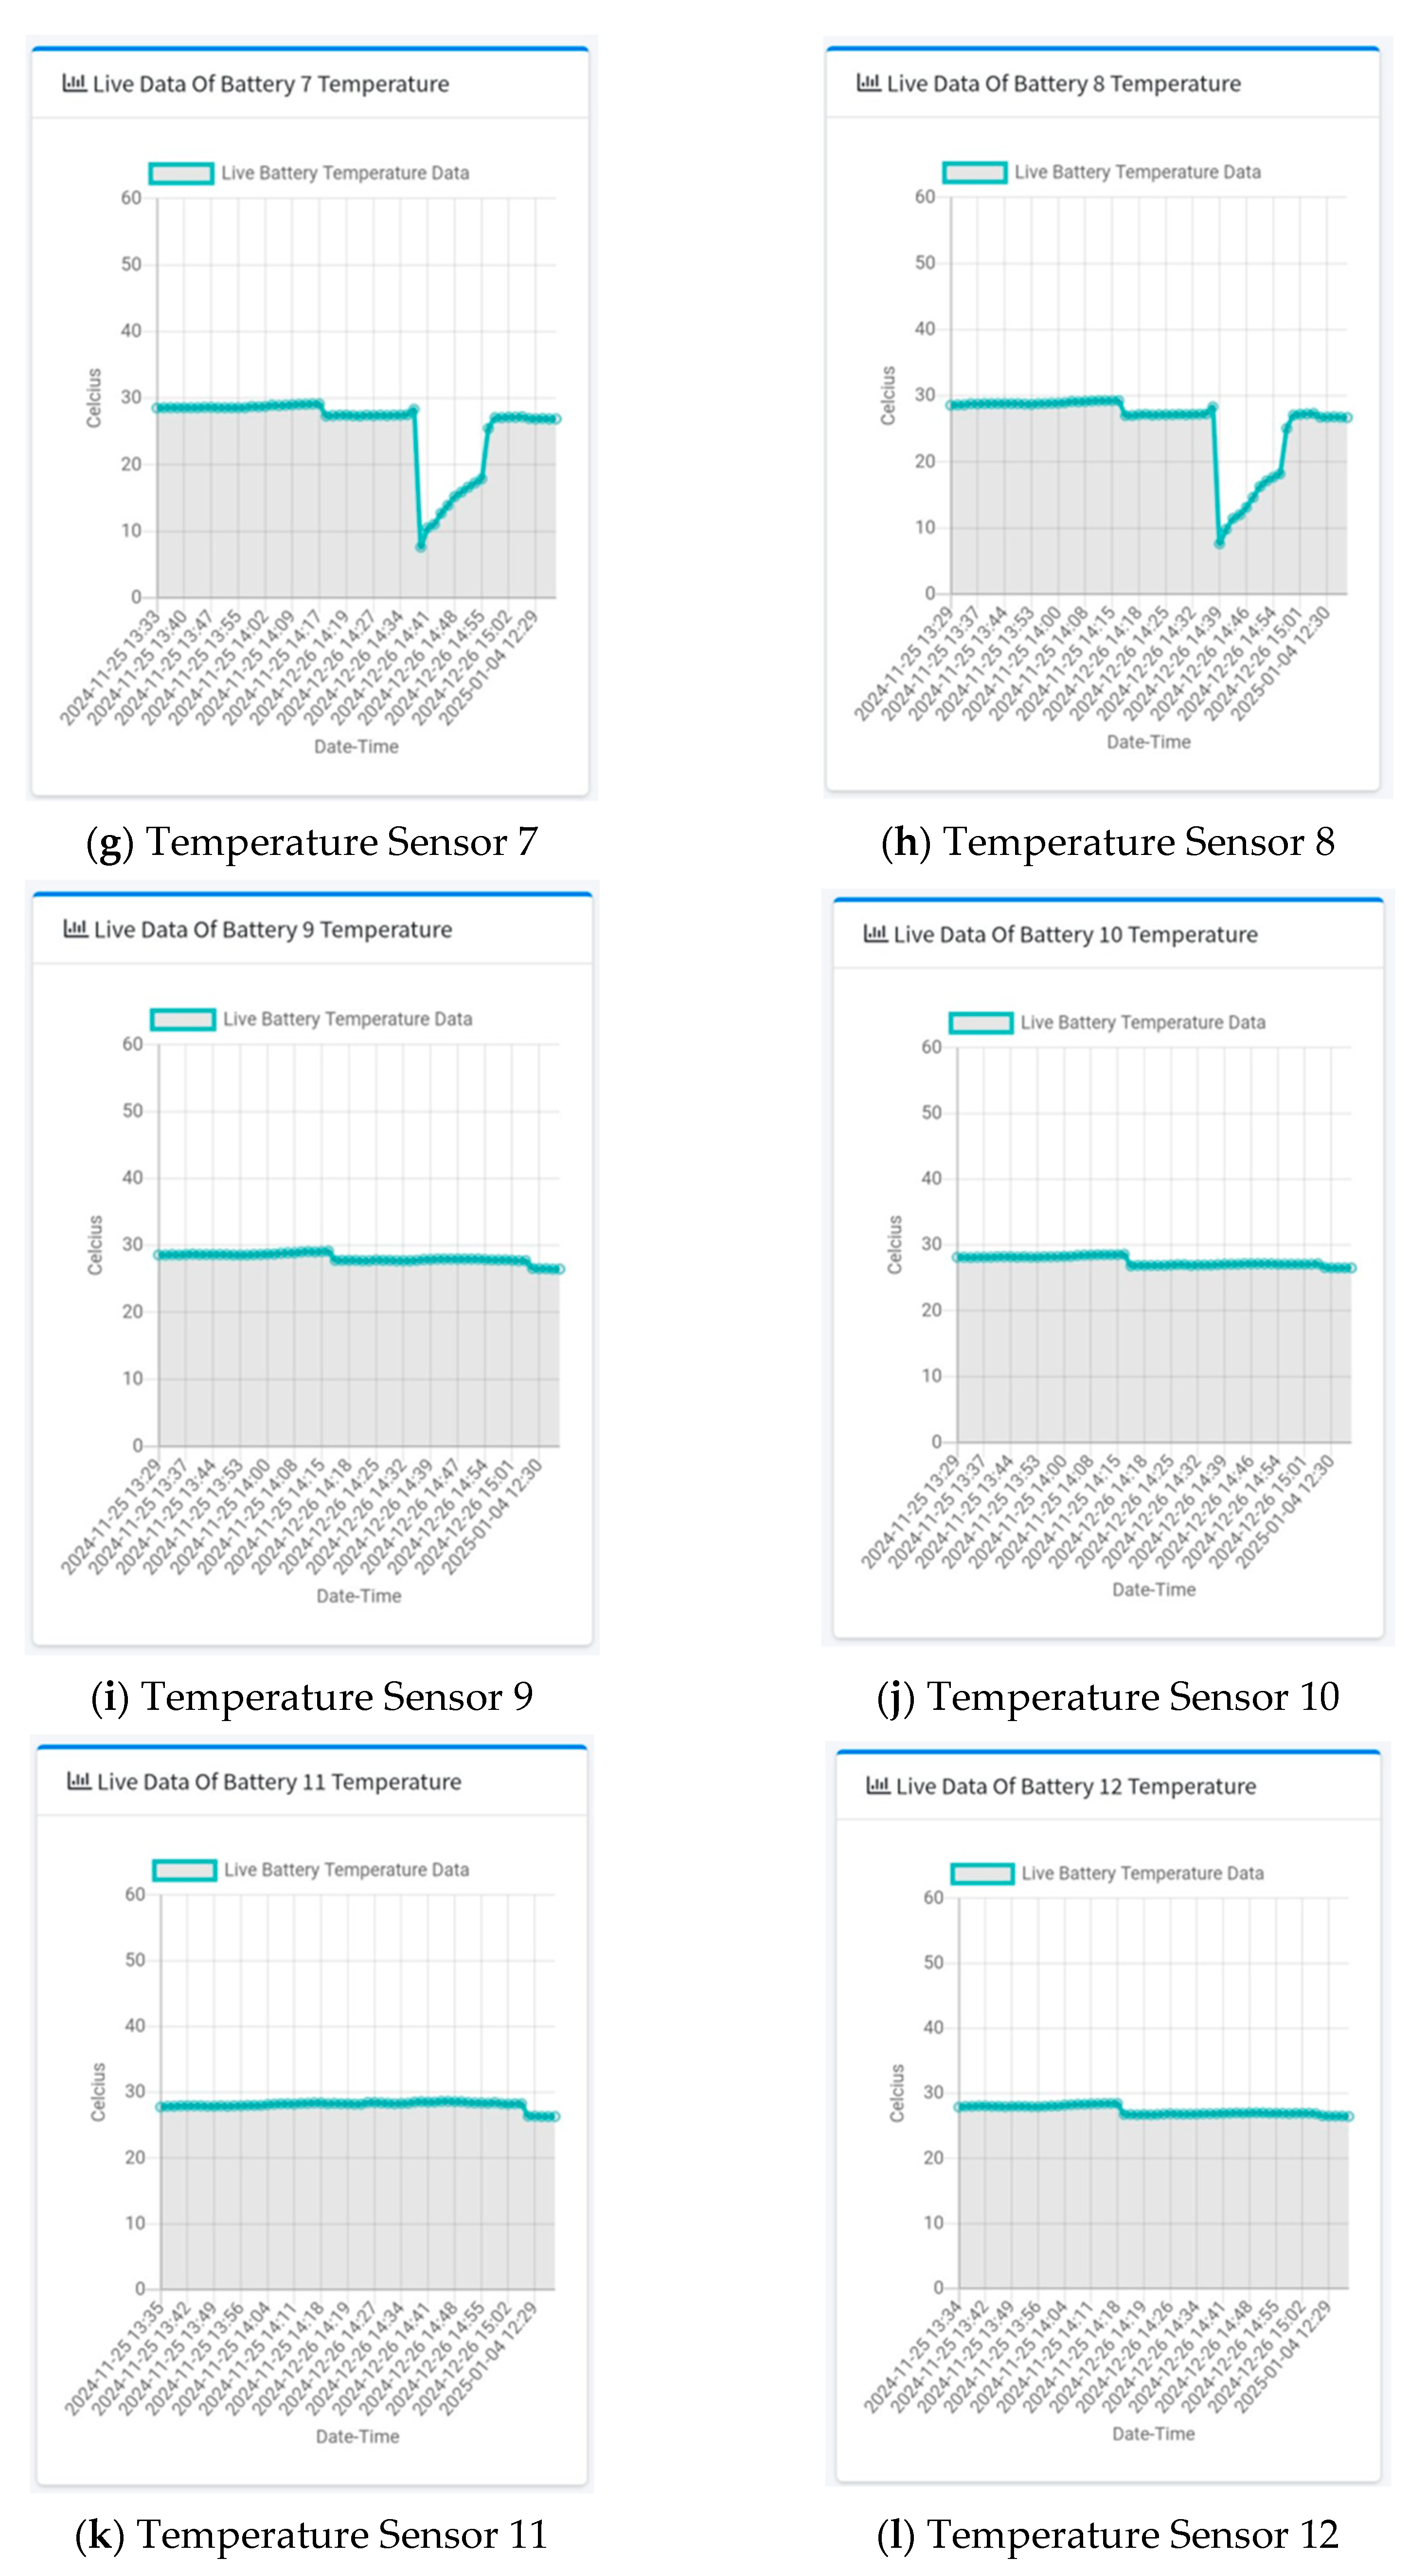
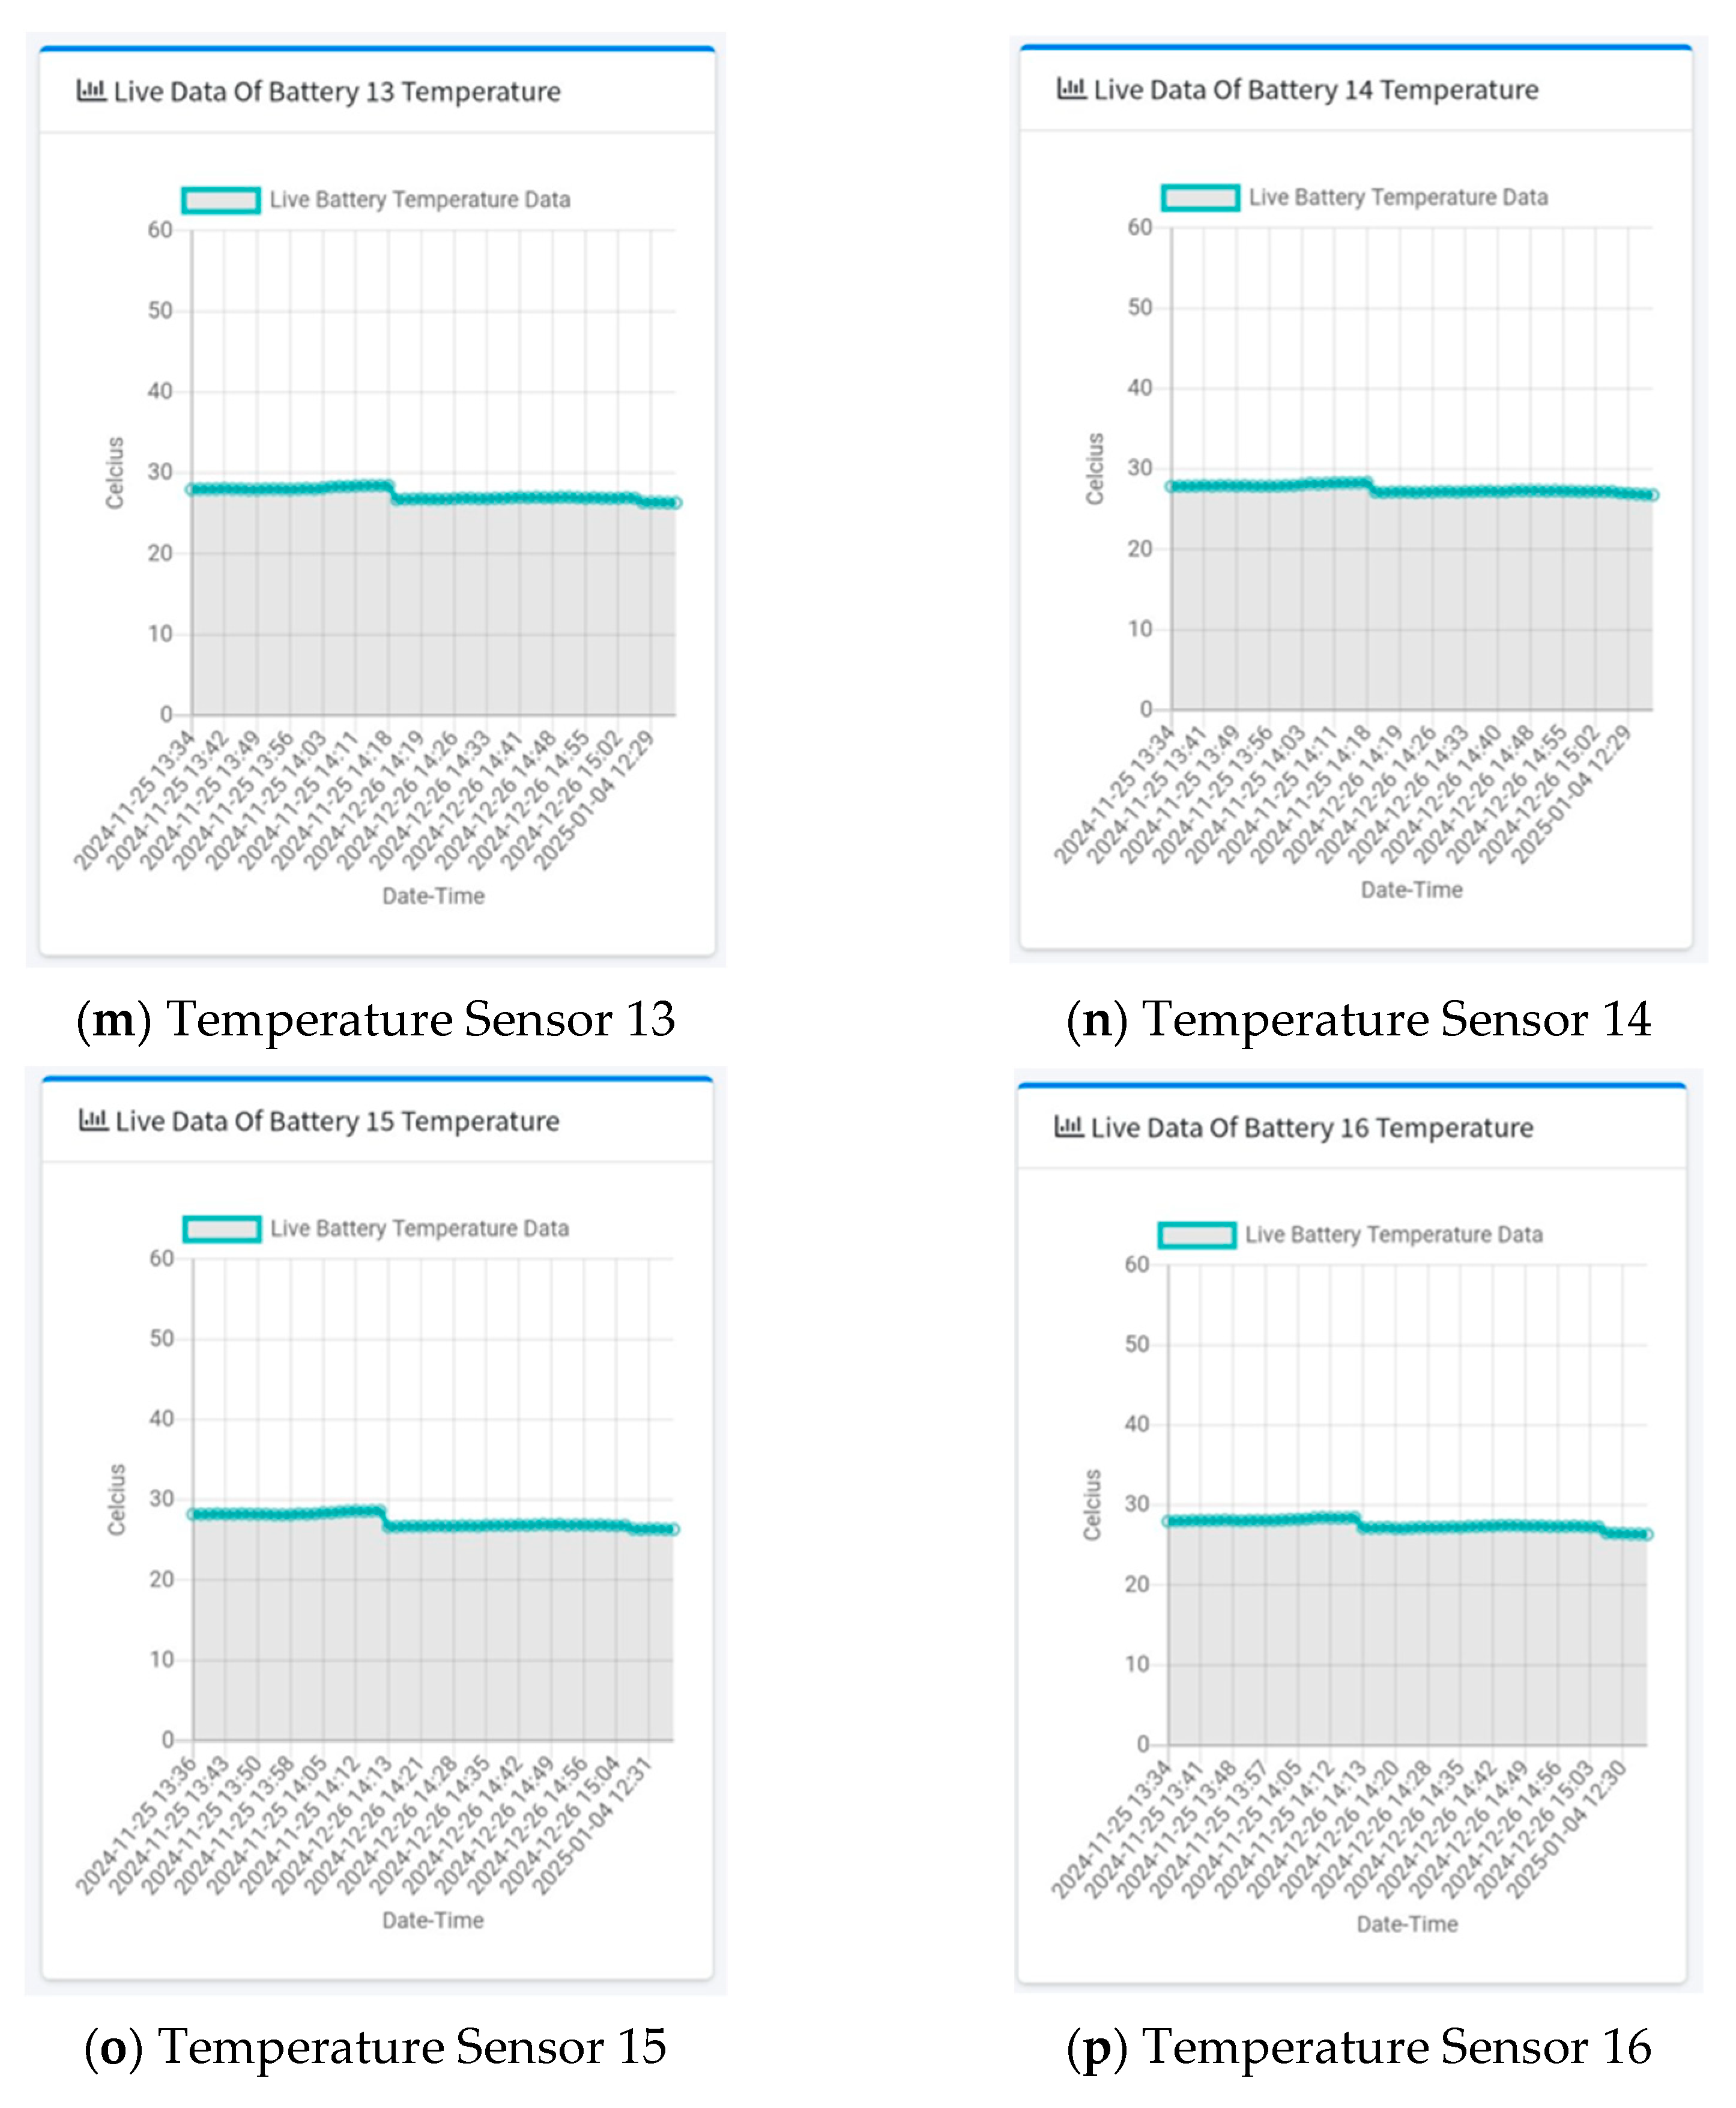
| Temperature sensor | DS18B20 | Supply Voltage | |
| +3.0 | ||
| +5.5 | ||
| Thermometer Error | |||
| −10 °C to +85 °C | |||
| ±0.5 | ||
| PZEM-004T AC communication module | PZEM-004T | Voltage | |
| 80~260 V | ||
| 0.1 V | ||
| 0.5% | ||
| Current | |||
| 0~100 A | ||
| Active Power | |||
| 0~23 kW | ||
| 0.4 W | ||
| 0.1 W | ||
| 0.5% | ||
| Power factor | |||
| 0~1.00 | ||
| 0.1 | ||
| 1% |
| Battery No. | N | Mean | SE Mean | Std Dev | Min | Q1 | Median | Q3 | Max |
|---|---|---|---|---|---|---|---|---|---|
| 1 | 4706 | 3.20778 | 0.001195 | 0.081993 | 2.75 | 3.15 | 3.20 | 3.28 | 3.79 |
| 2 | 4705 | 3.23062 | 0.001379 | 0.094606 | 2.72 | 3.16 | 3.23 | 3.32 | 3.78 |
| 3 | 4722 | 3.17050 | 0.001915 | 0.131613 | 2.69 | 3.09 | 3.16 | 3.29 | 3.75 |
| 4 | 4718 | 3.22873 | 0.001132 | 0.077756 | 2.78 | 3.16 | 3.22 | 3.30 | 3.90 |
| 5 | 4714 | 3.12503 | 0.001788 | 0.122780 | 2.60 | 3.02 | 3.10 | 3.24 | 3.60 |
| 6 | 4714 | 3.16185 | 0.001266 | 0.086973 | 2.73 | 3.10 | 3.16 | 3.24 | 3.53 |
| 7 | 4715 | 3.15788 | 0.001342 | 0.092181 | 2.43 | 3.08 | 3.15 | 3.24 | 3.70 |
| 8 | 4711 | 3.13437 | 0.001640 | 0.112619 | 2.55 | 3.04 | 3.15 | 3.24 | 3.52 |
| 9 | 4684 | 3.19580 | 0.001195 | 0.164421 | 2.02 | 3.16 | 3.23 | 3.30 | 3.80 |
| 10 | 4715 | 3.24445 | 0.001379 | 0.077446 | 2.80 | 3.18 | 3.24 | 3.32 | 3.62 |
| 11 | 4706 | 3.17577 | 0.001915 | 0.066561 | 2.72 | 3.13 | 3.16 | 3.24 | 3.46 |
| 12 | 4715 | 3.05919 | 0.001132 | 0.175828 | 2.54 | 2.91 | 3.05 | 3.23 | 3.57 |
| 13 | 2748 | 3.36663 | 0.001788 | 0.195578 | 2.89 | 3.25 | 3.30 | 3.45 | 3.99 |
| 14 | 4724 | 3.01741 | 0.001266 | 0.222009 | 2.41 | 2.79 | 2.99 | 3.24 | 3.66 |
| 15 | 4715 | 3.24098 | 0.001342 | 0.061240 | 2.93 | 3.20 | 3.24 | 3.29 | 3.55 |
| 16 | 4708 | 3.23071 | 0.001640 | 0.075105 | 2.78 | 3.17 | 3.23 | 3.29 | 3.61 |
| Battery No. | N | Mean | SE Mean | Std Dev | Min | Q1 | Median | Q3 | Max |
|---|---|---|---|---|---|---|---|---|---|
| 1 | 4706 | 26.9717 | 0.021036 | 1.44312 | 18.94 | 25.81 | 26.75 | 28.12 | 29.87 |
| 2 | 4705 | 27.2164 | 0.027771 | 1.90493 | 24.31 | 25.56 | 26.87 | 28.62 | 32.13 |
| 3 | 4722 | 27.3226 | 0.020485 | 1.40766 | 24.94 | 26.19 | 27.13 | 28.44 | 30.31 |
| 4 | 4718 | 26.9871 | 0.020545 | 1.41121 | 24.63 | 25.81 | 26.81 | 28.12 | 29.94 |
| 5 | 4714 | 26.7711 | 0.020895 | 1.43462 | 24.37 | 25.56 | 26.56 | 27.94 | 30.00 |
| 6 | 4714 | 27.0127 | 0.019921 | 1.36778 | 24.69 | 25.88 | 26.81 | 28.06 | 29.75 |
| 7 | 4715 | 27.1802 | 0.021284 | 1.46149 | 24.75 | 25.94 | 26.94 | 28.38 | 30.37 |
| 8 | 4711 | 27.2619 | 0.021034 | 1.44371 | 24.87 | 26.06 | 27.00 | 28.44 | 30.31 |
| 9 | 4684 | 27.0942 | 0.023246 | 1.59095 | 24.69 | 25.75 | 26.75 | 28.3625 | 31.00 |
| 10 | 4715 | 27.1392 | 0.023740 | 1.63019 | 24.69 | 25.75 | 26.81 | 28.44 | 31.00 |
| 11 | 4706 | 27.2880 | 0.020209 | 1.38641 | 25.00 | 26.12 | 27.06 | 28.44 | 30.31 |
| 12 | 4715 | 27.2454 | 0.018574 | 1.27540 | 25.06 | 26.19 | 27.06 | 28.25 | 29.69 |
| 13 | 2748 | 26.8862 | 0.028988 | 1.51961 | 24.63 | 25.56 | 26.69 | 28.12 | 30.94 |
| 14 | 4724 | 27.1918 | 0.024216 | 1.66443 | 24.63 | 25.75 | 26.81 | 28.50 | 31.31 |
| 15 | 4715 | 27.1583 | 0.019245 | 1.32149 | 24.94 | 26.06 | 27.00 | 28.25 | 29.81 |
| 16 | 4708 | 26.9070 | 0.019101 | 1.31065 | 24.69 | 25.81 | 26.75 | 27.94 | 29.56 |
| SM-2024|Load Monitoring | |||||
|---|---|---|---|---|---|
| ID | Voltage (V) | Current (A) | Power (W) | Time | Load Category |
| 23680 | 239.00 | 0.27 | 53.9 | 15:01 | Regular |
| 23682 | 238.70 | 0.27 | 53.8 | 15:01 | Regular |
| 23685 | 238.20 | 0.27 | 53.6 | 15:03 | Regular |
| 23688 | 238.10 | 0.27 | 53.6 | 15:05 | Regular |
| 23689 | 238.40 | 0.26 | 37.4 | 15:06 | Non-Essential |
| 23690 | 237.90 | 0.27 | 39.4 | 15:08 | Non-Essential |
| 23691 | 237.10 | 0.11 | 15.6 | 15:08 | Essential |
| 23692 | 237.50 | 0.27 | 53.3 | 15:08 | Regular |
| 23693 | 237.80 | 0.27 | 53.5 | 15:12 | Essential |
| 23694 | 237.80 | 0.22 | 32.4 | 15:12 | Non-Essential |
| 23695 | 237.60 | 0.08 | 10.4 | 15:12 | Regular |
| 23696 | 237.30 | 0.27 | 53.8 | 15:14 | Essential |
| 23697 | 237.60 | 0.27 | 53.9 | 15:16 | Essential |
| 23698 | 238.20 | 0.21 | 29.3 | 15:19 | Non-Essential |
| 23700 | 237.60 | 0.27 | 53.8 | 15:19 | Essential |
| 23701 | 237.00 | 0.27 | 53.5 | 15:20 | Essential |
| 23702 | 238.70 | 0.18 | 25.2 | 15:20 | Non-Essential |
| 23704 | 237.40 | 0.17 | 24.1 | 15:22 | Non-Essential |
| 23706 | 237.50 | 0.27 | 53.8 | 15:23 | Essential |
| 23707 | 238.30 | 0.19 | 27.2 | 15:23 | Non-Essential |
| 23709 | 237.40 | 0.27 | 53.8 | 15:30 | Essential |
| 23710 | 237.90 | 0.27 | 53.9 | 15:33 | Essential |
| 23714 | 237.60 | 0.27 | 53.9 | 15:35 | Essential |
| 23719 | 237.70 | 0.27 | 53.5 | 15:43 | Essential |
| 23723 | 237.20 | 0.27 | 53.8 | 15:47 | Essential |
| 23727 | 237.00 | 0.27 | 53.5 | 15:53 | Essential |
| 23677 | 237.90 | 0.27 | 53.4 | 15:58 | Regular |
Disclaimer/Publisher’s Note: The statements, opinions and data contained in all publications are solely those of the individual author(s) and contributor(s) and not of MDPI and/or the editor(s). MDPI and/or the editor(s) disclaim responsibility for any injury to people or property resulting from any ideas, methods, instructions or products referred to in the content. |
© 2025 by the authors. Licensee MDPI, Basel, Switzerland. This article is an open access article distributed under the terms and conditions of the Creative Commons Attribution (CC BY) license (https://creativecommons.org/licenses/by/4.0/).
Share and Cite
Magsumbol, J.-A.V.; Bandala, A.A.; Culaba, A.B.; Sybingco, E.; Vicerra, R.R.P.; Naguib, R.; Dadios, E.P. Intelligent Battery Management in a Hybrid Photovoltaic Using Fuzzy Logic System. Technologies 2025, 13, 214. https://doi.org/10.3390/technologies13060214
Magsumbol J-AV, Bandala AA, Culaba AB, Sybingco E, Vicerra RRP, Naguib R, Dadios EP. Intelligent Battery Management in a Hybrid Photovoltaic Using Fuzzy Logic System. Technologies. 2025; 13(6):214. https://doi.org/10.3390/technologies13060214
Chicago/Turabian StyleMagsumbol, Jo-Ann V., Argel A. Bandala, Alvin B. Culaba, Edwin Sybingco, Ryan Rhay P. Vicerra, Raouf Naguib, and Elmer P. Dadios. 2025. "Intelligent Battery Management in a Hybrid Photovoltaic Using Fuzzy Logic System" Technologies 13, no. 6: 214. https://doi.org/10.3390/technologies13060214
APA StyleMagsumbol, J.-A. V., Bandala, A. A., Culaba, A. B., Sybingco, E., Vicerra, R. R. P., Naguib, R., & Dadios, E. P. (2025). Intelligent Battery Management in a Hybrid Photovoltaic Using Fuzzy Logic System. Technologies, 13(6), 214. https://doi.org/10.3390/technologies13060214