1. Introduction
Solar radiation is fundamental to life on Earth and is critical in regulating essential processes such as the carbon cycle and biomass productivity [
1]. As the primary energy source for photosynthesis, it enables photosynthetic organisms to convert light into chemical energy through carbon fixation, vital for plant growth [
2]. Therefore, a broad understanding of solar radiation is essential for effective forest management, ecosystem preservation, food production, and the monitoring of marine ecosystems [
3].
The accurate measurement of solar radiation is vital in agriculture. It facilitates the optimization of crop management by providing insights into light-use efficiency. Recent studies have illustrated that the amount of solar radiation intercepted by plants is directly correlated with their biomass production and photosynthetic efficiency [
4]. Additionally, monitoring solar radiation contributes not only to improving agricultural productivity but also to ensuring sustainability within agricultural practices, particularly in the context of a changing climate.
Solar radiation measurement is also essential in various agriculture-related applications, such as evaluating the performance of photovoltaic systems, climatology, and environmental research. For accurate solar radiation measurement, it is important to consider that radiation varies significantly based on the time of day, season, geographic location, and altitude [
5]. Traditionally, pyranometers have been used to measure solar irradiance. While these devices are highly accurate and reliable, their high cost and limited sensitivity under low irradiance conditions present significant challenges for widespread use in large-scale and budget-conscious applications [
6].
Technological advances and the growing need for sustainable energy solutions have increased interest in developing more cost-effective and accessible methods for measuring solar radiation [
7]. These methods are necessary for various applications, including solar radiation forecasting [
8], evaluating the efficiency of organic Rankine cycles utilizing solar collectors [
9], supporting aquaculture activities [
10], optimizing photovoltaic systems, and enhancing the performance of solar trackers [
11]. In this context, low-cost photometers have emerged as a promising alternative. Photometers are devices that measure the intensity of visible light in lux units [
12]. Although these devices do not directly measure solar radiation in energy units (W/m
2), their use could provide a relative measure of the available light, particularly under low solar irradiance conditions.
The use of low-cost photometers has several advantages. First, these devices are much more affordable than pyranometers, making them accessible to a broader range of users, including independent researchers, small businesses, and community projects [
13]. Second, photometers are easy to install and maintain, reducing operational costs and implementation time. Additionally, integrating photometers with microcontroller-based data acquisition systems and IoT platforms allows for the continuous and real-time monitoring of solar radiation [
14].
Photometers come with certain challenges that need to be taken into account. The main limitation is that photometers measure light in lux units, whereas solar irradiance is typically measured in W/m
2 [
15]. This discrepancy requires the development of conversion factors to convert lux to W/m
2 accurately. Moreover, the reliability of photometer readings can be compromised by environmental conditions, including temperature, humidity, and atmospheric contaminants [
16]. Addressing these issues will enhance the effectiveness of photometers in various applications.
Recent advancements in machine learning (ML) have shown significant potential to enhance the accuracy and reliability of sensor-based measurements across diverse applications. Research indicates that integrating ML models, including deep learning and ensemble approaches, with low-cost photometers can substantially improve radiation estimation by dynamically adjusting conversion factors according to real-time environmental conditions [
17]. Additionally, these ML-driven models effectively compensate for the effects of atmospheric contaminants, humidity, and sensor degradation, thereby reinforcing the robustness of photometer-based radiation measurement systems [
18].
This study aims to evaluate the capability of low-cost light sensors to estimate solar radiation compared to professional solar radiation sensors and investigate the potential limitations of photometers in measuring solar radiation. The main contribution of this work lies in deriving a conversion factor to transform lux readings into W/m2, offering an accessible alternative for solar radiation monitoring in various applications as substitutes for the solar radiation sensors used in professional meteorological stations. The contributions of this paper can be summarized as follows:
An IoT architecture for sensor characterization, integrating low-cost photometric sensors, a specialized solar radiation sensor, and meteorological data from an API to evaluate the performance and accuracy of photometric sensors when used as solar radiation sensors.
Achieving a reliable conversion model through a comparative analysis of statistical and ML models (linear, random forest, and support vector regressions), enabling the establishment of accurate lux-to-irradiance conversion factors for solar radiation estimation.
An analysis of weather variables and their correlation with solar radiation to enhance the model, utilizing data from the OpenWeather API, thereby confirming the model’s efficacy in improving solar radiation estimation.
This paper is organized as follows:
Section 2 comprehensively reviews related works.
Section 3 outlines the process for obtaining a conversion factor to convert lux readings to W/m
2, along with a description of data collection methods, the design of the proposed solution, and the analytical techniques used to evaluate its effectiveness.
Section 4 presents the experimental results and their analysis, while
Section 5 discusses these findings. Finally,
Section 6 concludes with a summary of the results and suggestions for future work.
2. Related Works
The accurate and cost-effective measurement of solar radiation is essential to address increasing energy demands, facilitate the adoption of renewable energy sources, and optimize agricultural productivity. Over the past decade, researchers have focused on developing low-cost sensors and integrating them with the Internet of Things (IoT) for real-time monitoring. In addition, efforts have concentrated on refining calibration techniques to translate illuminance (lux) into irradiance (W/m2) and employing artificial intelligence algorithms for predictive analytics and system optimization. These advancements respond to the need for scalable, reliable, and economical solutions that function effectively across various environmental conditions.
Hence, this section includes solar radiation forecasting, low-cost solutions for solar irradiance measurement, conversion between measurement units, IoT-based solutions for solar irradiance monitoring, and smart management, providing a comprehensive panorama of the current state of the art and laying the foundation for the present study.
2.1. Solar Radiation Forecasting
Solar forecasting has the potential to enhance grid stability, promote economic efficiency, improve operational planning, facilitate market participation, encourage technological innovation, ensure compliance with regulatory standards, and optimize energy storage solutions [
19].
Solar radiation is complex and challenging to predict. Diverse factors influence its intensity, including atmospheric conditions and weather variables such as cloud cover, humidity, wind speed, and temperature. Additionally, the time of day and the changing seasons significantly impact the amount of solar energy that reaches the Earth’s surface [
8].
In this context, the challenge of forecasting solar radiation has driven researchers to explore various approaches that combine meteorological variables with data-driven models. Forecasting methods are categorized based on their temporal focus, as each time frame meets different needs. There are four main types of forecasting: very short-term, short-term, medium-term, and long-term [
20].
Depending on the forecasting requirements, various algorithmic approaches can be employed. These include statistical techniques, machine learning-based regression models, deep learning architectures, and hybrid methods integrating multiple strategies to enhance prediction accuracy [
21].
Among the most widely adopted methods in the recent literature are artificial intelligence-based approaches, particularly neural network architectures such as support vector regression (SVR) [
7], random forest regression (RFR) [
22], and long short-term memory (LSTM) [
23]. Given solar radiation’s inherent periodicity and seasonality, time series models like Autoregressive Integrated Moving Averages (ARIMA) and their variants have also been extensively explored for solar forecasting tasks [
24].
Each approach has specific advantages and limitations depending on the forecasting horizon, data availability, and computational resources. Thus, the selection of forecasting methods must be aligned with the specific application context, as practical implementations can vary significantly based on dataset characteristics, operational settings, and forecasting objectives [
20].
2.2. Low-Cost Solutions for Solar Irradiance Measurement
The development of cost-effective solutions for solar irradiance measurement has been extensively researched in the last decade. In [
16], an embedded system combining multiple sensors was proposed to enhance directional response and reduce errors in ground-based measurements, achieving an average absolute error of 1.27%. This system stands out for its portability and the provision of remote monitoring through secure wireless channels, facilitating its implementation in climate and energy research applications.
Similarly, a low-cost pyranometer using local materials was developed in [
25]. The device, calibrated against commercial equipment, achieved average irradiances of 16.00 MJ/m
2/day and demonstrated competitive performance, establishing itself as an ideal option for regions with limited access to sophisticated equipment.
More evidence of an irradiance measurement solution was shown in [
26], where authors developed an irradiance and temperature meter specifically for solar applications, employing a phototransistor and a temperature sensor. This device was tested alongside commercial pyranometers over 90 days, resulting in a correlation of 0.9996. These findings indicate that cost-effective systems can produce results comparable to professional-grade equipment, particularly in educational and community contexts.
Additionally, ref. [
27] reviewed the application of artificial neural networks (ANNs) in predicting solar energy generation. The review underscored the critical importance of precise instrument calibration in enhancing the accuracy of solar predictions and facilitating the efficient integration of solar energy into the electrical grid.
2.3. Conversion Between Measurement Units
Another crucial aspect of solar irradiance research is the accurate conversion between measurement units. Photometers commonly measure light in lux, while solar irradiance is typically expressed W/m2.
In [
28], authors proposed a guide for converting lux to W/m
2, emphasizing the importance of accurate calibration to integrate cost-effective sensors into solar systems. This approach facilitates the evaluation of photovoltaic system performance under low irradiance conditions, providing an accessible energy study solution.
To broaden the range of applications, ref. [
29] designed a device to measure ultraviolet (UV) and solar irradiance using photodiodes and trans-impedance amplifiers. This system demonstrated a 0.99 correlation with standard devices, validating its effectiveness in environmental monitoring and climate research.
While [
28,
29] demonstrated the feasibility of converting lux to W/m
2 using low-cost photometers and photodiodes, there is still a need to standardize and improve these processes for various environmental conditions. Specifically, further research is required on calibrating conversion factors under different spectral variations and extreme irradiance levels. Additionally, most studies have been conducted in controlled environments, highlighting the need to assess these methods in large-scale field applications such as agriculture or environmental monitoring in resource-limited areas. Furthermore, it is essential to consider other environmental factors, such as temperature, humidity, and atmospheric conditions, which can significantly influence sensor performance. Testing these approaches in diverse environmental settings will enhance the validity and reliability of the conversion models, ensuring their applicability across different climatic and geographical regions.
2.4. IoT-Based Solutions for Solar Irradiance Monitoring
IoT-based platforms have also gained relevance in solar irradiance measurement. Integrating IoT sensors with machine learning enables the intelligent processing of large datasets, leading to improved forecasting and overall management of the agricultural environment. IoT sensors can use real-time data to make immediate and future decisions regarding irrigation, fertilization, and other critical agricultural activities [
30,
31].
Moreover, integrating sensors with a cloud platform facilitated real-time data collection and analysis, enhancing decision-making efficiency in urban and rural applications. In this way, the authors of [
14] presented an IoT lux meter that, while demonstrating deviations of up to 40% under high irradiance conditions, successfully allowed these deviations to be corrected through mathematical techniques.
In addition to these technological advancements, optimizing solar tracking is crucial for maximizing energy capture. In [
32], the authors designed a dual-axis system capable of measuring Direct Normal Irradiation (DNI), Global Horizontal Irradiance (GHI), and Diffuse Horizontal Irradiance (DHI). This system enables remote control through a collaborative graphical interface, facilitating energy feasibility studies without needing on-site visits.
Similarly, ref. [
33] developed a self-sustainable IoT station based on a low-cost pyranometer using the BPW34 photodiode powered by solar energy, ensuring efficient and continuous monitoring in outdoor environments, ideal for urban and rural applications. This system leverages energy from a solar panel to operate sustainably, transmitting data to the ThingSpeak platform via an ESP32; the collected data reduced information loss by 2.47% over a full month of measurements.
On the other hand, the authors of [
34] introduced a data logging device for irradiance based on a Peltier cell and ANN. This device, designed to operate autonomously for up to a year with three AAA batteries, excels in its ability to model real-time irradiance using artificial intelligence, thereby facilitating the optimization of photovoltaic system performance.
In [
35], the authors optimized a sensor model for measuring solar irradiance using a pyranometer, integrating global, direct, and diffuse radiation measurements and achieving a strong correlation with international standards.
In the context of the IoT, ref. [
36] proposed hybrid models that combine meteorological sensors with machine learning algorithms to estimate solar irradiance in areas without access to pyranometers. This approach reduces implementation and maintenance costs while maintaining high accuracy by integrating meteorological data with empirical models.
Furthermore, ref. [
37] developed an IoT-connected lux meter with data logging capabilities on an Secure Digital (SD) card, enabling remote monitoring and data visualization through the blynk application, optimizing lighting management in indoor and outdoor spaces.
Finally, ref. [
38] designed an IoT-based meteorological system integrating multiple sensors, including the BH1750, for light intensity measurement. This system enables real-time weather monitoring through a Node-RED-based web interface, supporting agricultural and meteorological applications.
2.5. IoT-Enabled Monitoring of Light Intensity and Smart Agricultural Management
The IoT in agriculture has gained relevance in recent years. It allows the real-time collection, transmission, and analysis of data, enabling smart agricultural management. Several studies have focused on integrating light-intensity sensors and other variables, harnessing cloud platforms, machine learning algorithms, and intelligent traceability techniques to autonomously and efficiently enhance cultivation processes, irrigation, pest control, and resource management.
In [
39], the BH1750 sensor was employed in an IoT system that transmitted data through ThingSpeak and enabled smartphone visualization, optimizing environmental conditions to enhance production in greenhouses. Similarly, an IoT-based agricultural monitoring system developed by [
40] employed the BH1750 sensor to measure light intensity, enhancing crop production by optimizing lighting conditions in real-time.
The authors of [
41] proposed a cloud-based intelligent system for interactive agricultural management. This system collects data from multiple IoT sensors, processes it in the cloud, and dynamically visualizes it through interactive dashboards. Integrating such systems enhances operational efficiency and facilitates data-driven decision-making to identify real-time patterns and anomalies.
In [
42], a smart agriculture system based on deep reinforcement learning (DRL) and cloud computing was developed. The system comprises multiple layers: data collection, edge processing, transmission, and cloud-based analysis. Artificial intelligence is applied to optimize decisions such as the amount of water needed for irrigation, autonomously improving crop growth.
Traceability also plays a fundamental role in the IoT ecosystem; ref. [
43] introduced the concept of smart traceability, which enables digital sensors to calibrate themselves to ensure measurements’ accuracy automatically. This approach guarantees the quality of data generated by sensor networks, thereby optimizing processes such as predictive maintenance in agriculture and other industrial sectors.
Additionally, ref. [
44] explored the advantages of IoT in the agricultural sector, highlighting how integrating sensors with artificial intelligence algorithms enhances production efficiency. The proposed system enables remote device control via mobile applications and the automated management of processes such as irrigation and fertilization, contributing to resource waste reduction.
On the other hand, ref. [
31] emphasized the challenges and opportunities of IoT in modern agriculture. They underscored how sensors and data platforms can improve agricultural practices such as irrigation and pest control.
Lastly, ref. [
45] presented a precision agriculture model based on IoT that leverages data analysis and machine learning. The model was applied to disease prediction in apple orchards in the Kashmir Valley, demonstrating how predictive analysis can anticipate disease outbreaks and improve real-time decision-making to reduce production losses.
2.6. Measurement of Irradiance
Solar irradiance refers to the amount of solar energy received per unit area on a given surface and is typically measured in watts per square meter (W/m
2). It is fundamental in solar energy studies, climate change research, and agronomy as it provides critical information on the amount of radiation reaching the Earth’s surface under various atmospheric and cloud-cover conditions. Solar irradiance is calculated using satellite imagery and ground-based measurements, enabling its estimation even in scenarios with clear or overcast skies [
46,
47].
Solar radiation is primarily measured using pyranometers designed to record global solar radiation, encompassing both direct and diffuse radiation reaching a horizontal surface. Pyranometers use heat- or light-sensitive sensors to measure the solar energy striking the surface, yielding irradiance values in watts per square meter (W/m
2) [
48,
49].
Solar radiation at the top of the atmosphere can be considered relatively constant, with an estimated value of 1366.1 W/m
2 and a variation of
due to changes in the Earth–Sun distance [
32]. DHI is the portion of scattered radiation in the atmosphere that reaches a particular point on the ground. Diffuse irradiance accounts for a significant fraction of the total irradiance. GHI denotes the sum of direct and diffuse components incident on a horizontal plane. In contrast, the direct beam of sunlight passing through the atmosphere is referred to as DNI [
50].
This study conducted solar irradiance measurements using a sensor integrated into the Davis Instruments Vantage Pro 2 weather station, equipped with the proprietary solar radiation sensor model 6450 [
51]. As stated by the manufacturer, this pyranometer-type sensor is designed to measure radiation in the range of 0 to 1800 W/m
2.
2.7. Luminance Measurement
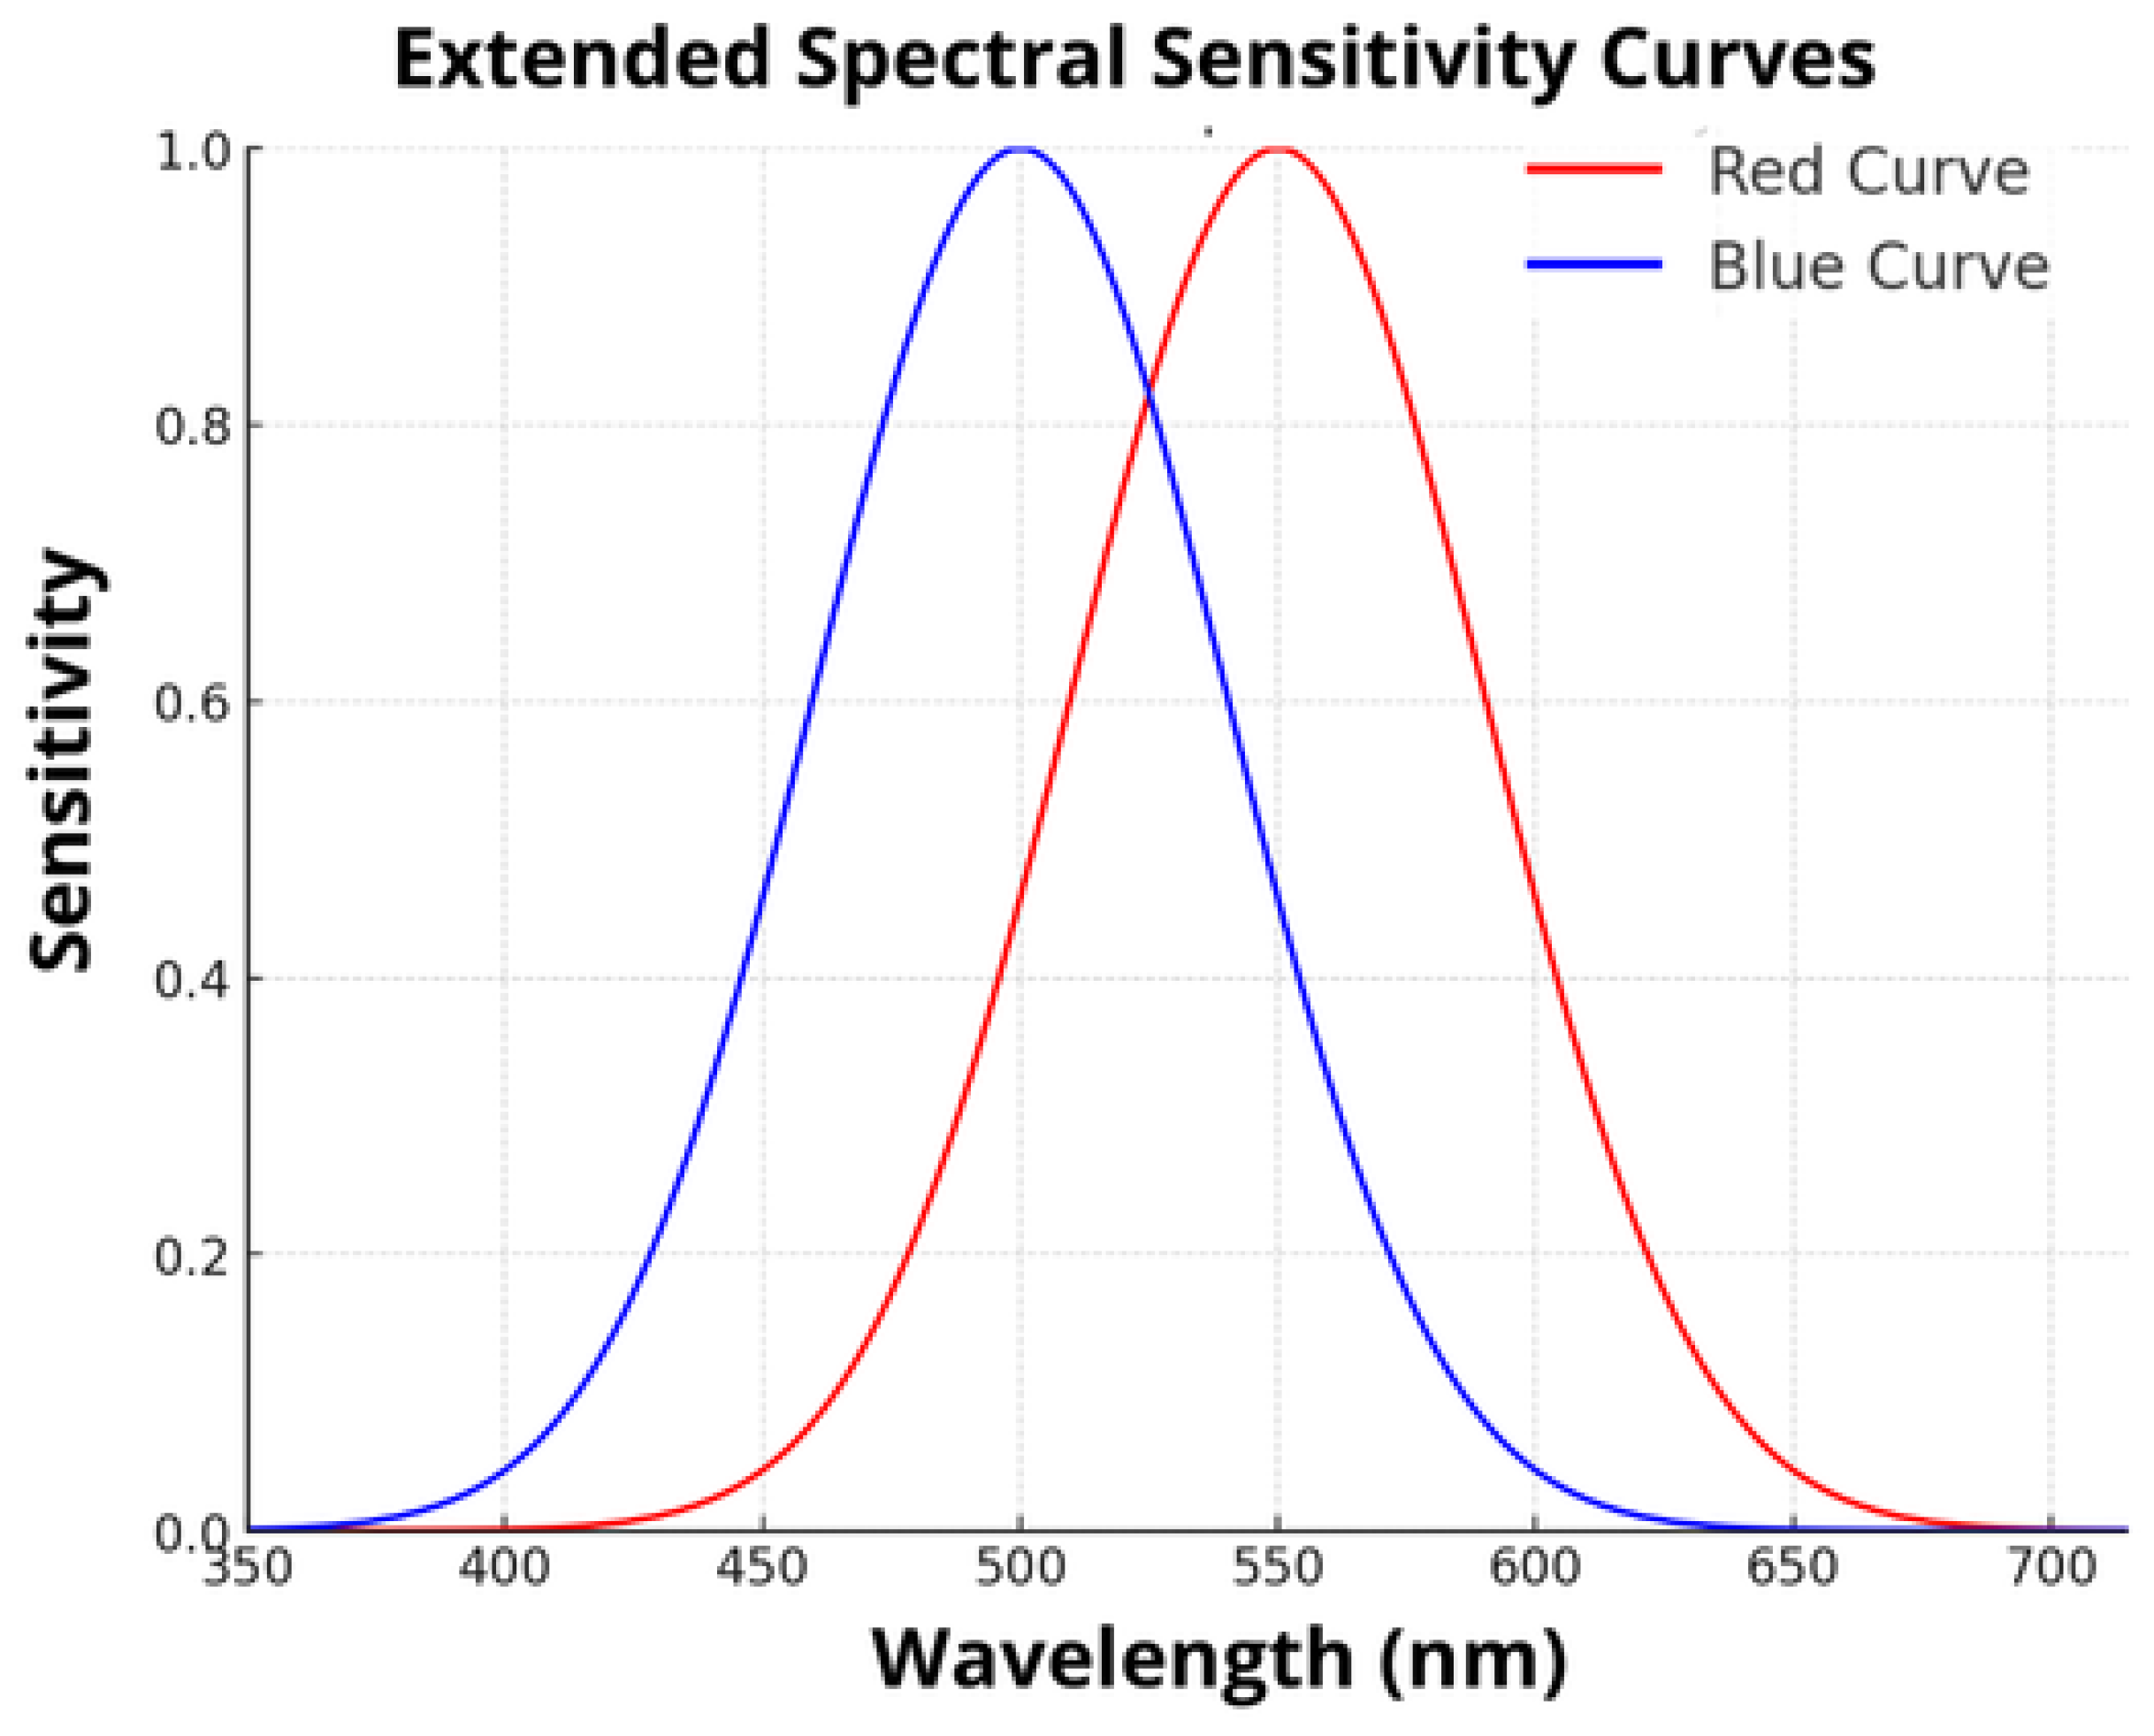
According to [
52], approximately 50% of the solar radiation that reaches the Earth’s surface is composed of visible light, which falls within the 400–700 nm range. Photometers are used to measure light as perceived by the human eye. They are calibrated according to the standards established by the International Commission on Illumination (CIE), as shown in
Figure 1.
The CIE curves were originally developed by measuring human responses to various wavelengths of visible light. Because these measurements involved human perception, the curve from 1924 contained inaccuracies at certain points within the visible spectrum [
53]. This issue was addressed with a new CIE curve released in 1988 and further refined in 2008 [
54]. This highlights the principle that, by definition, light outside the visible spectrum is not included in these measurements [
55].
The previous state of the art highlights the need for cost-effective and reliable solar radiation measurement systems. Low-cost photometric sensors and IoT platforms efficiently collect and transmit real-time data, optimizing agriculture, energy management, and environmental monitoring. Finally, an accurate conversion of illuminance (lux) to irradiance (W/m2) is needed for system reliability and supports research and development of better sensor calibration and large-scale implementations.
The following section outlines the materials and methods utilized in this study, emphasizing design considerations, sensor selection, and the experimental procedures implemented to meet our research objectives.
3. Materials and Methods
This section outlines the design and implementation of a system for measuring luminosity and solar radiation using low-cost sensors, specifically the BH1750 and VEML7700, along with a high-precision reference sensor, the Davis 6450. The system utilizes a NodeMCU ESP32 microcontroller manufactured by Espressif Systems (Shanghai) Co., Ltd., located in Shanghai, China.
To collect and transmit data, enhanced by the Open-Meteo API for obtaining additional meteorological information. This document also details the PCB layout to optimally integrate the sensors and discusses the implementation of a light diffuser to prevent saturation. The program’s workflow enables data acquisition and transmission to the cloud for analysis, allowing for the assessment of the sensors’ accuracy in comparison to the reference sensor.
3.1. System Architecture for Luminosity and Solar Radiation Measurement
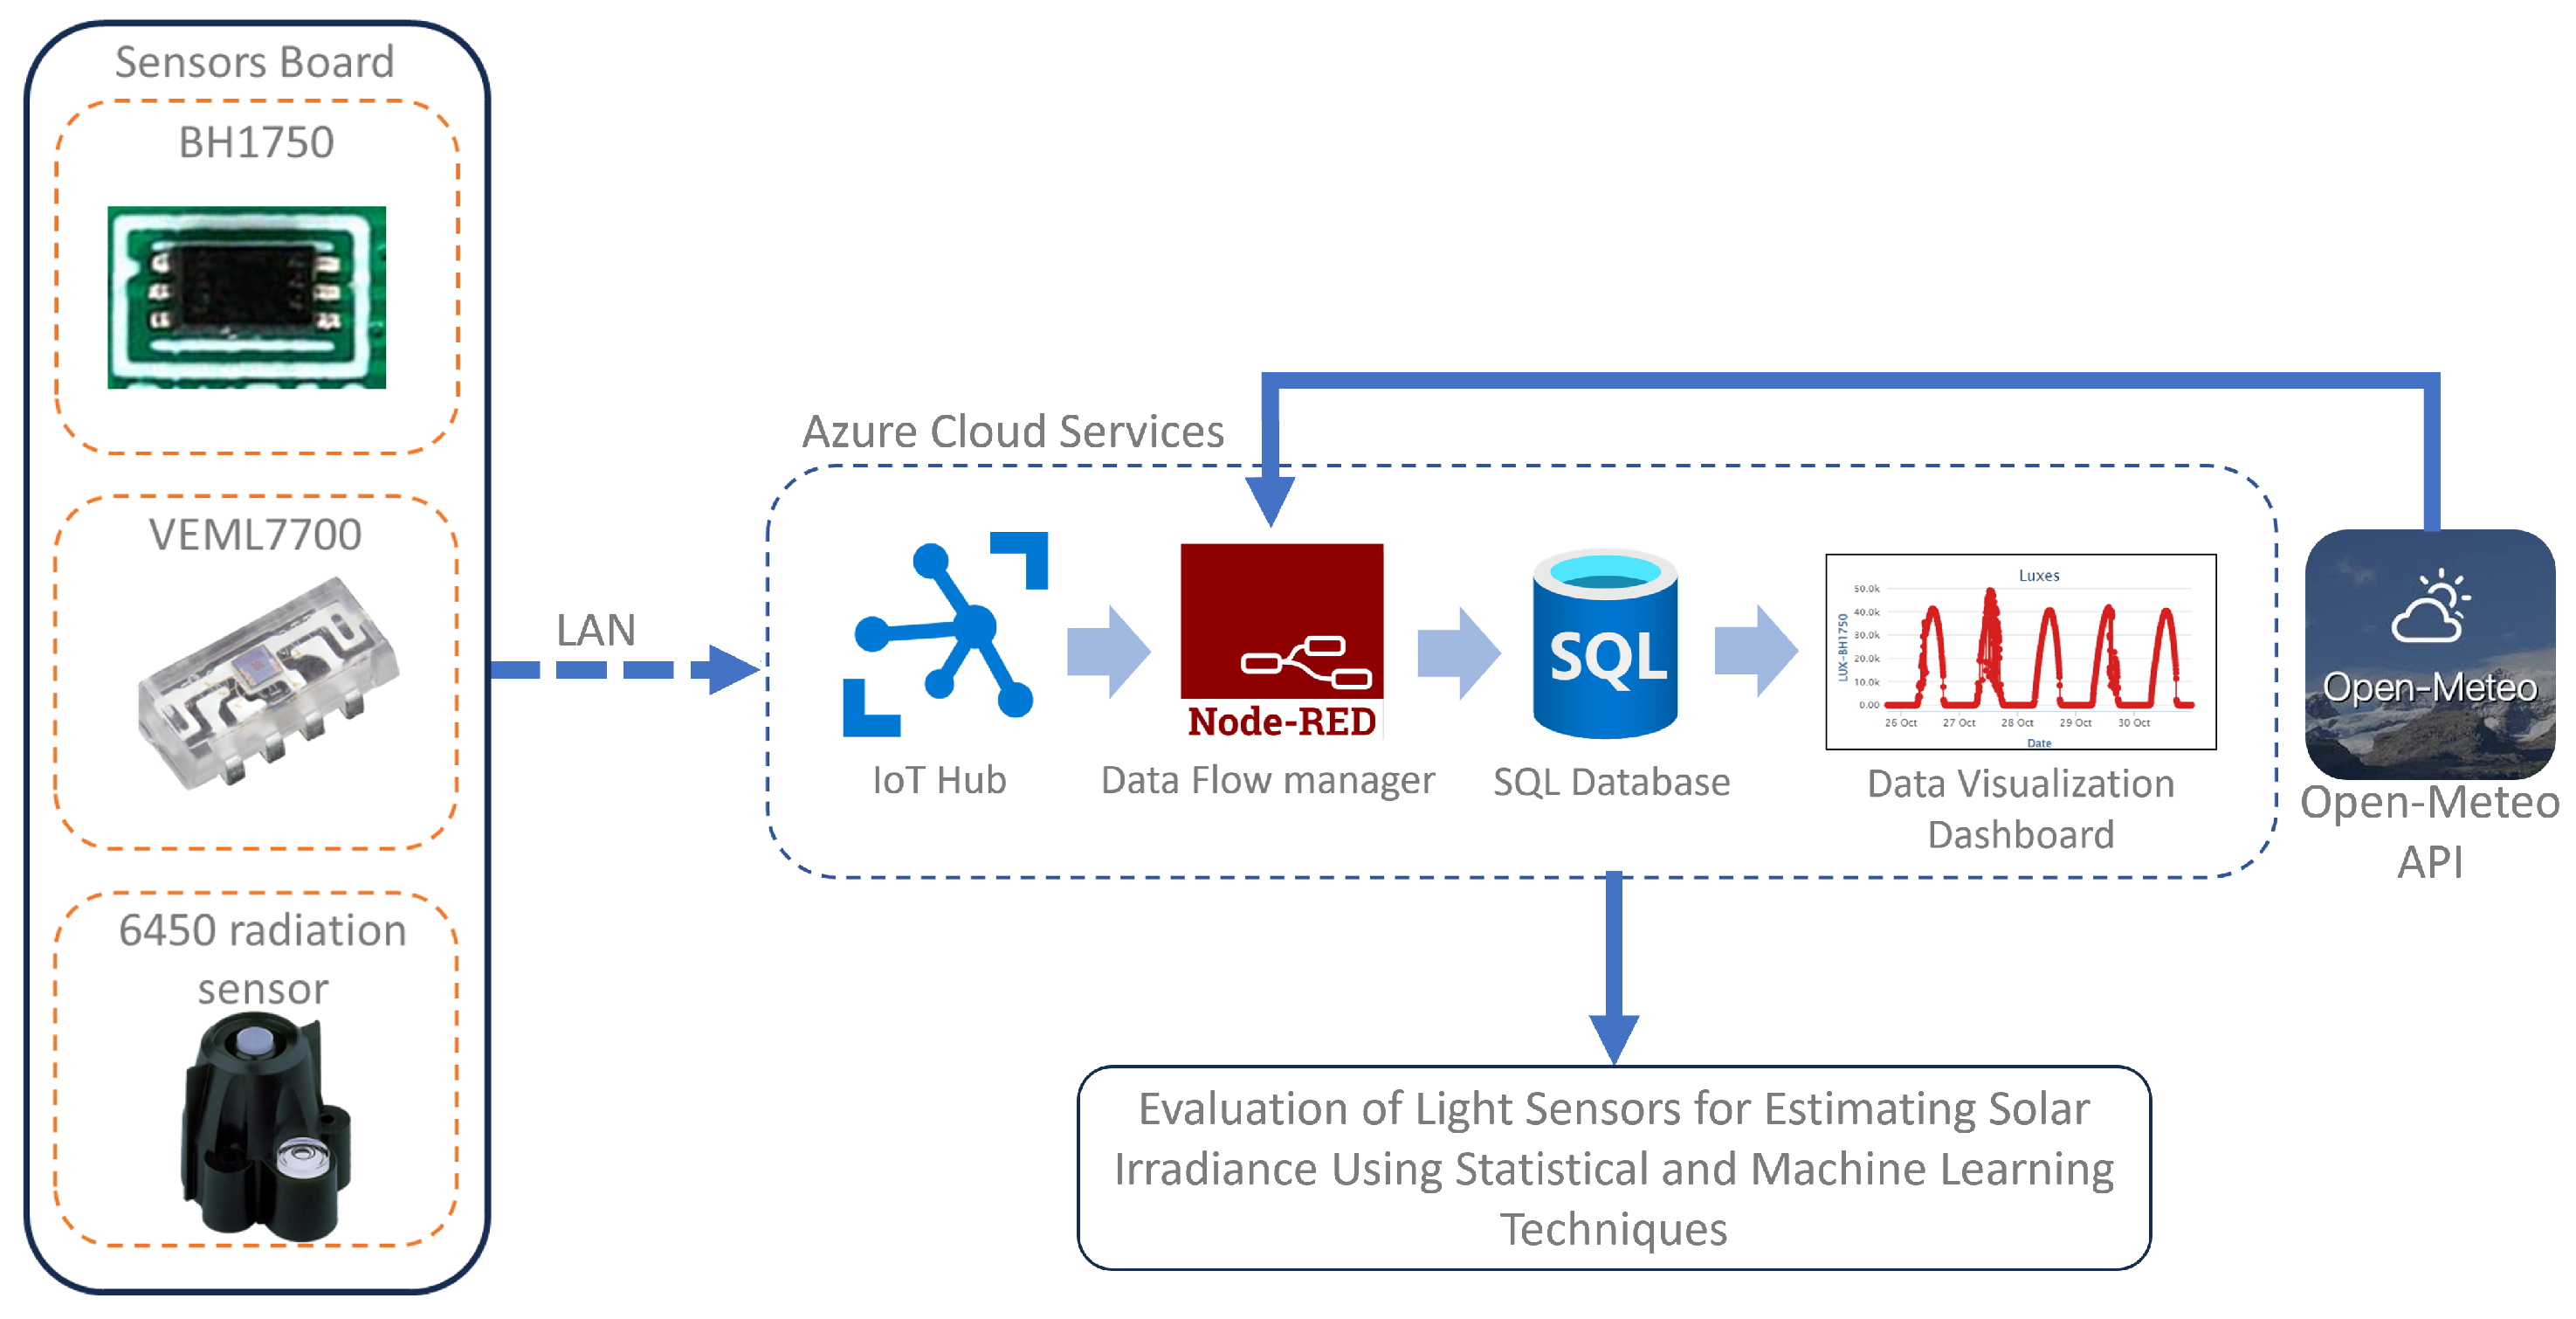
In order to evaluate the capability of low-cost ambient light sensors to estimate solar radiation compared to professional solar radiation sensors and investigate the potential limitations of photometers in measuring solar radiation, the architecture depicted in
Figure 2 is proposed.
Thus, the primary data acquisition unit, the Sensor Board, incorporates low-cost ambient light sensors and a high-precision Davis 6450 radiation sensor manufactured by Davis Instruments Corporation, located at Hayward, CA, USA. The board transmits the collected data to Azure cloud services via a Local Area Network (LAN), providing real-time monitoring and storage.
Furthermore, the Open-Meteo API was integrated into the system. This integration allowed for the provision of supplementary meteorological data, including temperature, humidity, wind speed, and atmospheric pressure. This adds an overall understanding of environmental conditions by offering additional context for the sensor readings. The API fetches historical and real-time weather data, which are used to correlate the captured sensor data with regional weather patterns, improving the analysis of sensor accuracy under different atmospheric conditions.
Ultimately, the collected data from the sources were analyzed to compare light sensors to estimate solar irradiance comprehensively, evaluating low-cost alternatives’ precision, reliability, and practical applicability. The following sections provide a detailed description of each system component.
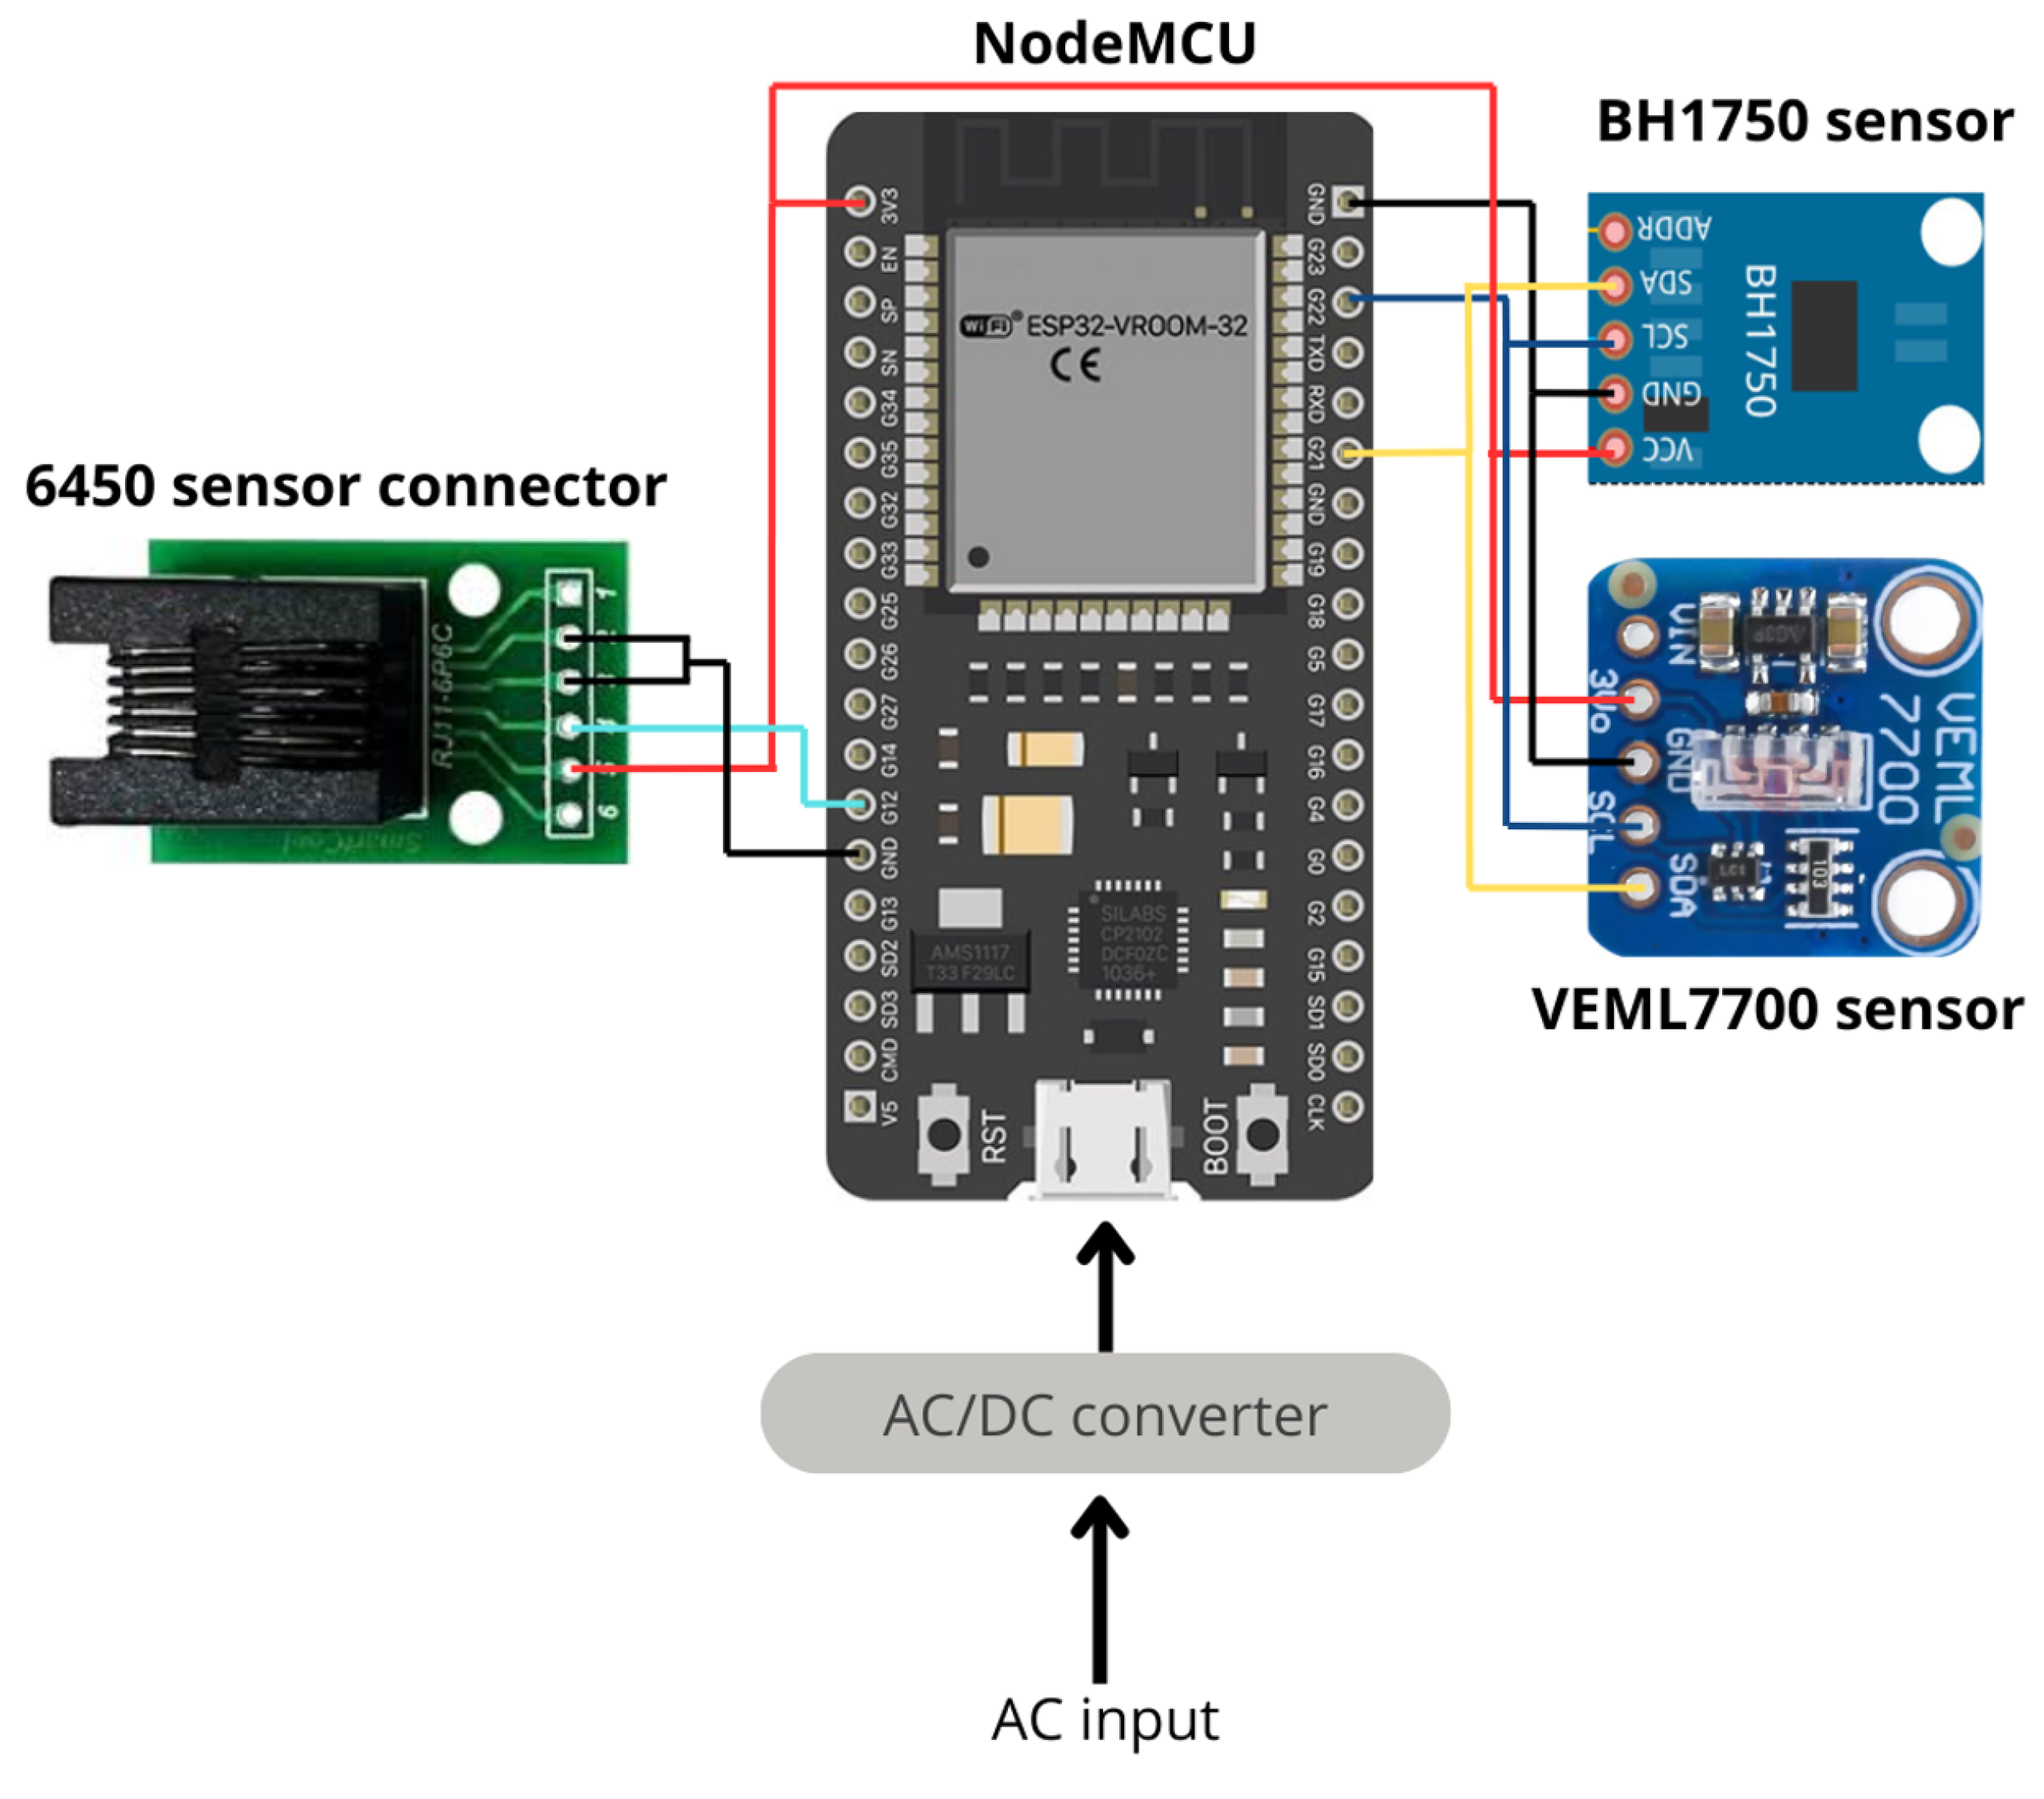
3.1.1. Sensor Board
This study used the BH1750 and VELM7700 light sensors, cost-effective solutions to measure the intensity of ambient light. These sensors and a high-precision Davis 6450 radiation sensor were integrated into a custom-designed Printed Circuit Board (PCB). The sensors were interfaced with a NodeMCU ESP32 microcontroller. This microcontroller featured a dual-core Tensilica Xtensa LX6 processor, manufactured and licensed by Cadence Design Systems, Inc., located in San Jose, CA, USA, operating at up to 240 MHz, and included integrated Wi-Fi and Bluetooth connectivity, making it ideal for IoT applications. The NodeMCU ESP32 had multiple peripheral interfaces, such as Inter-Integrated Circuit (I
2C), Serial Peripheral Interface (SPI), Universal Asynchronous Receiver–Transmitter (UART), and Analog-to-Digital Converter (ADC). The wiring diagram is depicted in
Figure 3.
3.1.2. BH1750 Light Sensor
The BH1750 is a digital light sensor that measures illuminance in lux with a spectral response similar to the human eye. It features a measurement range of 1 to 65,535 lux, well suited for various lighting conditions, from low-light environments to high-intensity sunlight indoors and outdoors. The sensor communicates via an I
2C interface into embedded systems with low power consumption for real-time data acquisition. A key feature of the BH1750 is its adjustable sensitivity, which allows compensation for optical window effects or varying lighting conditions. This enables the sensor to adapt to different transparency levels, providing accurate measurements across diverse environments [
56].
3.1.3. VEML7700 Ambient Light Sensor
The VEML7700 manufactured by Vishay Intertechnology, Inc., located in Malvern, PA, USA, is a digital ambient light sensor that features a high-sensitivity photodiode, a 16 bit ADC, and an I2C communication interface, allowing seamless integration with the NodeMCU ESP32 microcontroller. Its extensive measurement range of 0.003 lx to 120,000 lx (120 Klx) makes it particularly suitable for capturing both low- and high-intensity lighting conditions, which was vital for this study’s experimental conditions.
Additionally, the VEML7700 offers temperature compensation for stable and accurate measurements across varying environmental conditions and includes flicker noise rejection at 100 Hz and 120 Hz to mitigate interference from artificial light sources. The sensor’s auto-memorization feature allows it to retain the last measured ambient light data even when in shutdown mode, facilitating efficient data logging without requiring continuous operation.
Table 1 presents a comparative analysis of the two light sensors.
In this way, the VEML7700 was tested by comparing its measured values against those from a calibrated optometer, indicating close agreement for illumination levels of up to approximately 1000 lx. In these modes, the sensor’s output remained linear; however, at higher illumination levels, non-linearities were introduced, which could be managed by applying a factory-provided polynomial correction [
57]. Consequently, we considered the VEML7700 a responsible reference for calibrating and validating the performance of the BH1750 sensor manufactured by ROHM Semiconductor, located in Kyoto, Japan.
3.1.4. Davis 6450 Sensor
The Davis Instruments Model 6450 Solar Radiation Sensor is a pyranometer designed to measure global solar radiation, including direct and diffuse components, within a range of 0 to 1800 W/m2, with a resolution of 1 W/m2 and an accuracy of . It uses a silicon photodiode calibrated for spectral response from 400 to 1100 nanometers and has a rapid response time of 10 microseconds. Its cosine response is accurate for incident angles of up to 70 °C (deviation < ) and remains within for angles between 70 °C and 85 °C.
The sensor operates from −40 °C to 65 °C. It features a weather-resistant Polyvinyl Chloride (PVC) housing, a diffuser to reduce errors from thermal radiation and water accumulation, and a level indicator for proper alignment. Each Davis 6450 sensor is calibrated against a secondary standard, which is periodically calibrated under natural daylight conditions using an Eppley Precision Spectral Pyranometer. The sensor’s calibration stability is maintained over time, with an annual percentage change relative to the full-scale measurement typically remaining below 1–3%, indicating minimal drift and reliable long-term performance [
58].
Table 2 presents the main features of the Davis Instruments Model 6450 solar radiation sensor.
In this study, the Davis Instruments 6450 solar radiation sensor was used as a reference to evaluate the performance of low-cost light sensors, such as the BH1750 and VEML7700, in estimating solar irradiance. The 6450 sensor provided a stable foundation for analyzing the correlation between lux-based measurements and irradiance values. The sensor was integrated into the sensor board and communicated via an analog interface, where its voltage readings (measured in millivolts) were converted into irradiance values (in W/m
2) using the conversion factor specified in the manufacturer’s datasheet [
52].
The processed irradiance data were then transmitted to the Azure cloud services for further storage and analysis. Measurements were conducted simultaneously with the BH1750 and VEML7700 sensors, creating a comprehensive dataset for subsequent performance evaluation and comparative analysis.
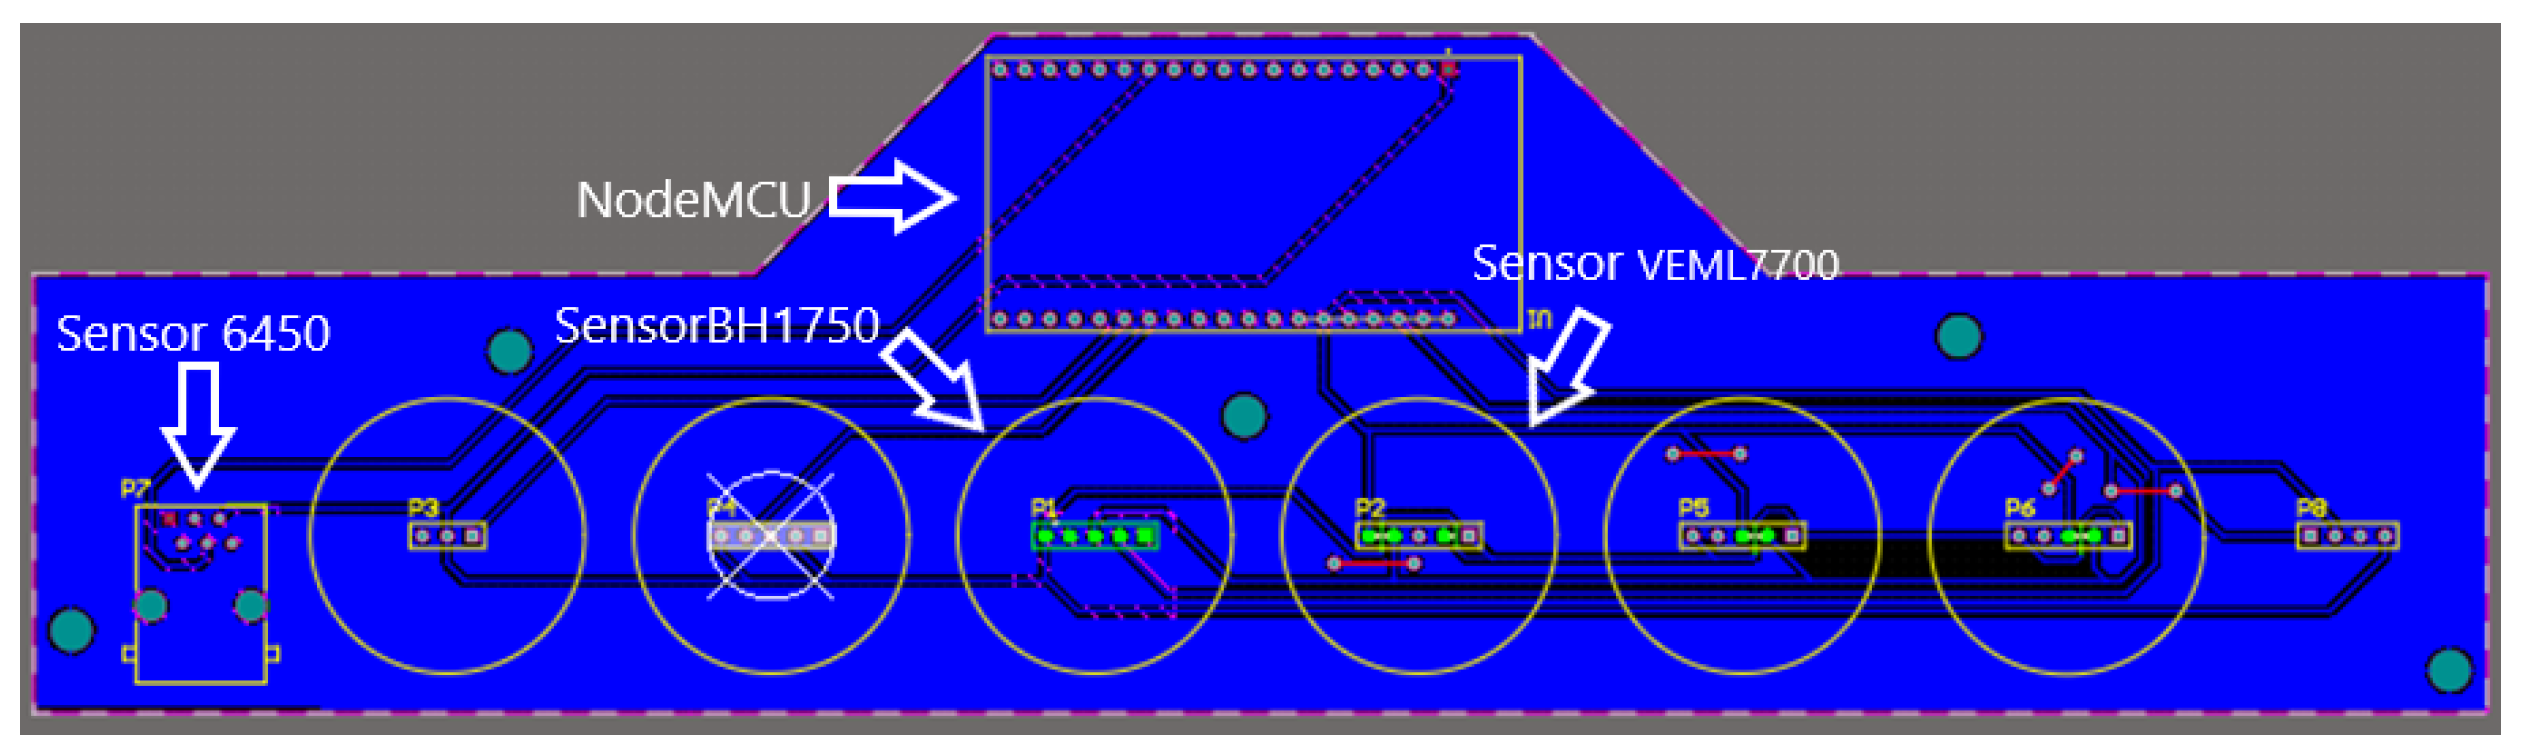
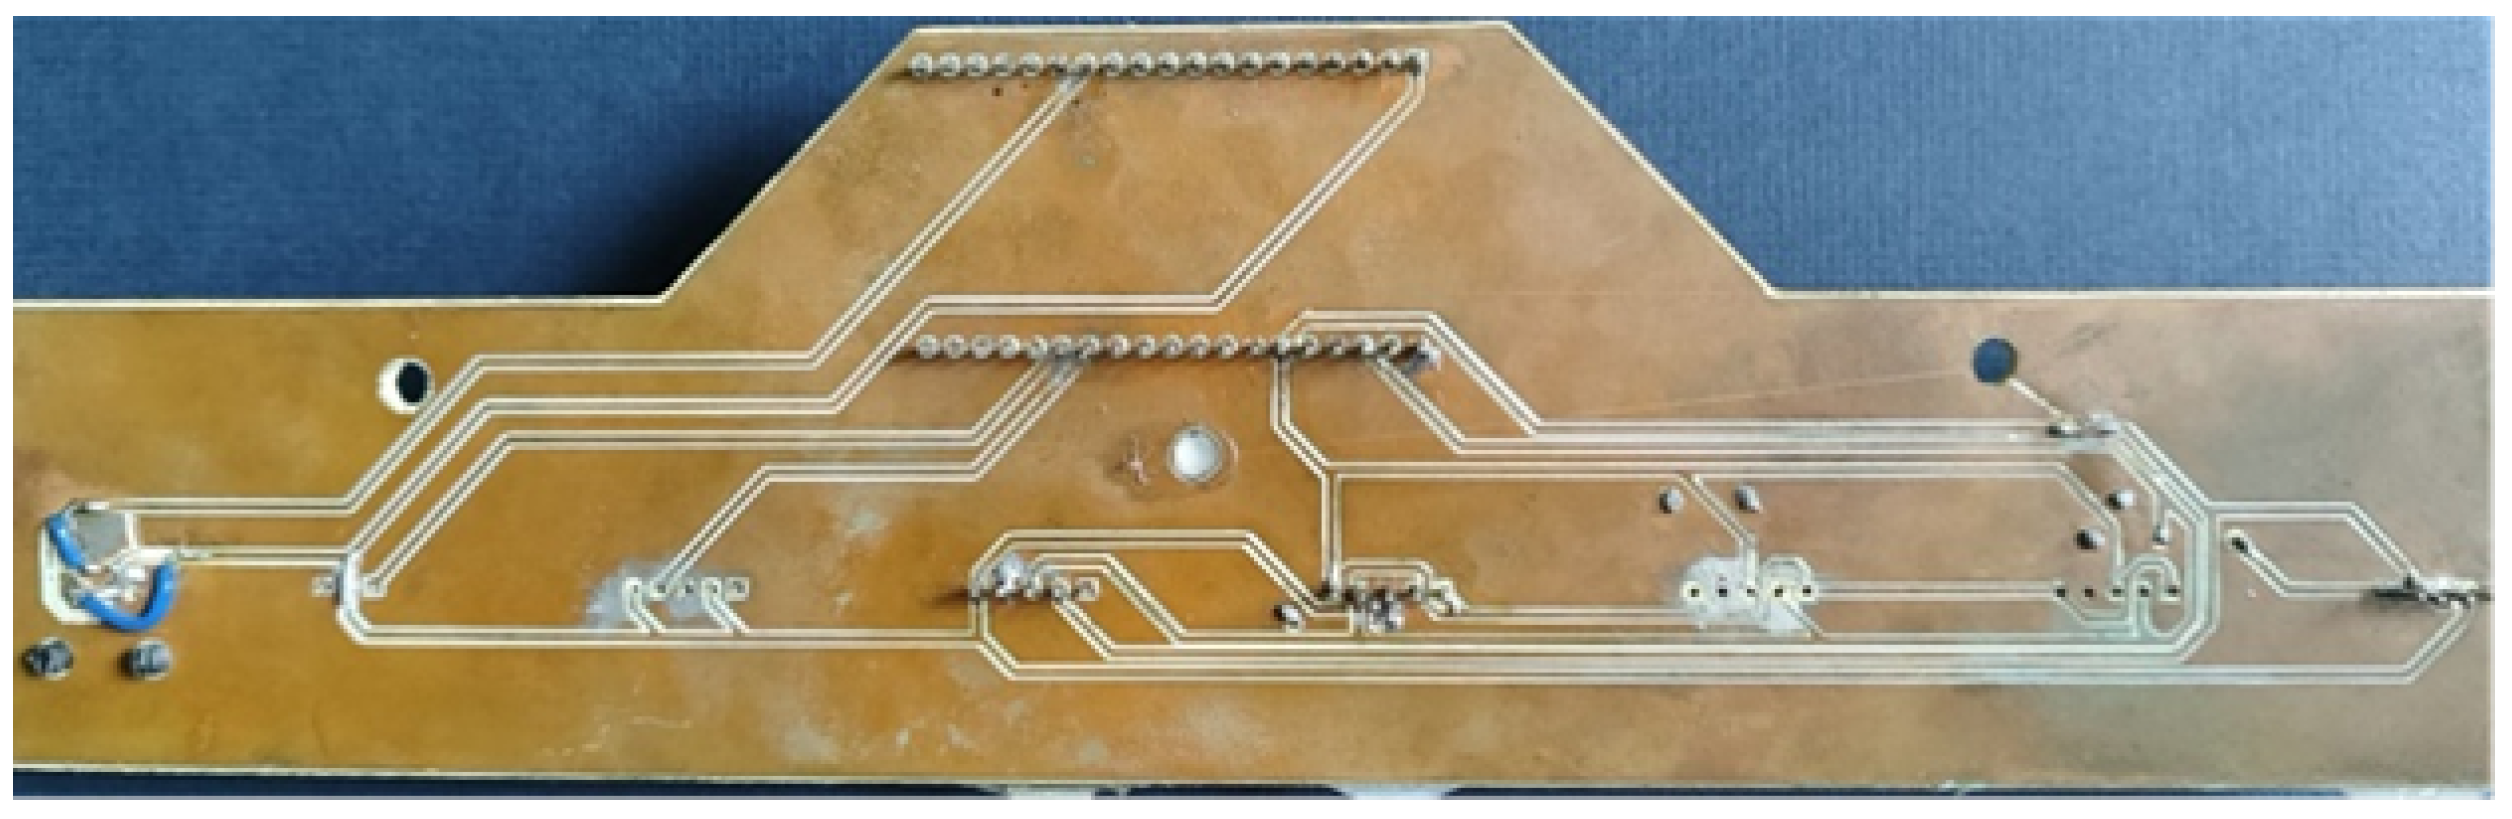
3.1.5. PCB Design and Fabrication
The PCB design presented in
Figure 4 was specifically developed to integrate the NodeMCU ESP32 microcontroller with the 6450 solar radiation sensor, as well as the BH1750 ambient light sensor and the VEML7700 ambient light sensor. The layout was designed to position the sensors near one another, ensuring that they were all exposed to the same physical stimuli under uniform environmental conditions, such as light intensity or solar radiation. The sensors were mounted at the same height, separating 30 cm between the sensors and the mounting connector of the 6450 sensor.
A level bubble was integrated into the PCB design to improve measurement consistency and assist with the correct alignment and orientation of the sensors during data collection. This design approach aimed to reduce the variations caused by different sensor placements to collect more consistent and reliable measurements.
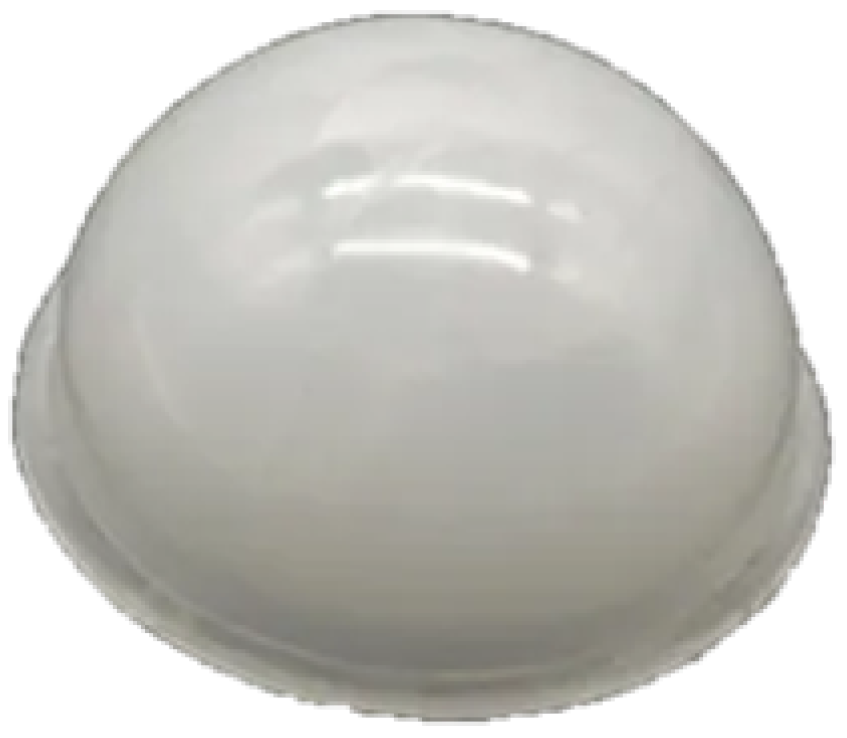
Although the sensors offer a wide dynamic range for luminance measurements, direct exposure to intense sunlight leads to saturation issues, occasionally exceeding the operational limits of the sensor. A white light diffuser depicted in
Figure 5 was implemented to address this issue, reducing saturation and providing measurements that consistently remained within the sensor’s range. The completed PCB is illustrated in
Figure 6 and
Figure 7.
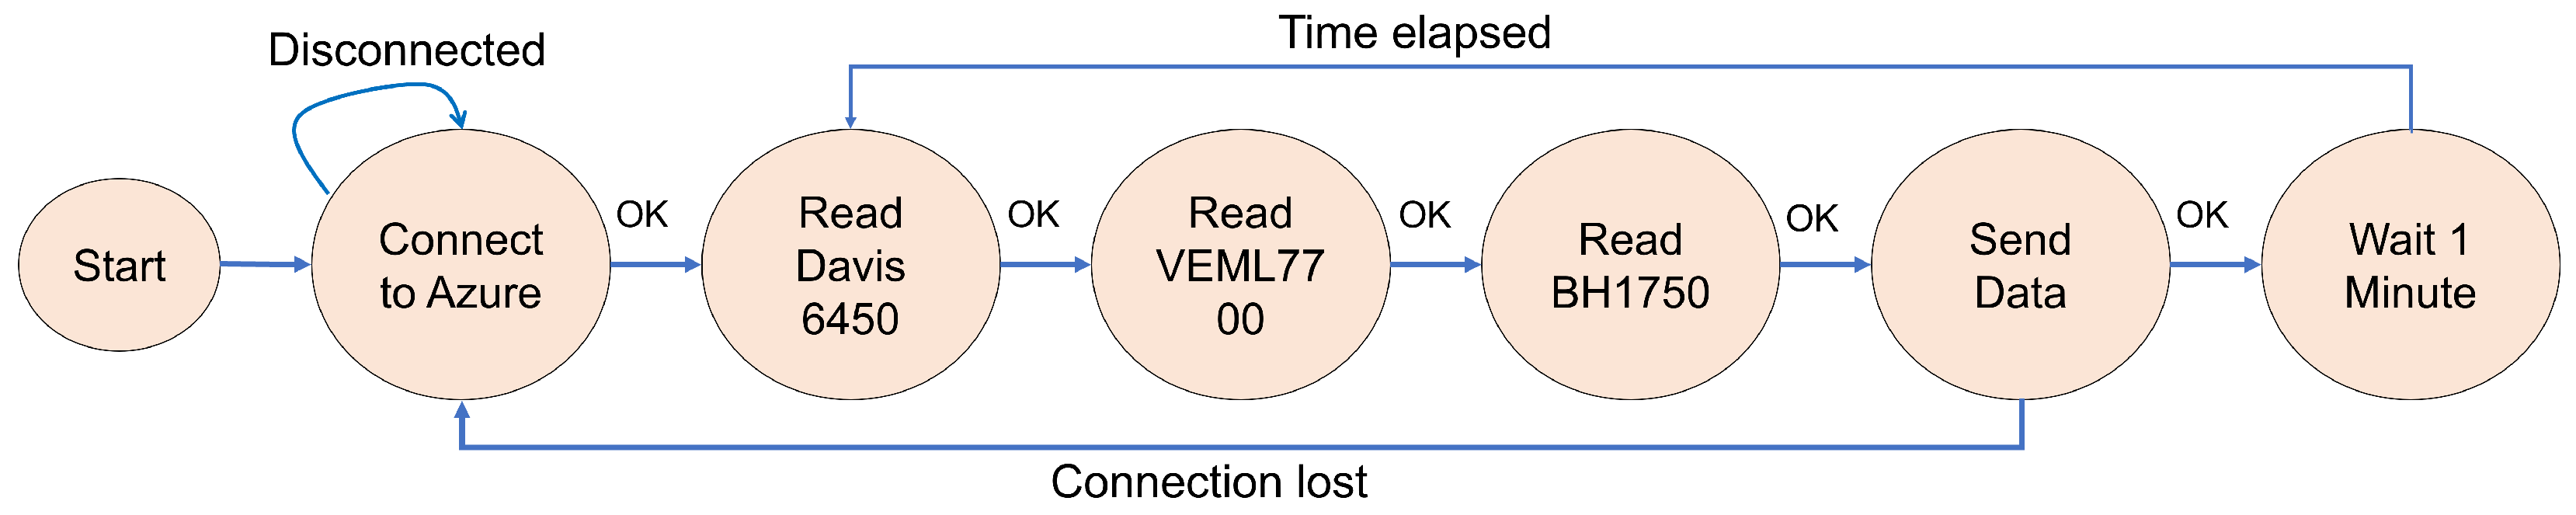
The developed program for the ESP32 microcontroller followed a structured workflow, depicted in
Figure 8, for data acquisition and cloud transmission. The process began with the start phase, where the system initialized the necessary peripherals and configurations. The first critical step was to connect to Azure, which established communication with the cloud services. If the connection failed, the system continuously attempted to reconnect before proceeding further.
Once the connection was successfully established, the program transitioned to the sensor reading phase, where data were sequentially acquired from the three sensors:
Read Davis 6450: Converted analog readings into irradiance values.
Read VEML7700: The sensor was set up with the following parameters: a gain of 1/8, which helped prevent saturation in high sunlight conditions; an integration time of 50 ms; and a continuous operation mode that allowed for real-time monitoring without the need for reactivation. Furthermore, the sensor had a maximum resolution of 16 bits, enabling precise data collection.
Read BH1750: The BH1750 was configured in continuously high-resolution mode (Continuously H-Resolution Mode2), which offered a resolution of 0.5 lux per count and a measurement time of 120 ms.
After all sensors had been read, the collected data were processed and formatted into a JavaScript Object Notation (JSON) in the Send Data state. This JSON structure organized the sensor readings, timestamps, and relevant metadata. The formatted data were then transmitted to the Azure IoT hub via the MQTT (Message Queue Telemetry Transport) protocol, enabling cloud storage and further processing [
59,
60].
Following the data transmission, the system entered a wait 1 min phase, during which, it remained idle to avoid redundant operations. Once the waiting period ended, the workflow looped back to the read sensors stage, providing a continuous monitoring cycle.
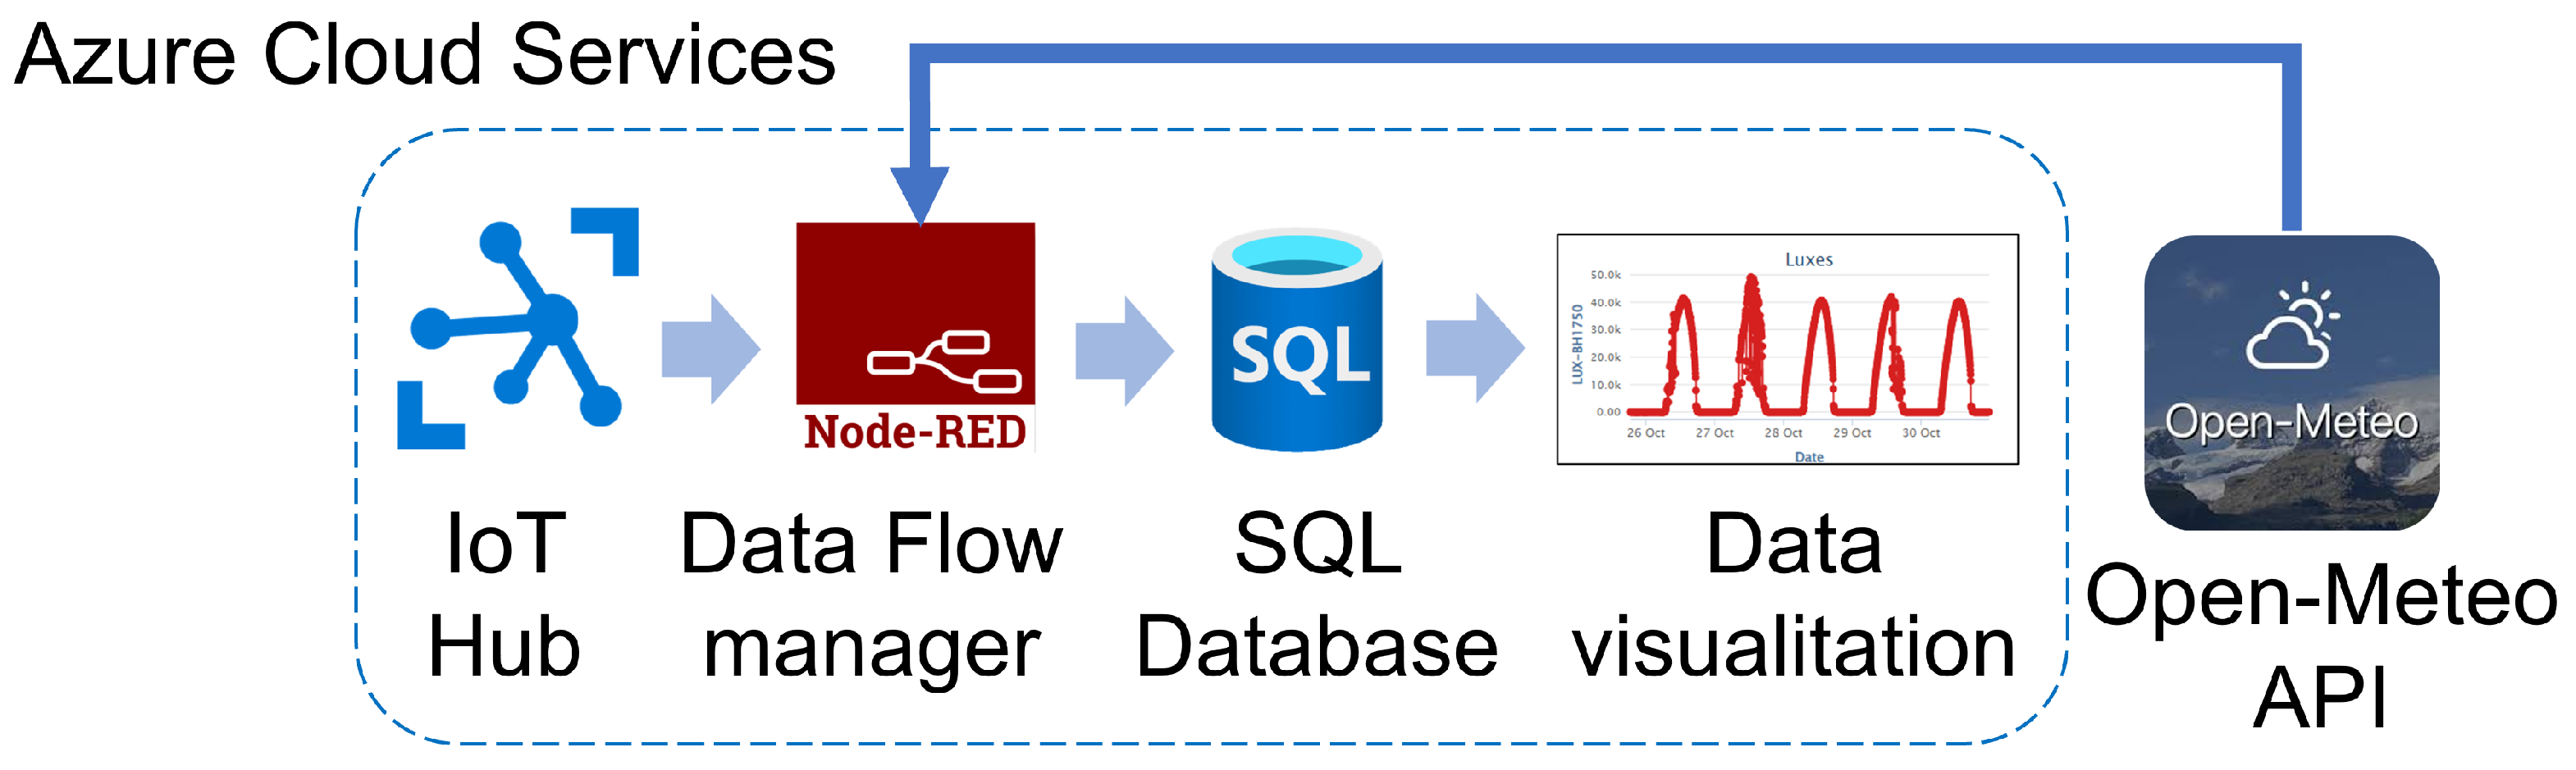
3.2. Internet of Things for Data Acquisition
As shown in
Figure 9, Azure cloud services were used to process the data collected by the sensor board. The data were transmitted to the cloud via the MQTT protocol [
61,
62]. Once the data reached the cloud, they were ingested by Azure IoT hub, the central communication hub, enabling secure and bidirectional communication between the sensor devices and the cloud infrastructure.
The Azure IoT hub is the central message broker that provides bidirectional communication between sensor devices and the cloud. It provides device-to-cloud and cloud-to-device messaging, data ingestion, monitoring, and control capabilities. It also supports device identity management, telemetry routing, and built-in security mechanisms, including encryption and authentication via SAS tokens or X.509 certificates, to protect the data throughout its transmission lifecycle.
After receiving the data, Node-RED processed it by handling the incoming JSON messages sent by the sensor board. This data flow manager extracted sensor information, illuminance, and irradiance values, which were correctly formatted and structured to be stored in a Structured Query Language (SQL) database.
The processed data were then stored in an Azure SQL database, which provided structured storage for historical data and allowed querying and analysis. As a fully managed, cloud-based, relational database, the Azure SQL database is the backbone for data persistence, storing all sensor readings and making them readily available for further use. Each record in the database includes illuminance and irradiance values, along with the corresponding timestamp, enabling precise tracking and analysis over time. Additionally, the database benefits from automated backups, intelligent query processing, and seamless integration with other Azure services, such as Power BI for visualization and Azure Machine Learning for predictive analytics.
In addition to the sensor data, Node-RED was configured to interact with the Open-Meteo API, which provides real-time and historical weather data sourced from national meteorological services and global atmospheric models, offering weather information with coverage across various geographic regions. Through scheduled HTTP requests, Node-RED periodically fetched meteorological data such as temperature, humidity, and cloud cover by sending requests to the Open-Meteo API’s endpoints. The retrieved JSON responses were parsed within Node-RED, extracting the relevant weather parameters that complemented the sensor board data: cloud cover, relative humidity, and surface pressure.
It is important to emphasize that Open-Meteo data are derived from national weather services, and observations are integrated into numerical models, such as the Integrated Forecasting System (IFS) developed by ECMWF. Depending on the location, the Open-Meteo API combines different models to provide the best weather estimation with 1.5 to 55 km of resolution and a minimum frequency of 1 h, as specified in [
63].
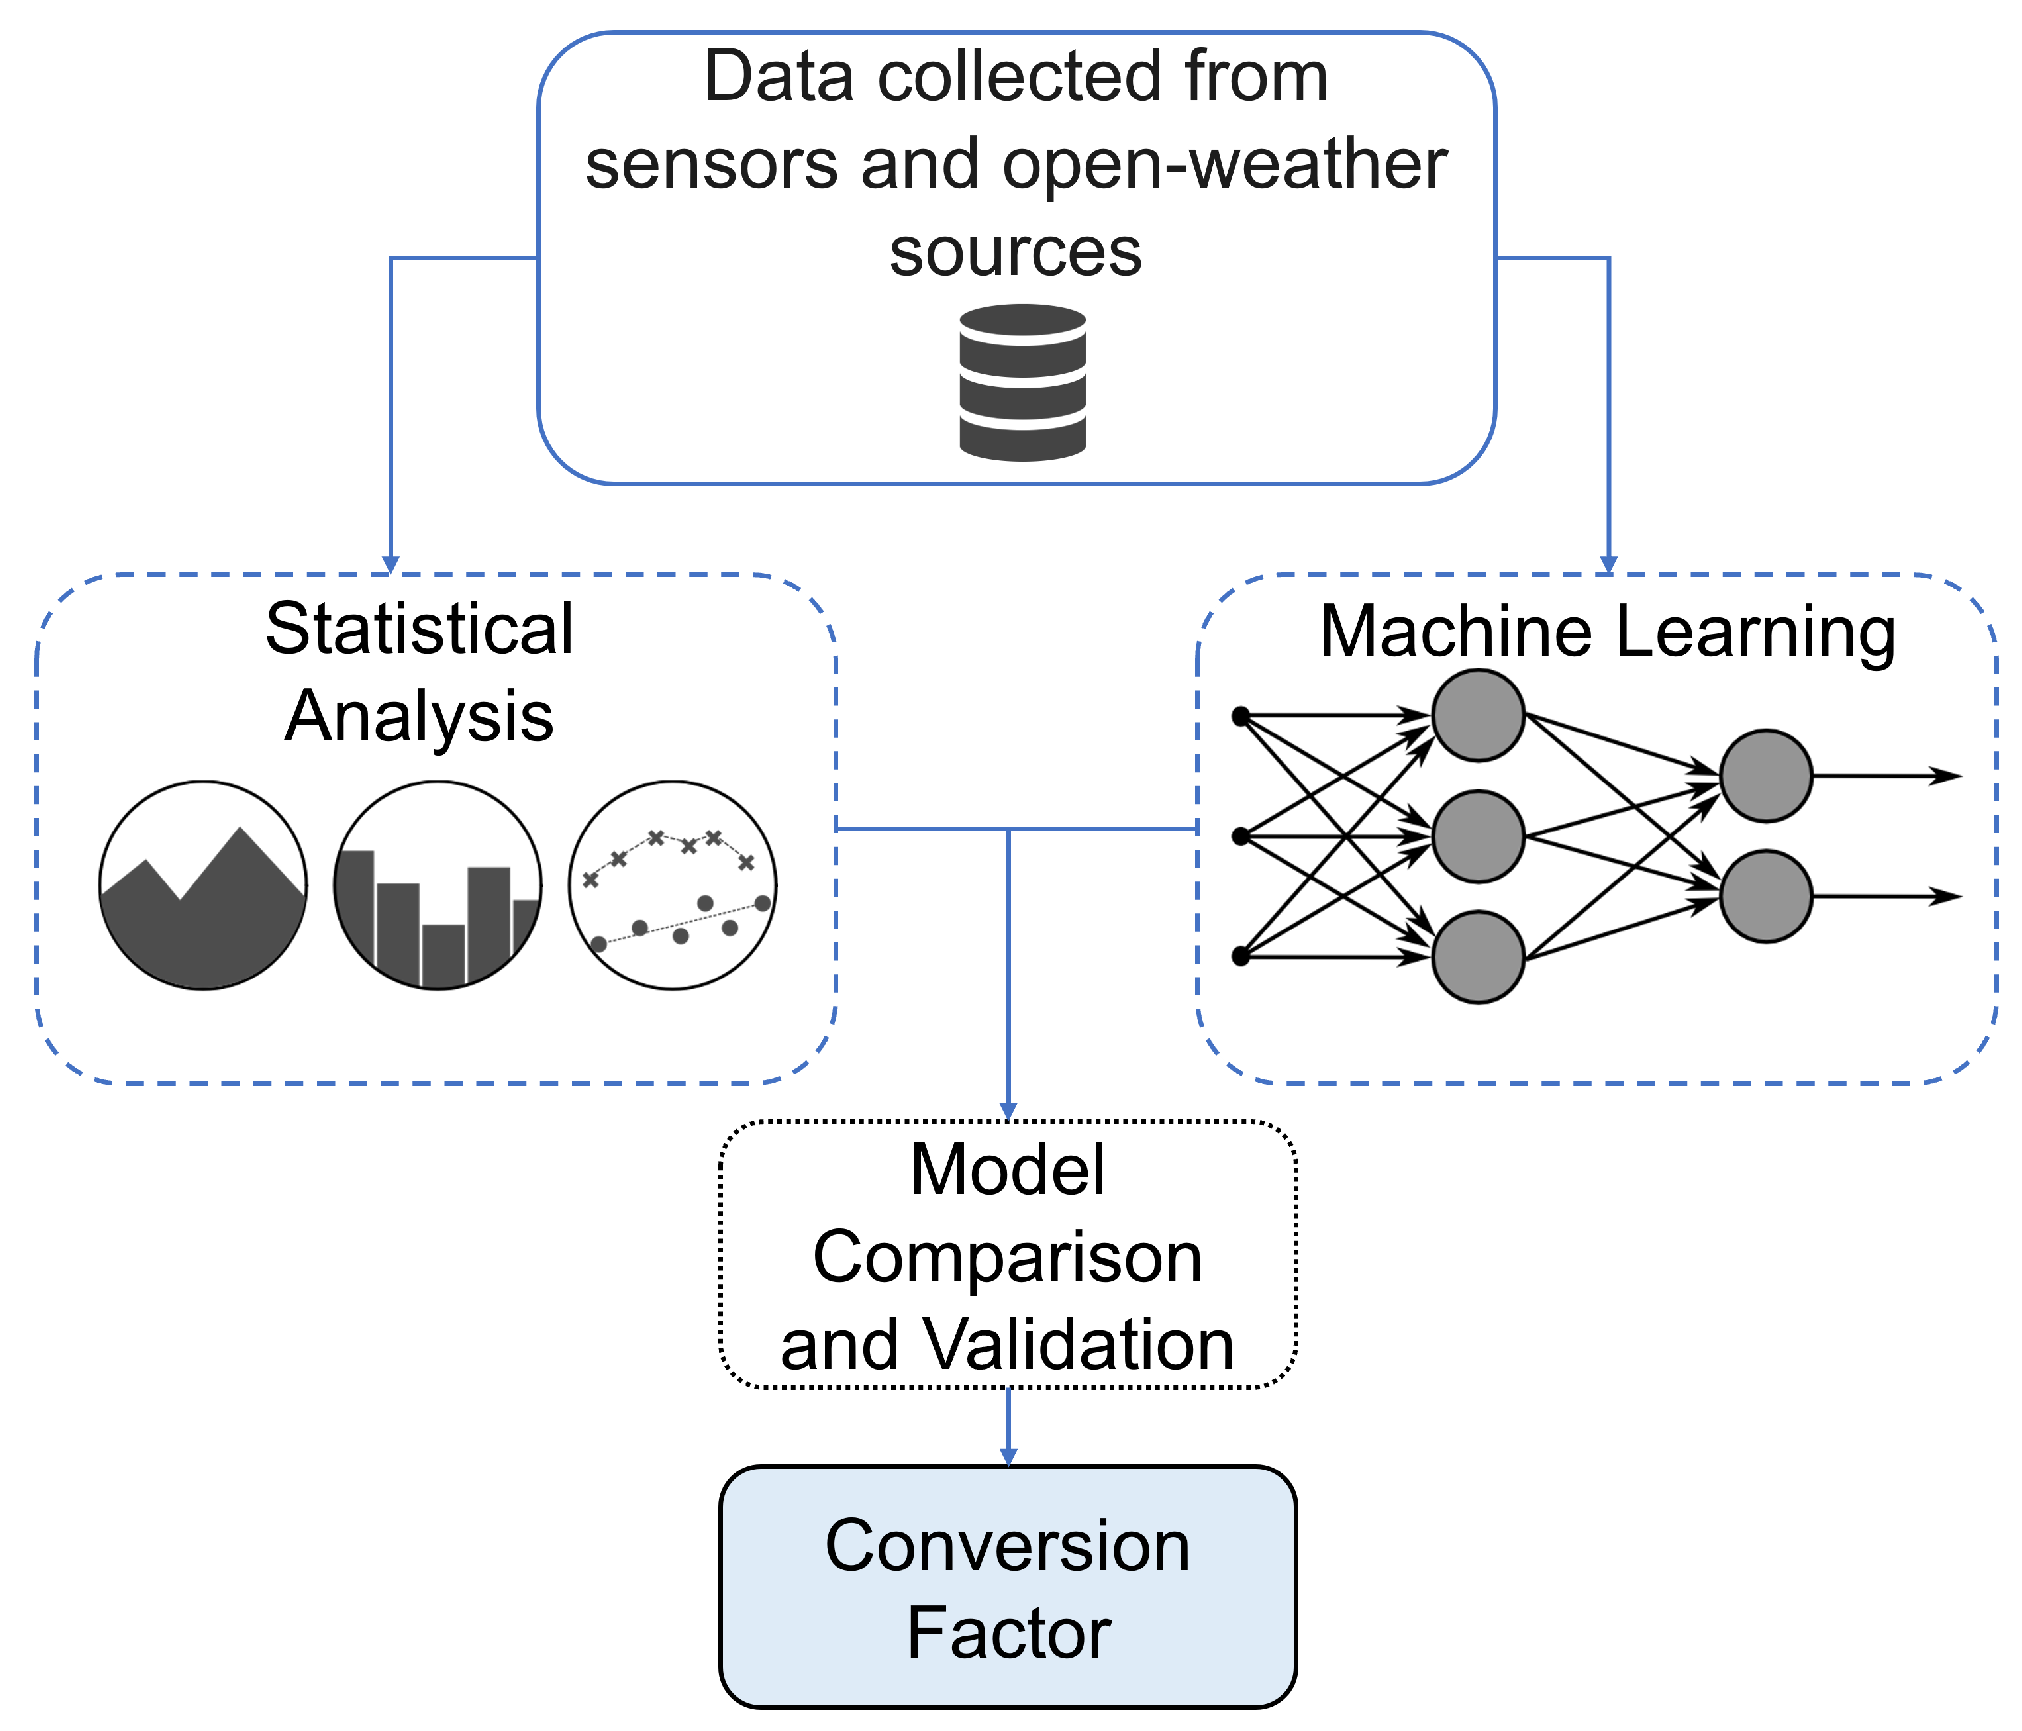
3.3. Statistical and Machine Learning Methodology
As illustrated in
Figure 10, the proposed methodology consists of several key stages. First, data are collected from low-cost ambient light sensors, the 6450 solar radiation sensor, and OpenWeather API resources to build a comprehensive dataset. The dataset includes key variables such as illuminance values (Lux BH1750 and Lux VEML7700), solar irradiance measurements from the Davis 6450 sensor, and environmental parameters including temperature at 2 m, relative humidity, cloud cover, and surface pressure from Open-Weather API. Each data point is time-stamped for proper temporal tracking and analysis.
This comprehensive dataset is the foundation for two parallel analytical approaches: statistical analysis (SA) and machine learning (ML). The statistical analysis provides fundamental insights through exploratory data analysis and regression techniques. Simultaneously, the ML approach (linear, RFR, and SVR) employs algorithms to uncover complex, nonlinear relationships between illuminance and solar irradiance by incorporating various environmental factors such as temperature, humidity, and cloud cover.
The SA approach involves descriptive statistics, exploratory data analysis, and regression modeling to identify trends and relationships between illuminance and solar irradiance. In parallel, the ML approach employs algorithms to uncover complex patterns and nonlinear relationships between illuminance and solar irradiance under varying environmental conditions [
64].
A model comparison and validation phase was conducted following the development of both statistical and machine learning models. This step determined which model was most accurate and reliable based on performance metrics such as the coefficient of determination (R
2), root mean squared error (RMSE), mean absolute error (MAE), and mean squared error (MSE), as described in Equations (
1)–(
3):
where
n is the number of observations and
is the error between the forecasted and actual values. The RMSE is a mathematical formula used to standardize the units of measurement of the MSE.
While the MSE assesses variance by evaluating how well a model fits the training data, the RMSE emphasizes specific data points more. This means that if a prediction is incorrect, it will significantly impact the overall error, as illustrated in Equation (
1).
In contrast, the MAE measures the distances from the predicted values to the actual points. Unlike RMSE, the MAE does not heavily penalize outliers, as it averages all errors regardless of their magnitude. This results in a more generic and bounded performance measure for the model, expressed in Equation (
2).
Ultimately, integrating both approaches leads to the derivation of an optimized conversion factor that allows for the accurate transformation of lux values into irradiance measurements.
3.4. System Deployment
As depicted in
Figure 11, the experimental setup employed in this work has been installed in the municipality of Ojocaliente, located in the state of Zacatecas, Mexico, at geographic coordinates 22°33′40″ N latitude and 102°14′44″ W longitude, with an altitude of 2043 m above sea level.
According to the Global Solar Atlas data for the site, the DNI is 6.858 kWh/m2 per day, while the GHI reaches 6.112 kWh/m2 per day. The site also experiences a Diffuse Horizontal Irradiation (DHI) of 1.685 kWh/m2 per day and a Global Tilted Irradiation (GTI) at the optimum angle of 6.616 kWh/m2 per day, with an optimal PV module tilt of 25°.
4. Results
This section presents the results from the tests conducted, which evaluated various aspects of the system. It details the data obtained from measurements, the system’s responses to different conditions, and comparisons between expected and actual results. Key findings are highlighted to assess the effectiveness and accuracy of the implemented design and demonstrate how they contribute to this study’s objectives.
4.1. Collected Data
The resultant data comprised information from 8 November–6 December 2024. During this period, data were collected continuously at 1 min intervals, resulting in an expected 1440 samples per day; however, due to intermittent communication interruptions, the total number of recorded samples per sensor was approximately 40,124. These interruptions were minor and did not significantly affect the overall quality or continuity of the dataset.
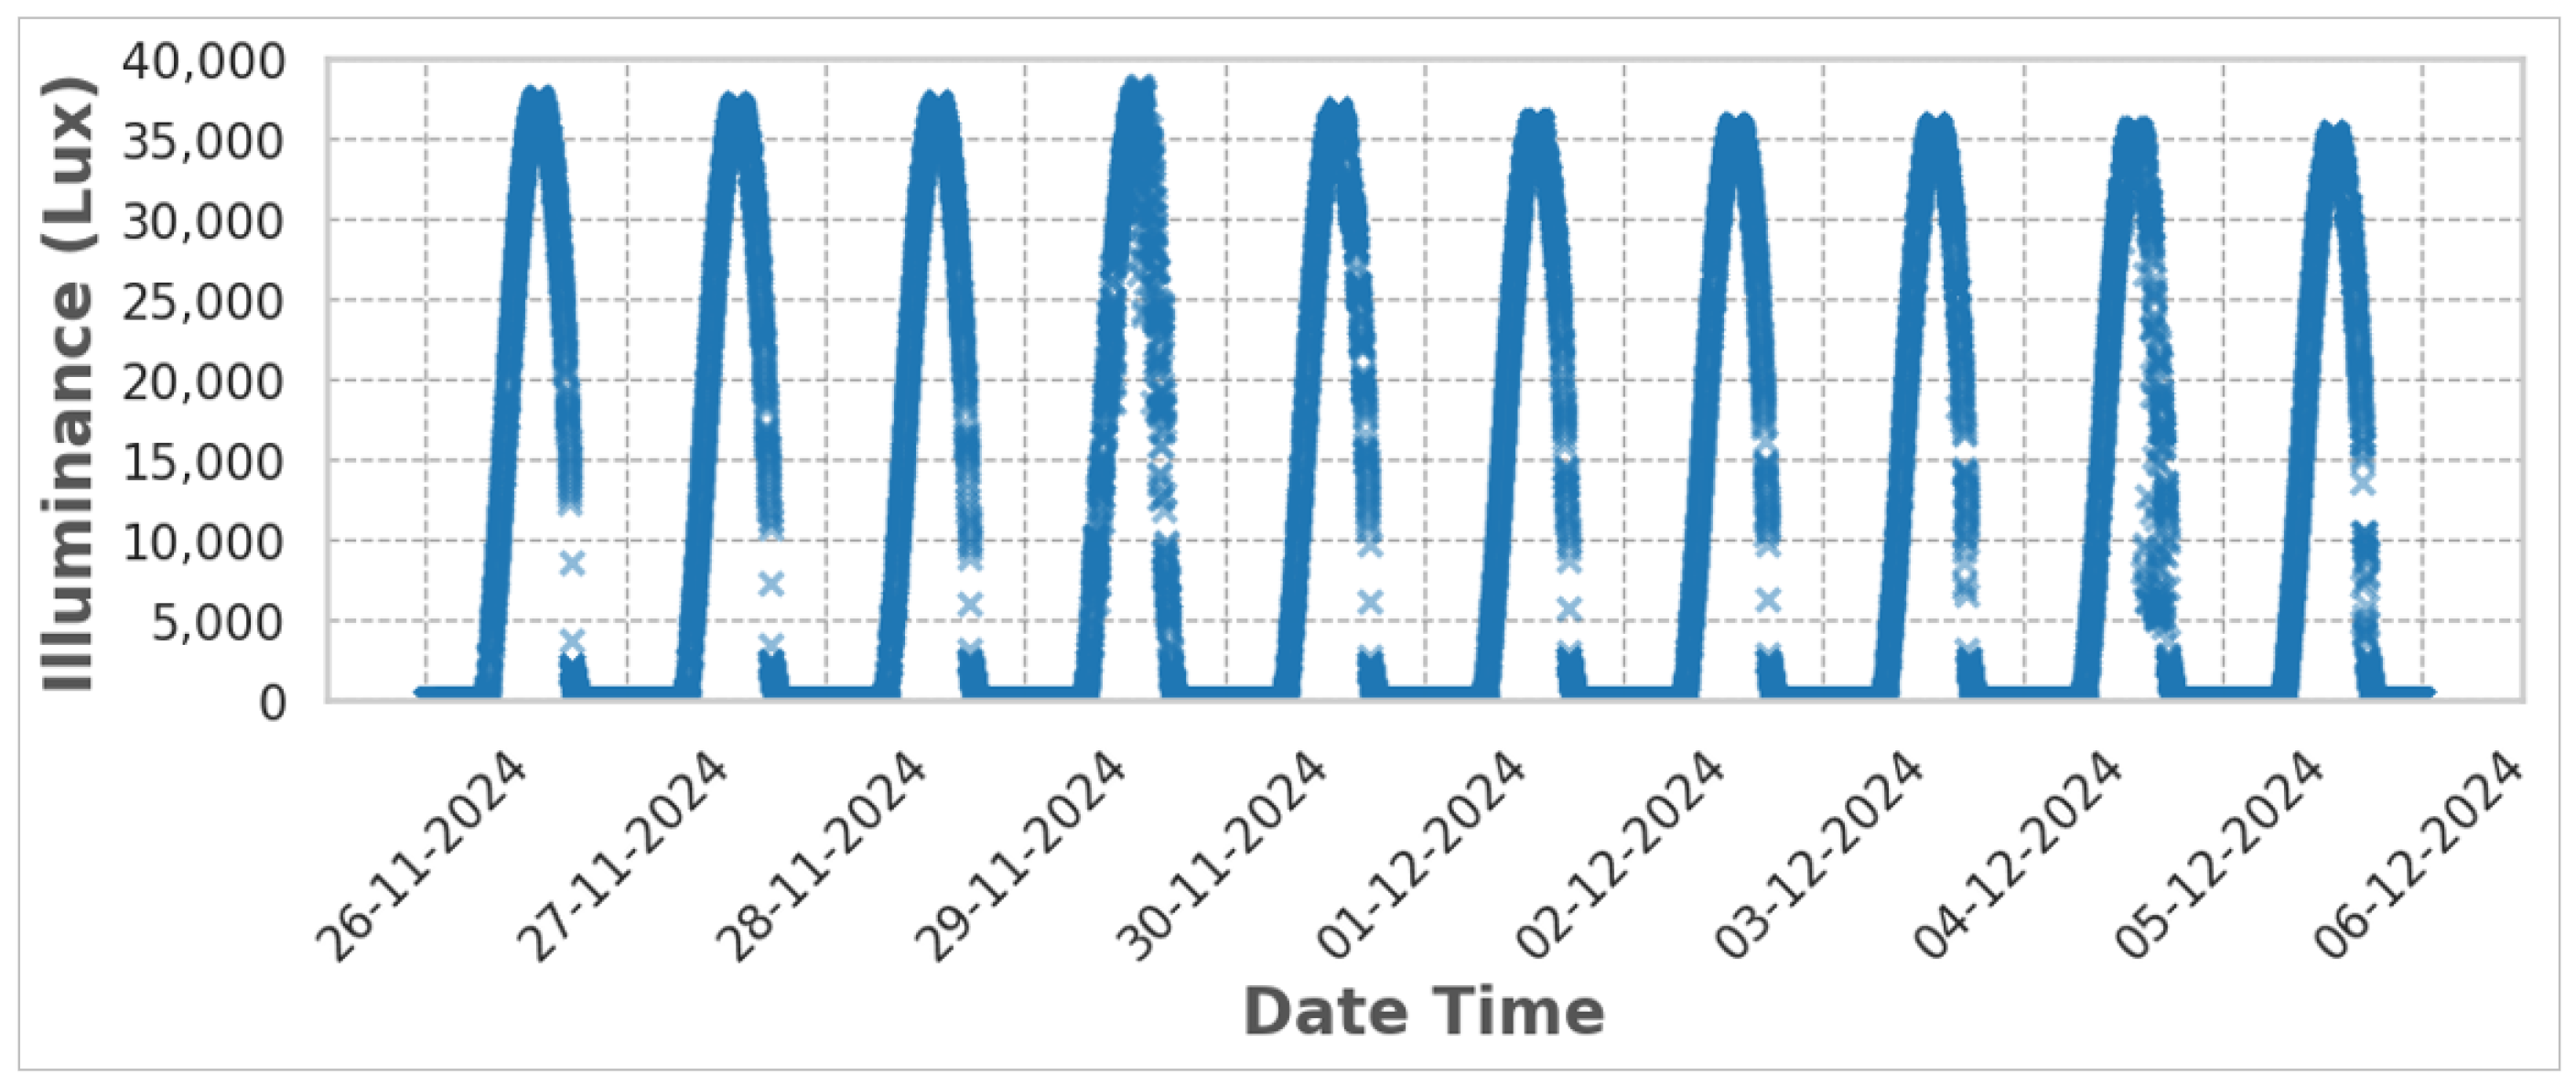
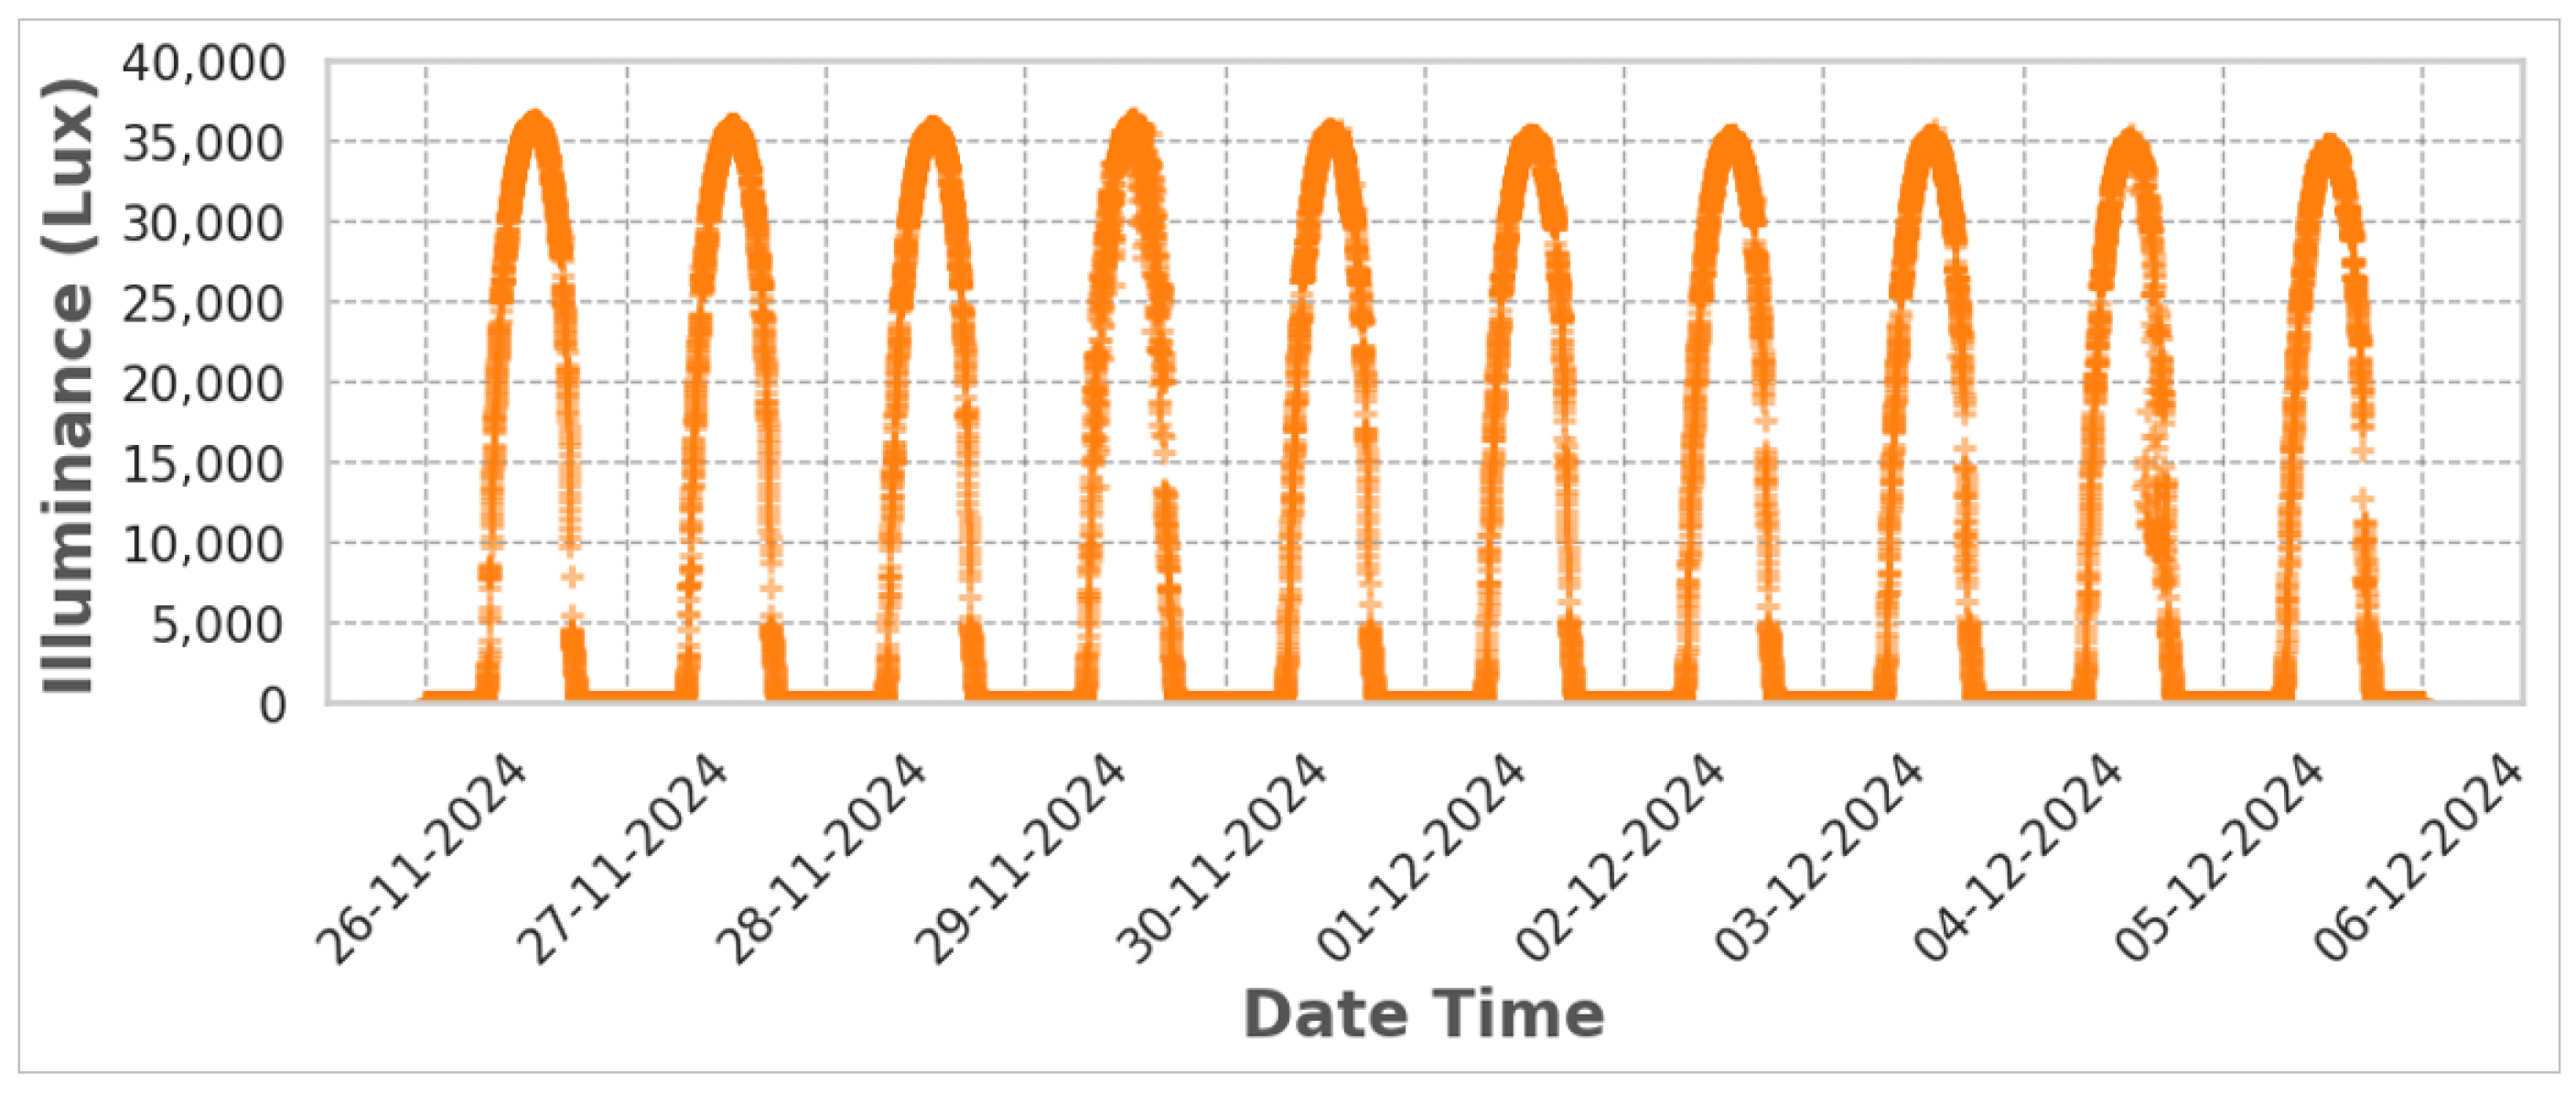
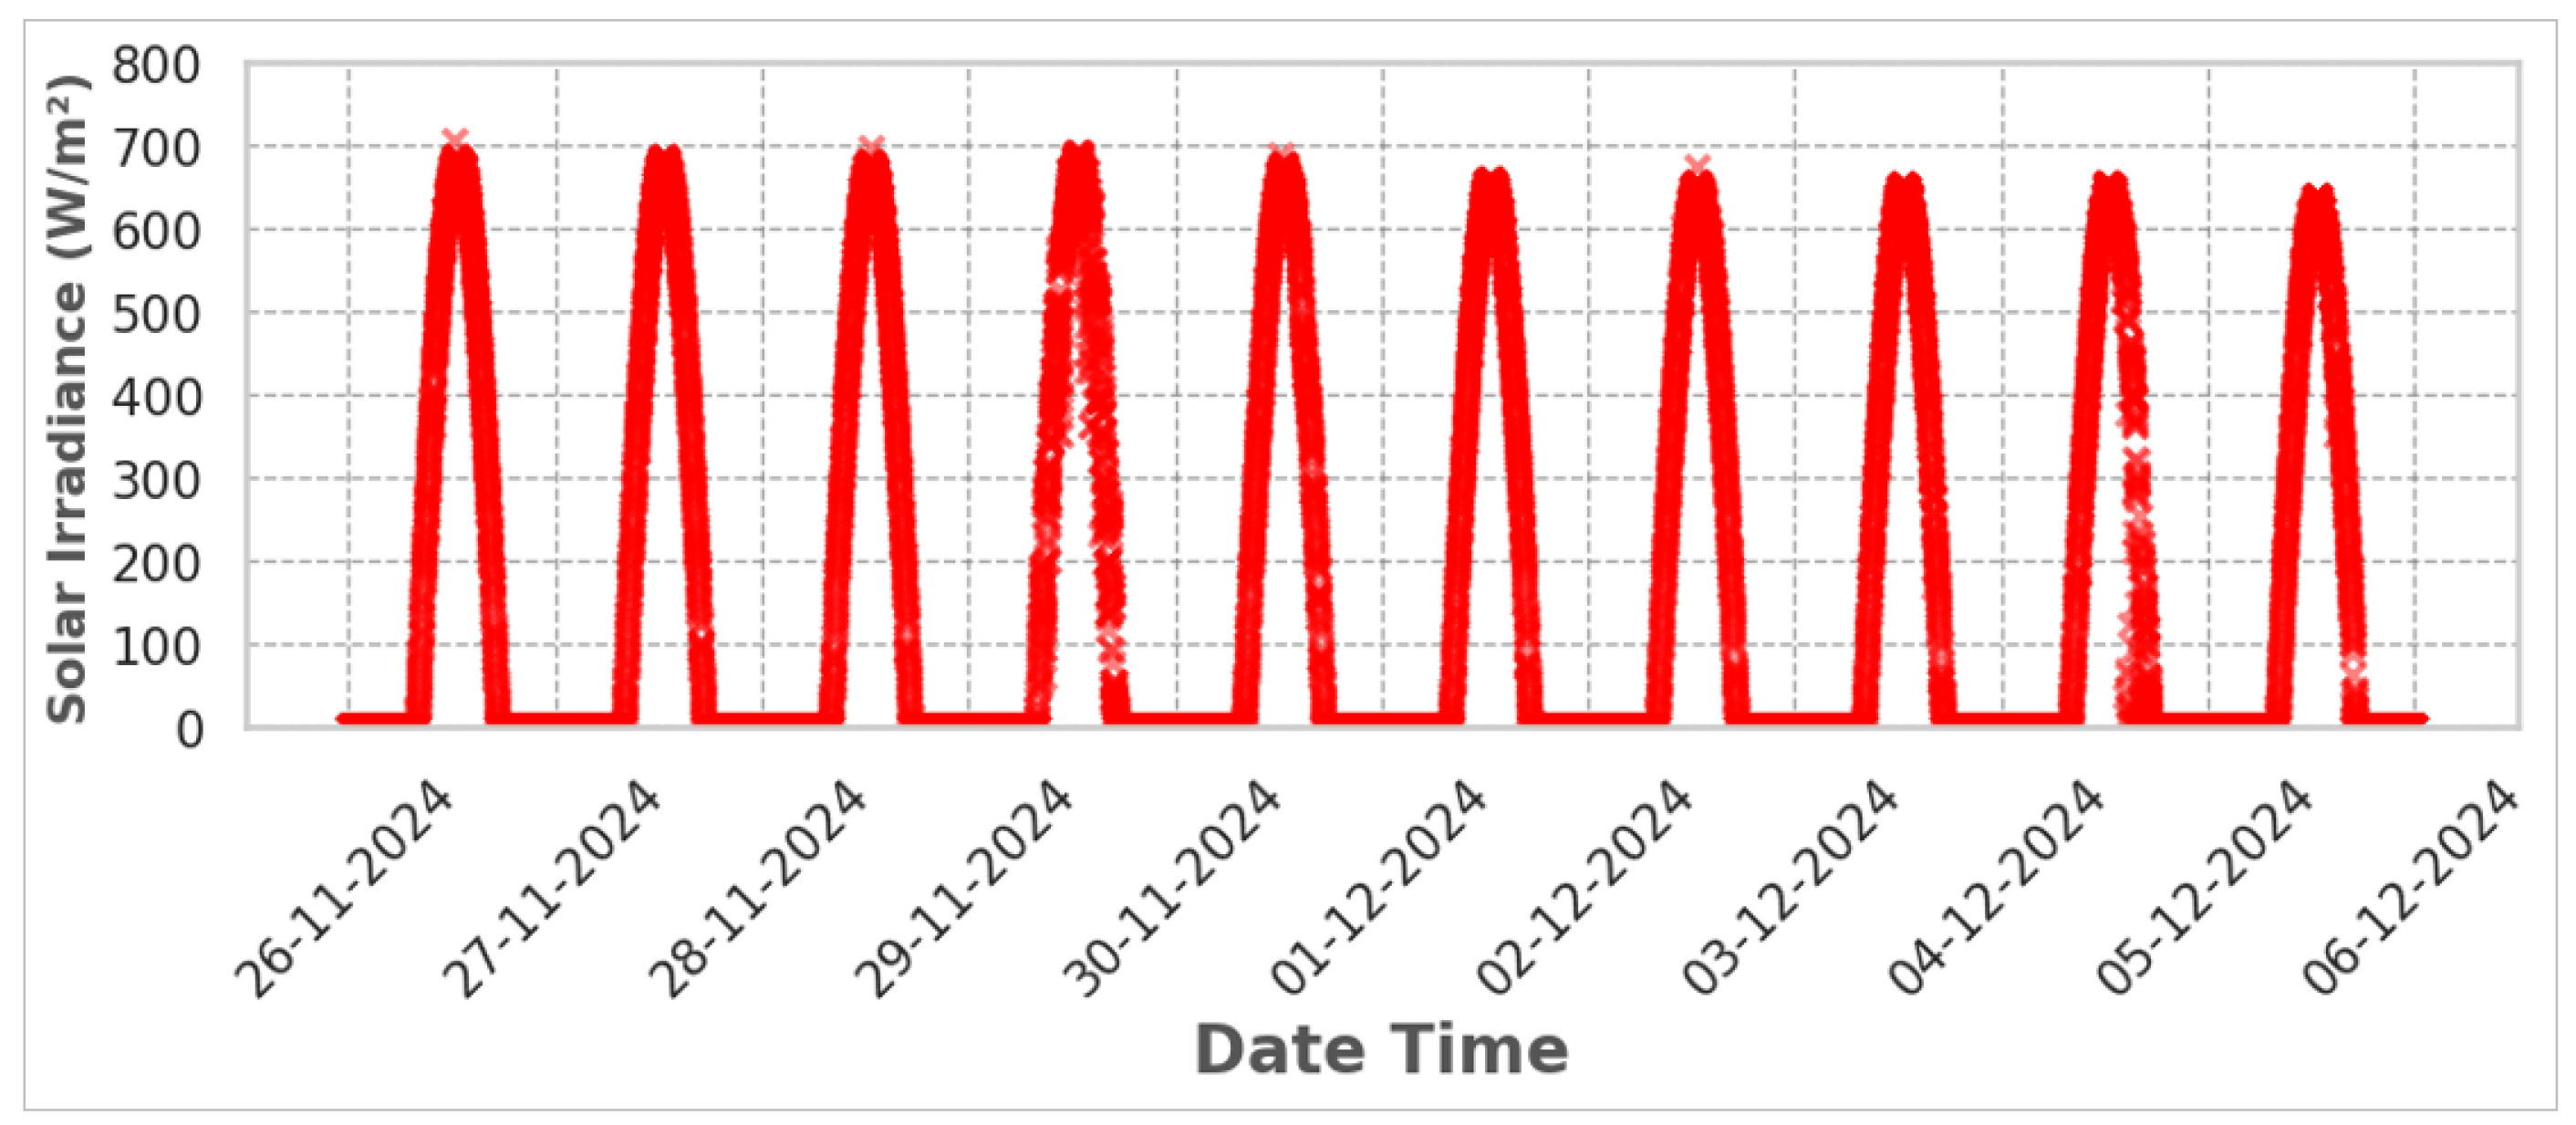
Figure 12,
Figure 13 and
Figure 14 present graphical representations of the last 10 days of recorded data for the BH1750, VEML7700, and Davis 6450 sensors, respectively.
According to the data, the Davis 6450 sensor recorded maximum solar irradiances in the 600 to 700 W/m
2 range, with a peak of 706 W/m
2 recorded on November 26, 2024 (see
Figure 14). Moreover, the complete dataset from the Davis 6450 sensor showed maximum irradiance values ranging from 641 W/m
2 to 946 W/m
2.
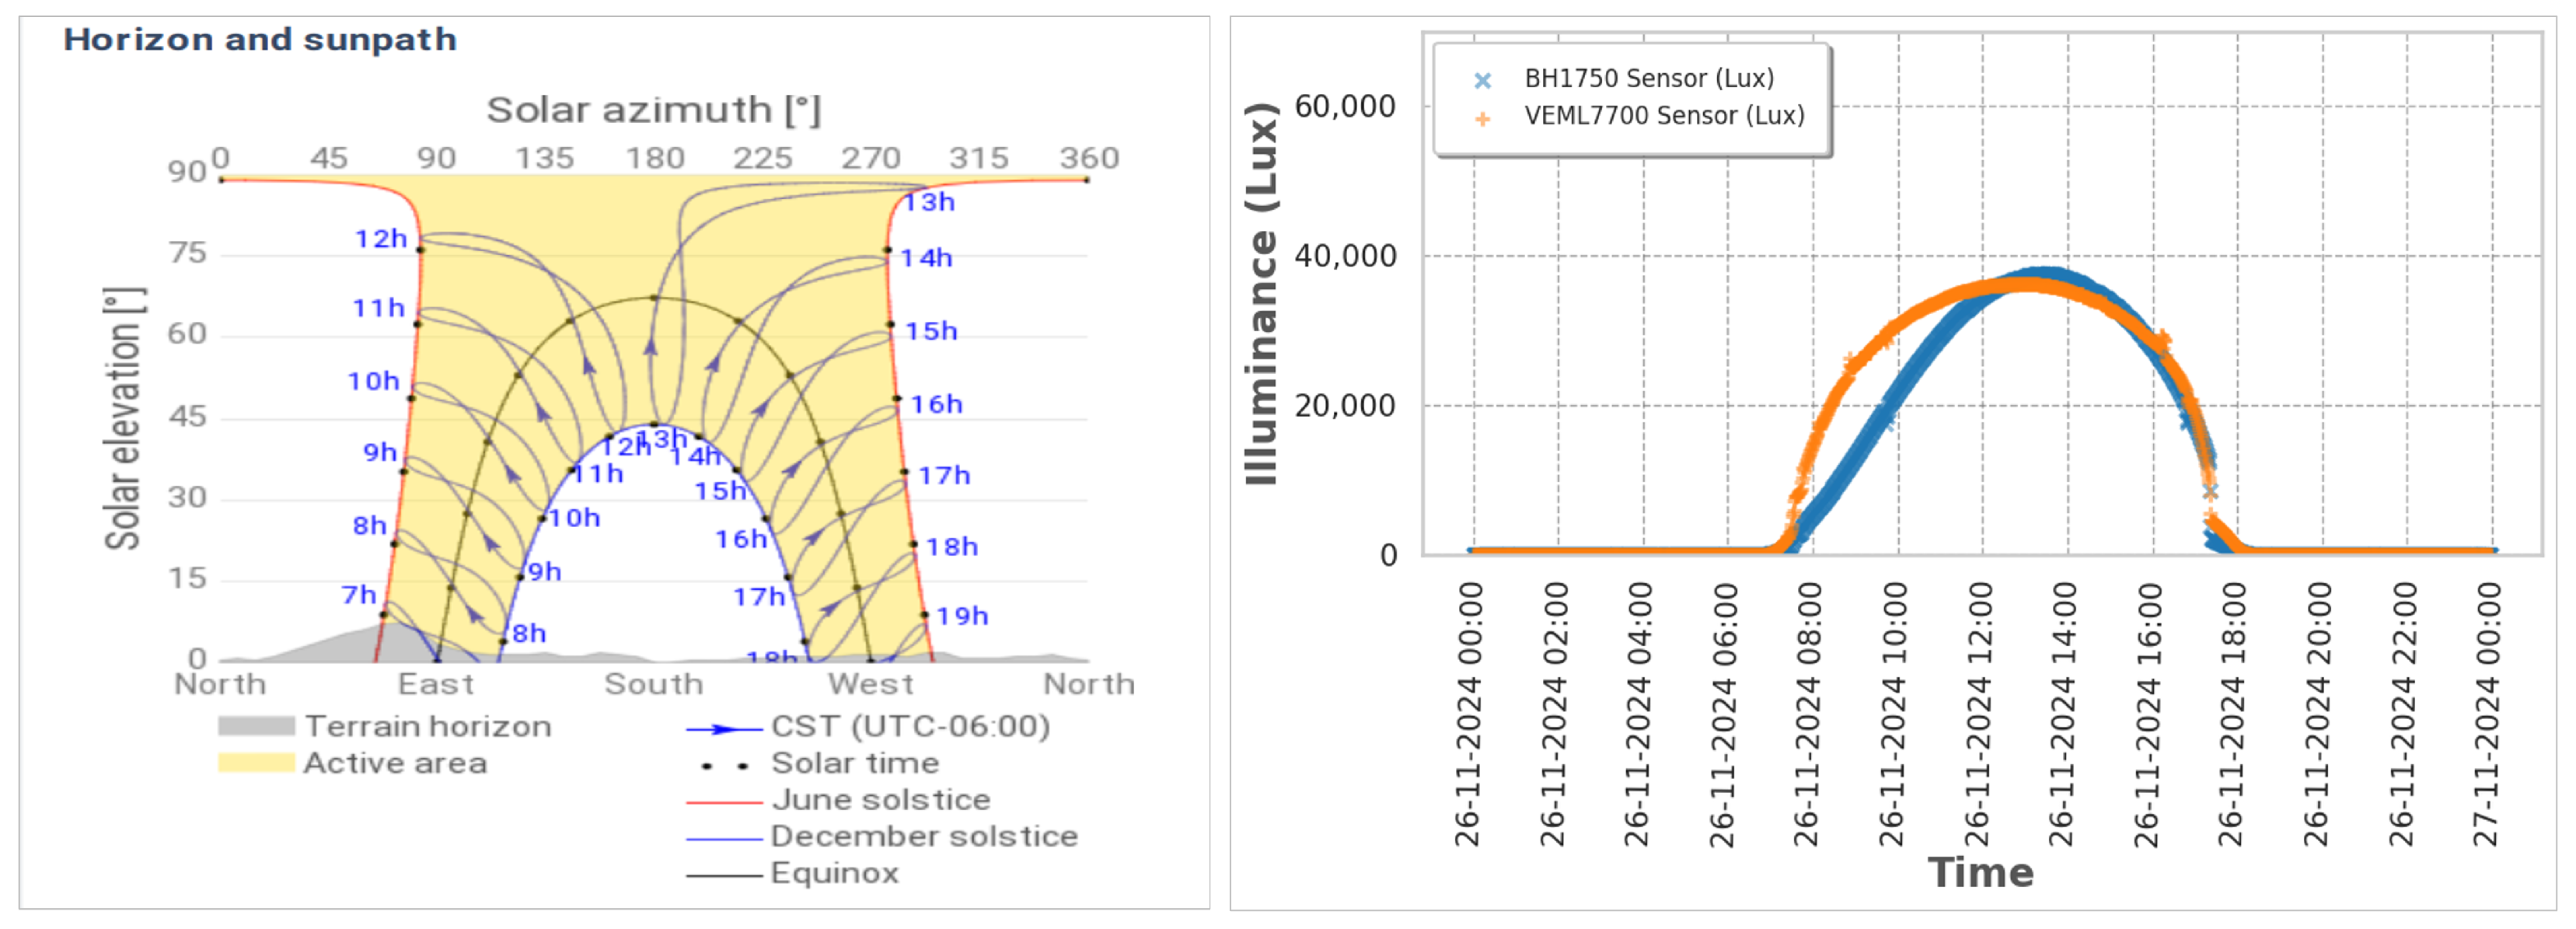
On the other hand, both illuminance sensors reflected a pattern similar to the irradiance measurements. The maximum recorded illuminance values were 36.3 Klux for the VEML7700 sensor and 37.6 Klux for the BH1750 sensor, both observed around solar noon. Illuminance levels commenced at approximately 6:51 AM, gradually increasing until midday, before tapering to zero by 6:30 PM. This behavior aligned with the documented solar trajectory, as depicted in
Figure 15.
4.2. Results for the Relationship Between Illuminance and Solar Irradiance
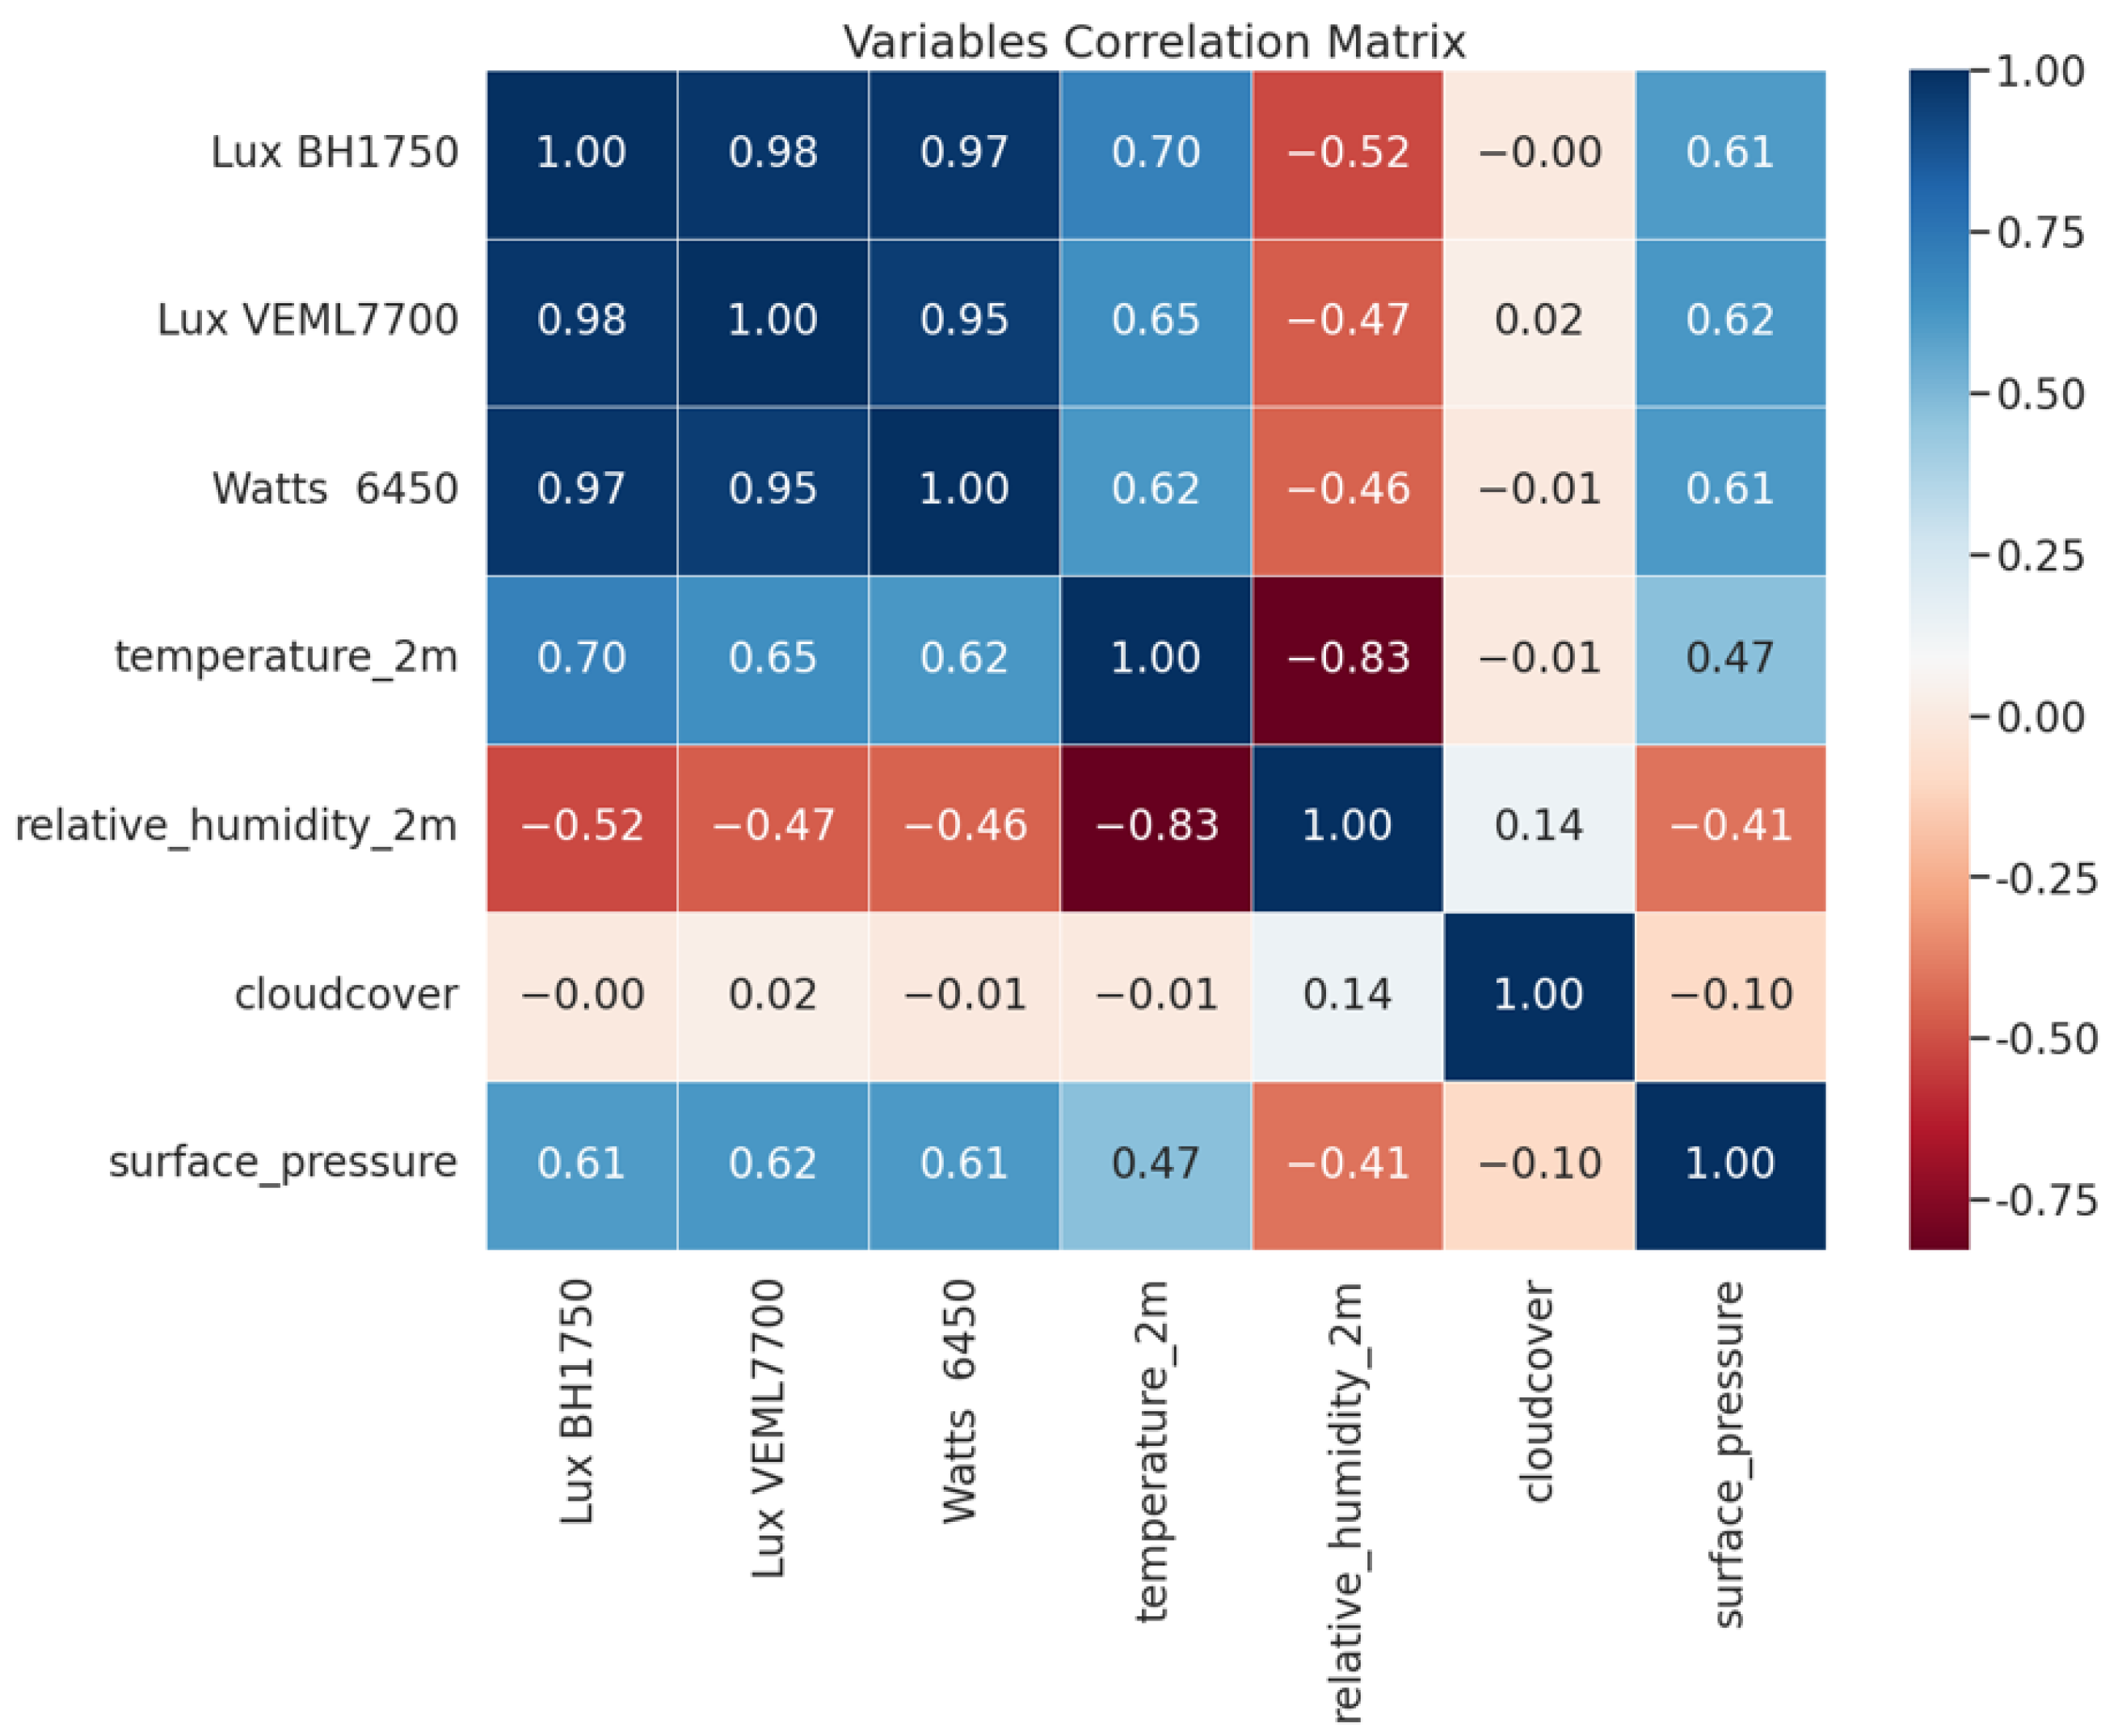
After compiling the dataset, a correlation matrix analysis was developed to identify the degree of association between the collected variables, as shown in
Figure 16.
The analysis revealed strong correlations between illuminance values from the BH1750 () and VEML7700 () sensors and solar irradiance measurements obtained from the Davis 6450 sensor.
Other environmental factors, such as temperature ( with BH1750, with VEML7700) and relative humidity ( with BH1750, with VEML7700), exhibited moderate correlations, suggesting their potential influence on the conversion process. The relatively lower correlations of cloud cover () and surface pressure () indicated that these variables might have had a limited impact on the conversion of illuminance to irradiance.
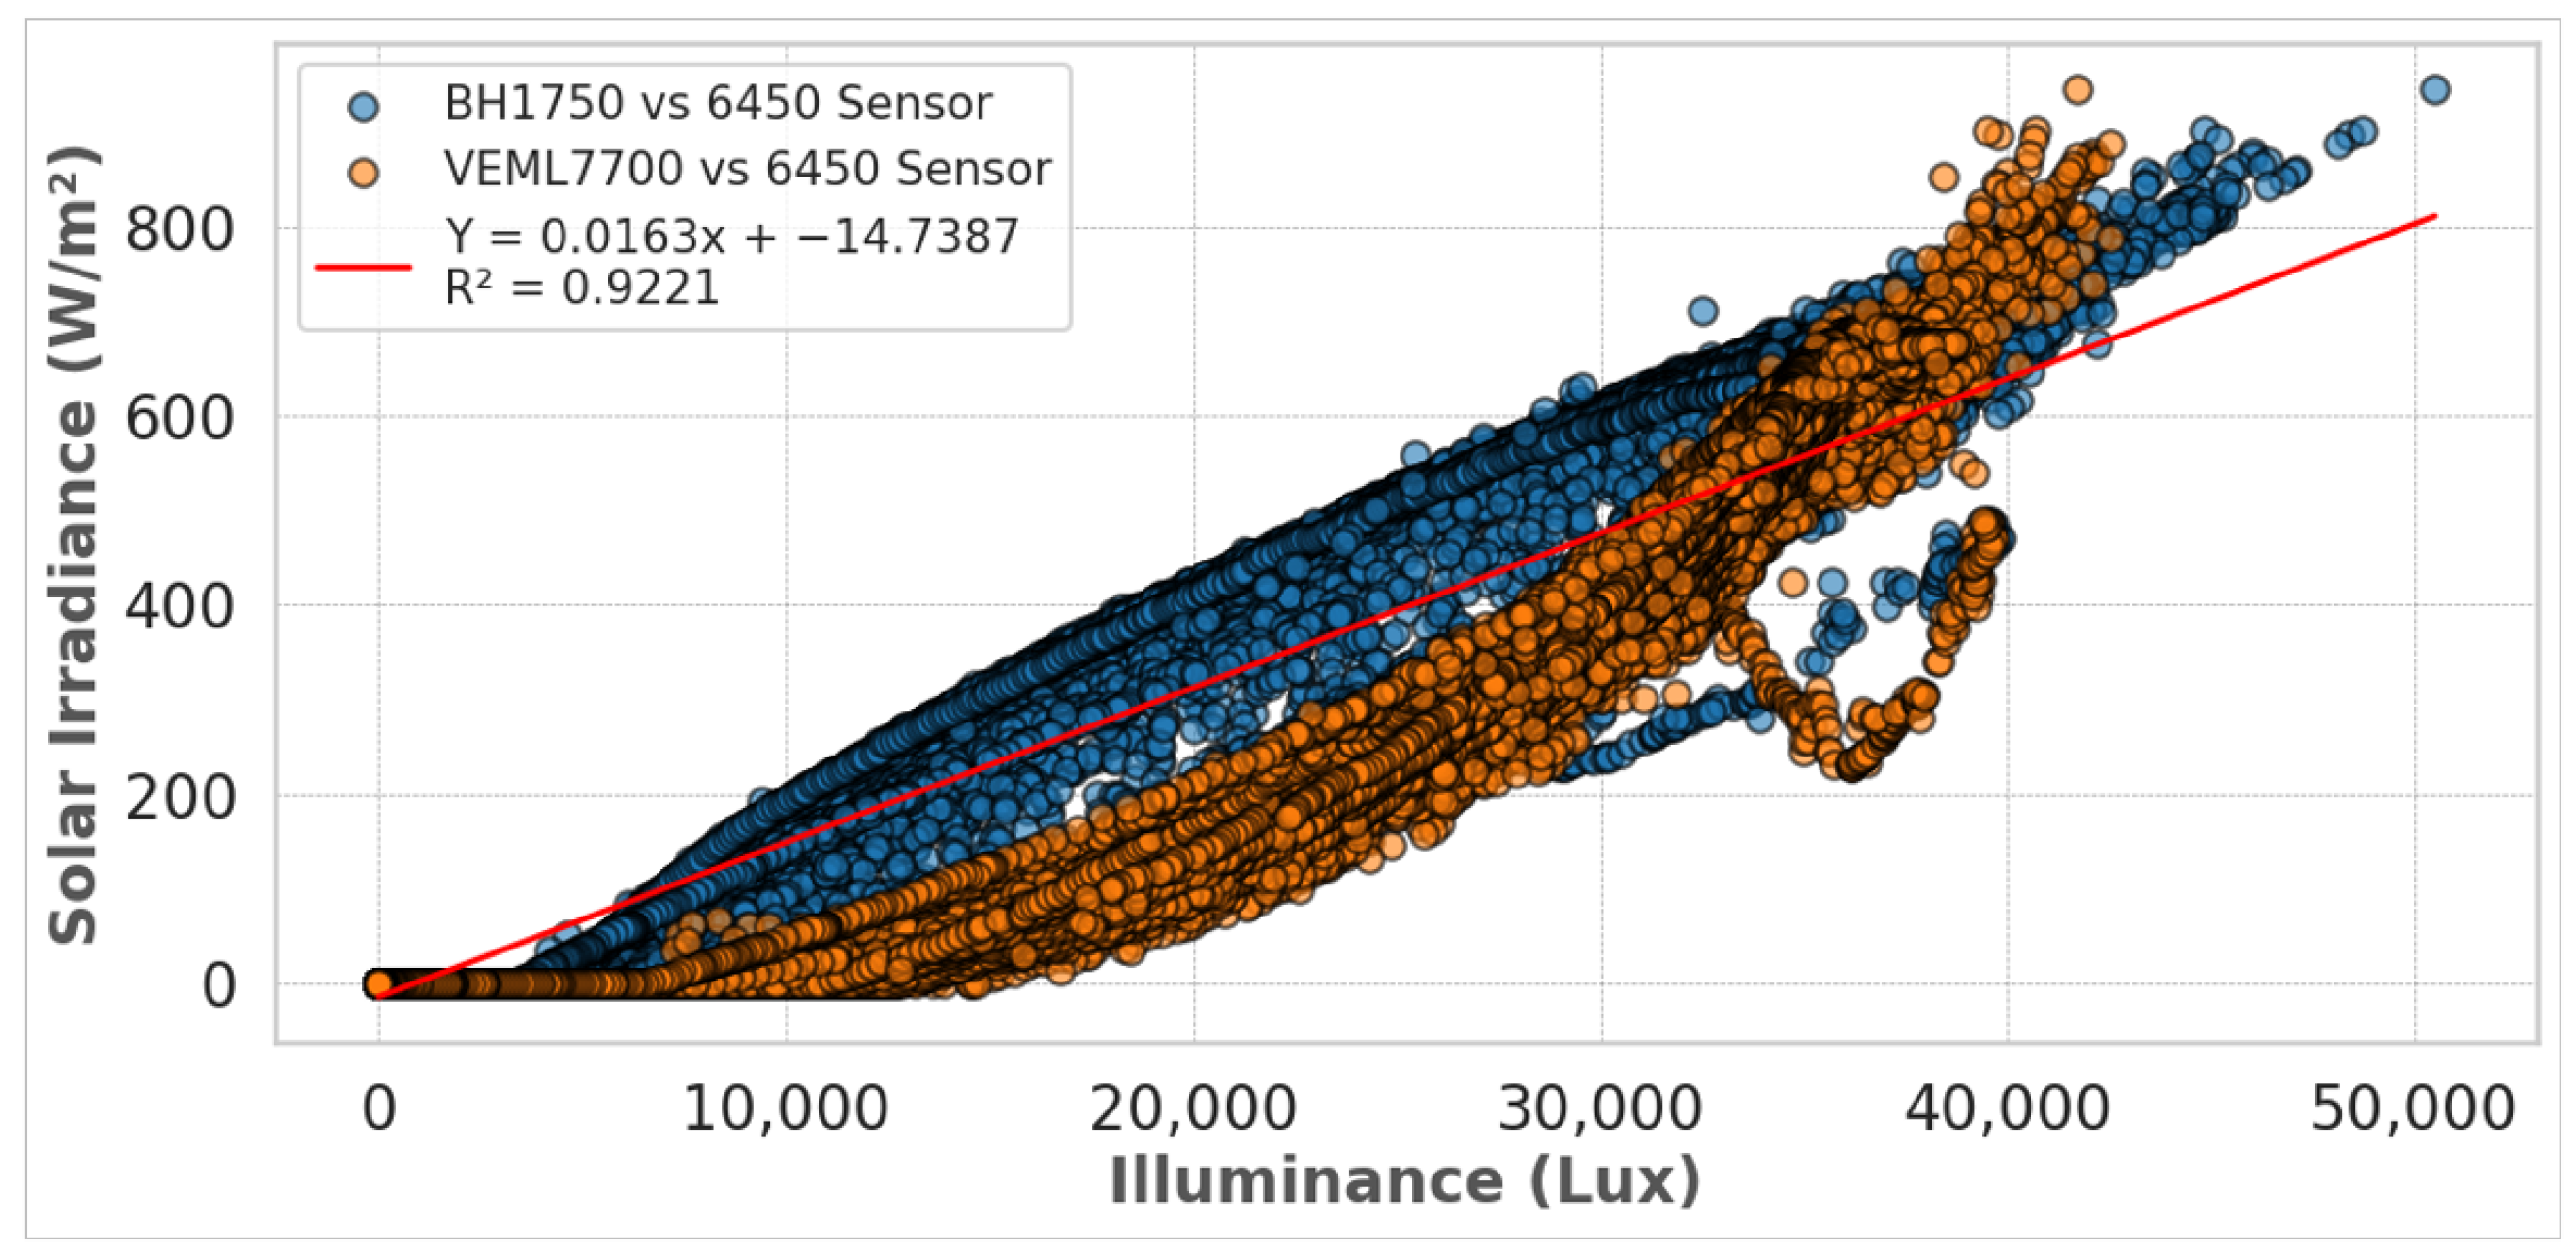
Figure 17 shows the relationship between illuminance (Lux) data from the BH1750 and VEML7700 sensors and solar irradiance (W/m
2) obtained from the 6450 sensors.
The positive trend for BH1750 and VEML7700 data indicated that higher illuminance readings corresponded to higher irradiance measurements. However, the spread of the points varied slightly between the two sensors, reflecting their distinct response characteristics under different lighting conditions. These results suggest that both sensors could be representative of the estimation of solar irradiance.
This way, a linear regression (LR) model was applied over the complete dataset to establish the relationship between illuminance (Lux) data from the BH1750 and VEML7700 sensors and solar irradiance (W/m
2) obtained from the 6450 sensors and the Open-Meteo API, as illustrated in
Figure 17.
The LR model used to describe this relationship is expressed by Equation (
4):
where
Y represents the predicted solar irradiance (W/m2);
X is the measured illuminance (lux);
m is the slope of the regression line, representing the rate of change of irradiance with respect to illuminance;
b is the intercept, representing the irradiance value when illuminance is zero.
The LR model is described by Equation (
5):
where R
2 = 0.9221.
The analysis resulted in a coefficient of determination of 0.9221, indicating a strong relationship where the irradiance values tended to show a corresponding trend as illuminance levels increased.
4.3. Results for Statistical Analysis: BH1750
According to the variable correlation matrix, the correlation between the illuminance sensors, specifically the BH1750 sensor, and the Davis 6450 sensor was . This correlation suggested that illuminance values could effectively estimate irradiance levels through mathematical modeling.
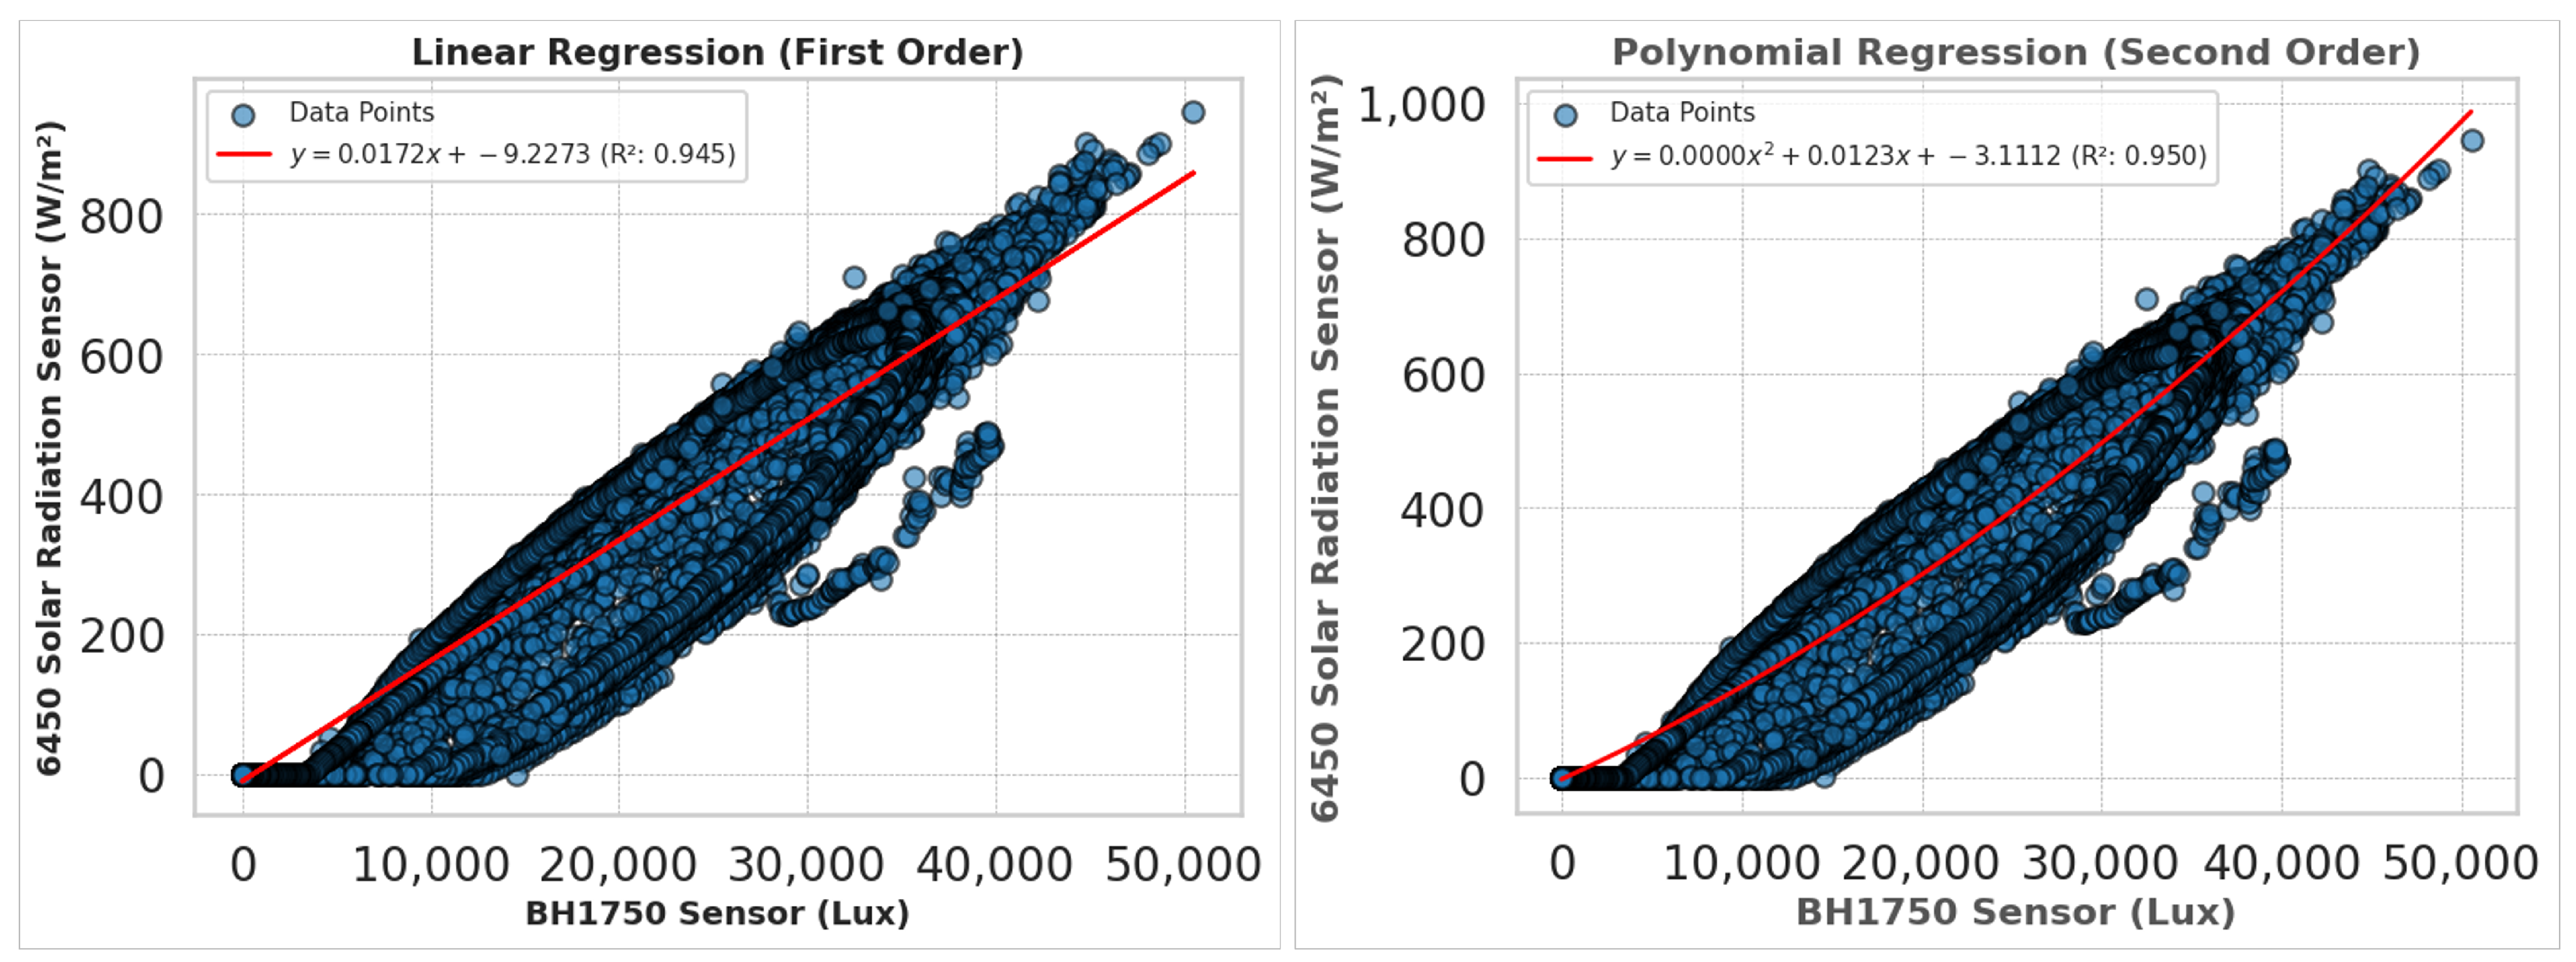
This way, the statistical analysis approach used linear and polynomial regression models applied to the BH1750 sensor and 6450 solar radiation sensor data to evaluate the relationships between the variables. The plot on the left in
Figure 18 presents the first-order (linear) regression analysis results. In contrast, on the right side of
Figure 18, the second-order (polynomial) regression model applied to the same dataset is depicted.
As shown in
Figure 18, both the linear (left) and polynomial (right) regression models demonstrated relative linear correlations between the BH1750 illuminance sensor and the Davis 6450 solar radiation sensor. The difference in R values between the linear and polynomial models was not extremely large; however, this improvement indicated that the second-order model may have yielded more accurate solar irradiance estimates, especially when illuminance values approached the upper end of the measured range.
Table 3 presents the polynomial equations and the MSE, MAE, and RMSE metrics for these models, which help elucidate the modeled dynamics more clearly.
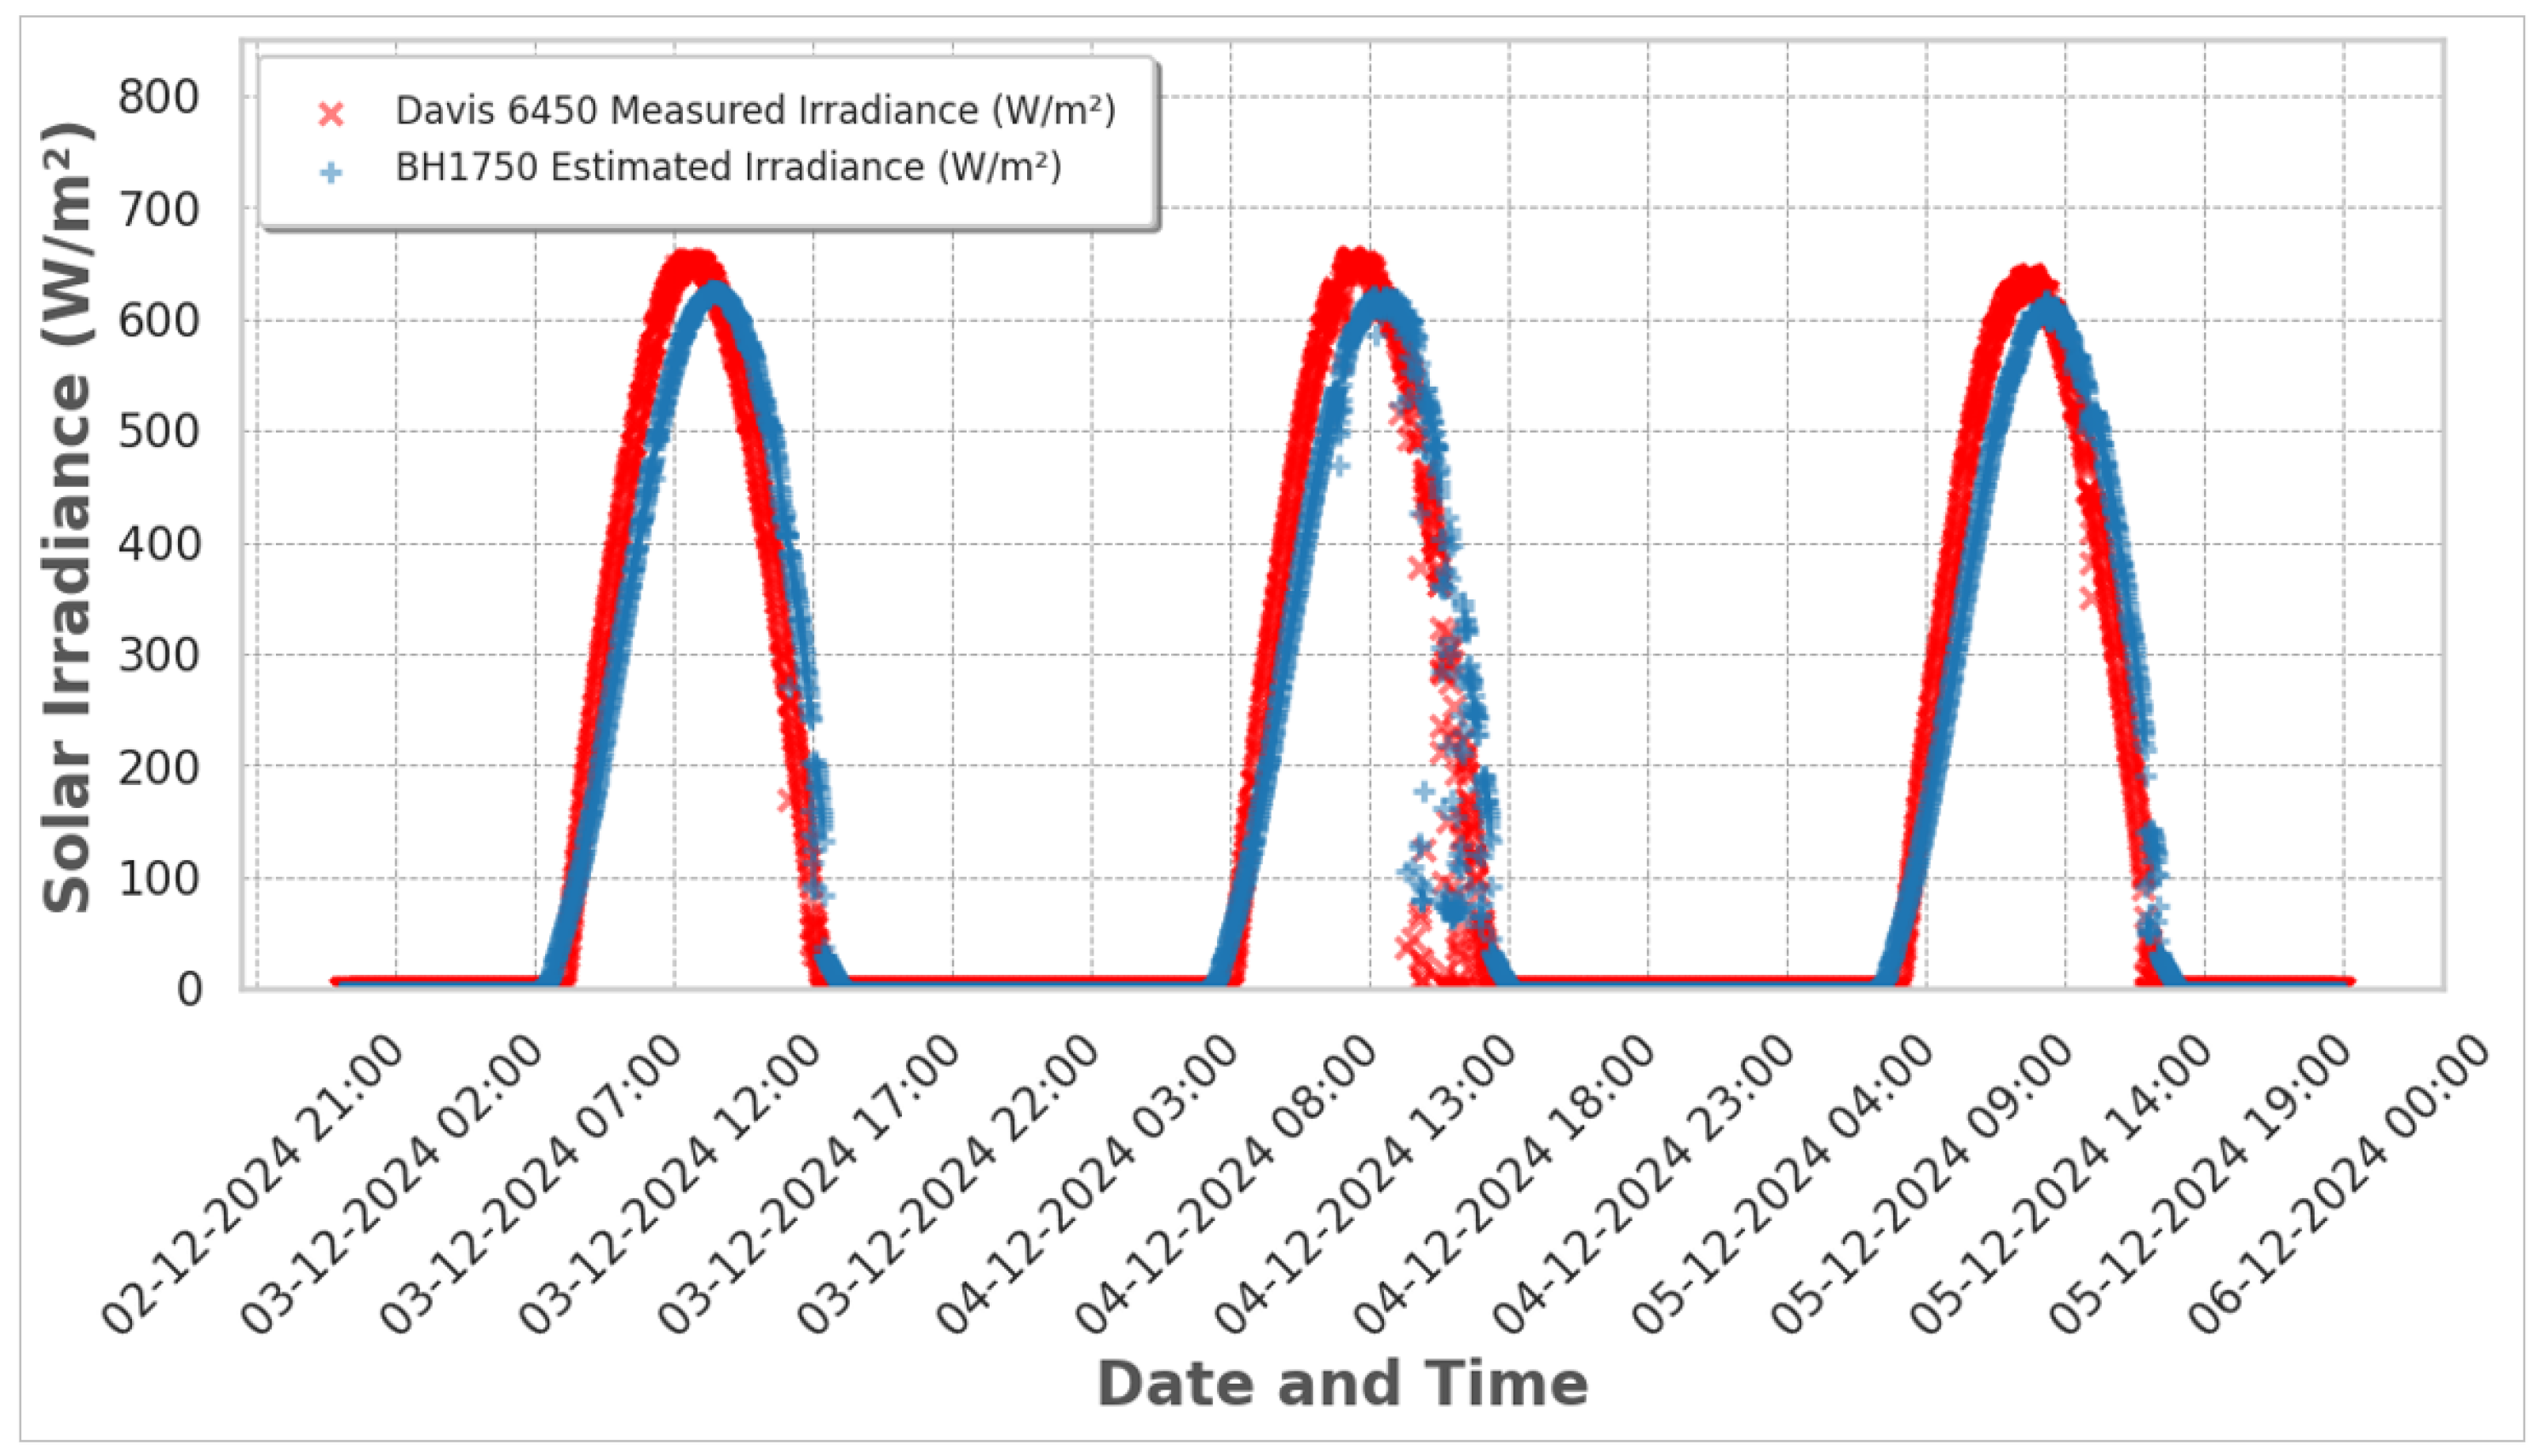
Figure 19 compares solar irradiance values obtained from the Davis 6450 sensor over three days, the estimated irradiance derived from the BH1750 illuminance sensor, and direct radiation measurements. The measured data from the Davis 6450 sensor (represented by red crosses) served as the reference. In contrast, the estimated values (represented by blue plus signs) were calculated using the second-order regression in the
Table 3 model that converted illuminance (Lux) to irradiance (W/m
2).
As shown in
Figure 19, the two data series followed a similar daily pattern, especially around midday when irradiance peaked, where a temporal offset existed between the two measurements. This offset may have resulted from the Davis 6450’s longer update interval of 50 s to 1 min, which averaged or integrated values over that duration. In contrast, the BH1750 had a much shorter sampling time of 120 milliseconds, allowing it to capture variations in irradiance instantly. Additionally, the broader spectral response range of the Davis 6450 (400–1100 nm) compared to the BH1750’s focus on the visible spectrum (400–700 nm) may also have contributed to the minor discrepancies in the timing of detected irradiance maxima and minima. Nevertheless, these observations indicated that the BH1750 sensor could reasonably approximate solar irradiance under typical conditions.
4.4. Results for Statistical Analysis: VEML7700
Similarly, as with the BH1750, for the VEML7700, the correlation between the illuminance sensors, specifically the VEML7700 sensor, and the Davis 6450 sensor was
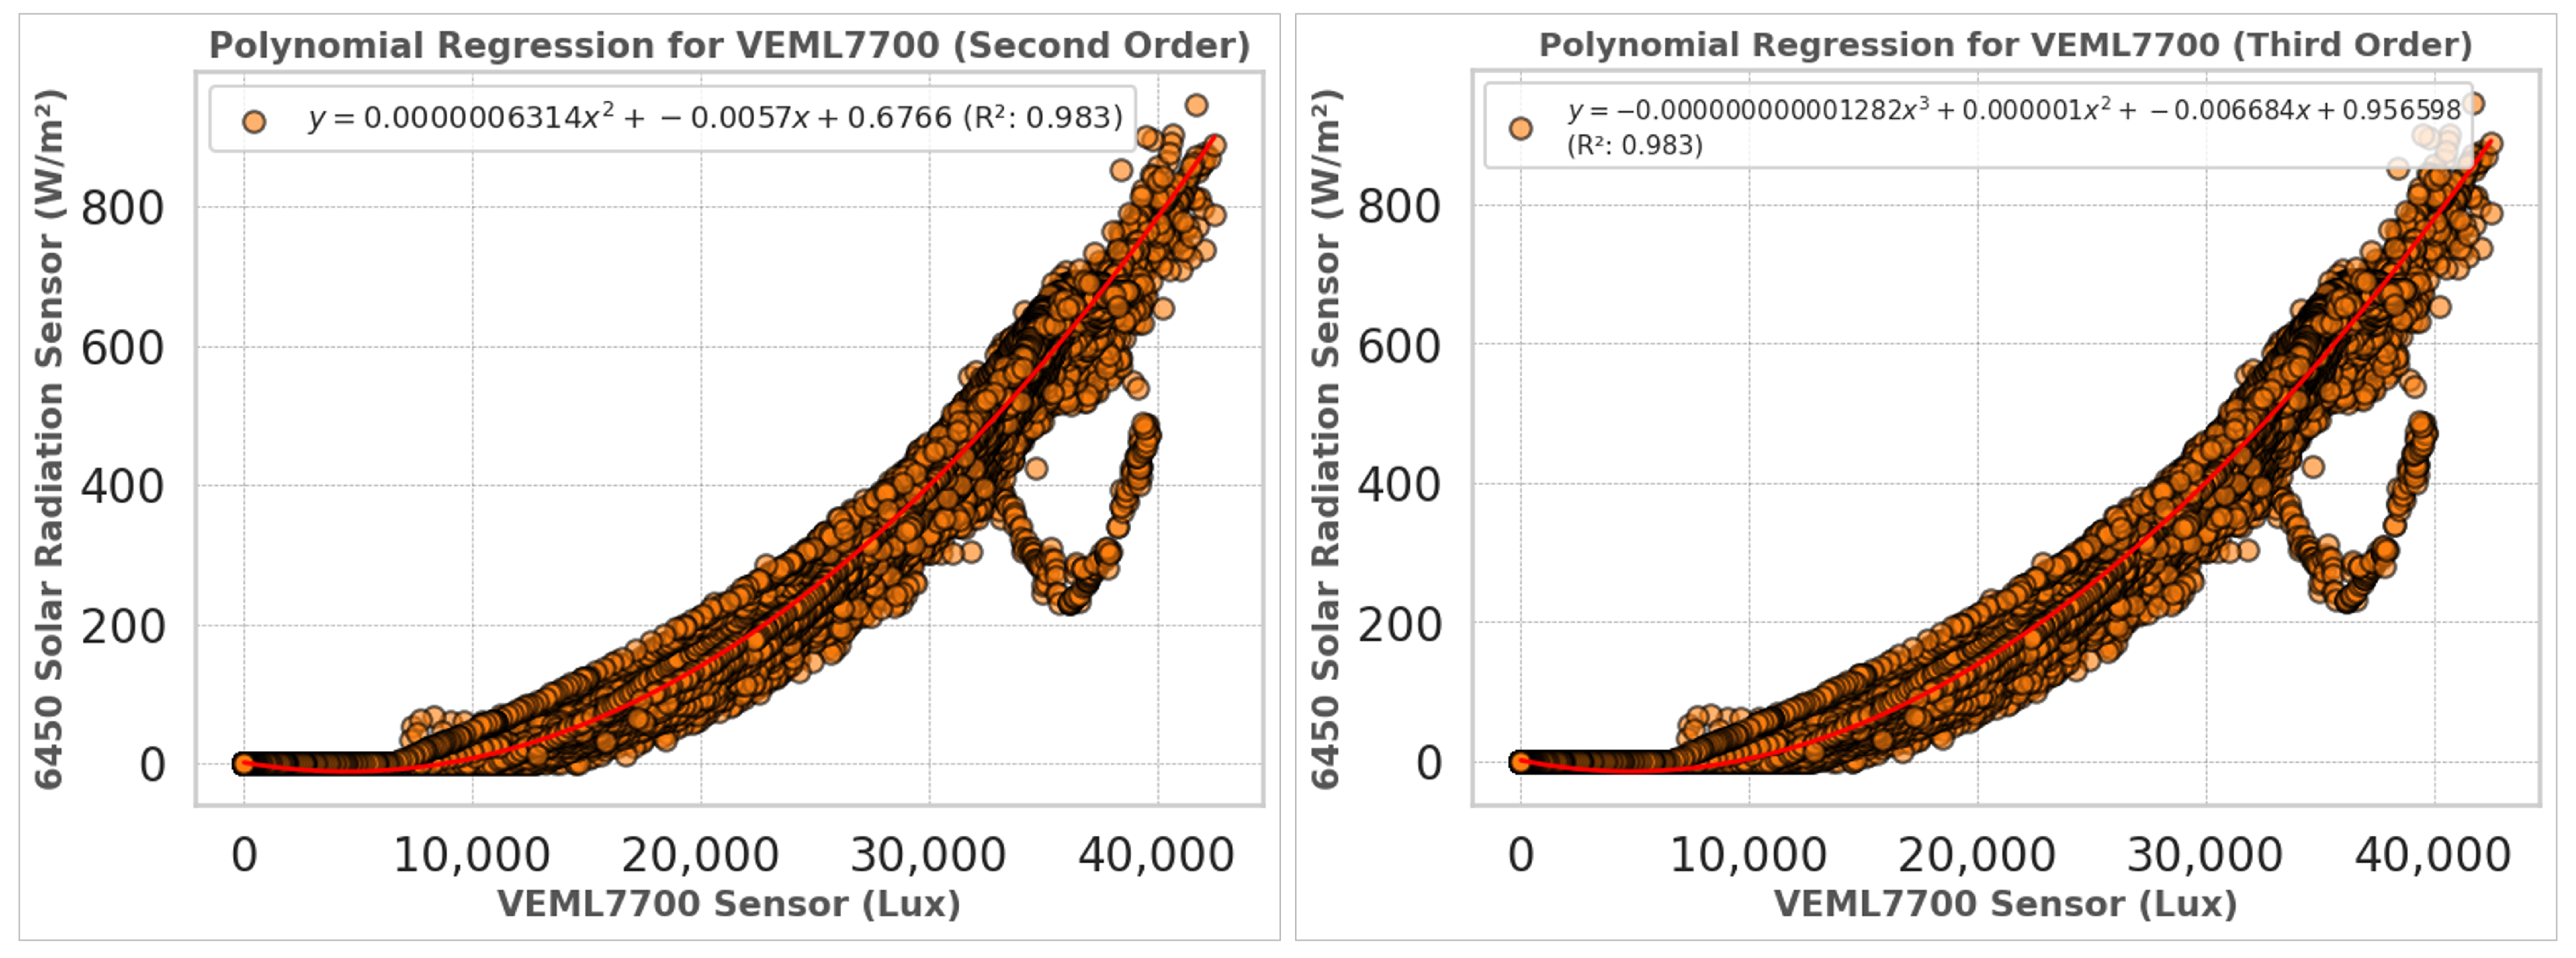
. Second-order and third-order polynomial regression models were employed to evaluate the relationships between variables in the data from the VEML7700 sensor and the 6450 solar radiation sensor. The left side of
Figure 20 displays the results of the second-order regression analysis. In contrast, the right side of
Figure 20 shows the results from applying the third-order regression model to the same dataset.
Figure 20 compares the second-order (left) and third-order (right) polynomial regressions that related the illuminance values from the VEML7700 sensor (measured in lux) to the solar irradiance readings from the Davis 6450 sensor (measured in W/m
2). Both models exhibited a strong correlation, with R approximately equal to 0.98, demonstrating that the illuminance data from the VEML7700 sensor could effectively estimate solar irradiance levels. The second-order polynomial regression effectively modeled the primary curvature of the data, providing a solid representation of the relationship. In contrast, the third-order polynomial introduced an additional term that accommodated more subtle variations within higher and lower illuminance ranges. While this approach could enhance the accuracy of the model, it is important to note that it also added to the complexity of the analysis.
Table 4 presents the polynomial equations and the MSE, MAE, and RMSE metrics for these models.
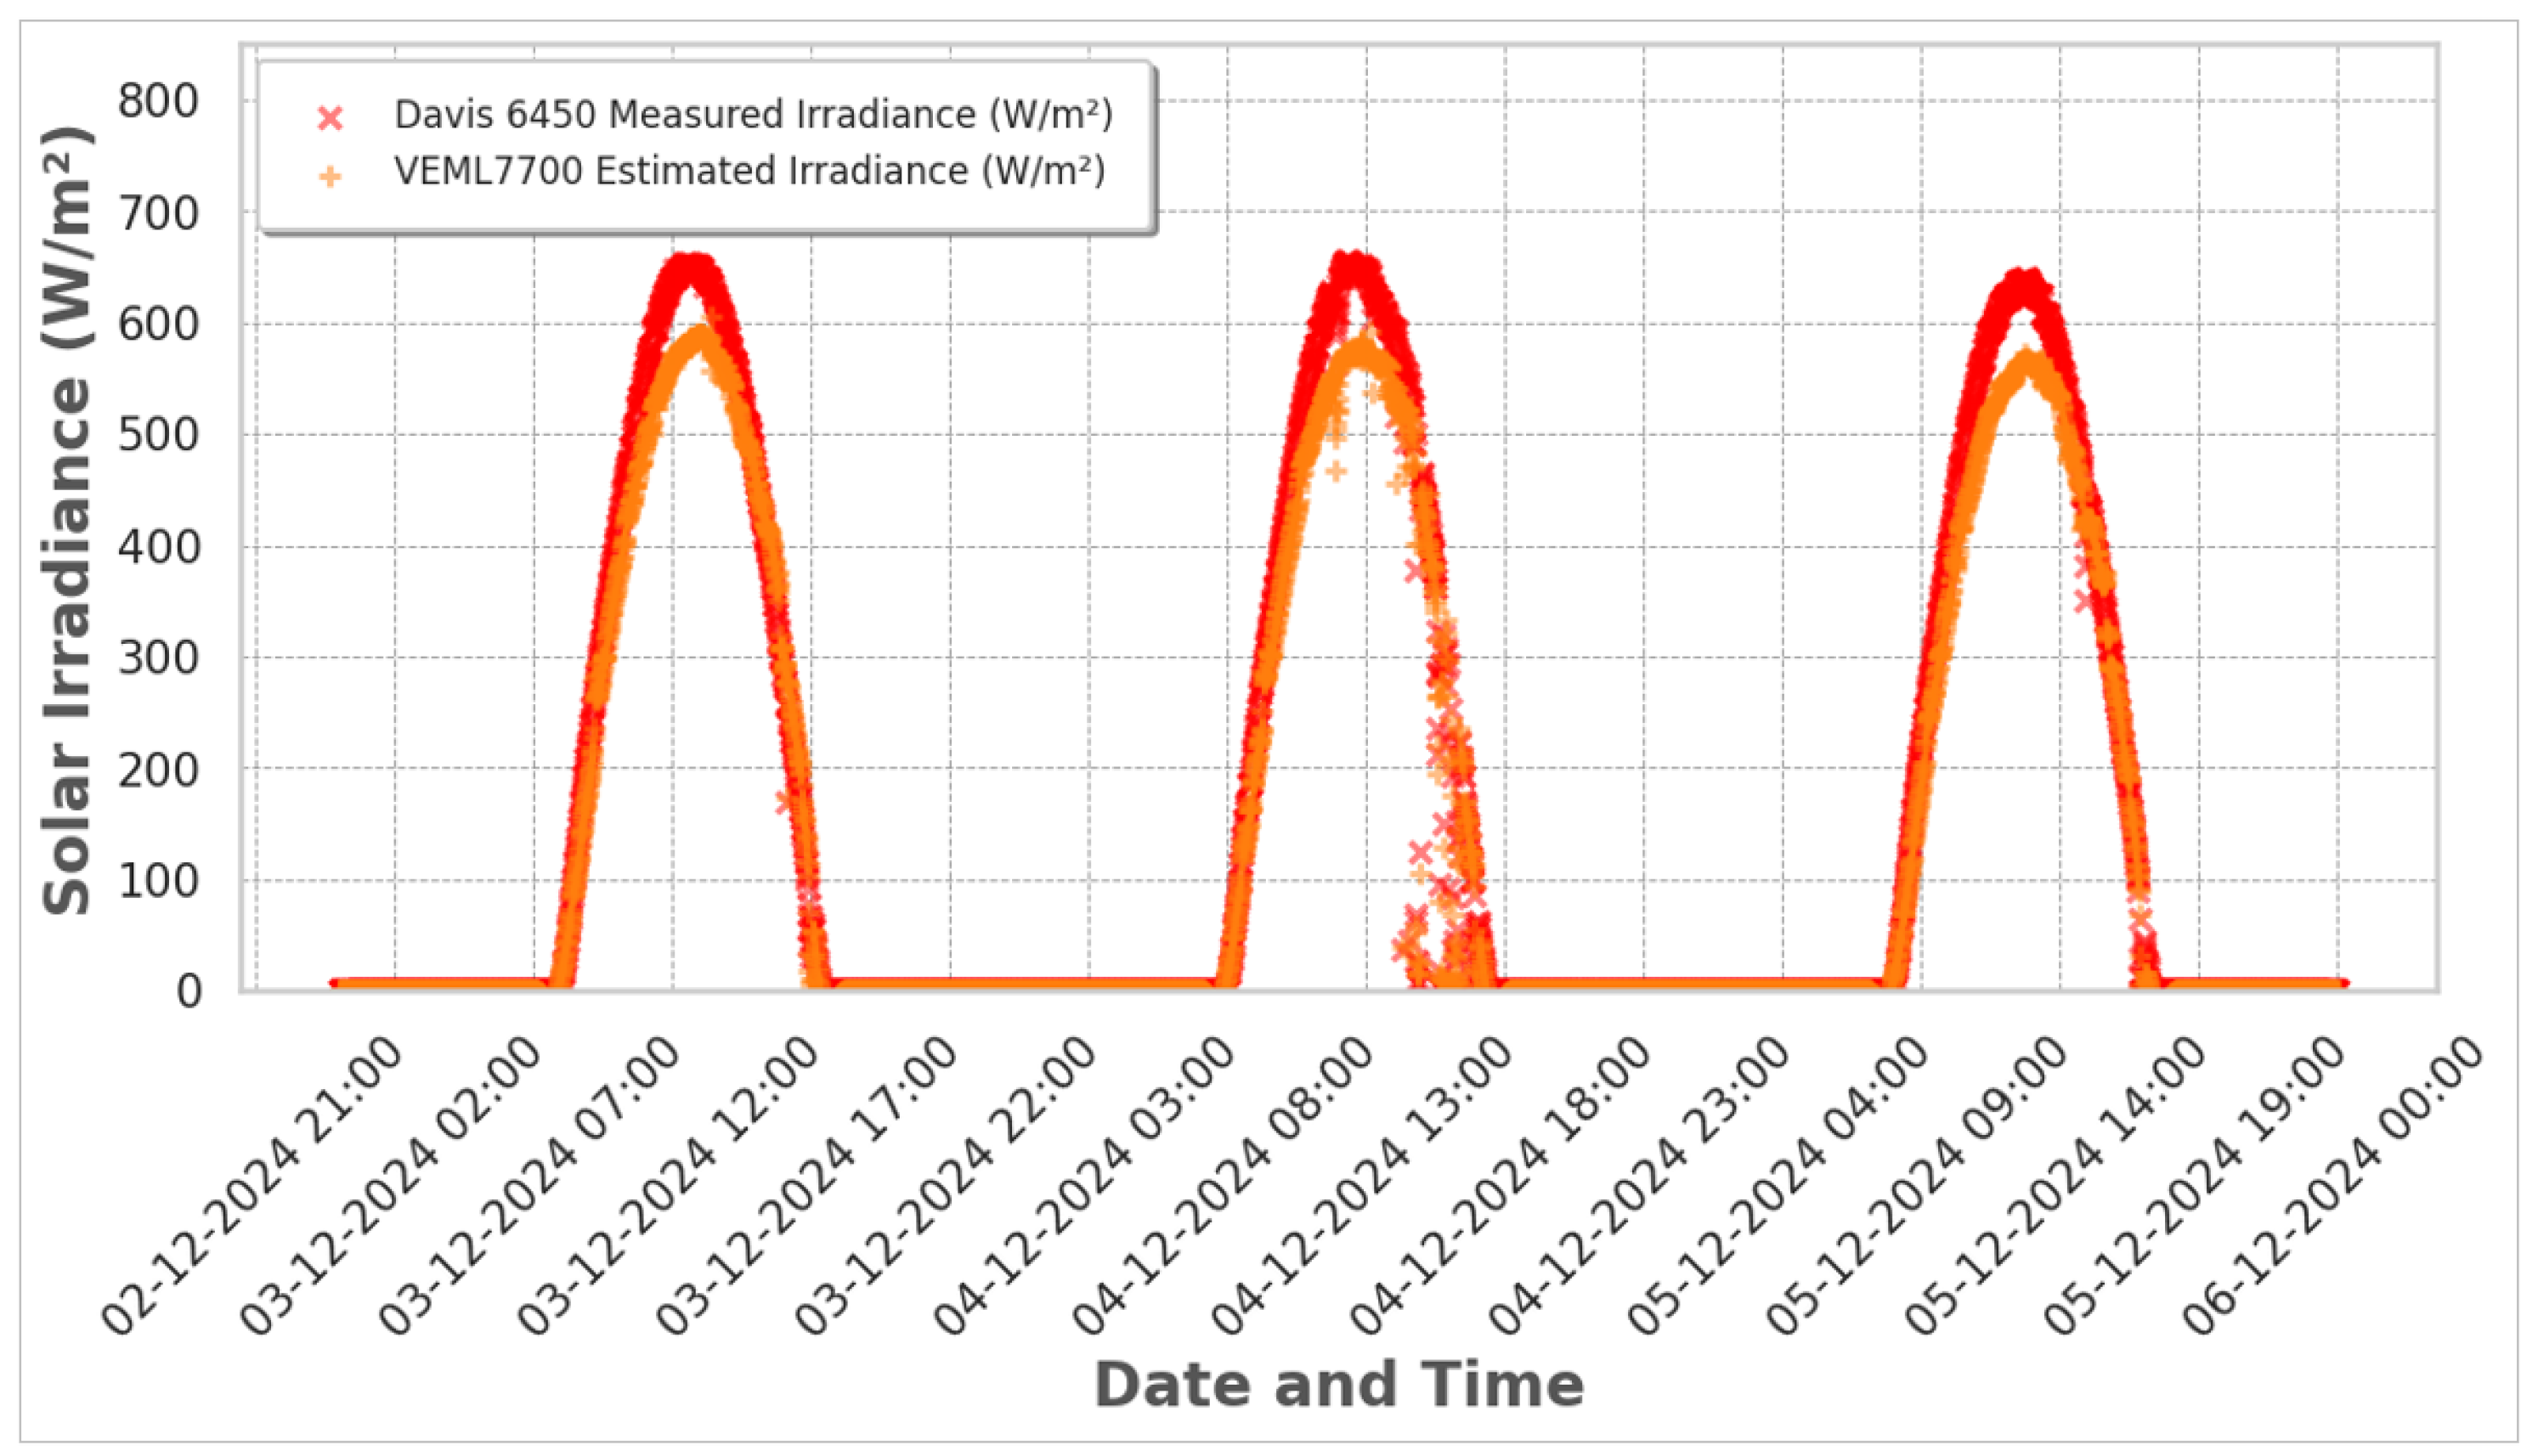
Figure 21 compares the solar irradiance values obtained from the Davis 6450 sensor over three days with the estimated irradiance derived from the VEML7700 sensor and direct radiation measurements. The measured data from the Davis 6450 sensor, represented by red crosses, served as the reference point. In contrast, the estimated values, depicted with orange plus signs, were calculated using the second-order regression provided in
Table 4. Similarly, the direct radiation values (indicated by green circles) served as an external benchmark to evaluate the accuracy and consistency of the Davis 6450 sensor and the VEML7700-derived estimations.
In contrast to the relationship observed between the BH1750 and Davis 6450,
Figure 21 illustrates a smaller temporal gap between the VEML7700 sensor and the Davis 6450 across the three datasets. This reduced discrepancy could be attributed to the VEML7700 sensor’s rapid update rate, which was more closely aligned with the Davis 6450 (4.8 s), thereby minimizing the temporal offset observed in their measurements.
4.5. ML Approach
This section presents the machine learning methods that modeled the relationship between measured illuminance and solar irradiance. Multiple linear regression (MLR) was used as a baseline to evaluate the effectiveness of simple, interpretable models in capturing irradiance dynamics.
The datasets employed in this study consisted of structured tabular data gathered at consistent intervals from light and environmental sensors. Given the nature of the data, we chose to implement supervised regression models, which were the most suitable approach for our analysis.
Moreover, emphasis was placed on designing a predictive model that could be efficiently implemented in microcontroller-based systems for the real-time estimation of solar irradiance. With this in mind, the selected machine learning models—RF and SVM regression—were chosen for their balance between predictive performance and computational feasibility. All models were trained using the same input features (illuminance, temperature, and relative humidity), selected based on the correlation analysis described in
Section 4.2.
4.6. Multiple Linear Regression
The ML approach was designed to estimate solar irradiance by leveraging illuminance and environmental data, with feature selection based on the correlation analysis (see
Figure 16). According to the correlation matrix, the illuminance values from the BH1750 and VEML7700 sensors exhibited a strong correlation with the solar irradiance measured by the Davis 6450 sensor (
and
, respectively), indicating their significant predictive potential. Additionally, temperature (
) and relative humidity (
) showed moderate correlations with irradiance, suggesting their potential influence in refining the model’s accuracy by accounting for environmental variability.
Based on these insights, the selected features—illuminance, temperature, and humidity—were preprocessed. The Davis 6450 sensor data were used as the target variable to train and evaluate the predictive model, aiming to achieve a generalizable conversion from illuminance to solar irradiance across varying conditions.
The dataset was split into training (80%) and testing (20%) subsets to validate the model’s performance. An MLR model was applied to establish the relationship between the selected variables and solar irradiance, following the equation
where
During the training phase, the model estimated the regression coefficients by minimizing the MSE to achieve the best possible fit. The performance of the model was assessed using key evaluation metrics such as the
, MSE, and MAE. In this way, the results are depicted in
Table 5.
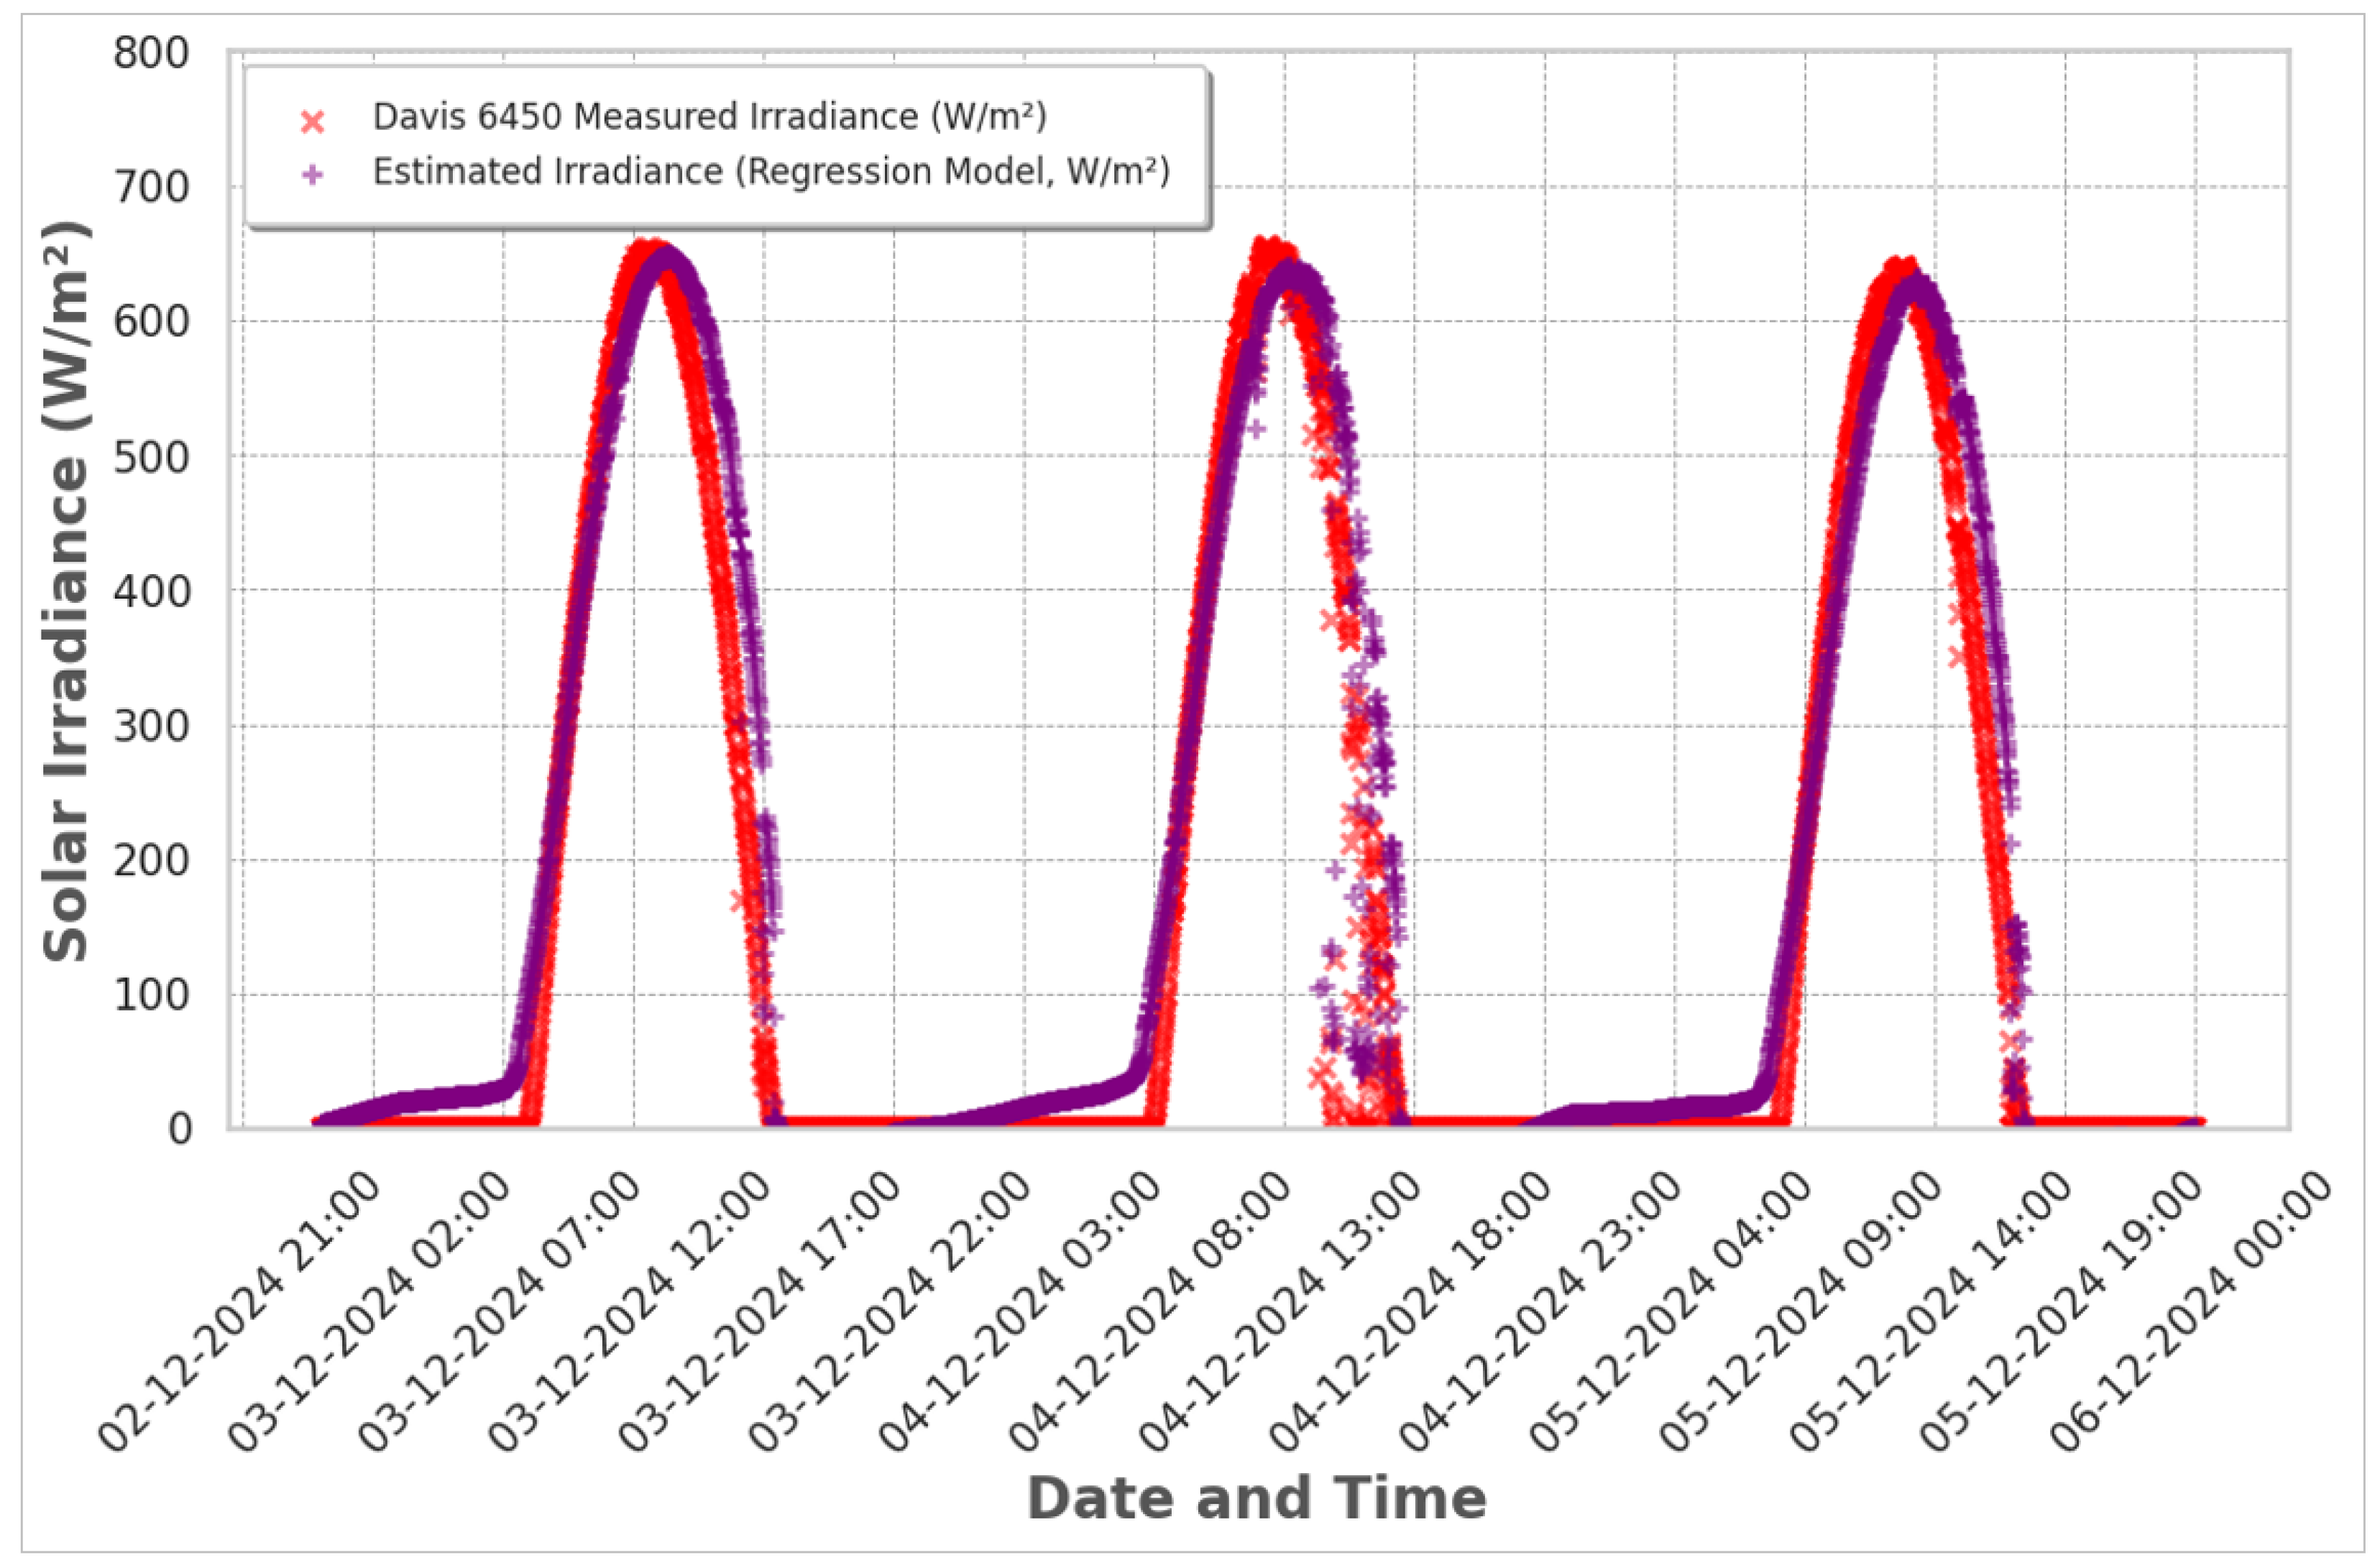
Therefore, Equation (
6) was employed to estimate irradiance along with the coefficients obtained from the ML approach. This method incorporated the illuminance values recorded by the BH1750 and VEML7700 sensors and relevant environmental parameters such as temperature and relative humidity.
Figure 22 shows that the estimated irradiance (represented by purple plus signs) closely followed the measured irradiance values (depicted by red crosses) across the three-day period.
Moreover,
Figure 22 indicates that the ML-based approach using illuminance data (BH1750/VEML7700) and temperature and relative humidity could capture the overall daily irradiance pattern. While there were minor discrepancies around the midday peaks, the estimated model followed the general shape and magnitude of the measured data.
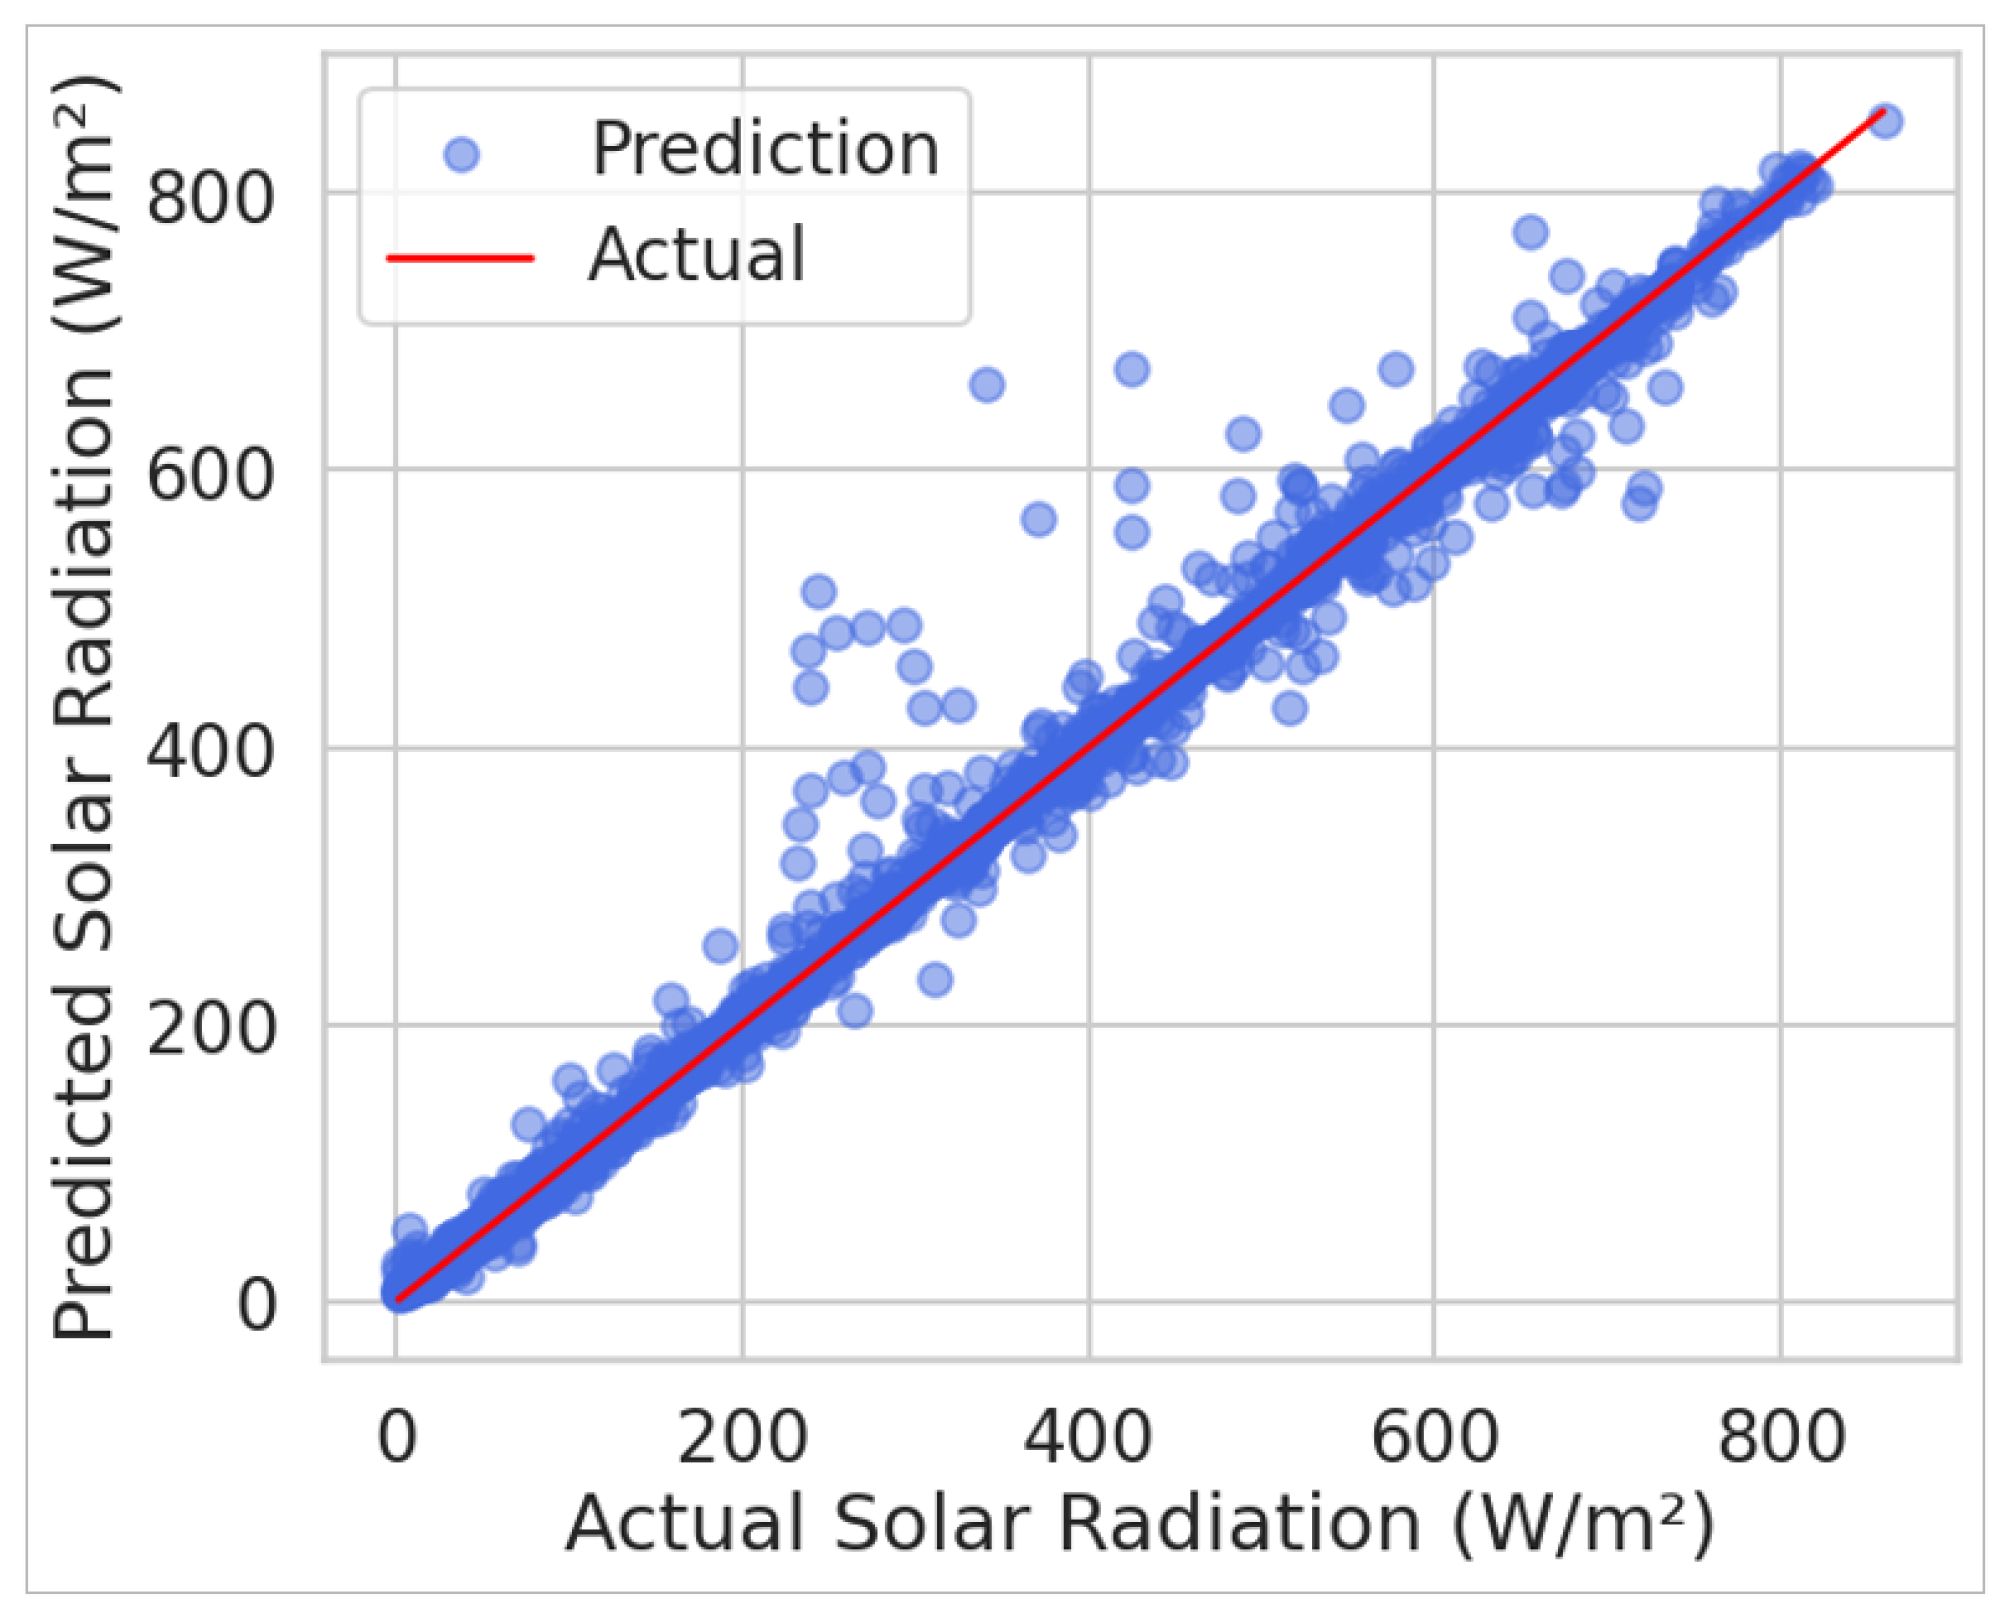
4.7. Random Forest Regression
For the RFR model, 100 estimators were configured using default hyperparameters. All data points with zero irradiance were removed before training to focus exclusively on solar activity. The model was trained on 80% of the dataset and tested on the remaining 20%. The performance metrics are summarized in
Table 6.
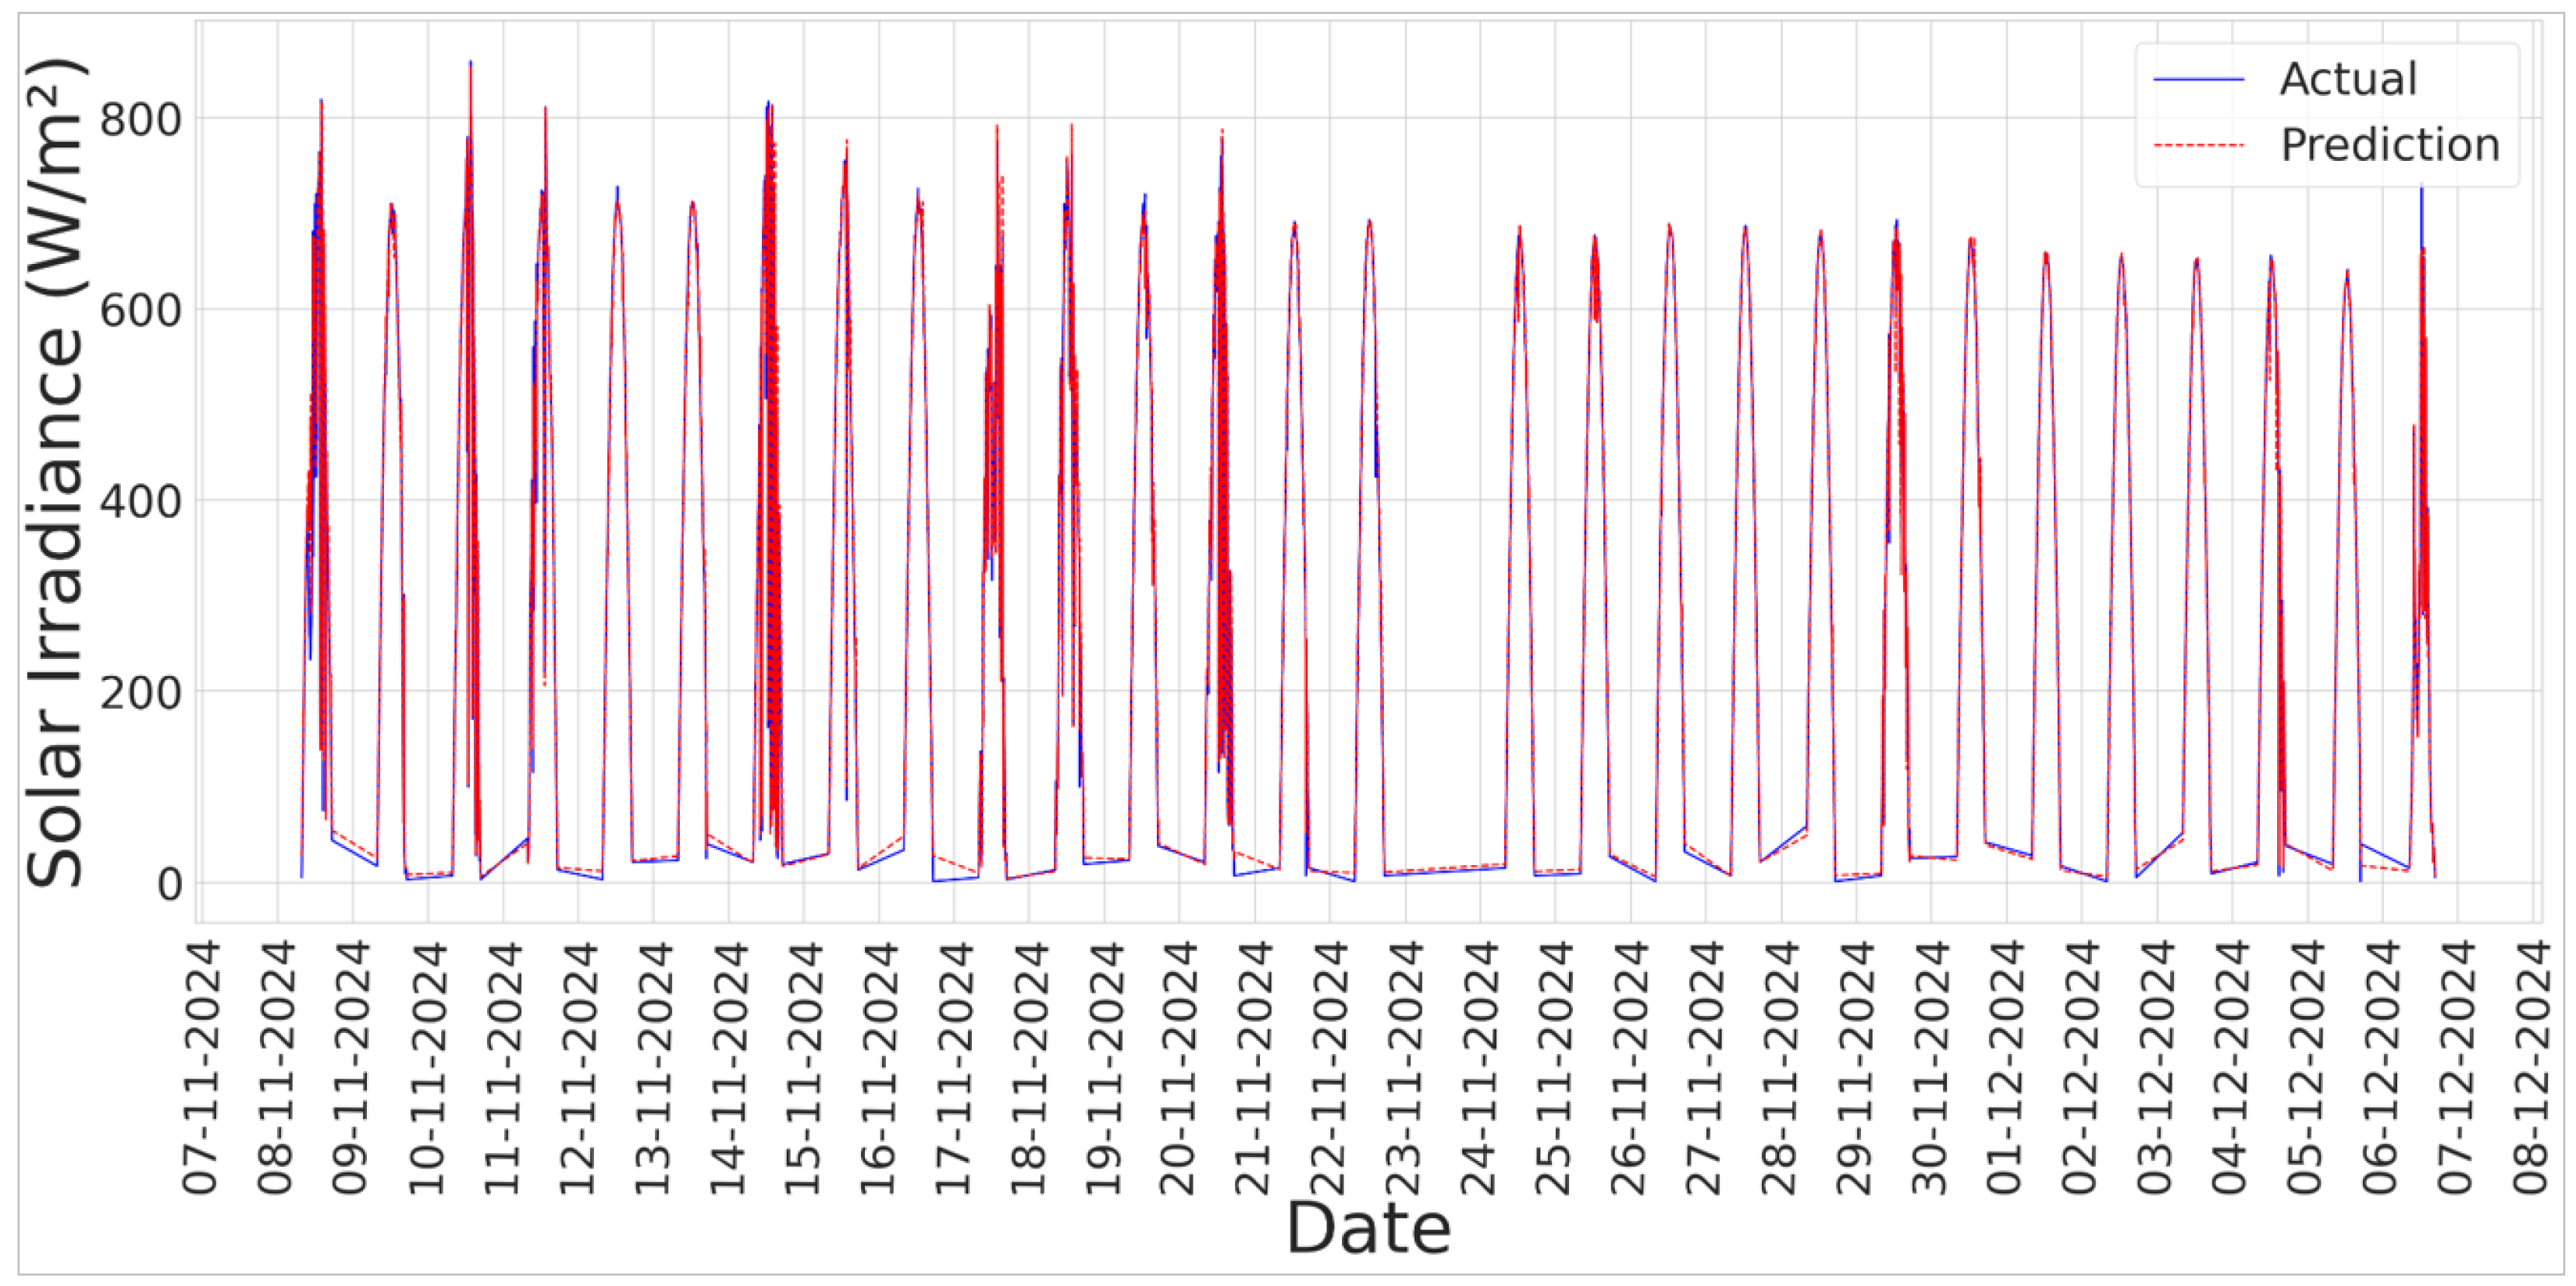
Figure 23 depicts the regression performance of the RFR model.
Figure 24 compares the actual solar irradiance measurements with the values predicted by the RF model over a representative time period.
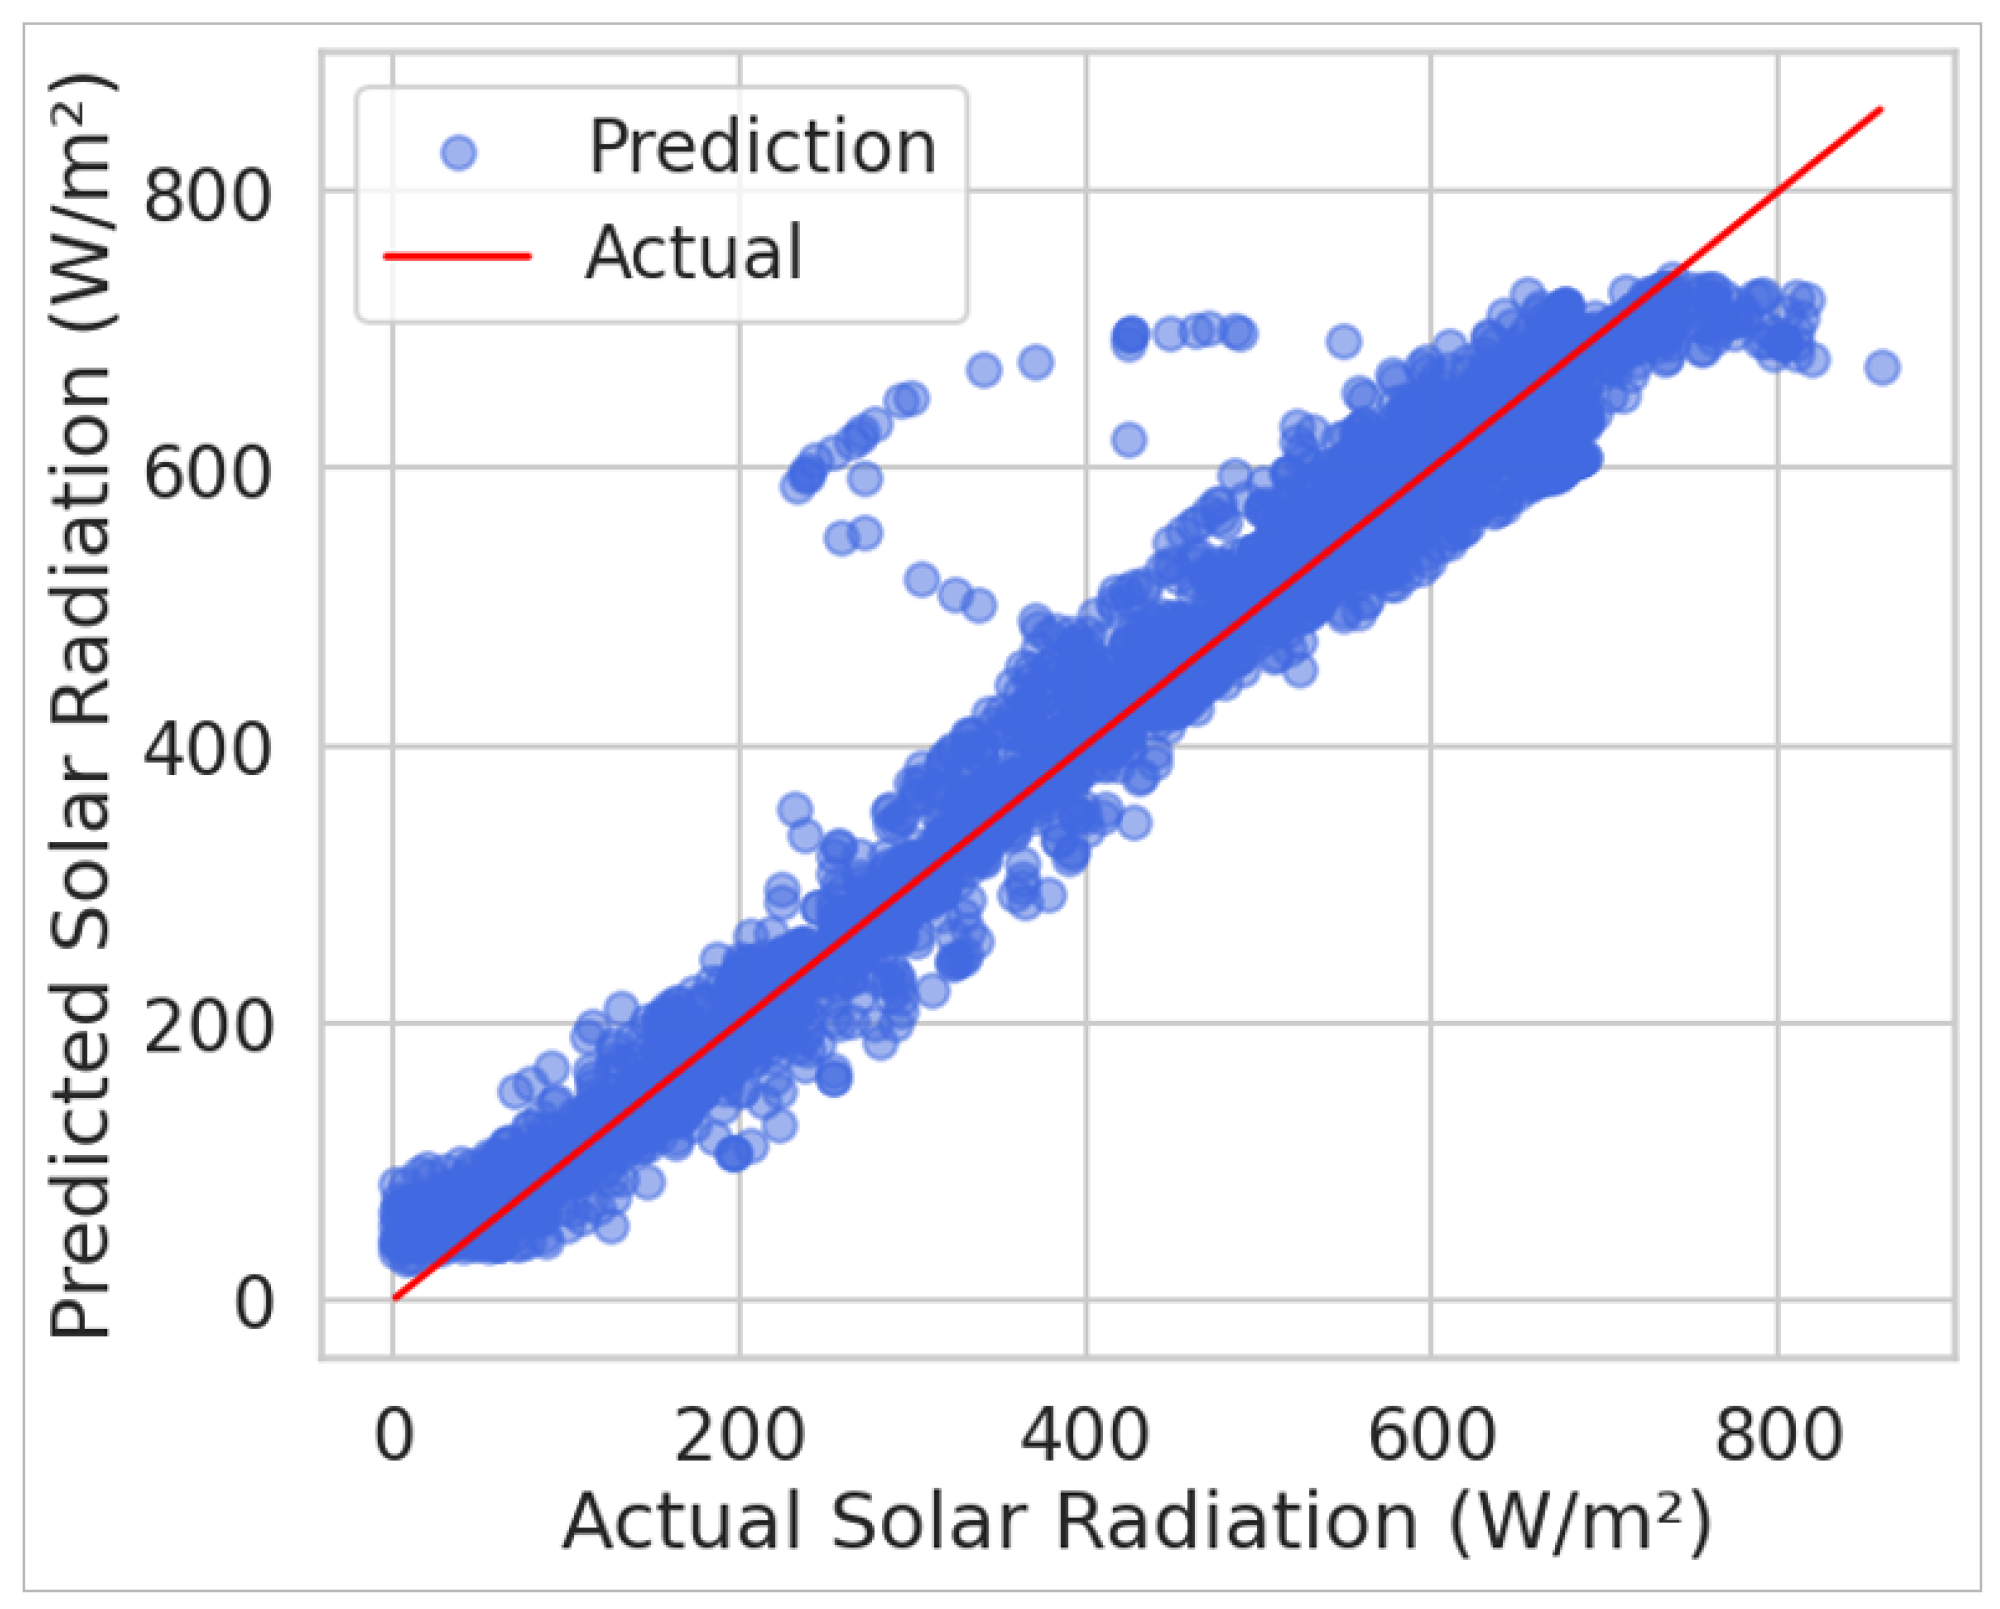
4.8. Suported Vector Regression
For the SVR model, the standard hyperparameters were employed with the radial basis function (RBF) kernel. Similar to the RF regression model, all data points exhibiting zero irradiance were excluded prior to training to concentrate only on solar activity. The input features underwent standardization through z-score normalization. The performance metrics are detailed in
Table 7.
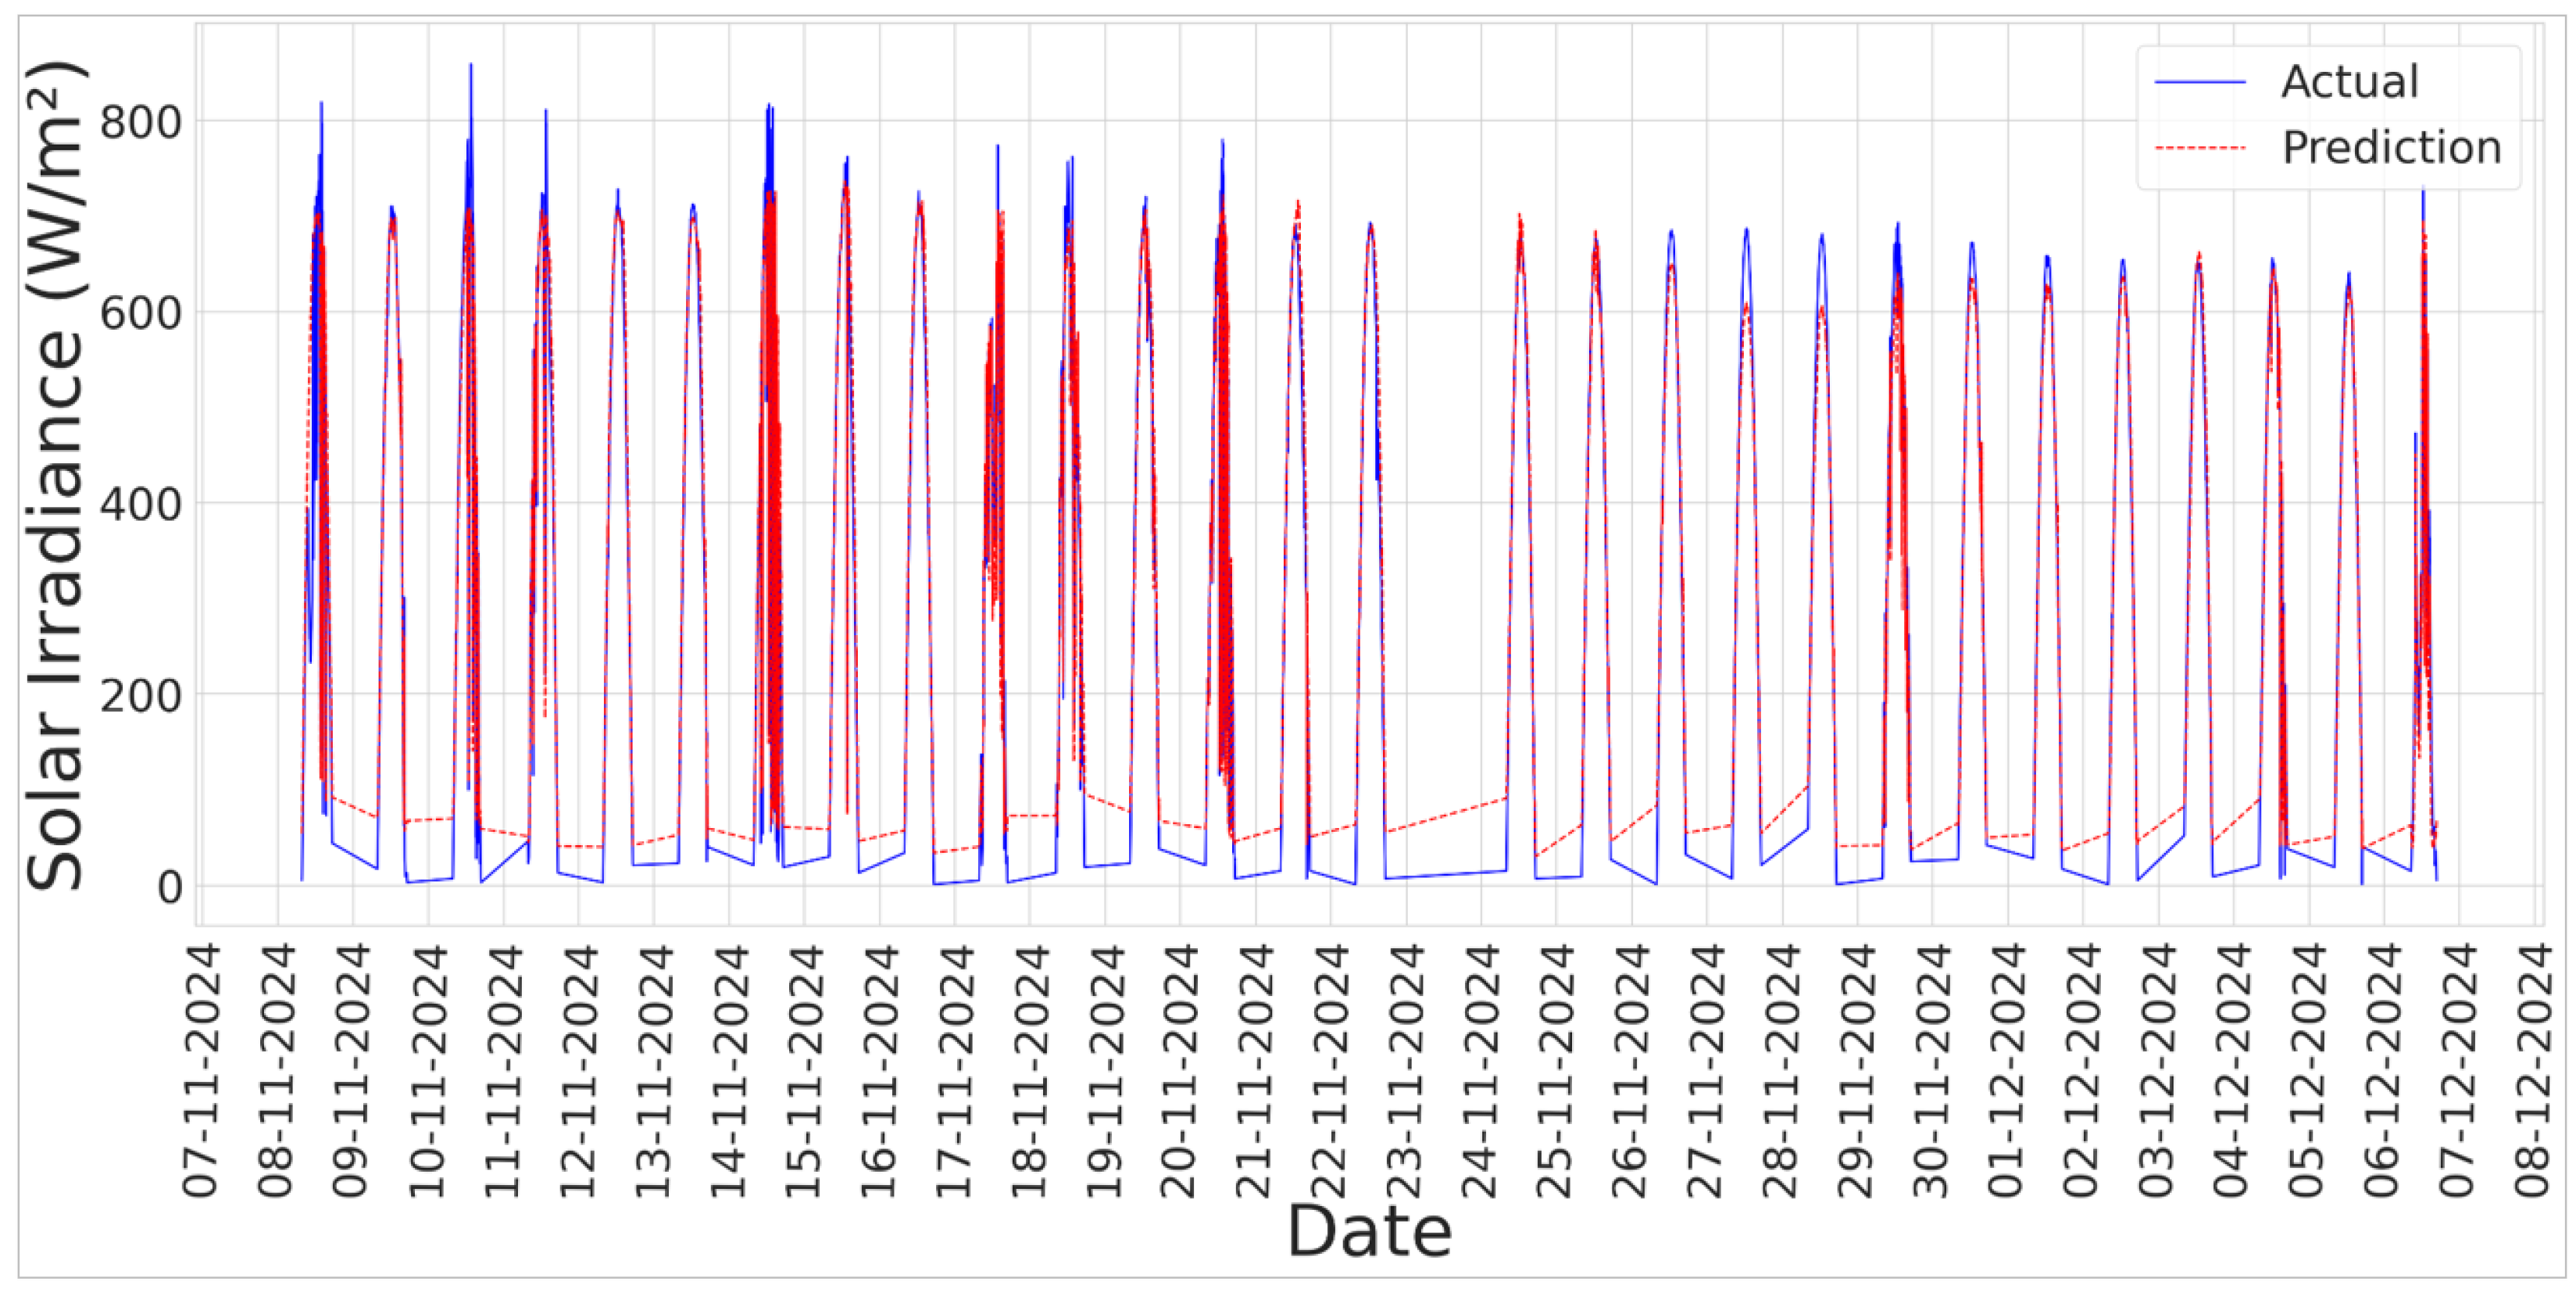
Figure 25 depicts the regression performance of the suported vector regression model.
Figure 26 compares the actual solar irradiance measurements with the values predicted by the SVR model over a representative time period.
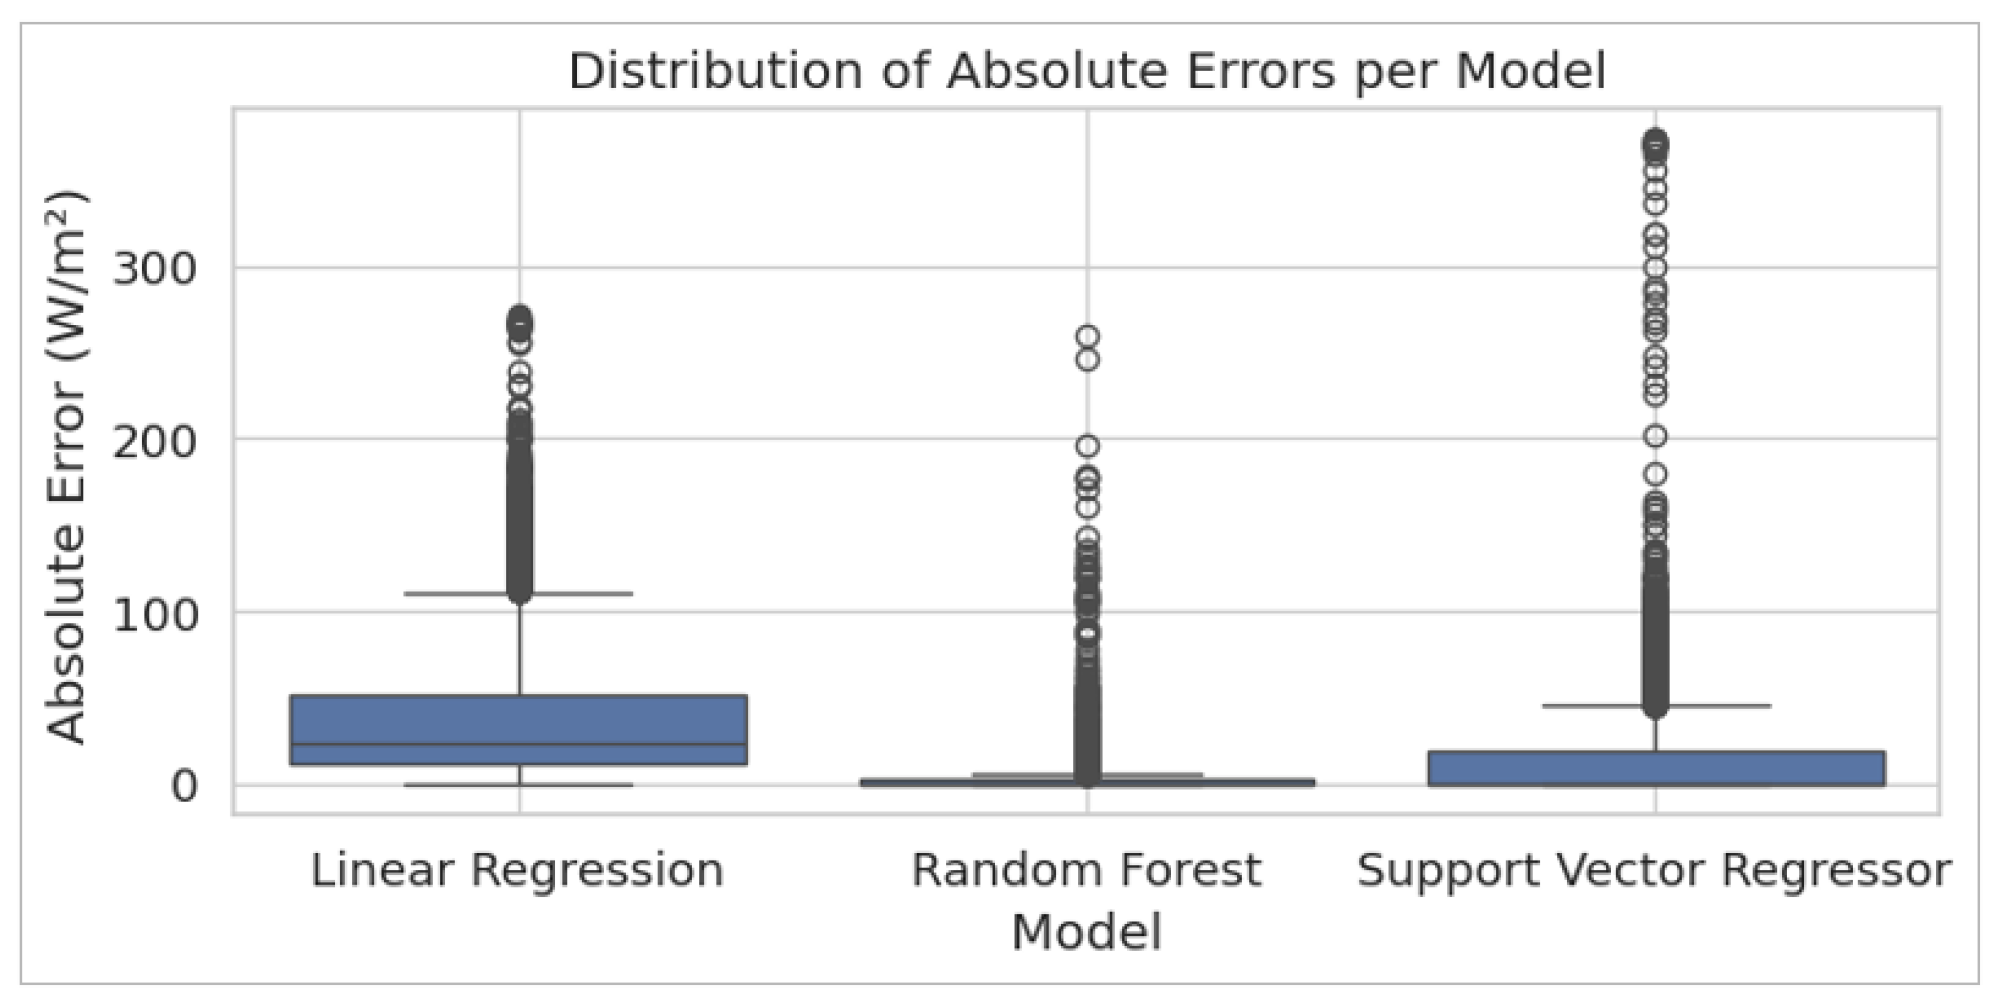
A one-way analysis of variance (ANOVA) was applied to the absolute prediction errors to assess the performance differences among the evaluated models. The results showed a highly significant difference between the models (F = 997.4,
p < 0.0001), indicating that not all models performed equally.
Figure 27 presents a box plot of the absolute errors. RF exhibited the lowest error variability and mean, followed by SVR, while linear regression showed the highest prediction error among the three.
5. Discussion
This section compares recent works on solar irradiance forecasting to contextualize the proposed approach’s performance.
Table 8 summarizes selected studies, highlighting the forecasting methods used, the input variables considered, and the corresponding performance metrics such as R
2, RMSE, and MAE.
Table 8 shows a notable deviation between the fixed conversion factor proposed in [
28] and the results obtained in this work. The linear regression model yielded a conversion equation of the form
, which corresponded to an approximate conversion factor of
. This value significantly differed from the
ratio used in their study, suggesting that a universal constant may not be appropriate for all sensors or environmental conditions. The discrepancy likely arose from sensor-specific characteristics, such as spectral sensitivity and measurement range, as well as the influence of contextual factors like temperature, humidity, and incident light angle.
Furthermore, polynomial regression models provided an improved fit over the linear approach. For instance, second- and third-degree models applied to the VEML7700 sensor data achieved higher determination coefficients () and substantially lower error values () compared to the BH1750 linear model (, ). These results reinforce the idea that incorporating nonlinear relationships through calibrated models yields more accurate irradiance estimations than relying on fixed, general-purpose conversion factors.
According to [
7], an optimized random forest model achieved an
of 0.95 using sunshine hours, temperature, humidity, and pressure. In comparison, our approach relied on ambient light data and essential weather variables (temperature and humidity), reaching an
and
. While these results are promising, they are based on a relatively limited dataset collected under specific environmental conditions, which may affect generalizability. Moreover, light sensors like the BH1750 and VEML7700 are sensitive to incident angle, enclosure interference, and spectral mismatch compared to standard irradiance sensors, which may introduce bias in real-world applications.
The authors of [
22] reported high accuracy (
,
) using a hybrid approach of XGBoost, Extra Trees, and Gradient-Boosting, supported by high-resolution radiation data (GHI, DHI, GTI) and comprehensive meteorological variables. Although more complex, such models benefit from richer data sources that are not always available in all settings. In our case, weather variables were obtained via an external API. This could introduce discrepancies due to location granularity or interpolation errors, particularly in microclimates or areas with rapid weather changes.
Similarly, ref. [
23] used a hybrid RF + LSTM model incorporating a broad range of features, achieving
and
. While their approach offers strong performance, it requires more computational resources and a more extensive feature set. In contrast, our method aims to provide a practical, low-cost, and moderately accurate solution using readily available sensors and simpler models. Although the results are encouraging, further testing with larger, more diverse datasets and improved sensor calibration would be necessary to validate its robustness across different environments.
6. Conclusions and Future Work
This study explored the feasibility of estimating solar irradiance using low-cost ambient light sensors (BH1750 and VEML7700) in combination with basic meteorological data retrieved via an external API. Applying classical regression techniques, including linear, polynomial, and ML models, enabled reasonably high predictive accuracy, mainly when sensor calibration was performed using nonlinear models. The results demonstrate that ambient light sensors, when appropriately modeled, can serve as practical proxies for solar radiation measurement, offering an accessible alternative to more expensive pyranometers or weather stations.
Furthermore, assessing how model error varies under different irradiance conditions and how cloudy days might modify the model is essential. Moreover, the highest radiation levels occurred during the summer station at Ojo Caliente, Zacatecas. However, the measurements were captured during the last autumn; future works plan to enhance the model by incorporating summer data and data for the whole year, enabling us to analyze in a better way the influence of higher irradiance and cloudy days on model performance and error variability. This additional analysis is expected to further improve the robustness and accuracy of our irradiance estimations across a broader range of lighting conditions.
Our current study was based on data from a single station and conducted under controlled conditions with minimal connectivity issues. Future works plan to expand our study by incorporating additional stations with diverse climatic and geographic conditions to improve the model’s generalizability, applicability, and reliability across varied settings. Furthermore, future work will consider integrating data acquisition strategies to address network stability challenges and data loss, thereby enhancing the overall robustness of the system.
Finally, the findings suggest that when combined with appropriate data processing and ML techniques, low-cost sensors can provide an effective and cost-efficient solution for estimating solar irradiance in applications such as renewable energy monitoring and agricultural management. Future work should focus on expanding the dataset to include diverse environmental conditions and optimizing the models for real-time applications.


 ,
, 


