1. Introduction
One of the most widely used methods for predicting rating values in recommender systems (RecSys) is undoubtedly Collaborative Filtering (CF). This method relies on the item ratings provided by users who are (very) close to the active user (AU), and which are termed as near neighbors (NNs). Initially, a typical CF algorithm produces rating predictions for the products that the AU has not evaluated yet. Finally, the product(s) that accomplish the highest rating prediction numeric scores are suggested to the AU, since they are more likely to be accepted by him. As a result, the smaller deviation these product predictions have to the actual ratings, the more effective the CF RecSys is considered to be [
1,
2,
3,
4].
Typically, a RecSys will recommend the item(s) having the highest rating prediction(s). For example, if, for the user AU, two products, p1 and p2, with respective rating predictions pr1 = 4.85/5 and pr2 = 4.75/5, are recommendation candidates, and only one needs to be recommended, a typical CF RecSys will opt for recommending product p1 to AU, since its higher prediction score indicates increased chances of acceptance by user AU.
However, in this standard recommendation formulation process, information on the rating prediction calculation is not sufficiently exploited. In particular, even though a typical CF RecSys computes complementary information for each rating prediction (for example, the cardinality of the set of NNs that participated in each product’s rating prediction calculation) this information is not considered during the recommendation process. If, for example, the computation of pr1 is based on only two of AU’s NNs, while the computation of pr2 is based on thirty AU’s NNs, there is reasonable ground to recommend product p2 rather than p1 to the AU, since both products achieve very high rating prediction scores, while pr2 additionally seems a safer choice, due to the fact that it is supported by a significantly larger number of NNs. Since the standard recommendation formulation process does not take into account these aspects, recommendations offered to users include in many cases choices that are not “safe”, and these choices often lead to increased error levels [
5,
6].
Rating prediction confidence factors, related to CF prediction accuracy, have been explored recently [
5,
6]. These papers indicate that (1) the NN cardinality participated in the rating prediction computation, (2) the mean rating arithmetic value of the product considered for recommendation, and (3) the arithmetic mean of the ratings entered by a particular user AU, are directly related to the accuracy of rating predictions in CF RecSys.
These findings give CF RecSys the ability to extend their recommendation formulation strategy, giving precedence to items which may achieve lower rating prediction values, but on the other hand, these predictions exhibit higher confidence. Such an extended recommendation formulation strategy may lead to elevated recommendation quality for the CF RecSys. However, the work in [
5] only establishes that the three aforementioned factors can be used to reliably assess the accuracy of a prediction, whereas the work in [
6] elaborates on the utility of the three factors in dense datasets. Neither of these works proposes or evaluates a recommendation formulation algorithm. The work in [
7] introduces an algorithm that prunes the list of items that are candidate for recommendation, based on the confidence factors of the related predictions. This approach improves recommendation accuracy and the mean real rating value for the recommended items. However, it substantially decreases the recommendation coverage, i.e., the percentage of users for whom a personalized recommendation can be formulated, and is thus inapplicable to sparse datasets, while it decreases personalization capabilities in dense datasets. The work in [
8] tackles this shortcoming, which allows more candidate items to participate in the recommendation. Nevertheless, this algorithm formulates rating prediction classes based solely on the rating prediction value. These classes are then considered under a strict order, leading to a scheme where confidence factors are underutilized, since they are used only as tie-breakers within rating prediction classes. Therefore, in some cases, rating predictions with very high confidence, and high prediction value may be superseded by predictions with low confidence and marginally higher prediction value. To the best of the authors’ knowledge, there is no other work that includes the concept of prediction confidence factors, which is a very recent concept, having been proposed in 2022.
In this paper, we introduce an advanced CF recommendation algorithm that boosts the quality of the recommendations by extending the range of criteria considered for recommendation formulation to include not only the rating prediction arithmetic value of the items produced by the CF algorithm, but also the confidence factors that each rating prediction fulfills. More specifically, the presented algorithm fuses two characteristics of rating predictions, (a) the rating prediction value and (b) the number of confidence factors that the rating prediction satisfies, into a single recommendation score for each item. This is performed by using a weighted average formula, where weight values represent the importance of each component. The optimal weight values are determined experimentally. Finally, the algorithm recommends to the AU the item(s) that scored the highest final recommendation score. The presented algorithm improves recommendation quality and avoids coverage reduction, while at the same time, it can be applied in every CF RecSys dataset, since it is based only on the very basic CF information. Based on the algorithm’s application to commonly used RecSys datasets, the proposed algorithm significantly upgrades the recommendation quality, surpassing the performance of state-of-the-art research works that also consider the aforementioned prediction confidence factors.
The recommendation quality of the proposed algorithm is extensively evaluated under multiple parameters, using six CF datasets from diverse sources, two user similarity metrics, two NN selection methods, and three recommendation quality metrics, all commonly used in CF RecSys research, for generalizability of the results. Based on the output of this evaluation, the proposed algorithm has proven to significantly upgrade the recommendation quality, surpassing the performance of recent research works that also consider the aforementioned factors.
The rest of the paper is structured as follows: in
Section 2, contemporary related research is discussed. In
Section 3, we firstly summarize the prerequisites of this work concerning CF and confidence factors and, subsequently, we introduce the proposed advanced CF algorithm. In
Section 4, the experimental procedures for tuning and validating the proposed algorithm are presented. In
Section 5, the results that were presented in
Section 4 are discussed. Lastly,
Section 6 presents the conclusion and future research.
2. Related Work
CF recommendation quality is a subject that numerous works have been written on over the last 10 years.
The work in [
9] introduces a multi-level recommendation approach aimed at aiding users in decision-making by offering higher-quality recommendations. This method can be utilized across various online platforms that rely on CF RecSys, enhancing the overall user experience. The effectiveness of the approach is demonstrated through a comprehensive experimental evaluation, utilizing real-world datasets.
The work in [
10] introduces an incremental CF RecSys that is based on a weighted clustering method. This CF RecSys is designed to deliver successful recommendations with minimal computational cost. Furthermore, the cardinality of items and users in the rating database do not determine the complexity of the presented method, unlike existing incremental methods. As a result, this CF RecSys is well-suited for dynamic environments with large databases, where the available information changes rapidly (updates of existing ratings, inputs of new ratings, introduction of new items and users in the database, and so on).
The work in [
11] introduces a new similarity metric. The mathematical formulation is derived through two key contributions: (1) the translation of qualitative and intuitive conditions that the similarity metric must satisfy into relevant formulas, such as a linear and a nonlinear system of differential equations, and an integral equation; and (2) solution of these equations to produce the ultimate function of the similarity metric.
The work in [
12] introduces Relational CF to leverage multiple item relations in RecSys. This work identifies that both the relation value and the relation type are essential for predicting user preferences. To address this, it introduces a 2-level hierarchical attention algorithm for user preference modeling. In the first level, relation types are distinguished as more important. The second level focuses on specific relation values to assess the item contributions.
The work in [
13] presents a novel CF algorithm, which is based on user preference clustering to mitigate the effect of data sparsity. Initially, user groups are created, to differentiate users with varying preferences. Afterwards, based on the AU’s preferences, the NN set is derived from the relevant user group(s). Additionally, a new similarity metric is presented to more effectively compute the user vicinity, taking into account user preferences from both global and local perspectives.
The work in [
14] introduces a hybrid RecSys algorithm that combines content-based and user CF. This approach not only leverages the strengths of content filtering, but also enables CF for all items, especially those that have not been rated at all. These unrated items can still be filtered and recommended to users, helping to avoid the cold start problem. When the cardinality of rating levels and users increases, the user-rating data matrix in CF becomes denser, reducing sparsity and improving CF rating prediction accuracy. By integrating both these techniques, the overall system performance is significantly enhanced.
The work in [
15] introduces the Hybrid Neural CF algorithm, which integrates deep interaction modeling and deep learning techniques for RecSys that utilize a rating matrix. This work aggregates overall ratings from various external data sources, to address the cold start problem. This is achieved by using a multivariate rating system, which incorporates star ratings, sentiment scores derived from reviews, votes, likes, and other sources. Furthermore, the proposed algorithm tackles the identified challenges using four key modules: (a) the Neural Sentiment Classifier, (b) the Deep CF, (c) the Deep Multivariate Rating, and (d) the Hierarchical Product and User Attention modules.
The work in [
16] presents a hybrid CF algorithm which combines semantic and social recommendations. This approach includes two classification policies to significantly upgrade the recommendation quality. The presented algorithm initially applies the incremental K-means method to the users stored in the database and afterwards the KNN algorithm for new users is used.
The work in [
17] introduces CbDNCF, a Deep Neural CF model. Firstly, this model filters the dataset using a preprocessing layer, and then the cleaned data are trained using a classification layer. Afterwards, this model carries out the processes of feature extraction and highest rating prediction. The integration of Chimp functions into the deep neural classification layer enables the model to achieve optimal rating prediction results.
The work in [
18] introduces a deep learning model that enhances CF results in RecSys. It leverages the concept of reliability to improve the quality of predictions and recommendations by incorporating prediction errors (reliabilities) into the deep learning layers. The main concept of this model is to recommend items that not only have high predicted ratings, but are also deemed reliable. The proposed model is structured into three related stages (i) the reliability prediction stage, (ii) the error prediction stage, and (iii) the ratings prediction stage, each providing a different level of abstraction and involving a distinct learning process.
The work in [
19] presents a deep learning-based hybrid algorithm which recommends web services by combining textual content with CF. The interaction between web service functionalities and mashups is seamlessly integrated into a deep neural network, enabling the model to capture the complex relationships between web services mashups, within a sparse interaction matrix.
The work in [
20] introduces an item-based CF model, namely DeepICF, which considers the higher-order and nonlinear relationships between products. Rather than considering only the similarity between two products, the model includes the interaction among all pairs of products using nonlinear neural networks. This allows for effectively capturing the higher-order relationships between products, revealing more complex influences on user decision-making.
The work in [
21] introduces LDCF, a deep location-aware CF algorithm for recommending web services, which maps service location features into high-dimensional dense embedding vectors. Furthermore, this algorithm includes a multilayer-perceptron, which captures the nonlinear and high-dimensional features. It also includes a similarity corrector that corrects the predictive QoS. As a result, the proposed algorithm can significantly overcome the data sparsity issue and learn the nonlinear and high-dimensional relations between services and users.
The work in [
22] proposes an enhanced CF approach by integrating production rules. It aims to address some limitations of traditional CF methods, such as sparsity and scalability, which help to improve the accuracy and efficiency of recommendations. Furthermore, this study explores how this hybrid approach can lead to more personalized and reliable suggestions, especially in complex datasets where conventional methods may struggle, while by using production rules, the proposed work effectively handles the intricacies of user–item interactions.
Some model-based approaches leverage trustworthiness or uncertainty concepts to improve recommendation accuracy. The work in [
23] explores the use of deep neural networks, to enhance the prediction reliability of RecSys. More specifically, it proposes a novel approach that incorporates deep neural networks to not only improve the prediction accuracy, but also to quantify the reliability of the predictions. By leveraging deep neural networks, this approach aims to provide more robust and trustworthy recommendations, particularly in scenarios where users’ preferences and behaviors are highly dynamic. Furthermore, it highlights the potential of deep learning techniques in addressing the inherent uncertainty and bias in recommendation models, thus improving user experience and decision-making. The work in [
24] proposes a novel approach to physician RecSys that integrates uncertainty-awareness using Bayesian deep learning. Traditional RecSys often overlooks the inherent uncertainty in user preferences and item quality, which can lead to suboptimal recommendations, especially in critical domains like healthcare. This work addresses this challenge by developing a Bayesian deep RecSys that not only provides personalized recommendations, but also quantifies the uncertainty associated with each recommendation. This uncertainty-aware framework is particularly important in the medical field, where the stakes are high, and users (patients) need reliable suggestions for selecting physicians. By incorporating uncertainty into the recommendation process, the proposed approach can provide more trustworthy and informed choices, thereby enhancing the user experience and improving decision-making in healthcare contexts.
The work in [
25] investigates the role of trust in improving the performance of RecSys, specifically through the use of the Naive Bayes classifier. To address inaccurate suggestions and cold-start problems, it proposes integrating trust metrics into the recommendation process, which helps prioritize reliable and relevant information. By employing the Naive Bayes classifier, it classifies and predicts user preferences, while considering trustworthiness in user–item interactions. Furthermore, this work demonstrates how incorporating trust can enhance recommendation accuracy, reduce the impact of biased or unreliable data, and finally lead to more personalized and trustworthy recommendations.
The work in [
26] proposes a novel approach to improving the stability of CF-based RecSys. To address the issue of instability in recommendations, it introduces a bio-inspired clustering ensemble method that combines multiple clustering techniques to enhance the consistency and reliability of recommendations. By leveraging the principles of biological systems, such as diversity and cooperation, the proposed approach helps in refining the recommendation process, ensuring that the system remains robust to changes in user preferences and data dynamics. Furthermore, this work demonstrates that the presented bio-inspired approach leads to more stable, accurate, and personalized recommendations, ultimately improving the user experience.
The data on which RecSys are based may entail inaccuracies, noise or outliers, leading to the demotion of the quality of recommendations. The work in [
27] addresses the challenges of improving the robustness of CF RecSys, particularly in the presence of noisy or incomplete data. Traditional CF methods often struggle with accuracy and reliability when the data are sparse or when malicious users can manipulate the RecSys. To overcome these issues, this work proposes incorporating user–item–trust records into the recommendation process. By considering trust relationships between users and items, the proposed method aims to enhance the robustness of the recommendations, allowing the RecSys to provide more reliable suggestions, even when faced with uncertain or deceptive data. Furthermore, this work indicates that leveraging trust records helps mitigate the impact of noise and improves the overall performance of CF systems, leading to more accurate and trustworthy user recommendations. The work in [
28] introduces a novel approach to enhance the robustness of neural graph-based CF models. While these models have shown promise in providing personalized recommendations by capturing the complex relationships between users and items in a graph structure, they are often vulnerable to noise and perturbations in real-world data. To address this, this work introduces two key techniques: structure denoising and embedding perturbation. Structure denoising aims to remove irrelevant or noisy connections in the user–item graph, while embedding perturbation helps to regularize the learned embeddings, improving generalization and robustness. Furthermore, it demonstrates that these strategies significantly enhance the performance and stability of neural graph-based CF models, enabling them to provide more accurate and reliable recommendations in the presence of noisy or incomplete data.
Recommendation validity is also threatened by attacks, through which malicious users attempt to manipulate results, either increasing or decreasing the likelihood that certain items appear in the recommendations offered to the users (“boosting” or “nuking” attacks, respectively). Typically, this is accomplished by creating fake user profiles, which give high or low ratings to selected items. Fake profiles also include additional “filler” item ratings, attempting to establish high similarity with existing benign user profiles. Once high similarity between one or more fake profiles and a benign user profile BUP has been achieved, these fake profiles are considered for the generation of recommendations for BUP, promoting or demoting the target items in recommendations formulated for BUP [
29,
30,
31,
32].
The work in [
29] provides an in-depth survey of the vulnerabilities in RecSys, focusing specifically on poisoning attacks. These attacks occur when malicious users or entities inject deceptive or biased data into the system with the intent to manipulate recommendations, either to promote certain items or to degrade the quality of suggestions. It categorizes various types of poisoning attacks, including data injection, model manipulation, and targeted attacks, and discusses their impact on recommendation accuracy and system trustworthiness. Additionally, this work explores various countermeasures to defend against these attacks, such as anomaly detection, robust learning algorithms, and data sanitization techniques. Last, it highlights the growing need for secure and resilient RecSys, especially as they become increasingly integrated into sensitive areas like e-commerce and personalized content delivery.
The work in [
30] introduces methods for discovering attacks by bots in RecSys, exploiting graph clustering and analysis of user actions. The approach proposed therein detects indications of attacks, it discerns the items that are affected, and can identify bots with a recall ranging from 80% to 100%. Once bots are identified, the artificially entered ratings can be removed from the dataset. The work in [
33] investigates a modern type of attack on RecSys, known as plausible profile poisoning. In this type of attack, adversaries create fake user profiles that appear realistic and trustworthy, but are strategically designed to manipulate the system’s recommendations. Unlike traditional attacks that rely on obvious manipulations or noise, plausible profile attacks are subtle, and can easily bypass standard detection methods. This work explores how these attacks can degrade the quality of recommendations, skewing results to favor certain items or users while remaining undetected. It also discusses the potential consequences of such attacks, especially in applications like e-commerce and online content platforms, where the integrity of recommendations is crucial. Finally, it suggests several countermeasures, including more sophisticated anomaly detection techniques and models that are robust to subtle profile manipulations, to safeguard RecSys from these types of threats.
The limitation for the majority of the aforementioned works is the fact that they necessitate additional information, such as location, product categories, textual content, user social relations and data from external sources, and hence cannot be applied to every case/dataset. Furthermore, they do not exploit the novel concept of rating prediction confidence factors.
Towards this direction, the work in [
7] introduces a CF algorithm which rejects items achieving low confidence factors values from recommendations. The confidence factor score cut-off threshold employed by the algorithm presented in [
7] is set to a high level and, therefore, many candidate items are eliminated from the final recommendation generation stage. This setting enables the algorithm to achieve a very high recommendation quality enhancement, at the expense, however, of the coverage metric. Due to this coverage reduction, the algorithm presented in [
7] is deemed to be inapplicable to sparse datasets (like the Amazon-sourced ones), while it exhibits demoted ability to formulate personalized recommendations, even in dense datasets.
The work in [
8] presents a recommendation algorithm which consists of four steps. During step 1, the algorithm computes the number of confidence factors that are fulfilled by each rating prediction in the initial recommendation candidate list. During step 2, the algorithm partitions the set of the items to be recommended into three subsets (Top, Med and Low). These include the items that the algorithm assumes that the user will “definitely”, “most probably”, and “probably” like, respectively, based on their respective CF prediction numeric values ([4.5–5.0], [4.0–4.5) and [3.5–4.0)). During step 3, the algorithm sorts the items contained in each of the three subsets, in descending order of their number of confidence factors that are satisfied. Finally, during the last step, the algorithm begins to select items from the Top subset in descending order of the sorting performed in the previous step (consequently, the items of the Med and Low subsets are used), until it reaches the requested number of recommendations. Although this algorithm achieves to maintain high coverage, the recommendation quality enhancement reached is relatively low (2–3% in terms of recommendation precision). This is owing to the fact that, according to the algorithm in [
8], rating predictions are first clustered into prediction classes only on the basis of their values, and then prediction classes are considered in strict order. When multiple predictions exist in a class, these are considered in descending confidence factor score. If, however, the highest class contains predictions with very low confidence factor score, these will be preferred over predictions that belong to the next priority class and have very high confidence scores but slightly lower prediction scores. Therefore, the algorithm in [
8] is prone to the recommendation of items with high uncertainty and marginal rating prediction score advantage, which may in turn lead to the introduction of errors of high magnitude.
In this paper, we introduce an advanced CF recommendation algorithm that takes into consideration not only the rating prediction value of the items produced by the CF algorithm, but also the confidence factors that each rating prediction fulfills, to enhance recommendation quality. The presented algorithm fuses two rating prediction characteristics, (a) the rating prediction value and (b) the number of confidence factors that the rating prediction satisfies, to a single recommendation score for each item. This is performed using a weighted average formula, where weights represent the importance of each characteristic. The optimal weights for the characteristics are experimentally determined. Finally, the algorithm recommends the item(s) that achieve the highest recommendation score to the AU. The presented algorithm also manages to maintain high recommendation coverage. It can be applied to every CF RecSys dataset, since it is based solely on the very basic CF information. Based on the algorithm’s application on commonly used RecSys datasets, the proposed algorithm significantly upgrades the recommendation quality, surpassing the performance of state-of-the-art works that also consider the aforementioned factors.
4. Experimental Evaluation
The experiments of recommendation success of the presented algorithm are detailed in this section. More specifically, the first set of experiments aims to determine the optimal value of parameter w, used for calculating the FRS value of each item, in the combination step of the algorithm. The second set of experiments aims to evaluate the proposed algorithm.
4.1. Experimental Settings
Our experimental evaluation uses six CF datasets, including two dense datasets and four sparse datasets, covering all sparsity levels. These six datasets are broadly utilized in RecSys research, and their characteristics are outlined in
Table 1.
Considering the user similarity metrics, we employ both metrics referred to
Section 3.1, i.e., the Pearson Correlation (PC) and the Cosine (or Vector) Similarity (CS), since these two metrics are the most utilized ones in the area of CF RecSys over the last years [
34,
35,
44,
45,
46,
47,
48]. Therefore, these metrics are representative of the trends in CF research and practice. Additionally the use of these metrics facilitates performance comparison with other works. The choice of these metrics allows for covering varying characteristics of similarity metrics as follows:
CS measures the angle between two n-dimensional vectors in n-dimensional space, and is independent of the actual values of the ratings [
49]. On the other hand, the PC value depends on the actual magnitude of user ratings.
In the domain of RecSys where ratings are non-negative, the PC has a range [−1, 1], while the CS has a range of [0, 1], covering thus the two different ranges of similarity metrics.
Furthermore, for the NN selection methods, again, we use both the methods referred to
Section 3.1, i.e., the top-K and the threshold method (THR). Regarding the top-K method, we opted to set K = 200 and K = 500. For the THR method, we opted to set T = 0.0 and T = 0.5, following the approaches of the works in [
7,
8,
35,
50].
The following recommendation evaluation metrics are used:
The recommendation precision;
The mean real arithmetic rating value;
The Normalized Discounted Cumulative Gain (NDCG).
They are used for 3 and 5 recommended items per user (top-3 and top-5). The 5-fold cross validation process on the datasets outlined in
Table 1 is used, following the works in [
7,
8].
For the first evaluation metric, the recommendation precision, the approach followed by numerous CF works, including [
8,
51,
52,
53], is implemented. In this approach, the recommendation consists of all items having predictions that fall in the top 30% of the rating scale (equal to 3.5/5 in all of our datasets). Similarly, the items having real rating values ≥ 3.5/5 are considered as approved/liked by the AU.
4.2. Determining the Optimal Weight Values
In the first set of experiments, the aim was to determine the optimal value of the weight parameters w, w
NN, w
avgU, and w
avgI used in the combination step of the algorithm. More specifically, we employed a grid search methodology [
54] to explore the search space for the parameters, using the following grid formulation:
Parameter w varied from 0 to 1 using increments of 0.1.
For each value of w, parameters wNN, wavgU and wavgI were varied from 0 to 1 using increments of 0.25, and subject to the restriction wNN + wavgU + wavgI = 1 (c.f. Equation (6)). An additional grid point where wNN = wavgU = wavgI = 1/3 was also explored.
For each set of weigh values, we computed the FRS of each item, in every dataset used in our work, to make recommendations to the users. Subsequently, we computed and averaged the values of the three evaluation metrics mentioned in the previous subsection for each dataset. Finally, we examined the behavior of the algorithm, taking into account the different parameter settings.
Figure 3,
Figure 4 and
Figure 5 depict the performance of the algorithm under the variation of parameter w. These figures depict the average value of each metric for all datasets, taking for each dataset the optimal value achieved across all tested combinations of the weights w
NN, w
avgU, and w
avgI.
In more detail,
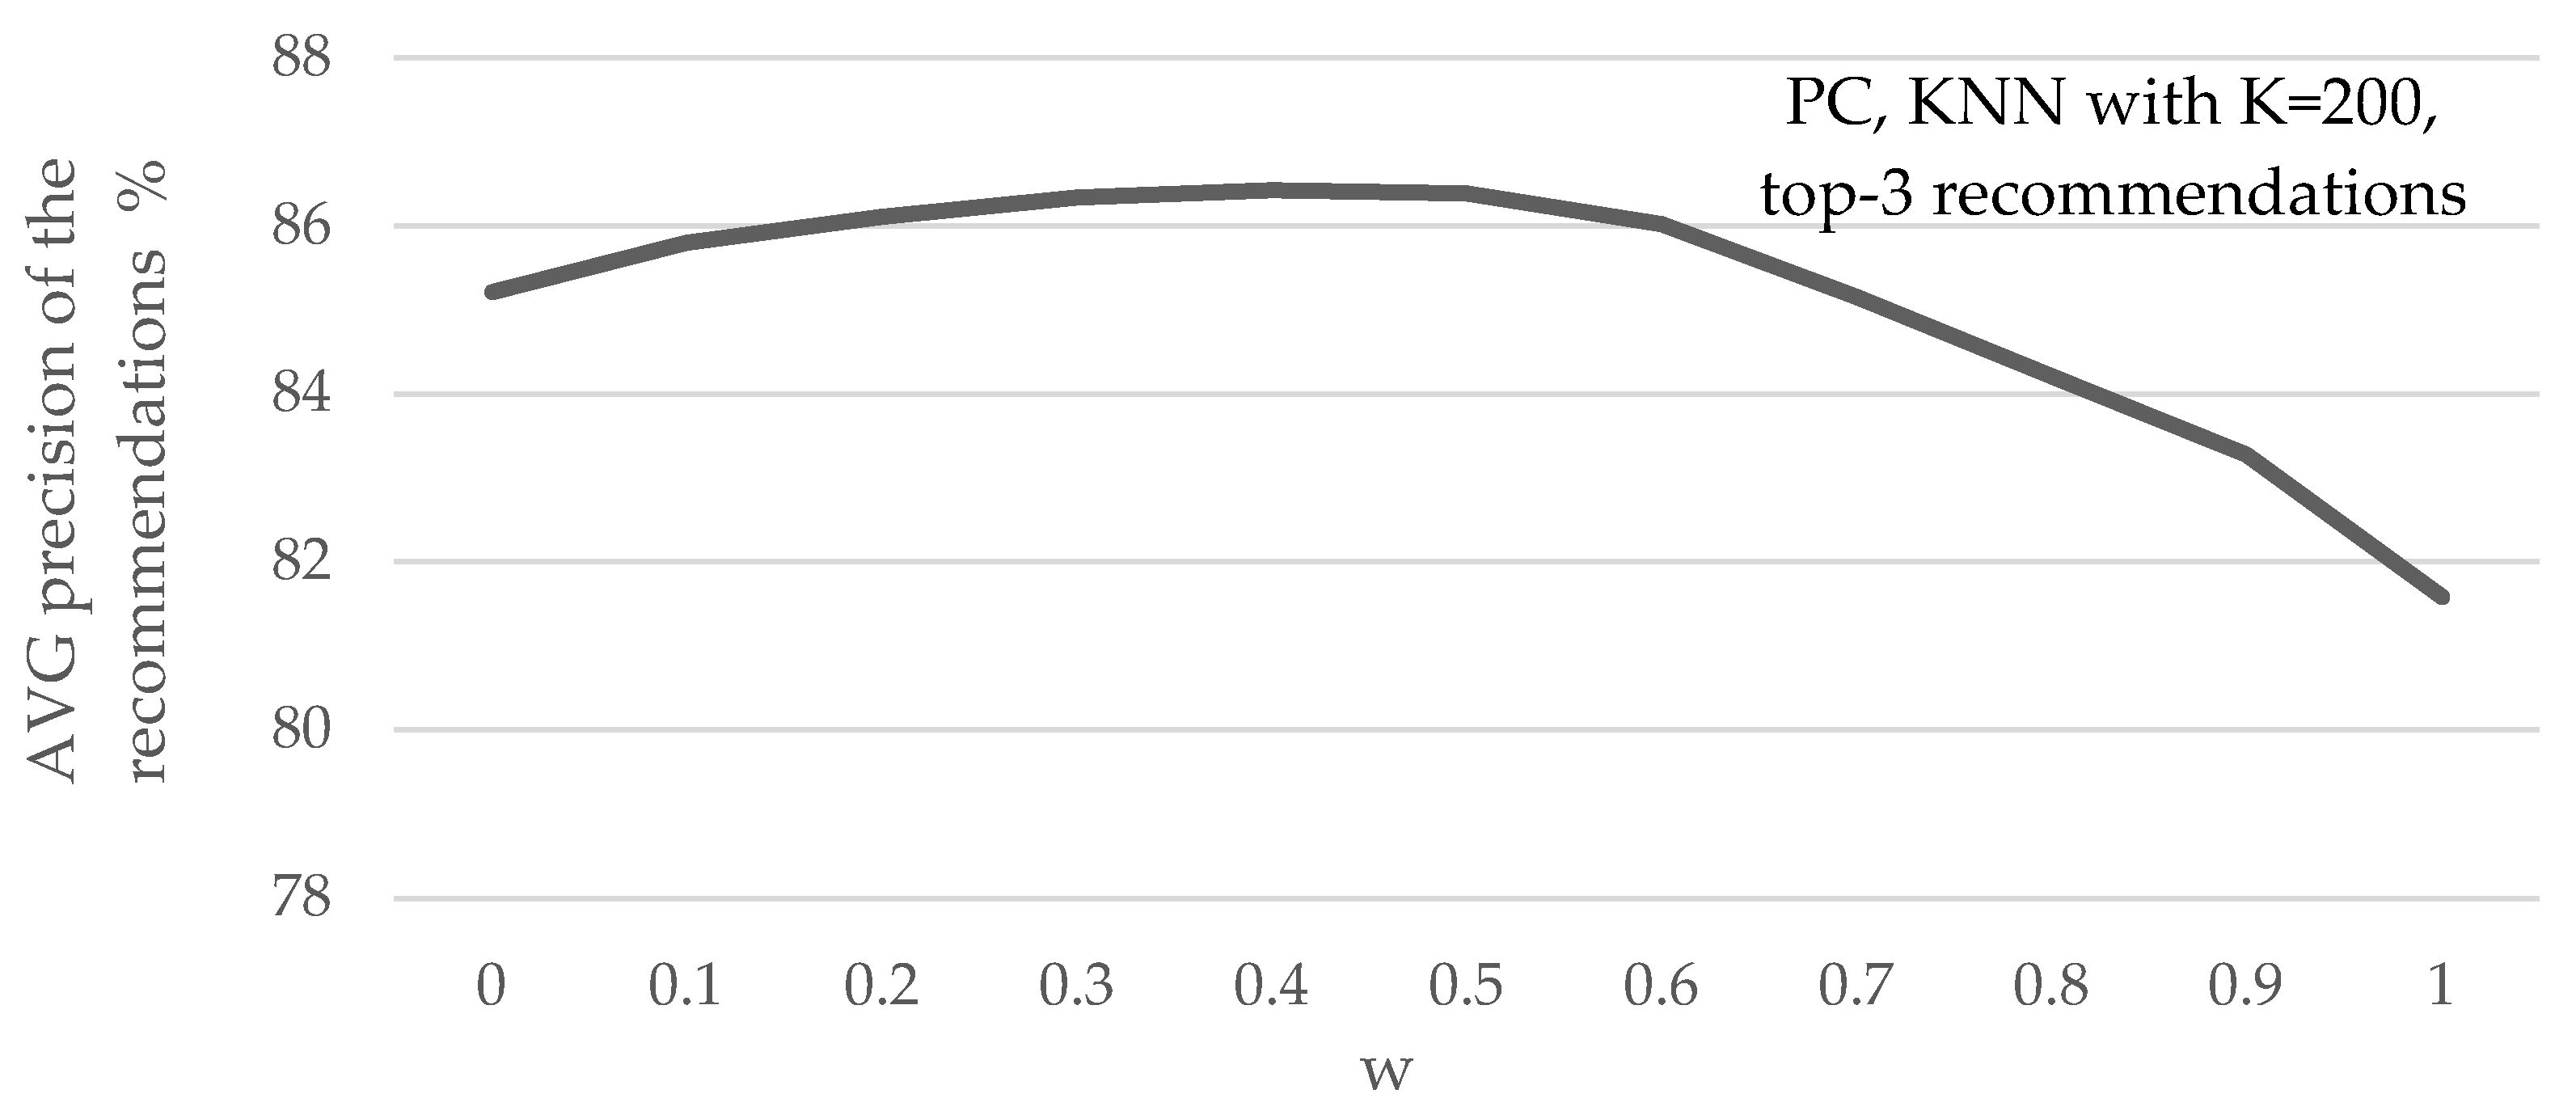
Figure 3 depicts the mean recommendation precision, under different w parameter values, when the PC similarity metric along with the top-K NN selecting method with K = 200 are used, for recommending 3 items per user. In
Figure 3, we can observe that the setting achieving the highest average recommendation precision improvements is for w = 0.4, i.e., setting the importance of the RPSi = 40% and the importance of the PCSi = 60%.
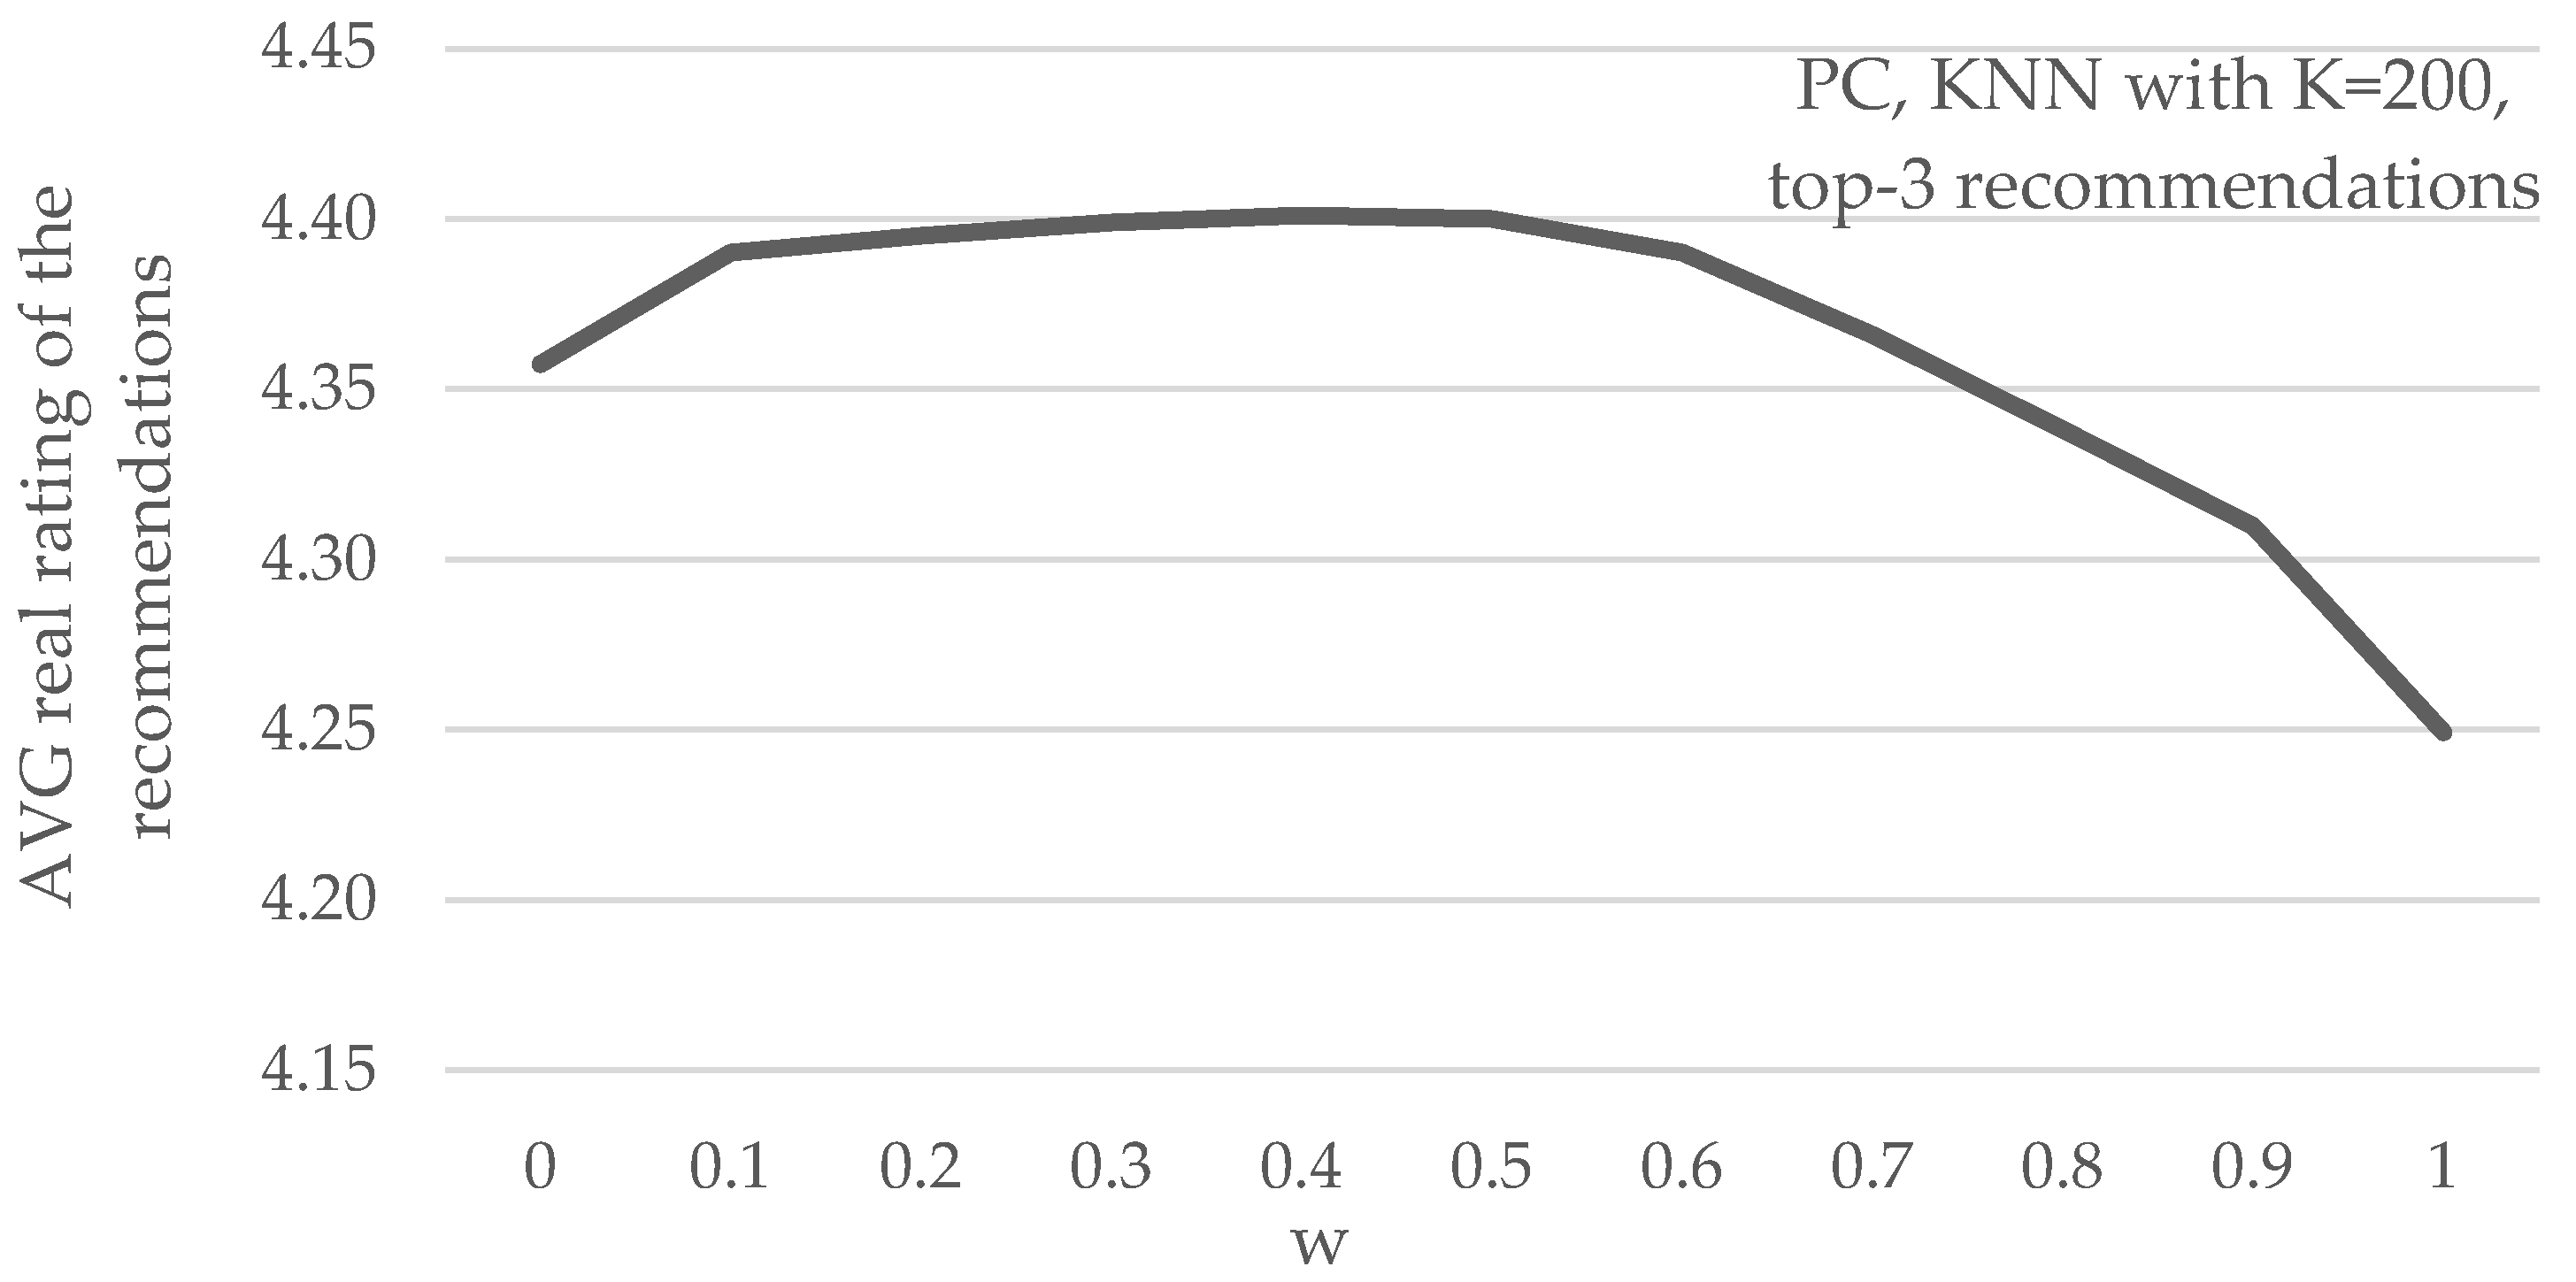
Figure 4 depicts the mean real arithmetic rating value of the recommendations, under different parameter w values, again, when the PC similarity metric along with the top-K NN selecting method with K = 200 are used, for recommending 3 items per user. We can observe that the setting achieving the highest average recommendation precision improvements is, again for w = 0.4 (i.e., setting the importance of the RPS
i = 40% and the importance of the PCS
i = 60%).
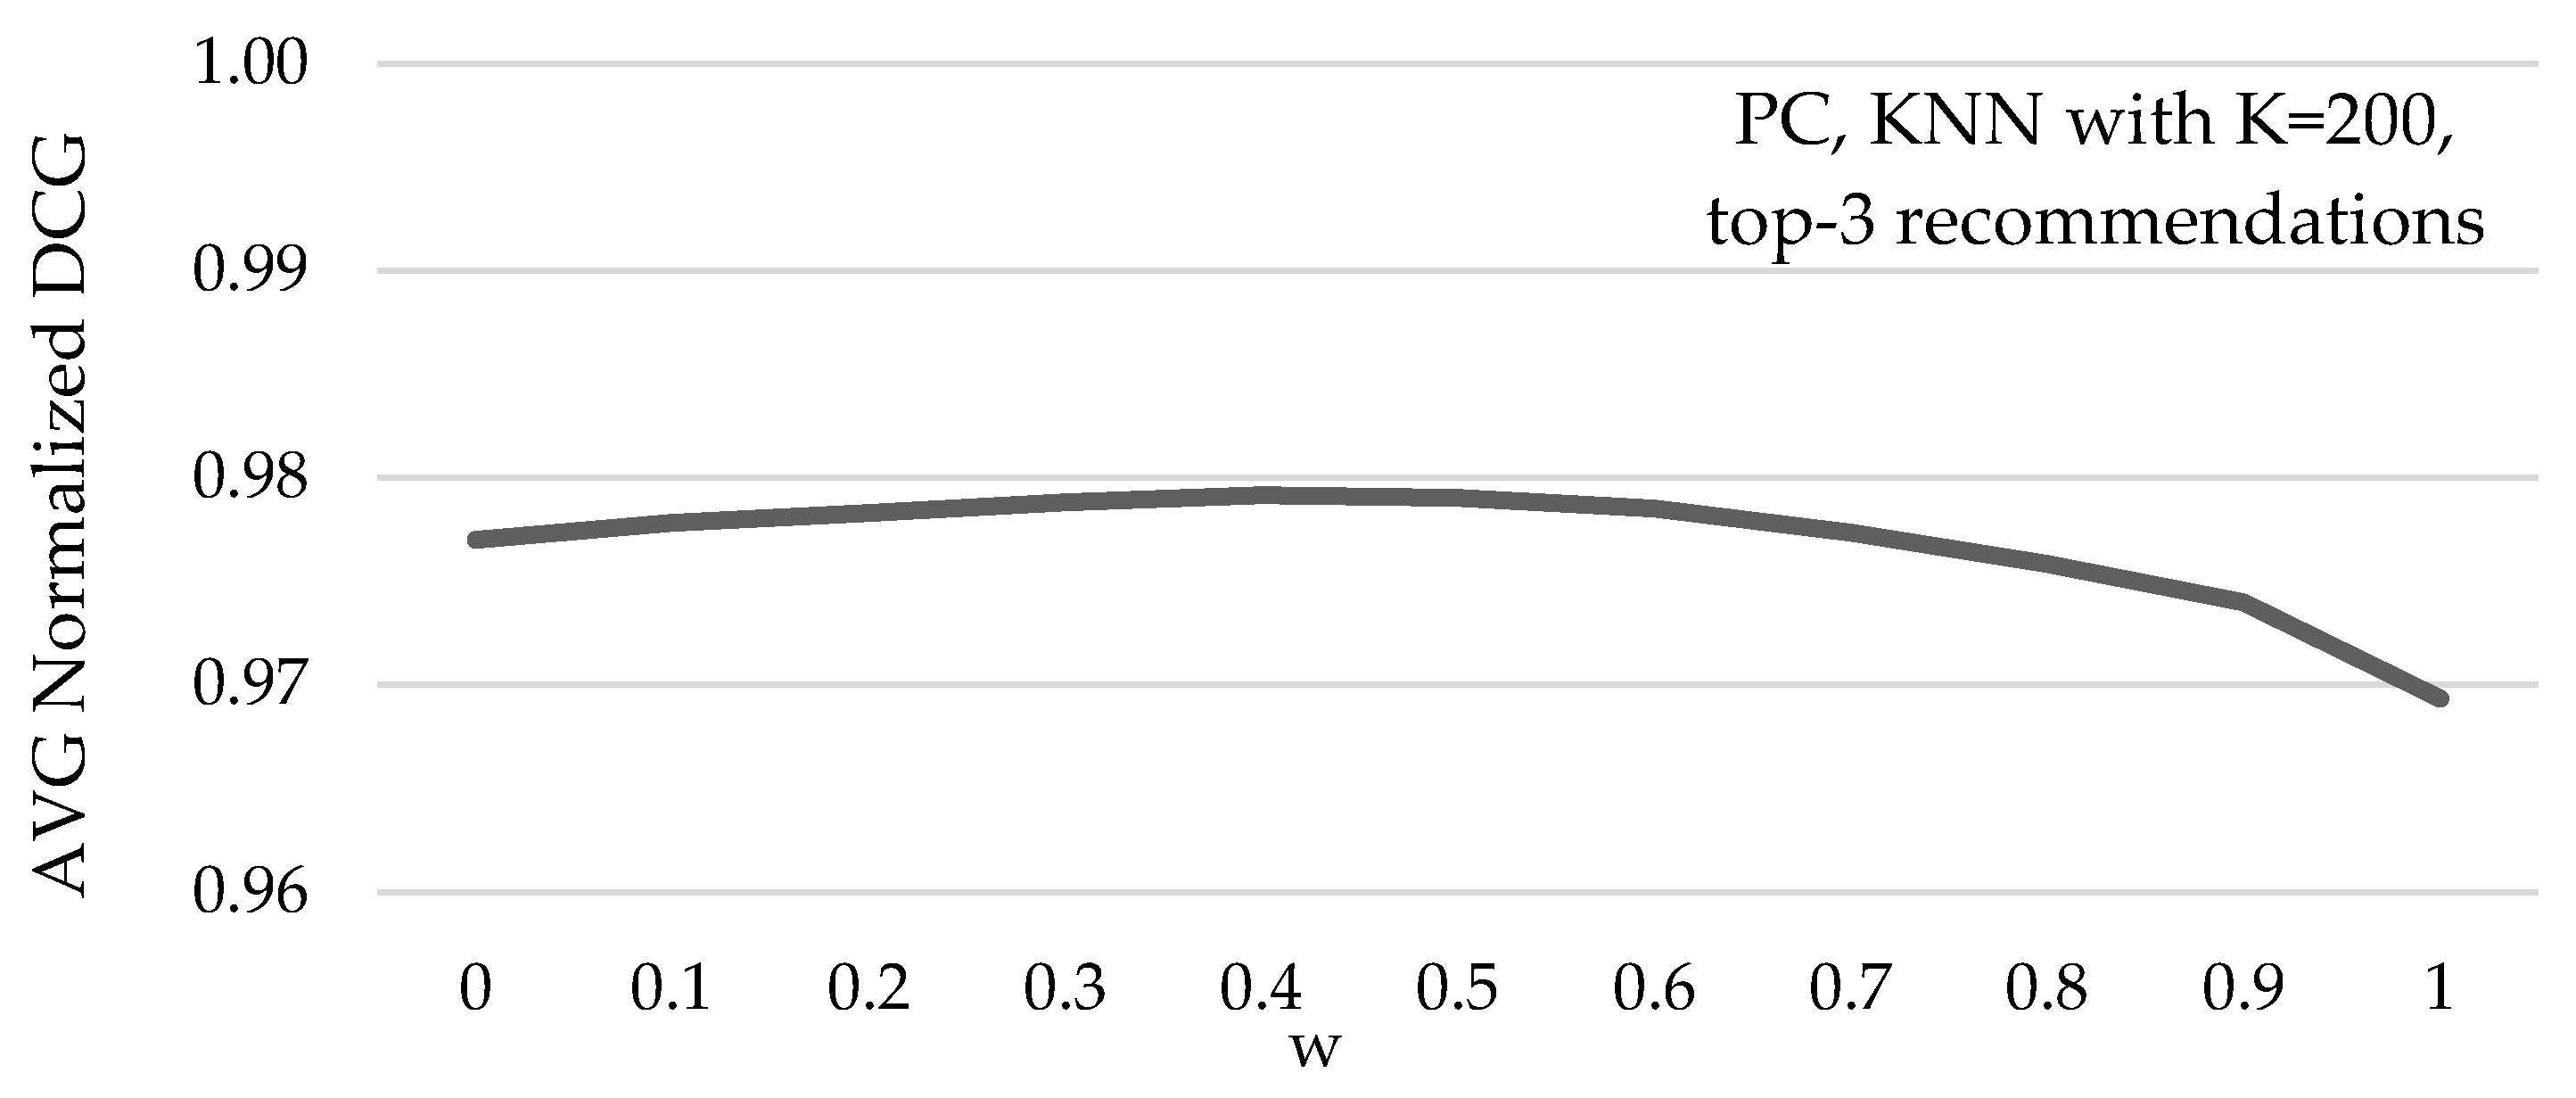
Lastly,
Figure 5 depicts the average NDCG value of the recommendations, under different parameter w values, again when the PC similarity metric along with the top-K NN selecting method with K = 200 are used, for recommending 3 items per user. Again, we can observe that the setting achieving the highest average recommendation precision improvements is, again, when setting the importance of the RPS
i = 40% (and the importance of the PCS
i = 60%).
Totally analogous results are noticed for all the combinations of rating prediction parameters tested (i.e., recommending 5 items, setting K = 500, using the THR NN selection method and utilizing the CS user vicinity metric).
The analysis of the results indicates that the performance of the algorithm for all metrics is maximized in all datasets when w is set to 0.4 or 0.3, and when weights wNN, wavgU, and wavgI are either all set to 1/3, or in a balanced setting (e.g., two of these weights are set to 0.25, and the remaining one is set to 0.5). In some cases, comparable performances are obtained for more imbalanced settings, e.g., (wNN = 0.5, wavgU = 0.0, wavgI = 0.5) or (wNN = 0.0, wavgU = 0.25, wavgI = 0.75). However, the following are noted:
For all cases where the optimal performance for some metric was observed for w = 0.3, the corresponding improvement for w = 0.4 was only marginally inferior to the optimal one, up to 0.08%. For example, for the Amazon Videogames dataset under the Top-K NN selection method with K = 200 and the PC similarity metric, the maximum improvement achieved by the proposed algorithm for the precision metric is 3.44% for w = 0.3, while for w = 0.4, the improvement attained is 3.41%; hence, the difference between the two parameter settings is 0.03%. On the contrary, in some cases, the setting w = 0.4 achieves substantially higher improvements compared to the setting w = 0.3, up to 1.03%.
Similarly, the setting where weights wNN, wavgU, and wavgI are each equal to 1/3 always achieves either the best performance improvement, or an improvement marginally inferior to the optimal one (up to 0.124%).
Taking the above into account, we can conclude that when the algorithm operates under the setting (w = 0.4, wNN = 1/3, wavgU = 1/3, wavgI = 1/3), it delivers either optimal results or results that are very close to the optimal ones. Therefore, RecSys administrators may skip the tuning phase and execute the recommendation phase directly, using the settings listed above. If, however, the dataset is deemed to entail particularities, the tuning phase can be executed and the weights that are found to produce the optimal results can be used in the recommendation phase.
Based on all the above, and combining formulas (7) and (1) for the computation of FRS
AU,i and PCS
AU,i, respectively, in the experiments reported in the rest of this section the FRS
AU,i for each prediction is computed as shown in Equation (8),
and, correspondingly, research questions RQ2 and RQ3 can be answered as follows:
Answer to RQ2: the optimal setting for the balance between the importance assigned to confidence factors and the importance assigned to rating predictions is to consider the confidence factors-related score with a weight equal to 0.6 and the rating prediction value with a weight equal to 0.4.
Answer to RQ3: assigning equal weights to all confidence factors leads to optimal or very close to optimal results in all cases.
4.3. Experimental Comparison
After having determined the optimal values for the parameters w, w
NN, w
avgU, and w
avgI for the operation of the presented algorithm, we continue to assess the algorithm’s performance in terms of prediction accuracy. More specifically, we compare the performance of the algorithm introduced in this work, both with the plain CF algorithm and with the algorithm presented in [
8], which will be denoted as “ConfStrict”, since this algorithm strictly prioritizes rating predictions belonging to higher rating prediction classes. The latter is a state-of-the-art algorithm (presented in 2024) that targeted to upgrade CF recommendation quality, considering prediction confidence factors and using solely on basic CF information (user, item and rating tuple).
Regarding the CF algorithm presented in [
7], which also considers prediction confidence factors, as mentioned in the related work section, even though it achieves high recommendation quality enhancement, it induces significant recommendation coverage reduction. Therefore, it is proven inapplicable to sparse datasets, like the four out of the six datasets used in our experiments. As a result, this algorithm is not included in the following experiments.
In
Section 4.3.1, the experiments utilizing the PC similarity metric are presented and discussed. In
Section 4.3.2, the respective experiments utilizing the CS metric are presented and discussed.
4.3.1. Experiments Using the PC Similarity Metric
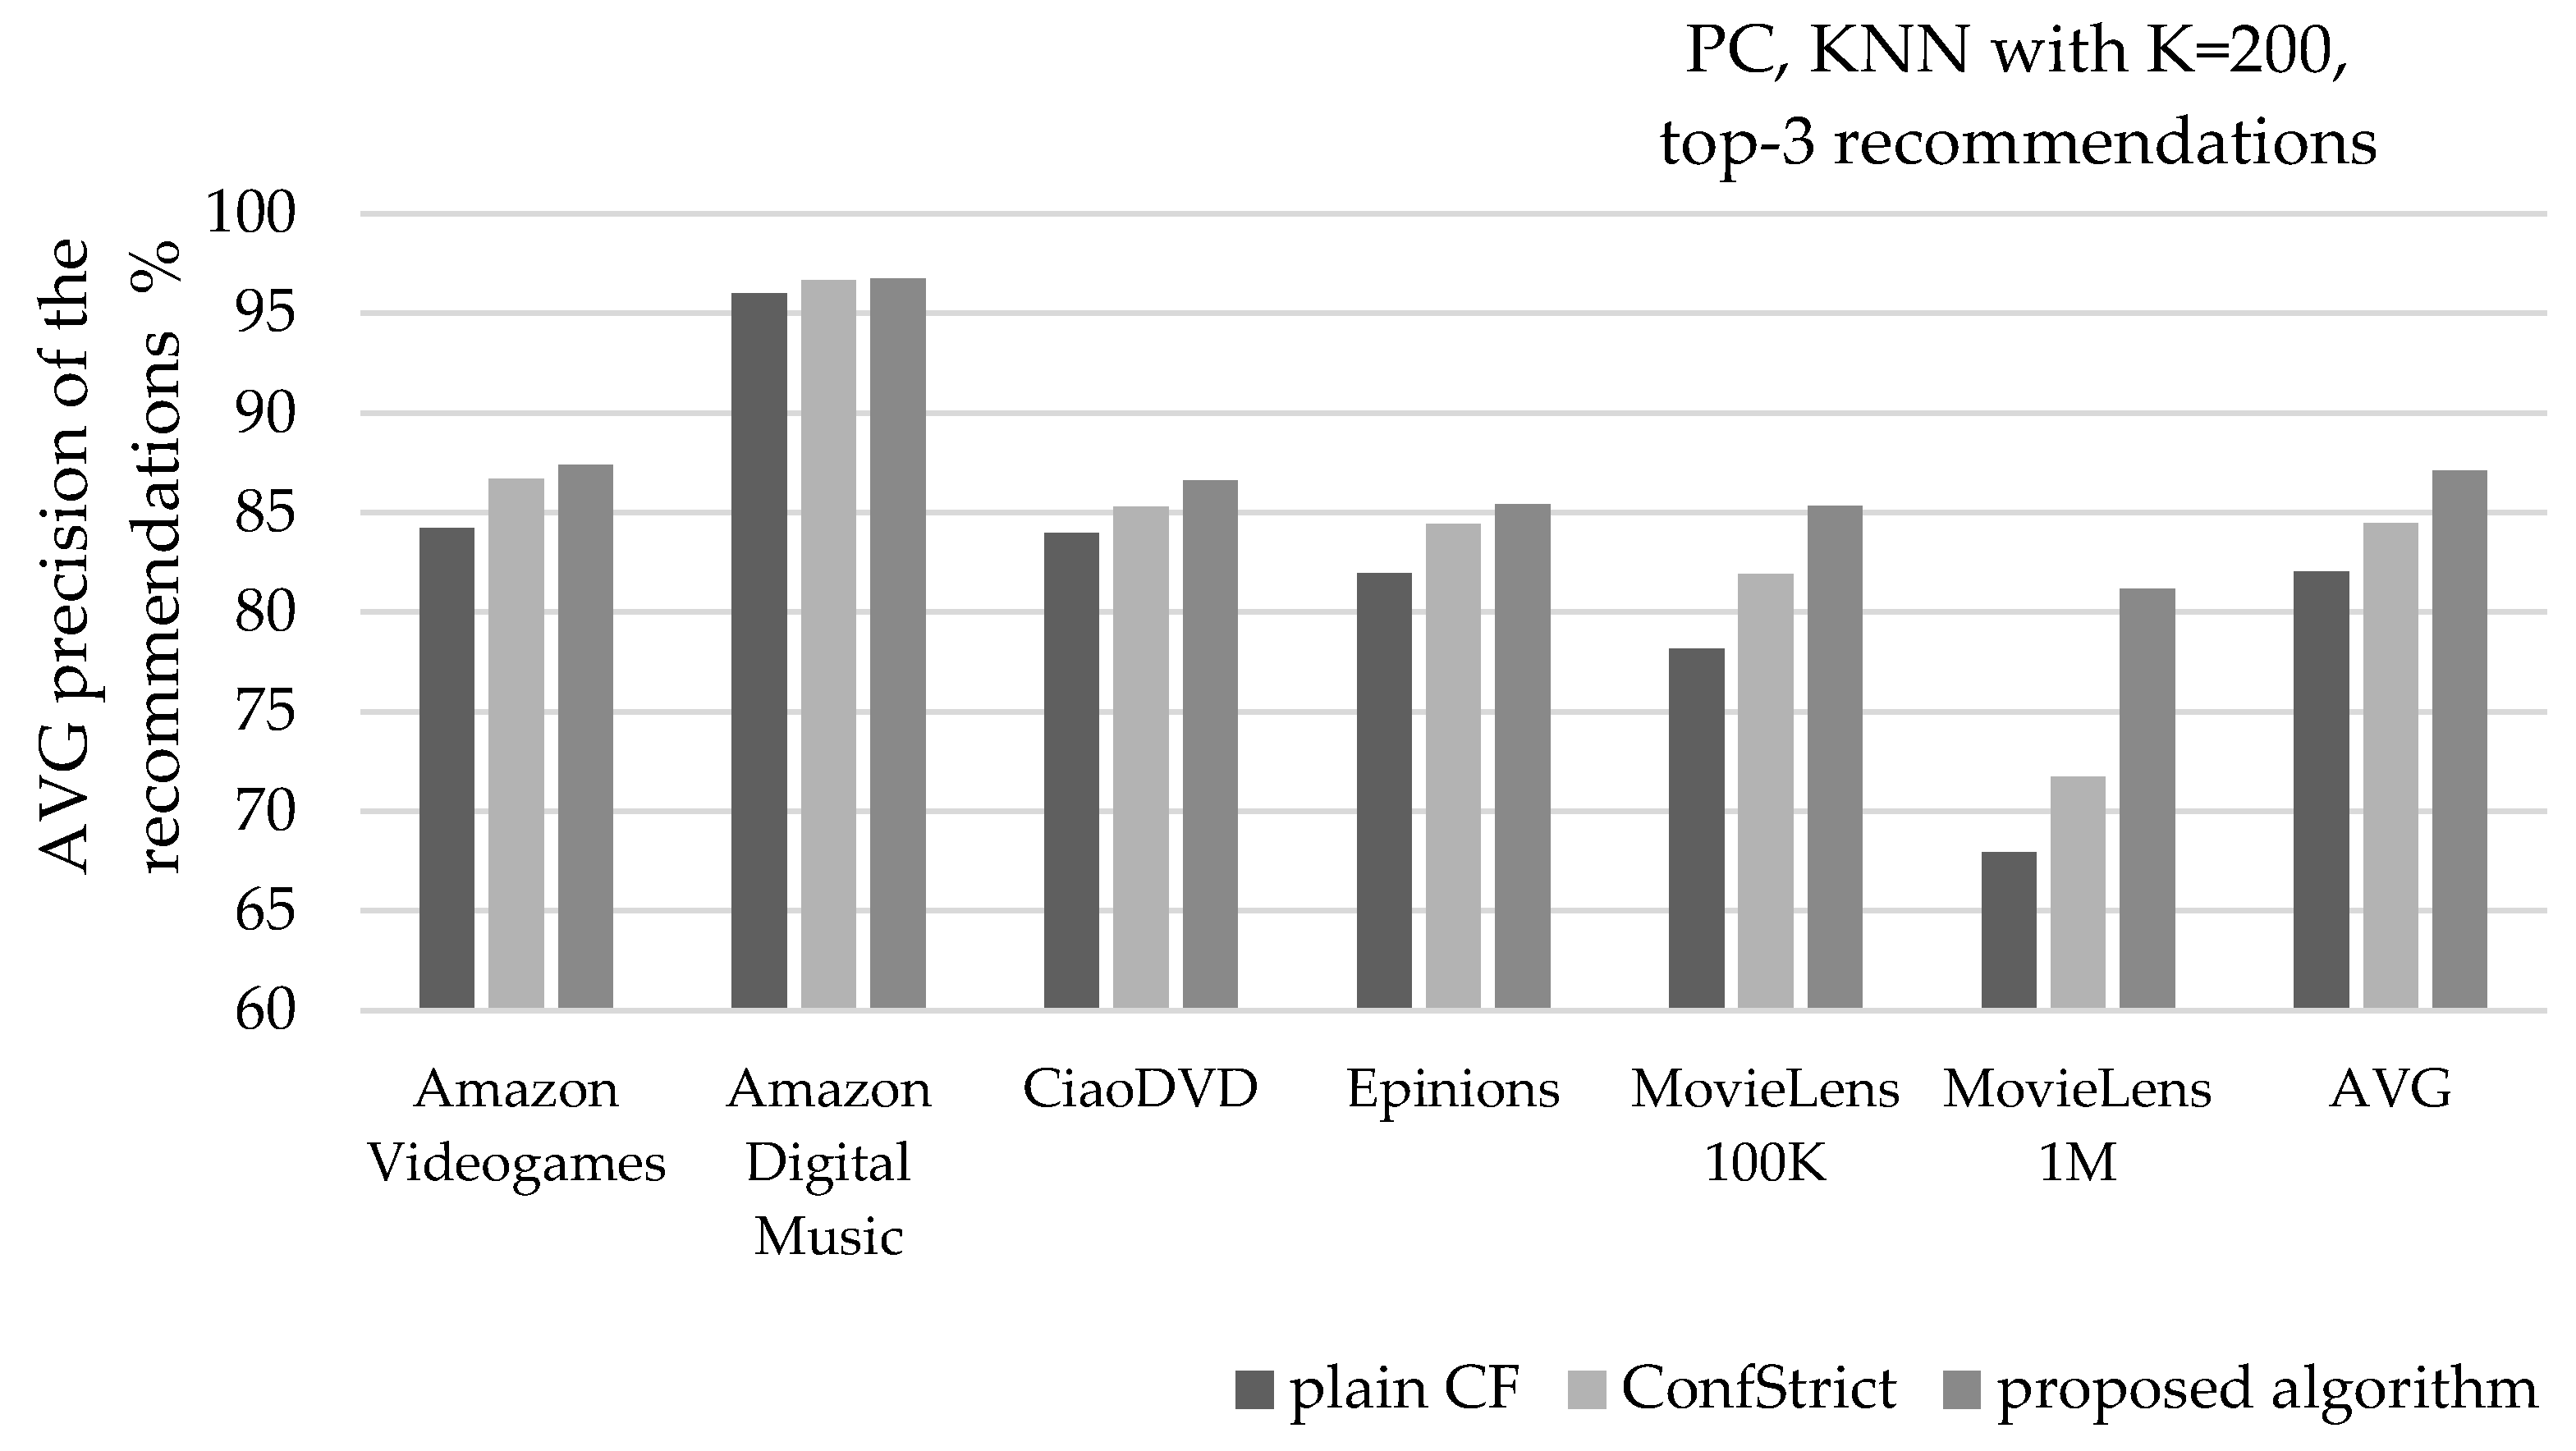
Figure 6 depicts the mean precision of recommendations, when the PC similarity metric is used, along with the KNN selection method, setting K = 200, and recommending 3 items per user (top-3). Considering the average of all six datasets, the presented algorithm increases the recommendation precision by 6.2% (from 82% to 87.1%), surpassing the corresponding improvement achieved by the ConfStrict algorithm, by two times (its respective improvement is 3%).
Two cases are notable at the individual dataset level: the one using the MovieLens 1 M dataset, and the one using the Digital_Music dataset. In the first case, the recommendation precision results of the plain CF algorithm are mediocre (67.9%). The application of the ConfStrict algorithm achieves to enhance the precision to 71.7% (a 5.6% increase). The algorithm presented in this work achieves enhancement of the recommendation precision to 81.2% (a 19.6% increase). In the second case, the initial precision equals 96%, leaving almost no room for upgrade. Nevertheless, the algorithm presented in this work enhances the precision to 96.73% (the respective precision of the ConfStrict algorithm is 96.67%).
Figure 7 depicts the average real rating value of recommendations under the same settings. Considering the average of all six datasets, the presented algorithm increases the mean real rating value of recommendations by 3.6% (from 4.27 to 4.42), surpassing the corresponding improvement achieved by the ConfStrict algorithm by almost two times (its respective improvement is 1.9%).
In the two notable cases mentioned above, the average real rating value of recommendations are measured at 3.86, 3.98, and 4.24 (for the plain CF, the ConfStrict algorithm and the proposed algorithm, respectively), for the MovieLens 1 M dataset. For the Amazon Digital Music dataset, the respective average real rating values are measured at 4.8, 4.83, and 4.834.
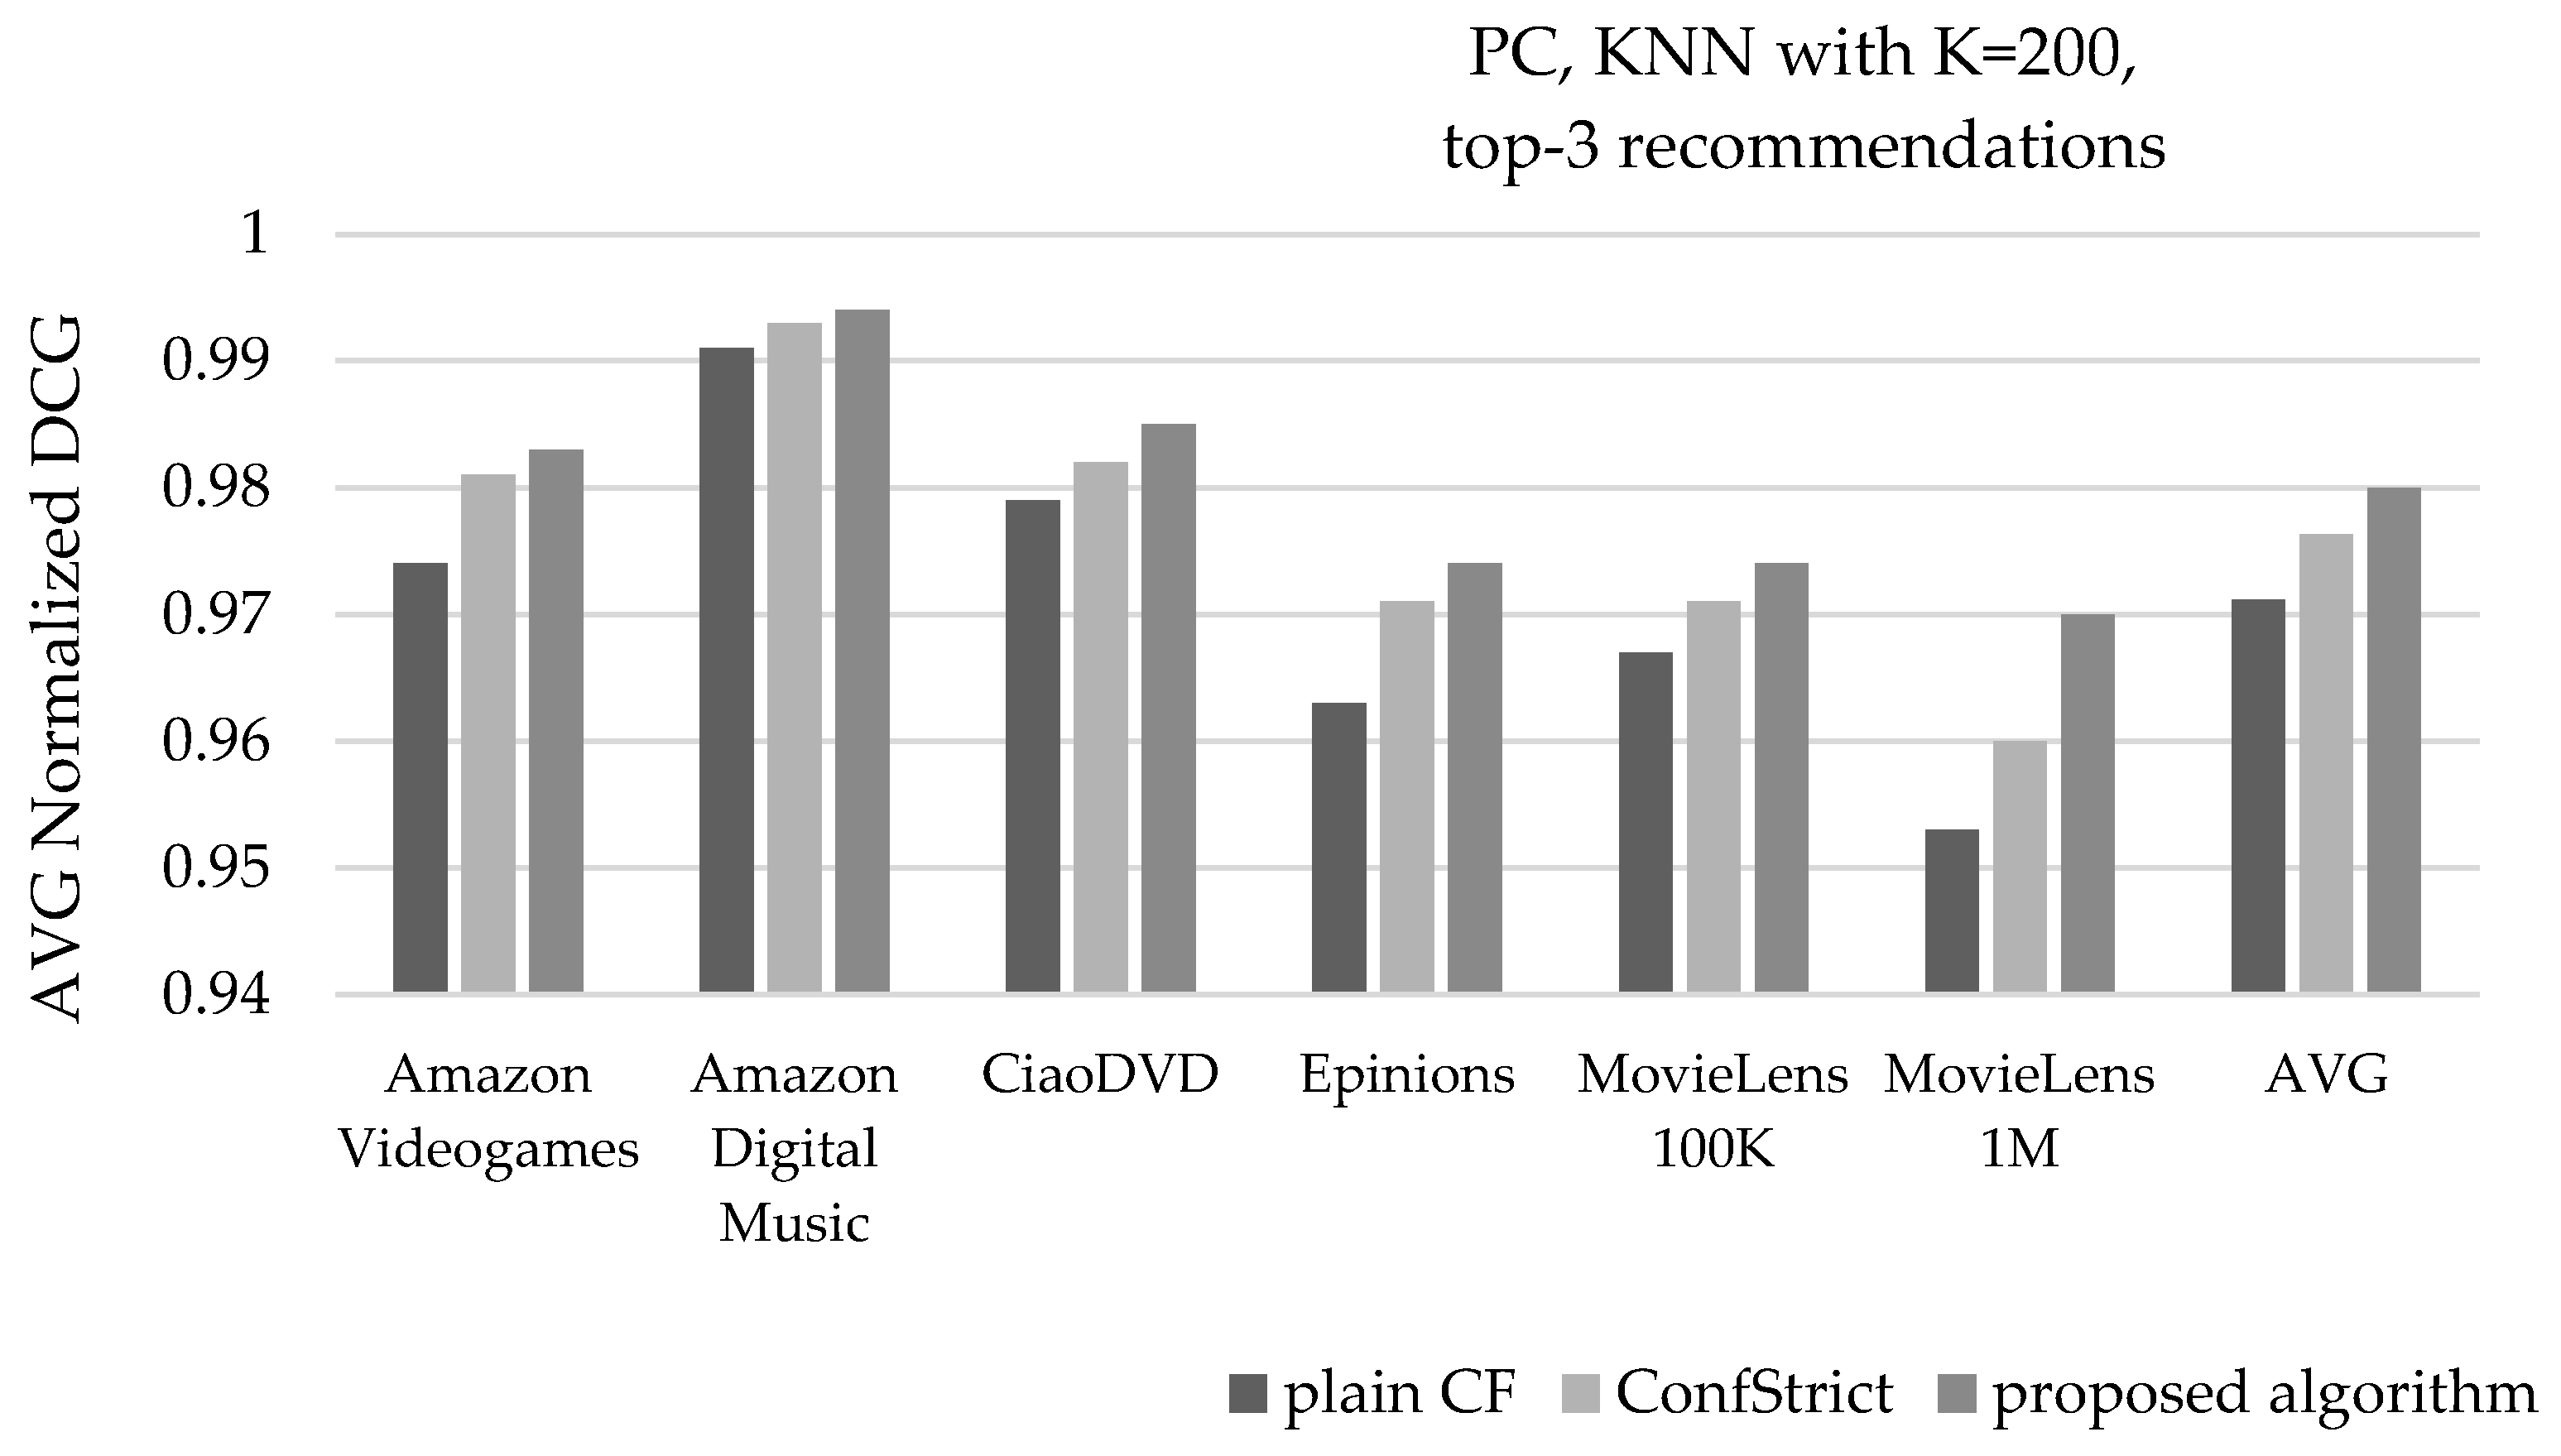
Figure 8 depicts the mean NDCG value of recommendations, under the same settings. Considering the average of all six datasets, the presented algorithm increases the mean NDCG value of recommendations from 0.971 to 0.98, surpassing the mean NDCG value achieved by the ConfStrict algorithm, measured at 0.976. For the two individual cases mentioned above, regarding the MovieLens 1 M dataset, the NDCG values are measured at 0.953, 0.96, and 0.97 (for the plain CF, the ConfStrict algorithm and the proposed algorithm, respectively). For the Amazon Digital Music dataset, the respective NDCG values are measured at 0.991, 0.993, and 0.994.
Similar results are obtained when the number of recommended items is increased to 5 (top-5 recommendations). More specifically, the recommendation precision is enhanced from 82.5% (plain CF) to 86.4%, while the ConfStrict algorithm achieves an 84.4% increase. In regard to the mean real rating value of recommendations, the respective scores are 4.29, 4.44, and 4.38 (for the plain CF, the proposed algorithm and the ConfStrict algorithm, respectively). For the average NDCG value, the respective scores are 0.973, 0.982, and 0.978.
When K is increased to 500, again, similar results are obtained. More specifically, when recommending 3 items per user (top-3 recommendations) the average recommendation precision is equal to 82.5% (plain CF), 87.3% (presented algorithm), and 85.1% (ConfStrict algorithm). The average real rating value of recommendations equals 4.29 (plain CF), 4.43 (presented algorithm), and 4.37 (ConfStrict algorithm). The average NDCG value equals 0.966, 0.977, and 0.972, respectively. When the number of recommended items is increased to 5 per user (top-5 recommendations), the respective results are 83.2%, 86.7%, and 85.1% regarding the recommendation precision; 4.30, 4.41, and 4.37 regarding the average real rating value of recommendations; and 0.966, 0.977, and 0.972 regarding the average NDCG value.
Figure 9 depicts the average precision of recommendations, when the PC similarity metric is used, along with the THR NN selection with T = 0.0, and recommending 3 items per user (top-3). Considering the average of all six datasets, the presented algorithm increases the recommendation precision from 86% to 88.3%, surpassing the corresponding improvement achieved by the ConfStrict algorithm, which is measured at 87.5%.
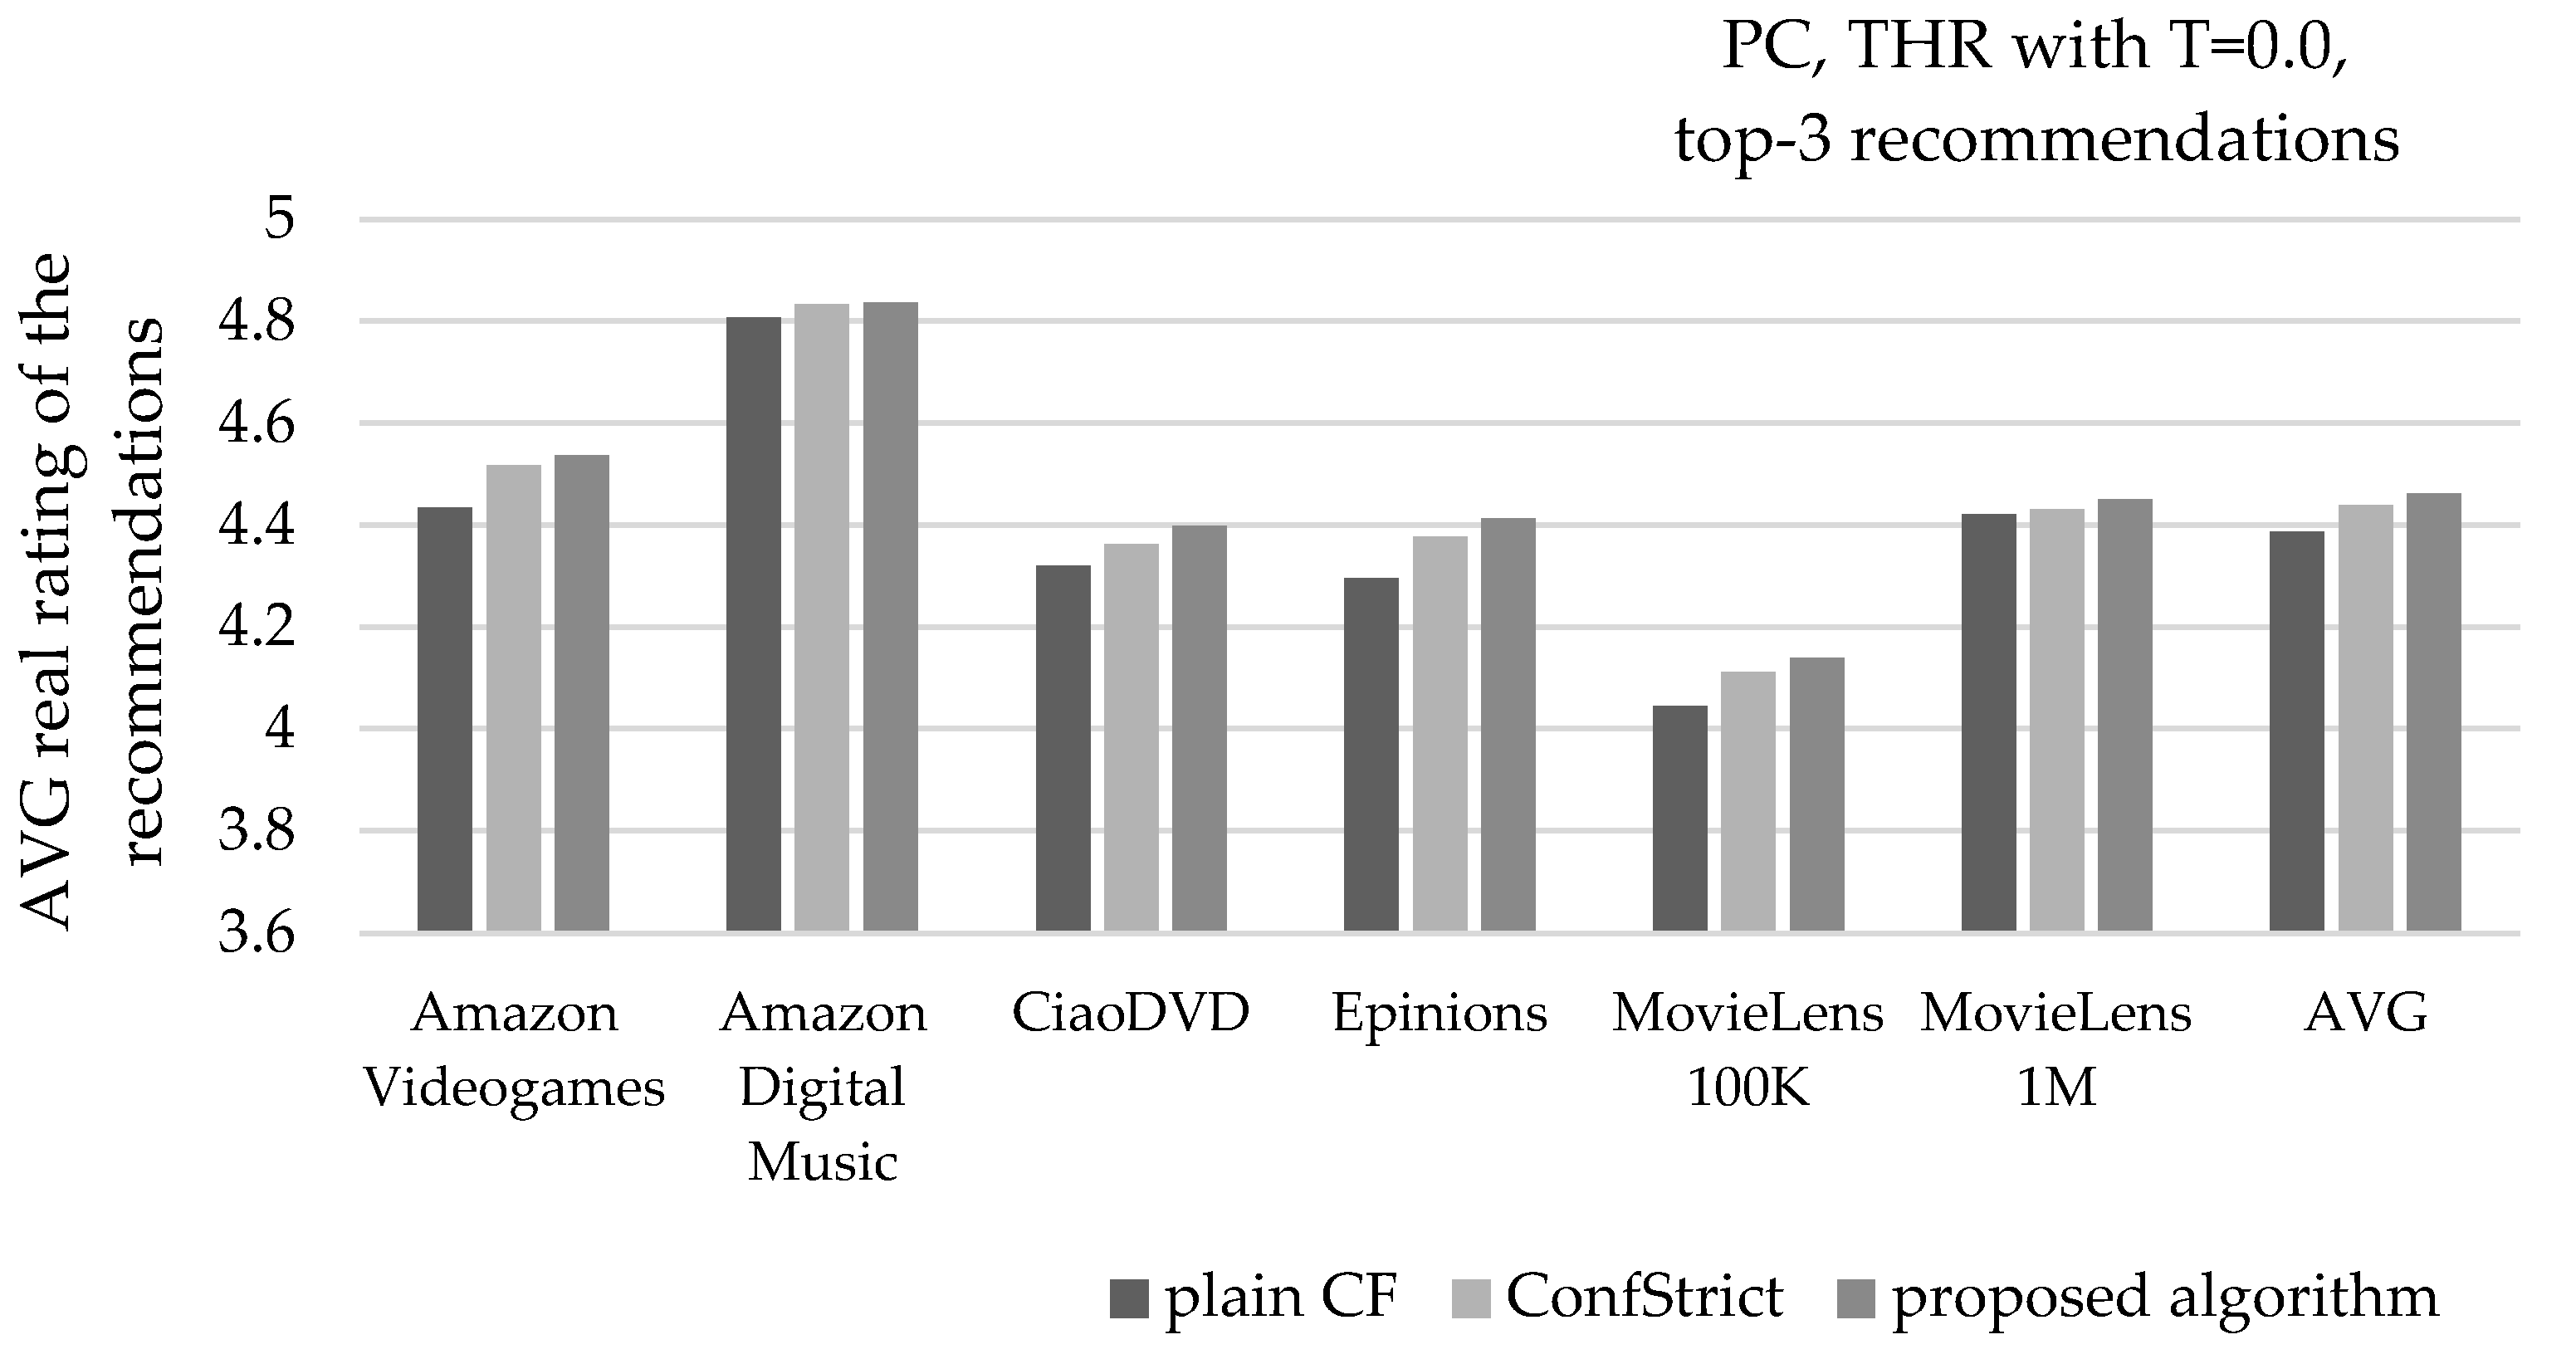
Figure 10 depicts the mean real rating value of recommendations, under the same settings. Considering the average of all six datasets, the presented algorithm increases the average real rating value of recommendations from 4.39 to 4.46, surpassing the corresponding improvement achieved by the ConfStrict algorithm, which is measured at 4.44.
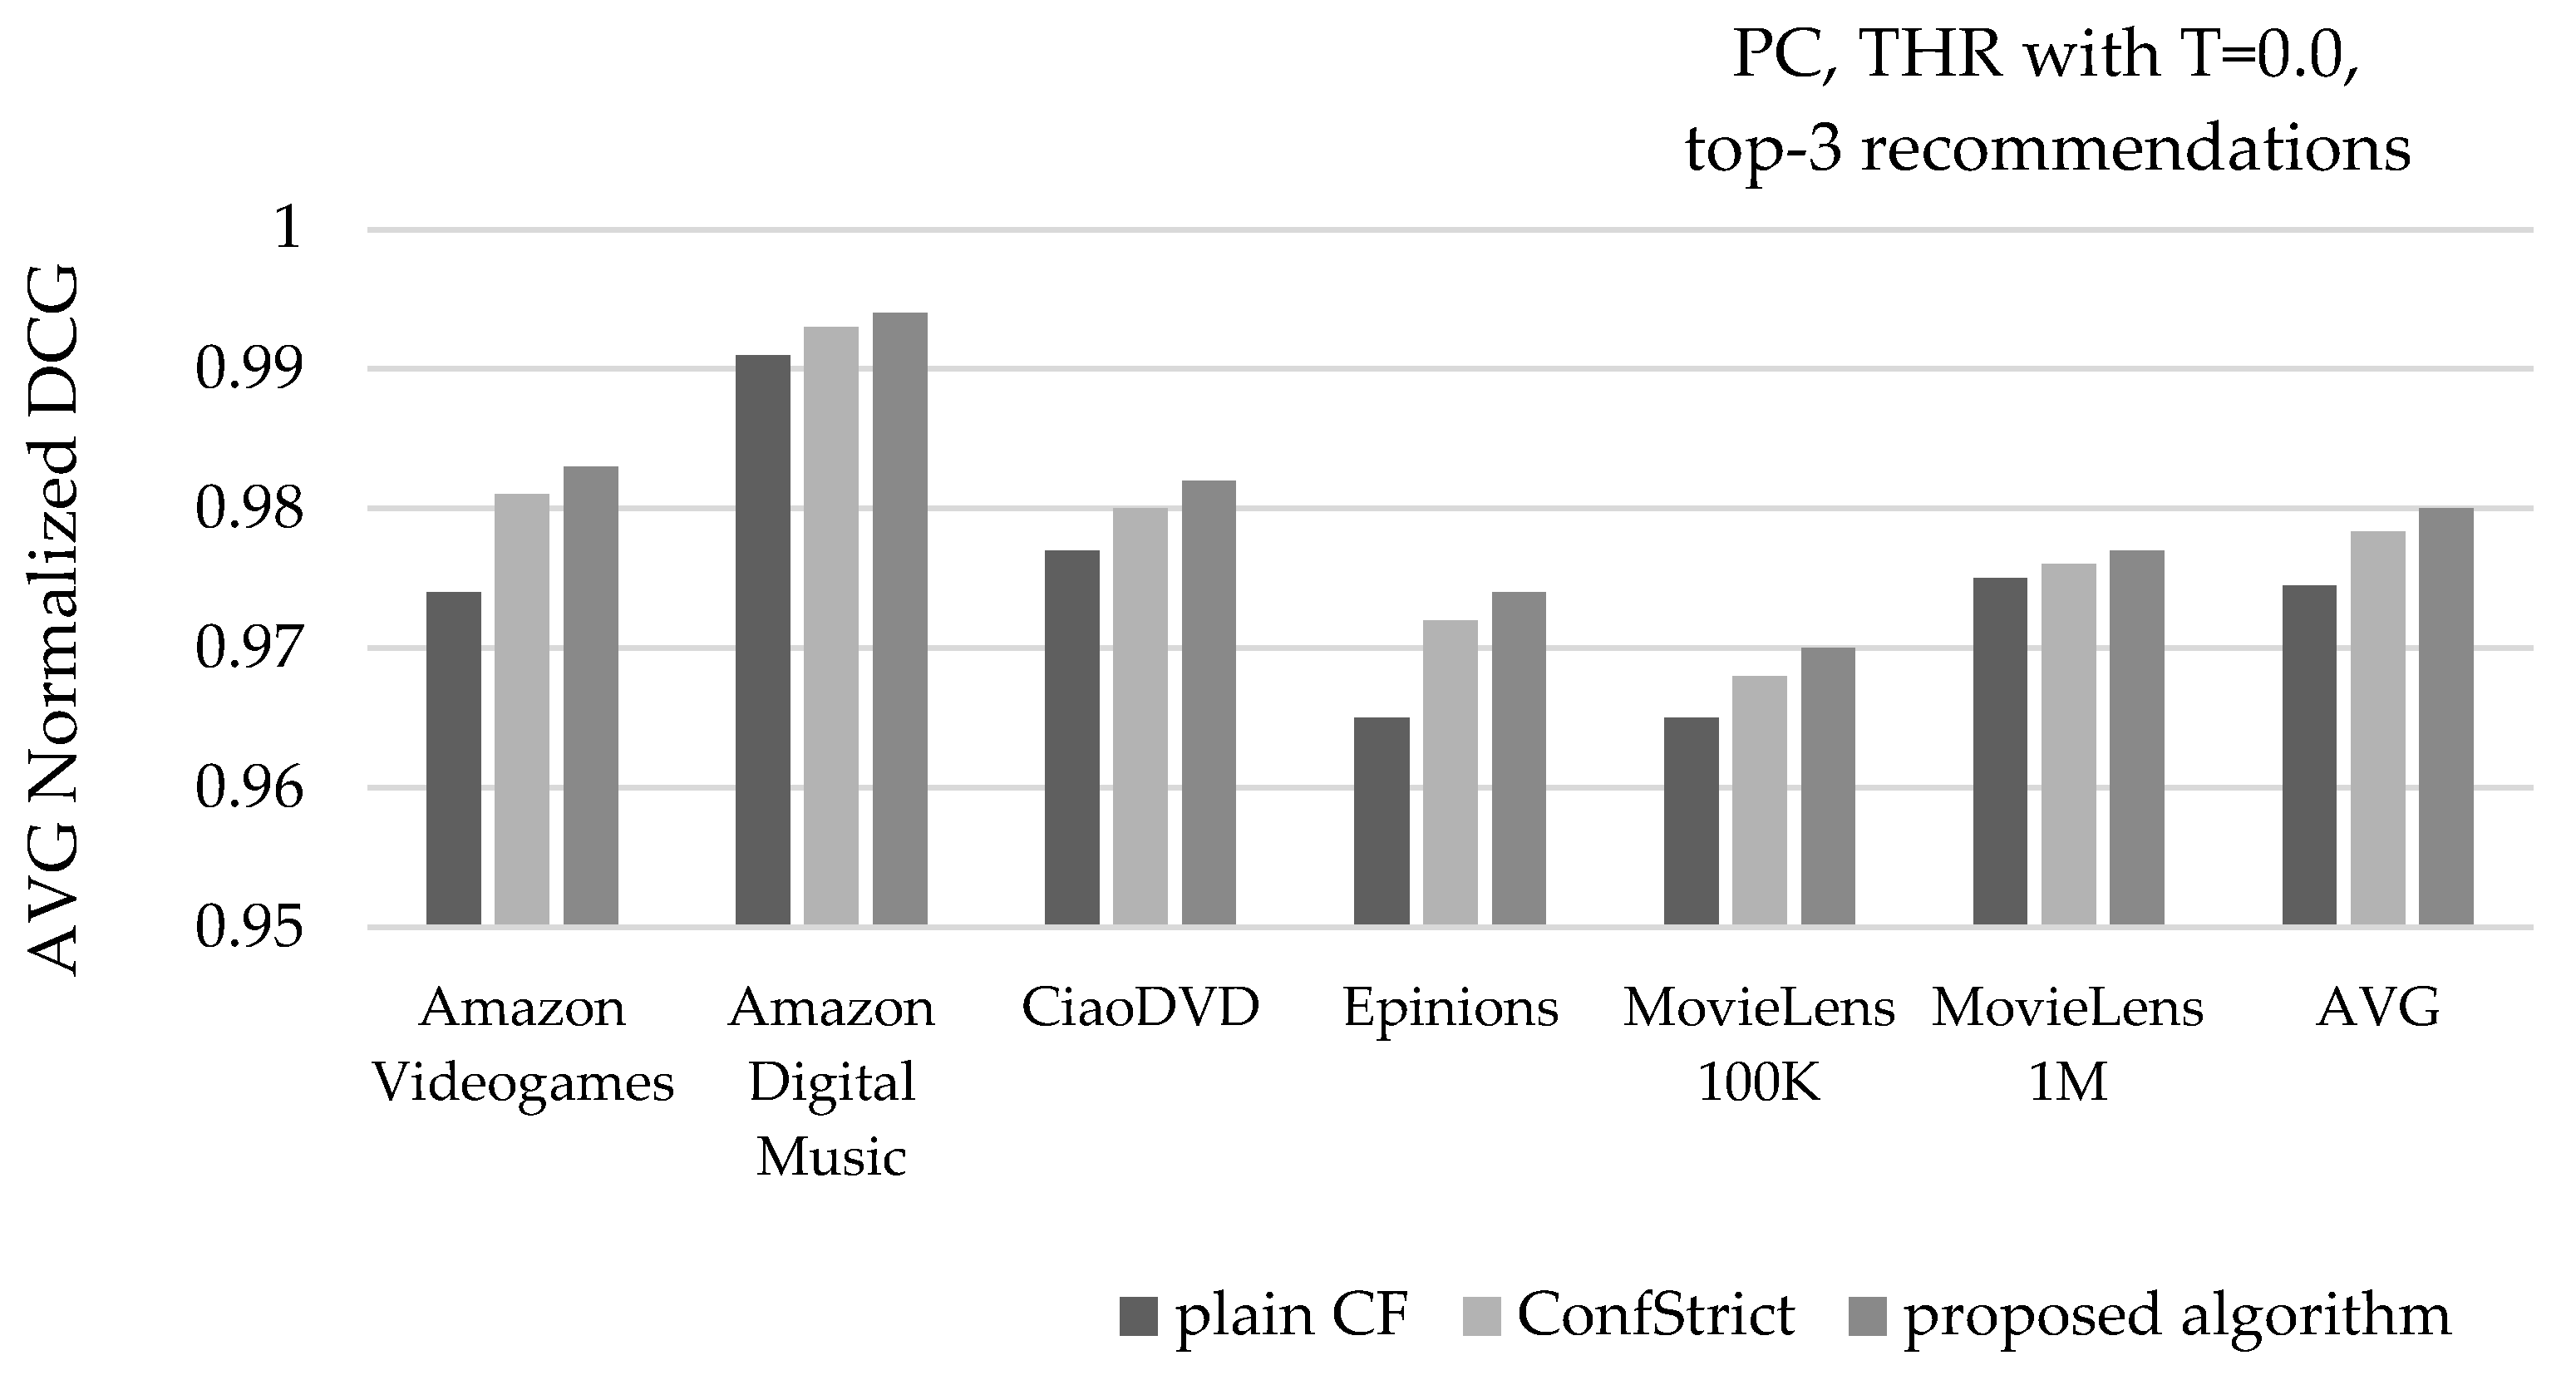
Figure 11 depicts the mean NDCG value of recommendations under the same settings. Considering the average of all six datasets, the presented algorithm increases the mean NDCG value of recommendations from 0.975 to 0.98, surpassing the average NDCG value achieved by the ConfStrict algorithm, measured at 0.978.
Similar results are obtained when the number of recommended items is increased to 5 (top-5 recommendations). More specifically, the recommendation precision is enhanced from 86.1% (plain CF) to 87.9%, while the application of the ConfStrict algorithm achieves a precision of 87.4%. For the mean real rating value of recommendations, the respective scores are 4.39, 4.44, and 4.42 (for the plain CF, the proposed algorithm and the ConfStrict algorithm, respectively). For the average NDCG value, the respective scores are 0.970, 0.976, and 0.974.
When Τ is increased to 0.5, similar results are obtained. More specifically, when recommending 3 items per user (top-3 recommendations), the average recommendation precision is equal to 84.6% (plain CF), 88% (presented algorithm), and 86.5% (ConfStrict algorithm). The average real rating value of recommendations equals 4.34 (plain CF), 4.44 (presented algorithm), and 4.41 (ConfStrict algorithm) and the average NDCG value, is equal to 0.973, 0.980, and 0.978, respectively. When the number of recommended items is increased to 5 per user (top-5 recommendations), the respective results are 84.8%, 87.5%, and 86.3% regarding the recommendation precision; 4.35, 4.43, and 4.40 regarding the average real rating value of recommendations; and 0.968, 0.976, and 0.974 regarding the average NDCG value.
4.3.2. Experiments Using the CS Similarity Metric
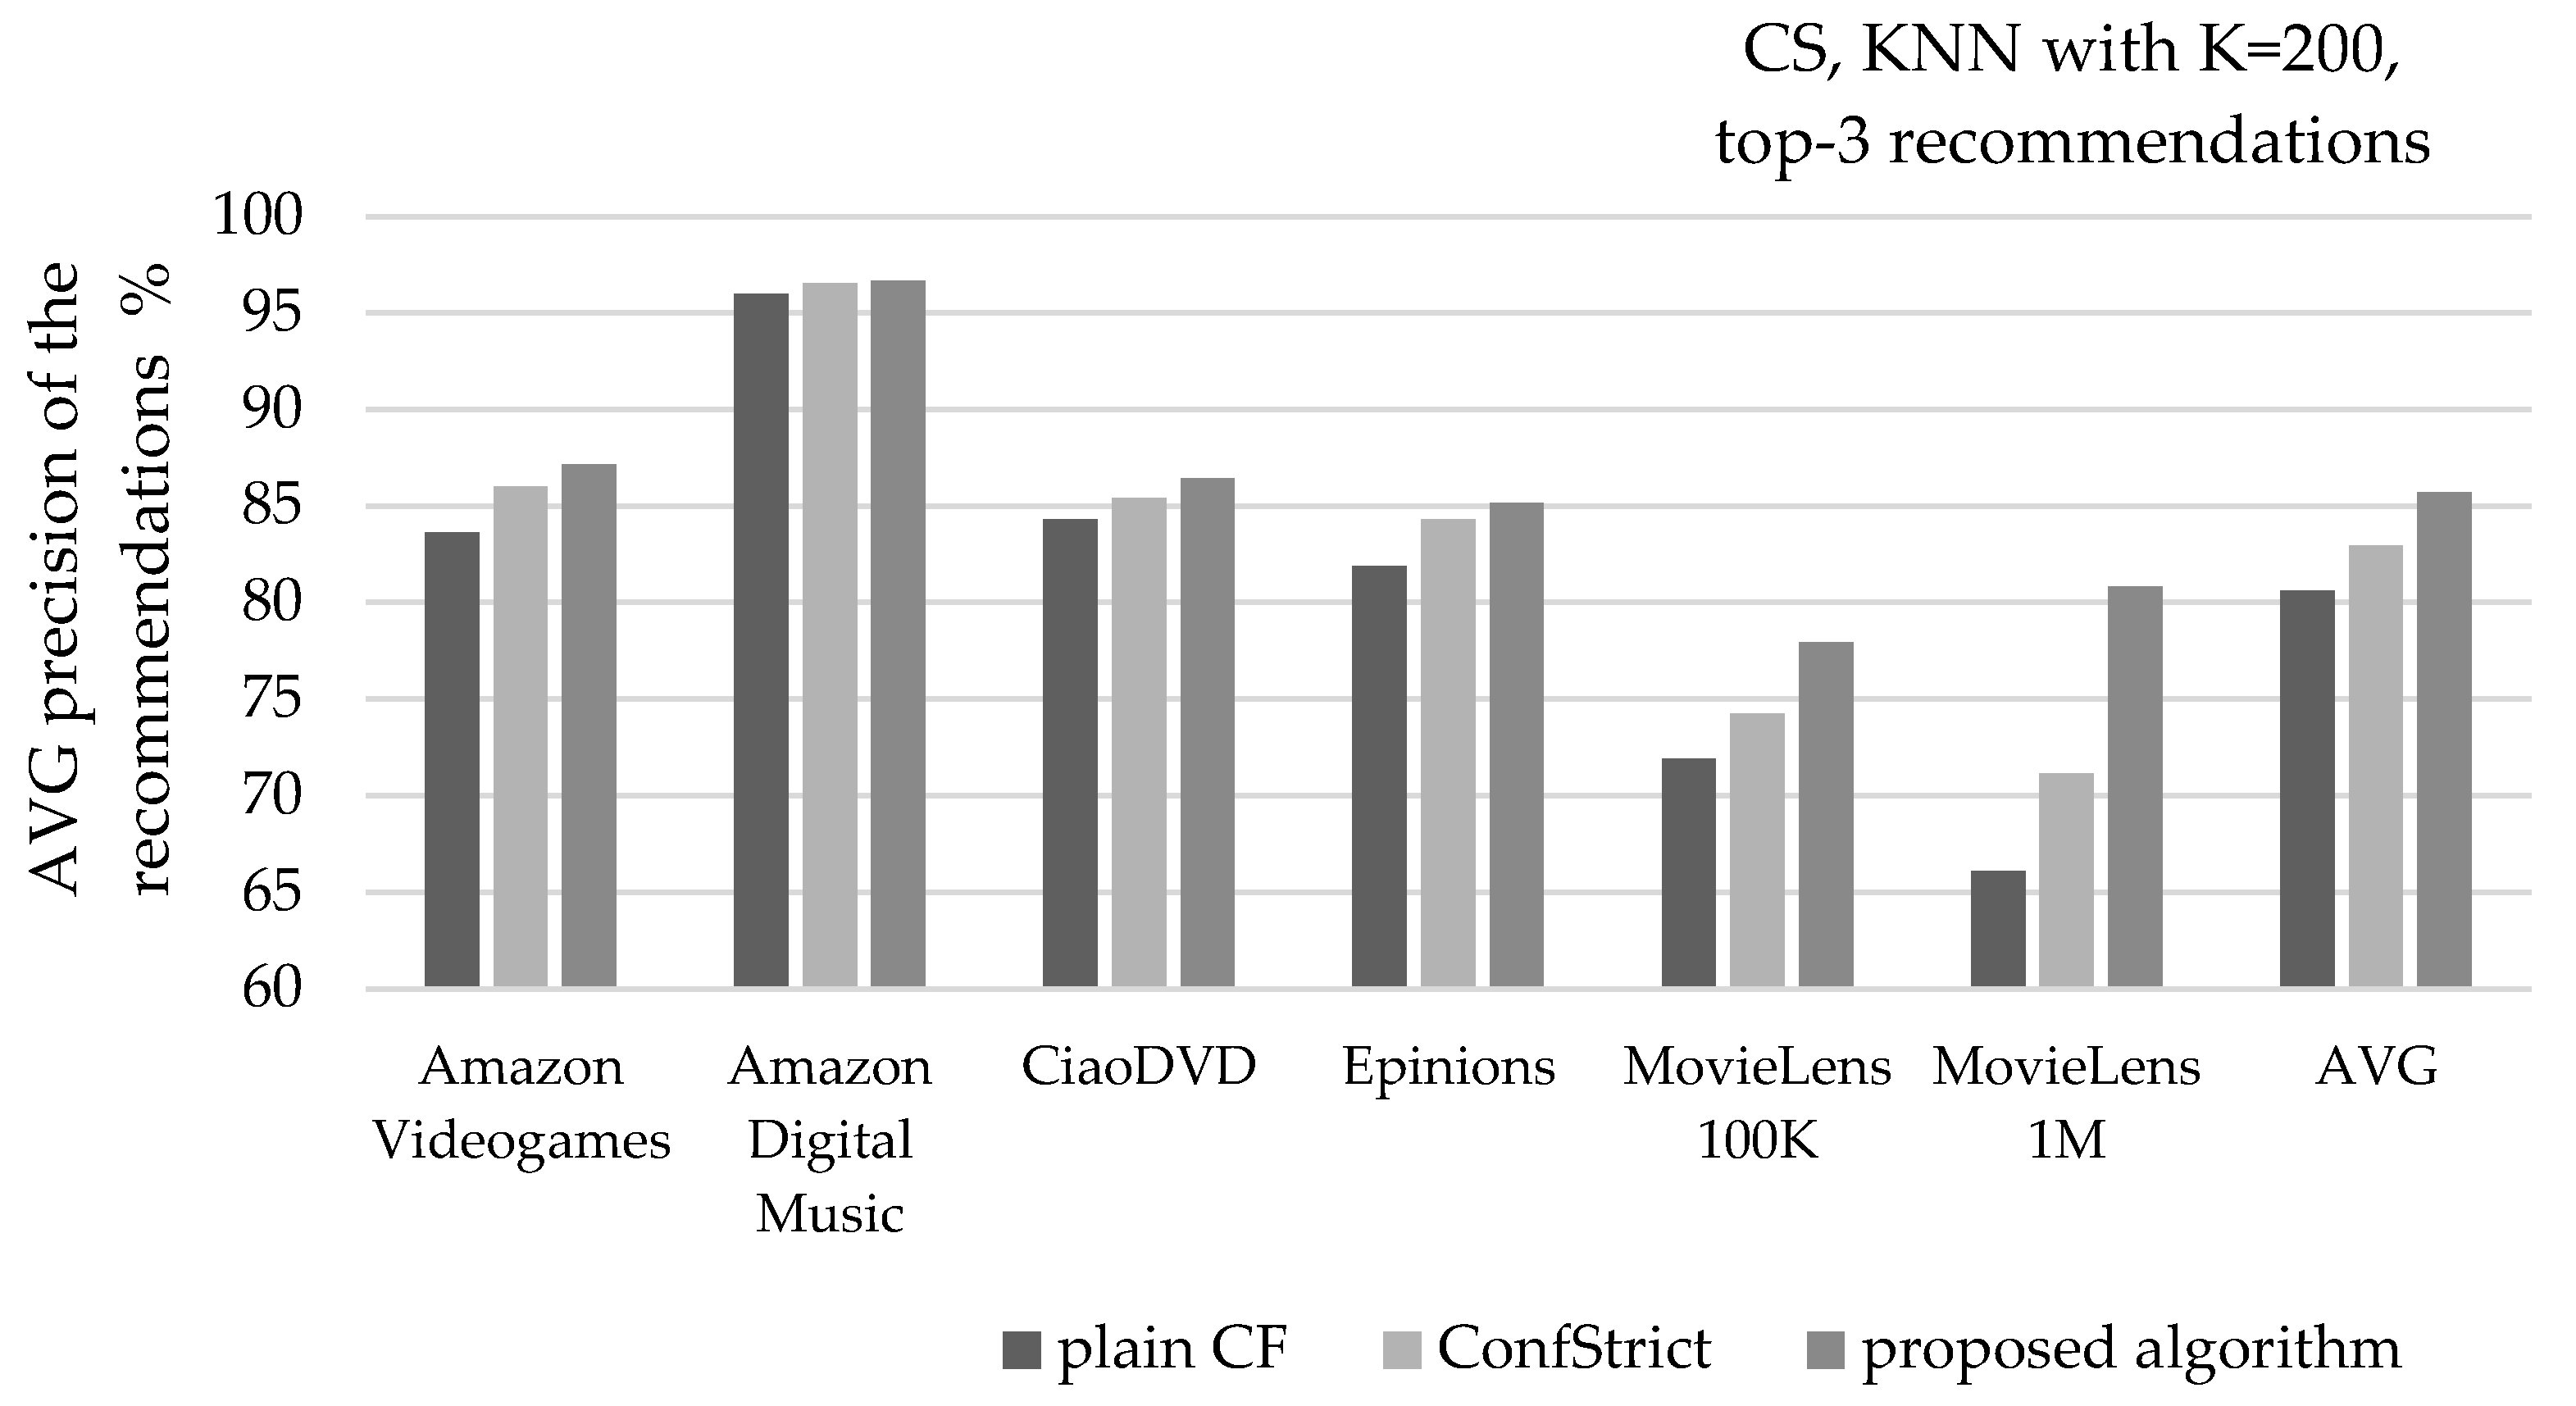
Figure 12 depicts the average precision of recommendations, when the CS similarity metric is used, along with the KNN NN selection with K = 200, and recommending 3 items per user (top-3). Considering the average of all six datasets, the presented algorithm increases the recommendation precision by 6.3% (from 80.6% to 85.7%), surpassing the corresponding improvement achieved by the ConfStrict algorithm by two times (its respective improvement is 2.9%, measured at 82.9).
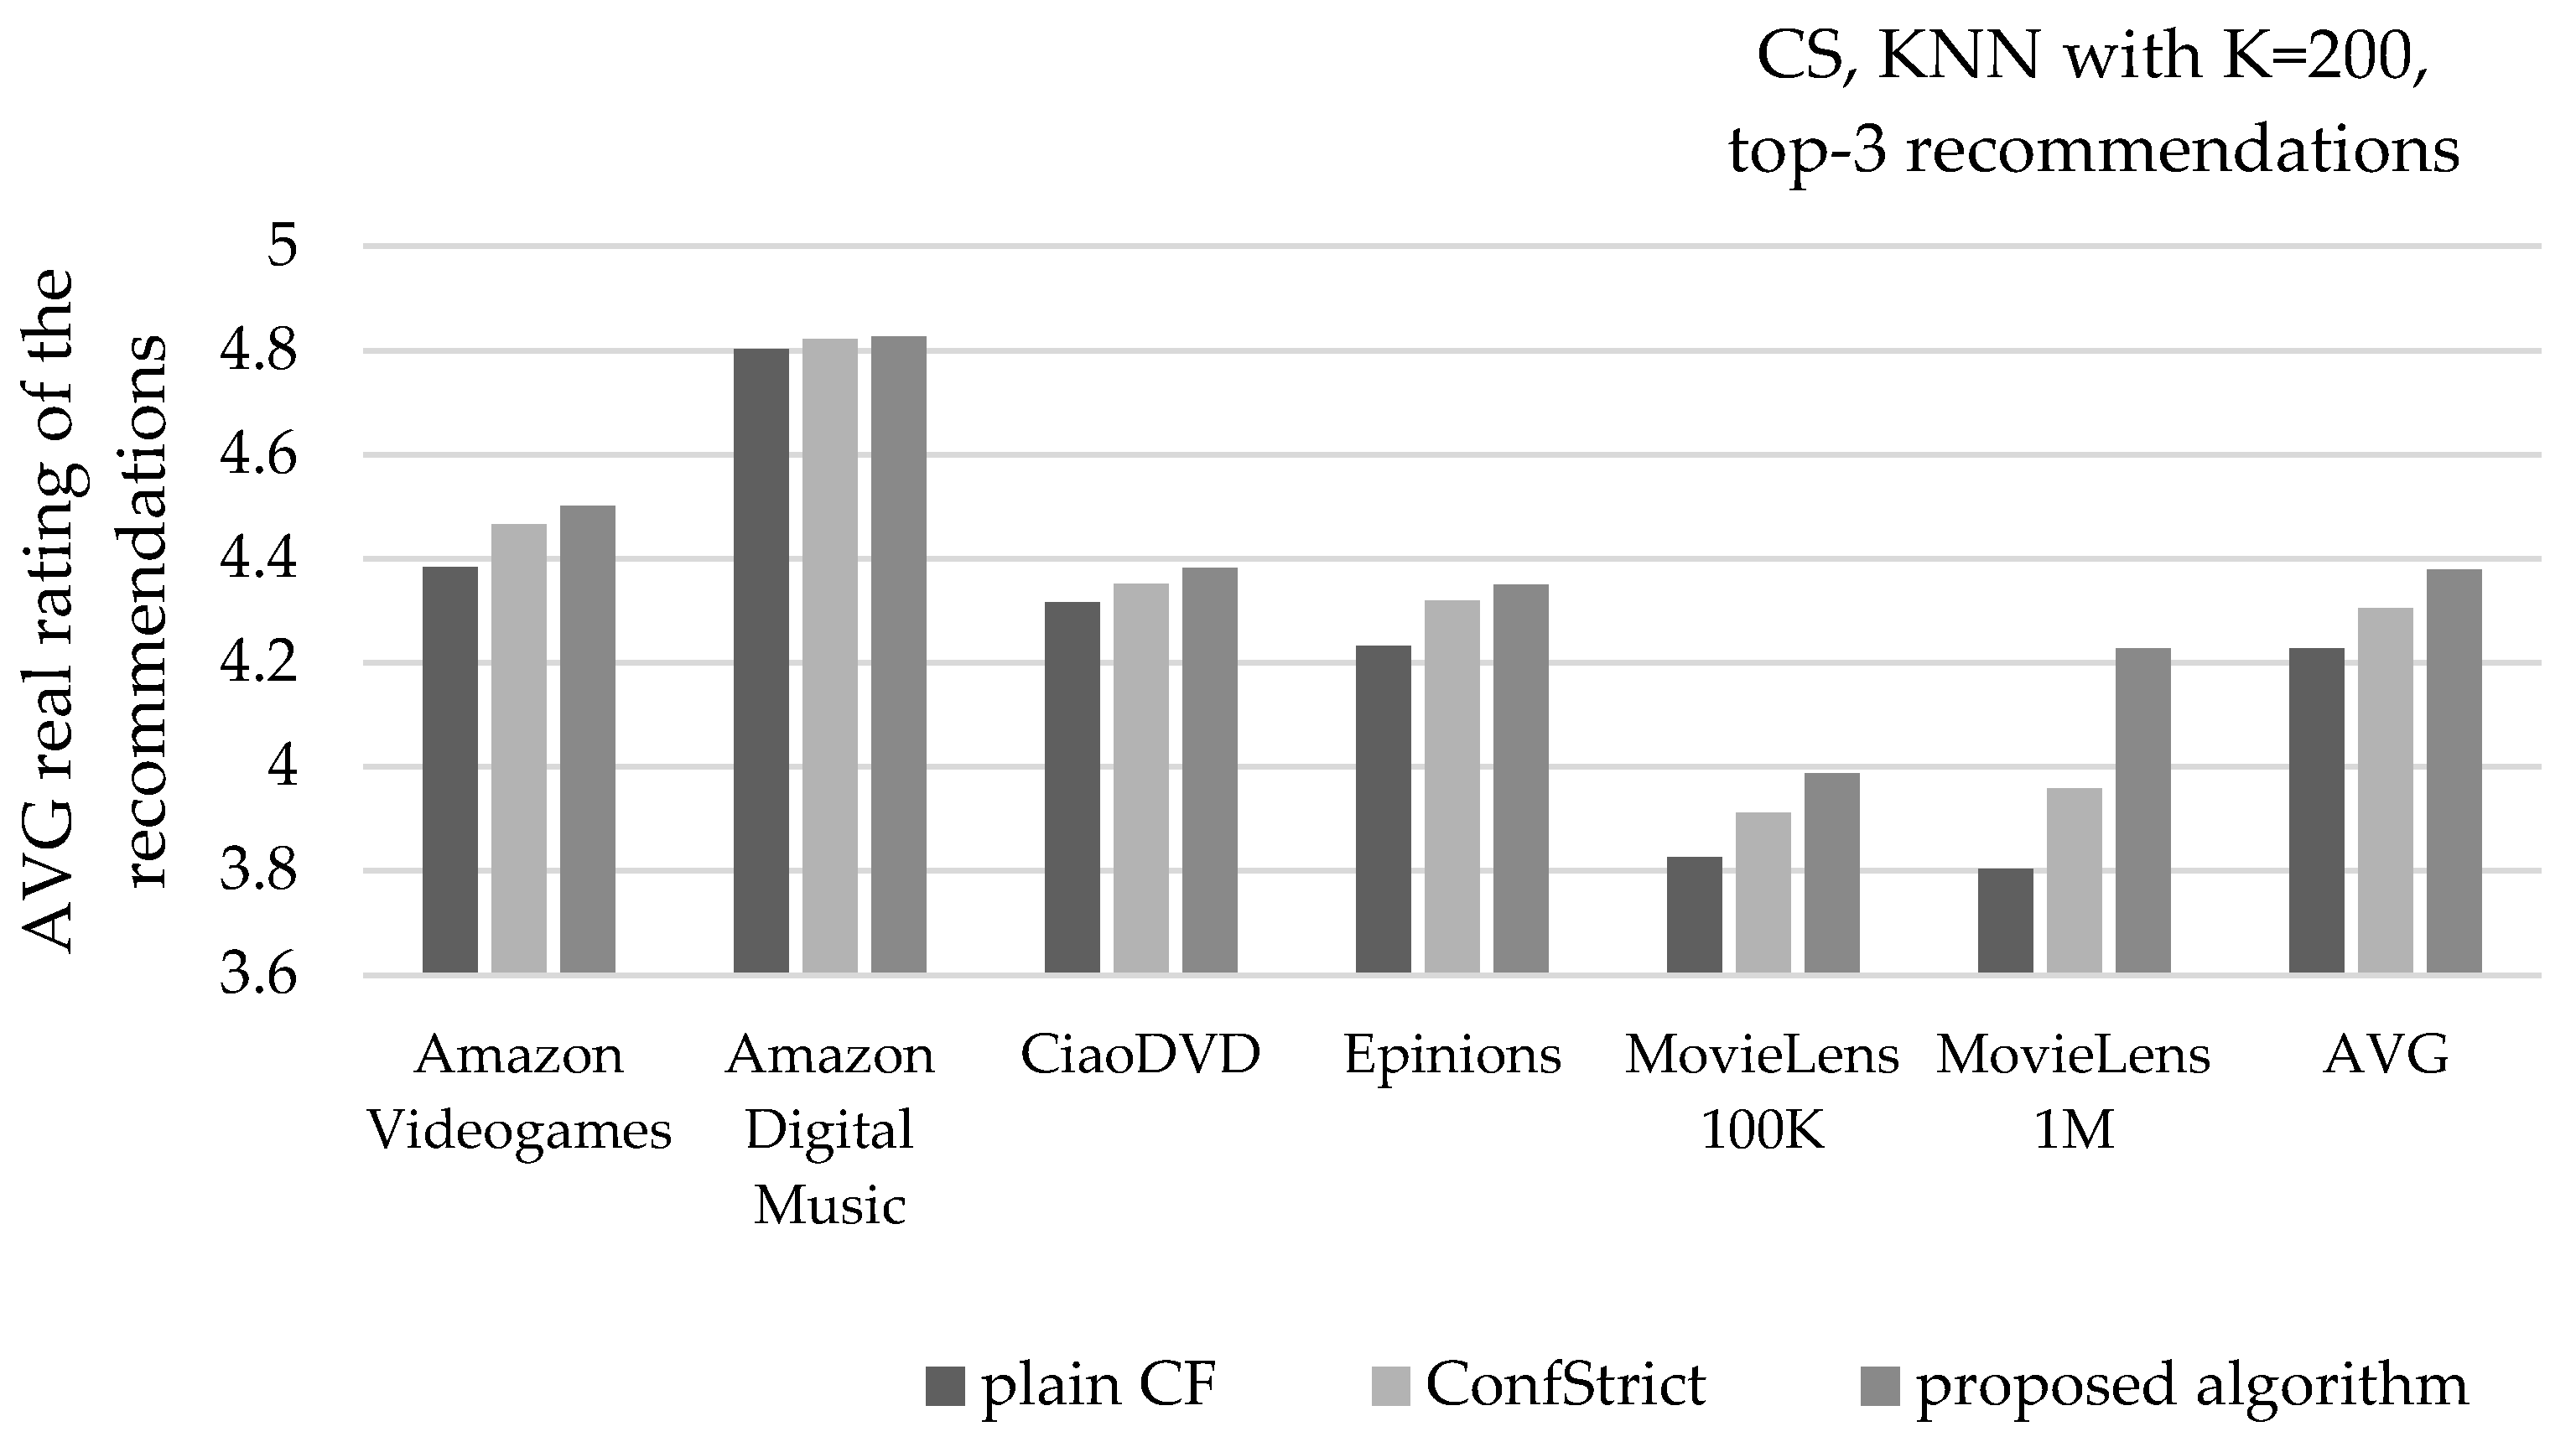
Figure 13 depicts the mean real rating value of recommendations, under the same settings. Considering the average of all six datasets, the presented algorithm increases the mean real rating value of recommendations by 3.6% (from 4.23 to 4.38), surpassing the corresponding improvement achieved by the ConfStrict algorithm by almost two times (its respective improvement is 1.8%, measured at 4.31).
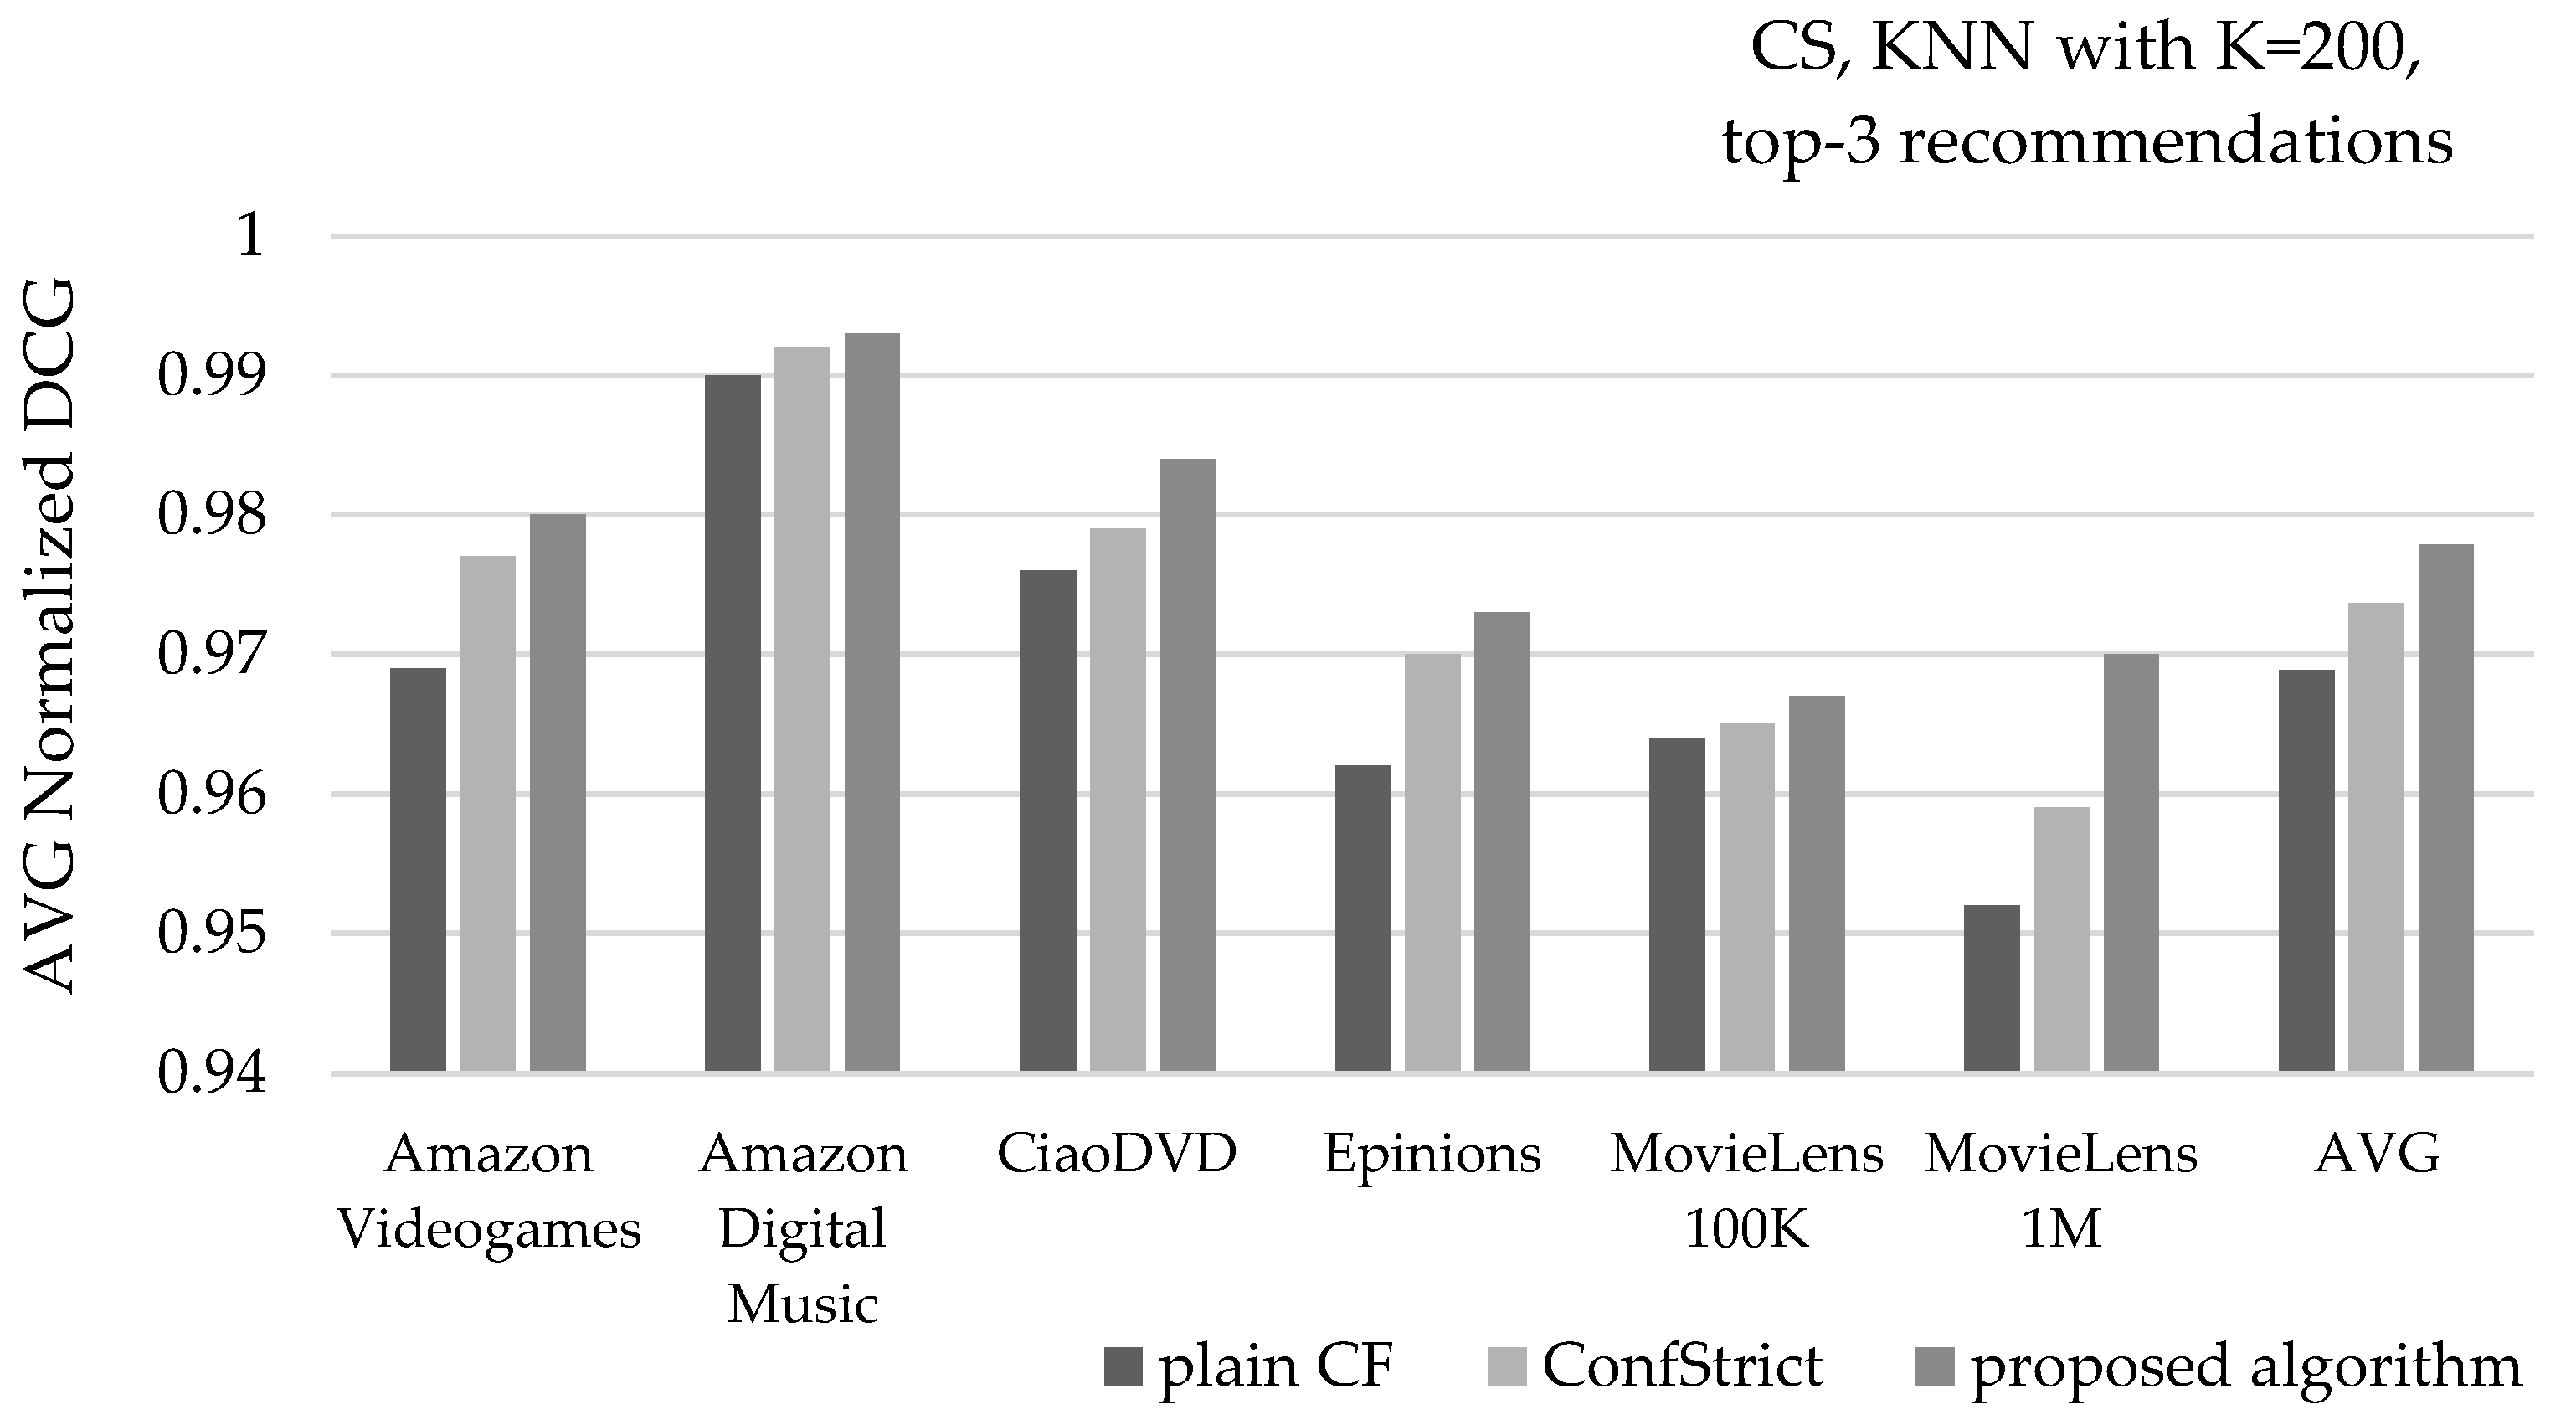
Figure 14 depicts the mean NDCG value of recommendations, under the same settings. Considering the average of all six datasets, the presented algorithm increases the mean NDCG value of recommendations from 0.969 to 0.978, surpassing the mean NDCG value achieved by the ConfStrict algorithm, measured at 0.974.
Similar results are obtained when the number of recommended items is increased to 5 (top-5 recommendations). More specifically, the recommendation precision is enhanced from 81.2% (plain CF) to 85.2%. The ConfStrict algorithm achieves a recommendation precision of 83.1%, which is inferior to the performance of the proposed algorithm. Regarding the mean real rating value of recommendations, the respective scores are 4.24 (plain CF), 4.36 (proposed algorithm), and 4.3 (ConfStrict). Regarding the mean NDCG value, the respective scores are 0.962, 0.973, and 0.968.
When K is increased to 500, similar results are obtained. More specifically, when recommending 3 items per user (top-3 recommendations) the average recommendation precision equals 81.8% (plain CF), 86.1% (presented algorithm), and 84% (ConfStrict). The average real rating value of recommendations is equal to 4.27 (plain CF), 4.4 (presented algorithm), and 4.34 (ConfStrict), and the average NDCG value equals 0.969, 0.978, and 0.974, respectively. When the number of recommended items is increased to 5 per user (top-5 recommendations), the respective results are 82.7%, 85.9%, and 84.4% regarding the recommendation precision; 4.29, 4.38, and 4.34 regarding the average real rating value of recommendations; and 0.963, 0.973, and 0.968, regarding the average NDCG value.
Figure 15 depicts the average precision of recommendations, when the CS similarity metric is used, along with the THR NN selection with T = 0.0, and recommending 3 items per user (top-3). Considering the average of all six datasets, the presented algorithm increases the recommendation precision from 85.4% to 87%, surpassing the corresponding improvement achieved by the ConfStrict algorithm, which is measured at 86.4%.
Figure 16 depicts the mean real rating value of recommendations, under the same settings. Considering the average of all six datasets, the presented algorithm increases the average real rating value of recommendations from 4.37 to 4.43, surpassing the corresponding improvement achieved by the ConfStrict algorithm, which is measured at 4.41.
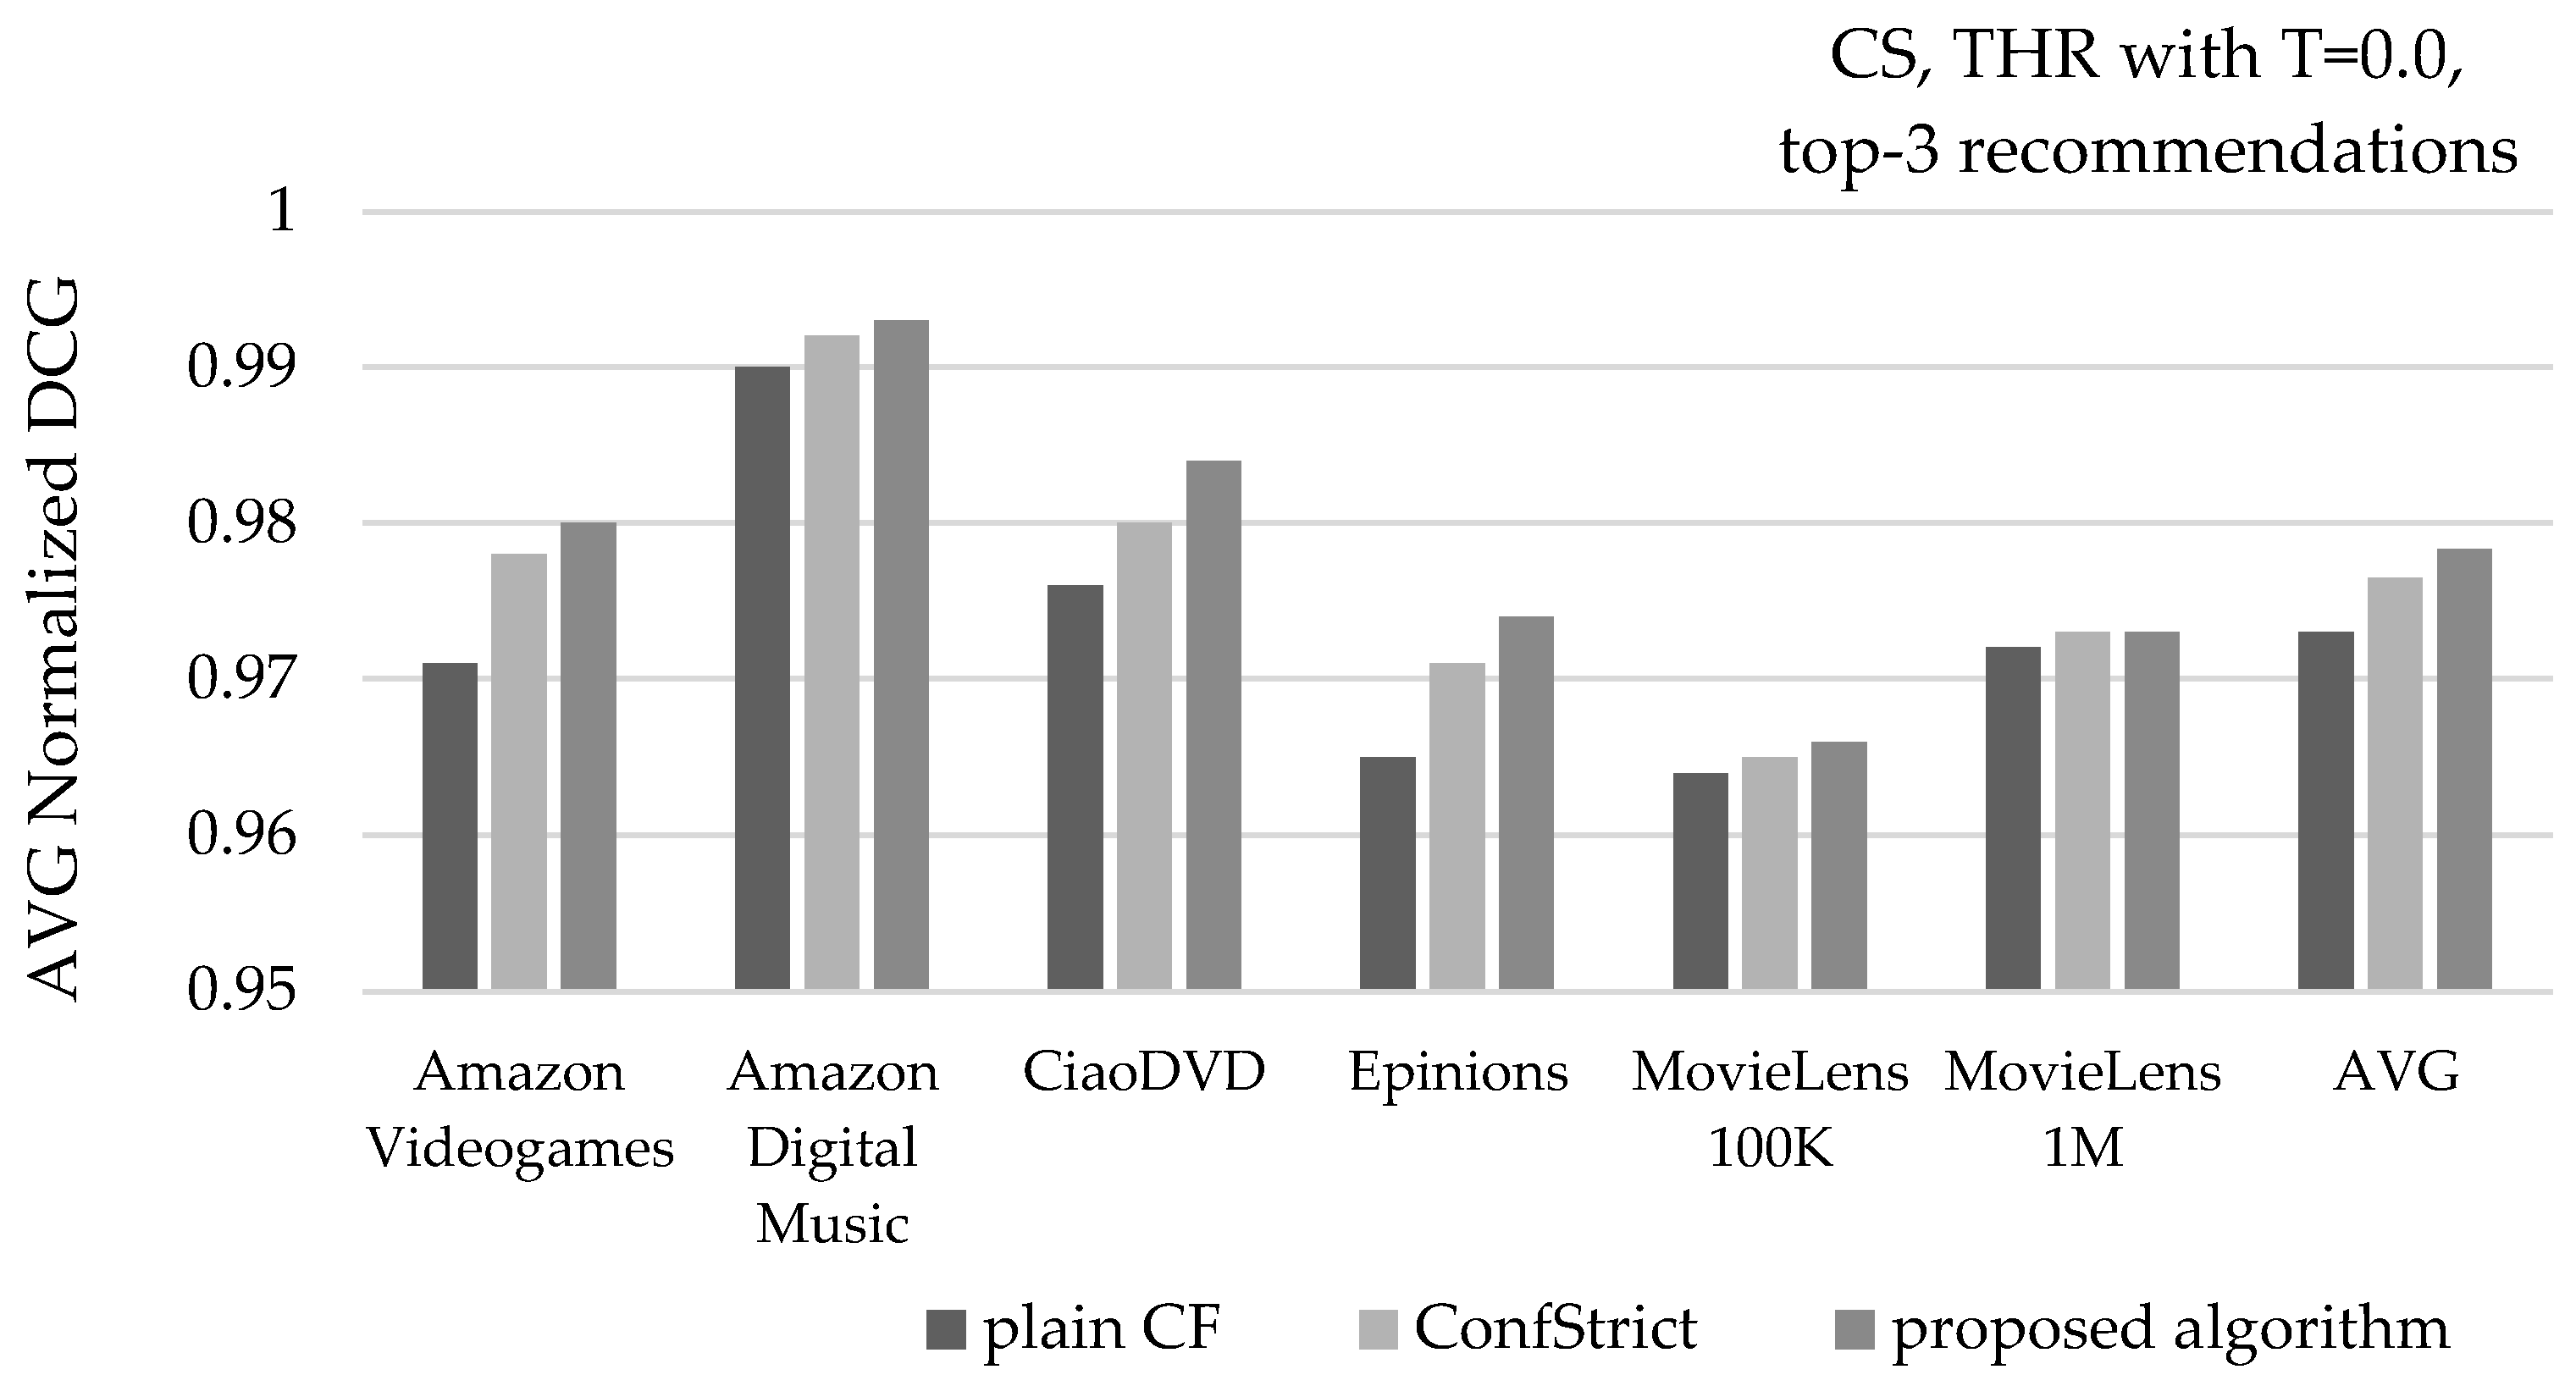
Figure 17 depicts the mean NDCG value of recommendations, under the same settings. Considering the average of all six datasets, the presented algorithm increases the mean NDCG value of recommendations from 0.973 to 0.978, surpassing the mean NDCG value achieved by the ConfStrict algorithm, measured at 0.977.
Similar results are obtained when the number of recommended items is increased to 5 (top-5 recommendations). More specifically, the recommendation precision is enhanced from 85.6% (plain CF) to 86.8%. The application of the ConfStrict algorithm achieves a precision score of 86.4%. For the mean real rating value of recommendations, the respective scores are 4.37, 4.42, and 4.4 (for the plain CF, the proposed algorithm, and the ConfStrict algorithm, respectively). For the average NDCG value, the respective scores are 0.968, 0.974, and 0.972.
When T is increased to 0.5, similar results are obtained again. More specifically, when recommending 3 items per user (top-3 recommendations), the average recommendation precision is equal to 85.3% (plain CF), 87% (presented algorithm), and 86.5% (ConfStrict algorithm). The average real rating value of recommendations equals 4.37 (plain CF), 4.43 (presented algorithm), and 4.41 (ConfStrict algorithm), and the average NDCG value is equal to 0.974, 0.978, and 0.977, respectively. When the number of recommended items is increased to 5 per user (top-5 recommendations), the respective results are 85.6%, 86.8%, and 86.4% regarding the recommendation precision; 4.37, 4.41, and 4.40 regarding the average real rating value of recommendations; and 0.968, 0.974, and 0.972 regarding the average NDCG value.
4.4. Execution Overhead of the Presented Algorithm
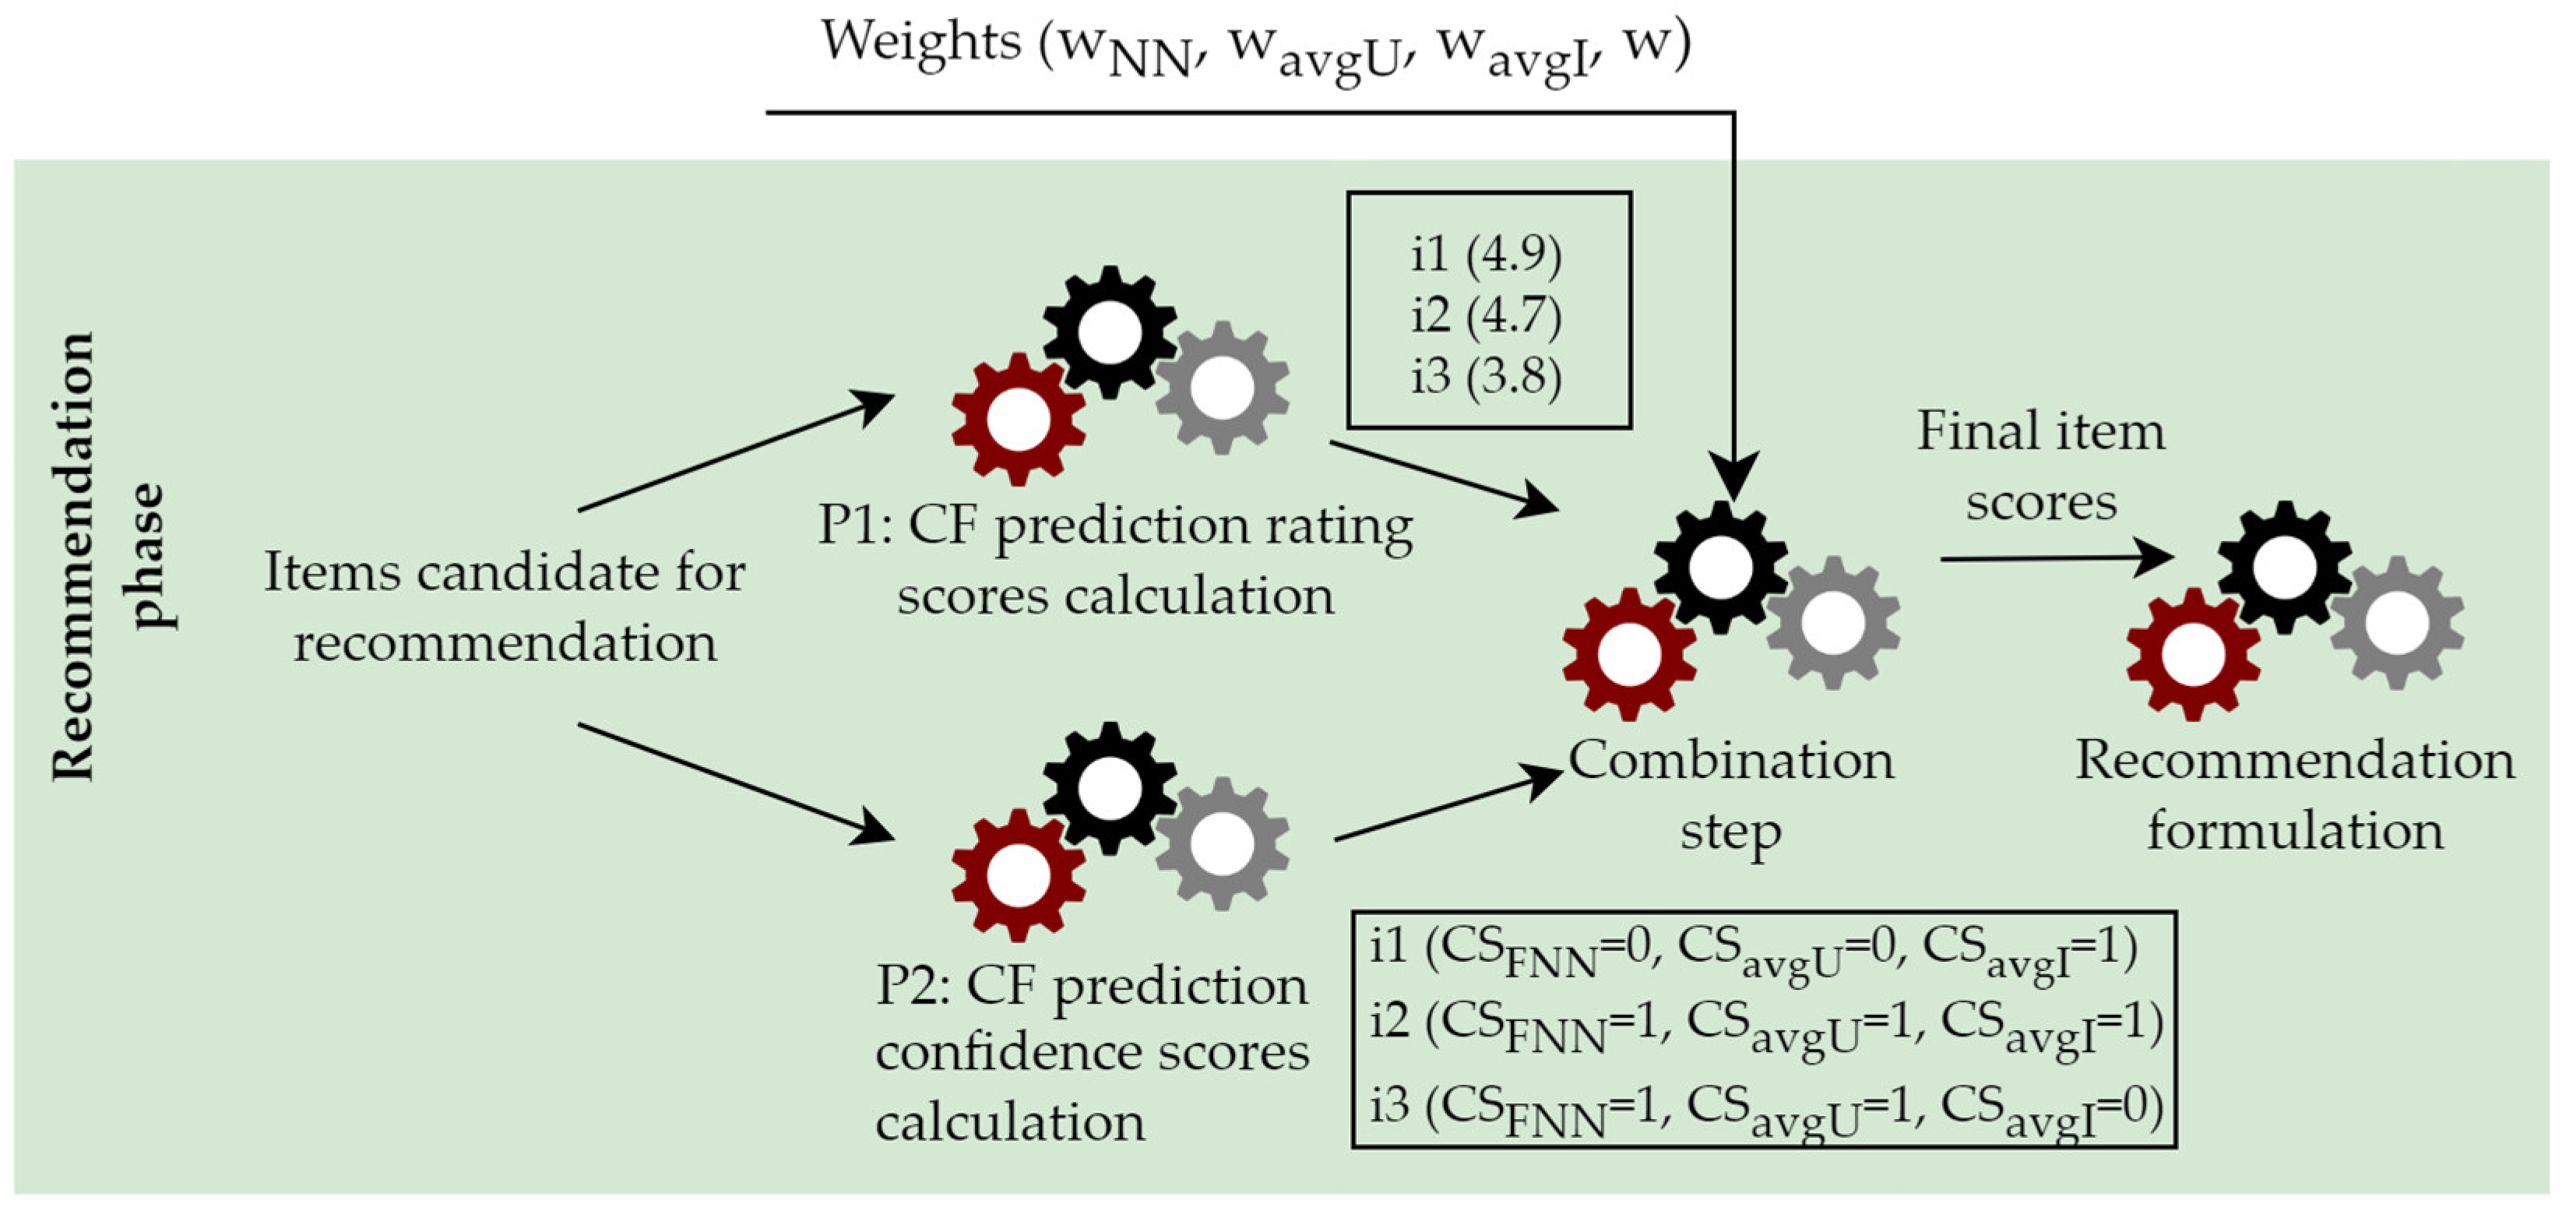
The presented algorithm introduces a distinct overhead, when compared to the plain CF algorithm. More specifically, as depicted in
Figure 1, along with the CF rating prediction arithmetic score calculation, the prediction confidence score also has to be calculated (i.e., the NN number of each rating prediction), as well as the average rating values of each user and item. Apart from the case that these computations can be easily performed offline, when all these computations are selected to be performed online, the overhead is considered negligible.
At this point, the following aspects are worth noting:
The number of NNs that contribute to the computation of a rating prediction is determined and used during the rating prediction computation phase; therefore, the computation of the CS
FNN(AU,i) score necessitates only one additional comparison with the relevant threshold (c.f.
Section 3.2).
The average of the ratings entered by a user, needed for the computation of the CS
avgU(AU,i) score related to rating predictions is needed in order in the process of applying the mean-centered formula to compute the rating prediction. Hence, similarly to the previous case, only two additional comparisons are needed with the high and low thresholds (c.f.
Section 3.2).
The average of all ratings entered for an item, needed for the computation of the CSavgI(AU,i) score related to rating predictions is not typically needed in user-based CF. Hence, an additional computation process needs to be established. This can be performed by scanning the rating matrix, and the complexity of this process is linear with respect to the overall number of ratings O(#ratings). This process can be integrated with the computation of the average of the ratings entered by each user (step 2, above), reducing the overall overhead.
The computation of the final recommendation score FRSAU,i entails only the evaluation of a weighted average formula with four terms, introducing thus minimal overhead.
Finally, the recommendation list needs to be sorted in a descending order of the FRSAU,i score. This step introduces no additional overhead in comparison to the plain CF algorithm, where the same list would be again sorted in descending order of the rating prediction value.
Moreover, the memory requirements for the proposed algorithm are small, since only the average of all ratings entered for each individual item needs to be stored. This necessitates the storage of a floating point value per item, which is less than 10 MBytes for all datasets used in this paper and, in all cases, significantly lower than other structures needed for the recommendation, such as the user–item rating matrix.
In order to quantify the performance impact of the proposed algorithm, we measured the execution overhead of all datasets used in this work, analyzed in
Table 1. It was found to be less than 1.5% in all cases.
Figure 18 and
Figure 19 illustrate the overhead of the ConfStrict and the proposed algorithm under two scenarios (PC similarity metric and the top-K NN selection method with K = 200; CS similarity metric and the threshold NN selection method THR = 0.0, respectively). These diagrams assert that (i) the overhead introduced by the proposed algorithm is small, and (ii) the overhead introduced by the proposed algorithm is significantly lower than the overhead introduced by the ConfStrict algorithm.
Based on the above, the answer to research question RQ4 can be stated as follows:
5. Discussion
The evaluation output displayed in the previous section showed that the proposed algorithm achieves to enhance recommendation quality, as evaluated using the recommendation precision, real rating value, and NDCG metrics.
The proposed algorithm has been found to surpass the performance of the algorithm introduced in [
8] in every dataset and setting used (similarity metric, NN method selection, etc.). More specifically, the average recommendation precision value of the proposed algorithm (of all settings) has been calculated at 86.9%. The average recommendation precision value of the algorithm introduced in [
8] has been calculated at 85.4% (the respective precision value of the plain CF algorithm is 83.8%). Regarding the real rating value of the recommendations, the proposed algorithm’s value has been calculated at 4.41/5 versus 4.37/5 of that of the algorithm introduced in [
8] (the respective precision value of the plain CF algorithm is 4.32/5). Lastly, regarding the NDCG metric, the proposed algorithms’ NDCG value has been calculated at 0.977 versus 0.974 from the algorithm introduced in [
8] achieved (the respective NDCG value of the plain CF algorithm is 0.969).
5.1. Statistical Significance of Results
In order to verify the statistical significance of the performance gains presented in
Section 4, we conducted an ANOVA analysis of the obtained measurements, comparing the respective metrics (real rating of recommended items, precision, NCDG) of the recommendations offered to users under the different algorithms. The results are presented in
Table 2; for conciseness purposes, only two experiments are reported per dataset as follows: (i) Top-K NN selection method with K = 200 under the PC similarity metric, and (ii) Threshold selection method with T = 0.0 under the CS similarity metric. The results obtained for the other setups per dataset are in close agreement with those obtained for the same dataset and the same similarity metric. In
Table 2, the results marked with two stars (**) indicate statistical significance at level a = 0.01, while results marked with one star (*) indicate statistical significance at level a = 0.05.
In
Table 2 we can observe that for most experiments (66% of the total number of the reported metrics) statistical significance is established. The MovieLens 100 K dataset is a notable exception, where statistical significance could not be established for any metric under any parameter setup. This was traced to the low number of users in the MovieLens 100 K dataset (600), which limited the number of samples in the population and therefore the potential to establish statistical significance. No statistical significance was established for any of the metrics for the MovieLens 1 M dataset under the CS similarity measure. This was expected, since—as shown in
Figure 15,
Figure 16,
Figure 17 and
Figure 18—the performance difference between ConfStrict and the proposed algorithm is marginal. Overall, the proposed algorithm has achieved statistically significant improvements in at least one performance metric (average rating, precision, NDCG) in 75% of the examined scenarios.
Based on the above, the answer to research question 1 can be stated as follows:
Answer to RQ1: the combination of confidence factors and rating prediction scores can lead to more successful recommendations, leading to statistically significant improvements in one or more recommendation quality metrics (average rating, precision, NDCG) in 75% of the examined scenarios.
5.2. Coverage
Contrary to the work presented in [
7], which also considers rating prediction confidence factors, this work does not eliminate rating predictions to become recommendations and, therefore, it does not reduce prediction coverage at all. This makes the proposed algorithm appropriate to also be utilized in CF datasets with high sparsity, which (due to their sparsity) suffer from low rating prediction coverage. Indicative cases of sparse datasets are the CiaoDVD, the Amazon VideoGames, the Amazon Digital Music and the Epinions datasets, which have been used in the evaluation section.
5.3. Resilience Against Attacks
In this subsection, we investigate the resilience of the proposed algorithm against four attack types, namely random attack, average attack, bandwagon attack, and segment attack, which are discerned as being widely applicable on RecSys [
55]. Experiments were performed on all datasets listed in
Table 1; however, for conciseness purposes, we report only on the results obtained for MovieLens, since (a) the results obtained for other datasets were highly similar, and (b) the MovieLens dataset is used as a testbed in other works, including [
30,
55], therefore a result comparison is facilitated. Attack datasets were generated using the tool supplied in [
56], which implements the methods described in [
32,
57]. In all attacks, 5% of the items were targeted, and the number of fake profiles was set equal to 10% of the benign profiles. The number of ratings in fake profiles was set to the median of the benign users’ profiles, under the rationale of attackers simulating the behavior of typical users, in an attempt to evade detection.
Figure 20,
Figure 21 and
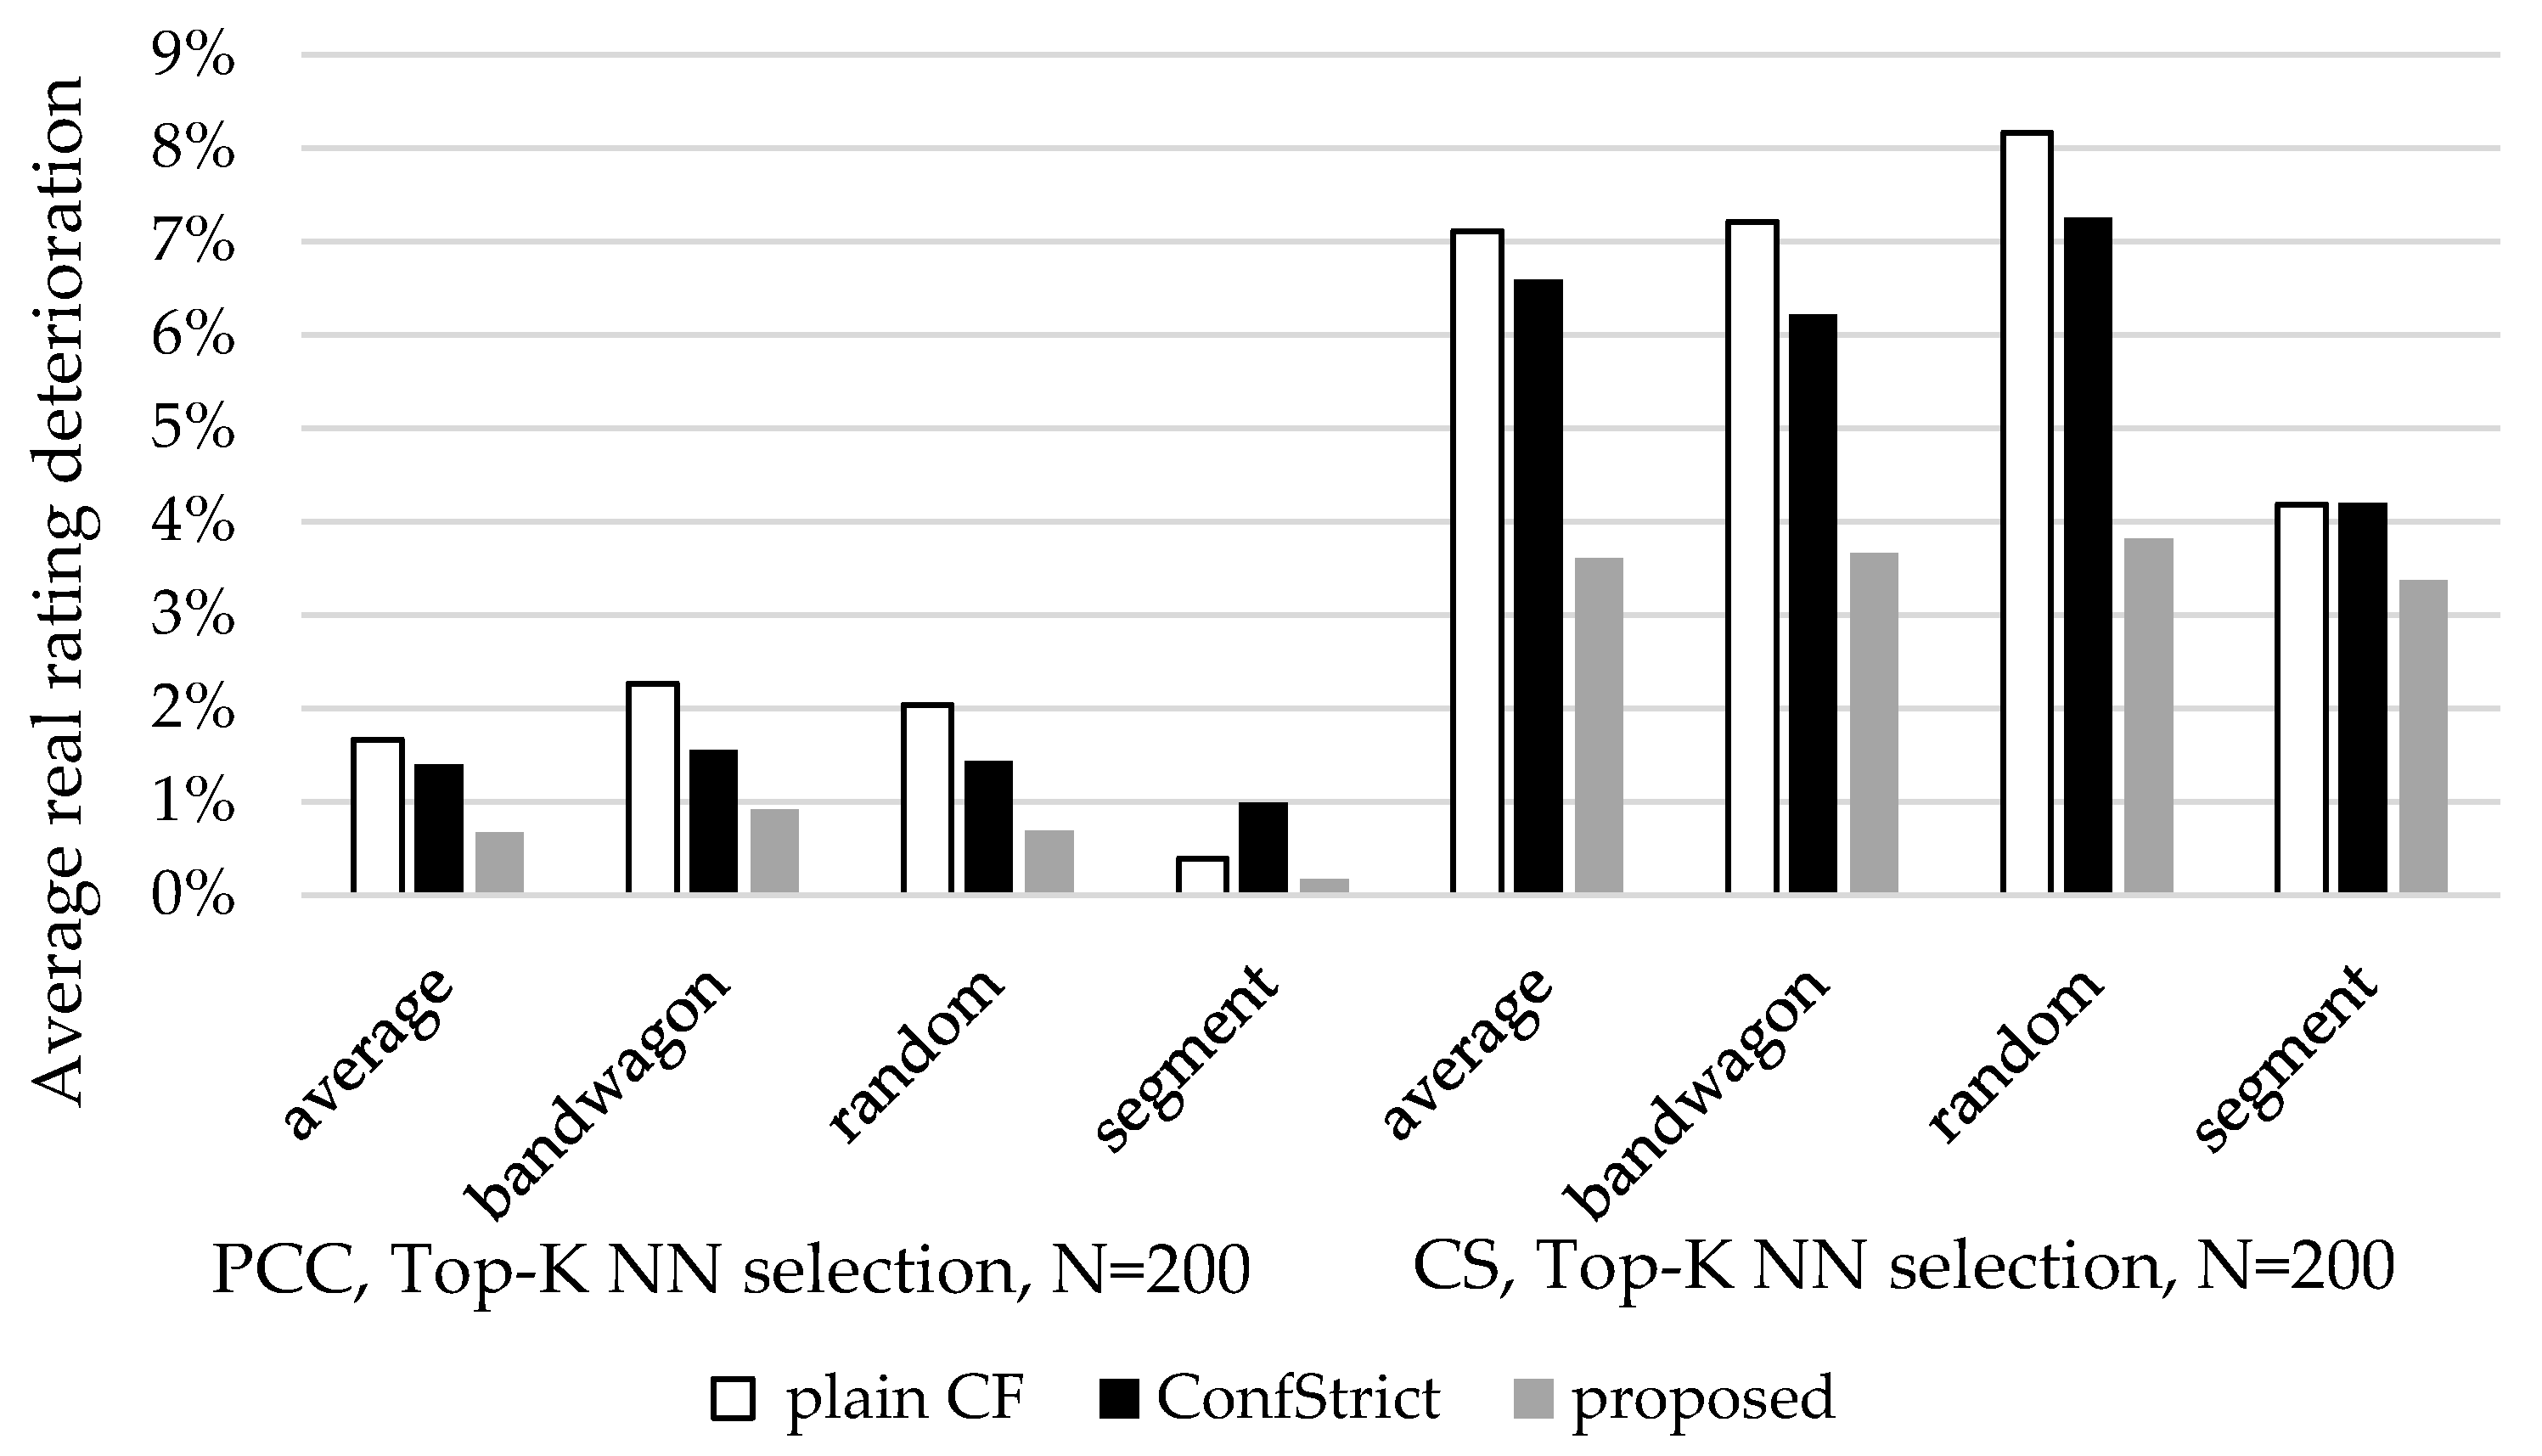
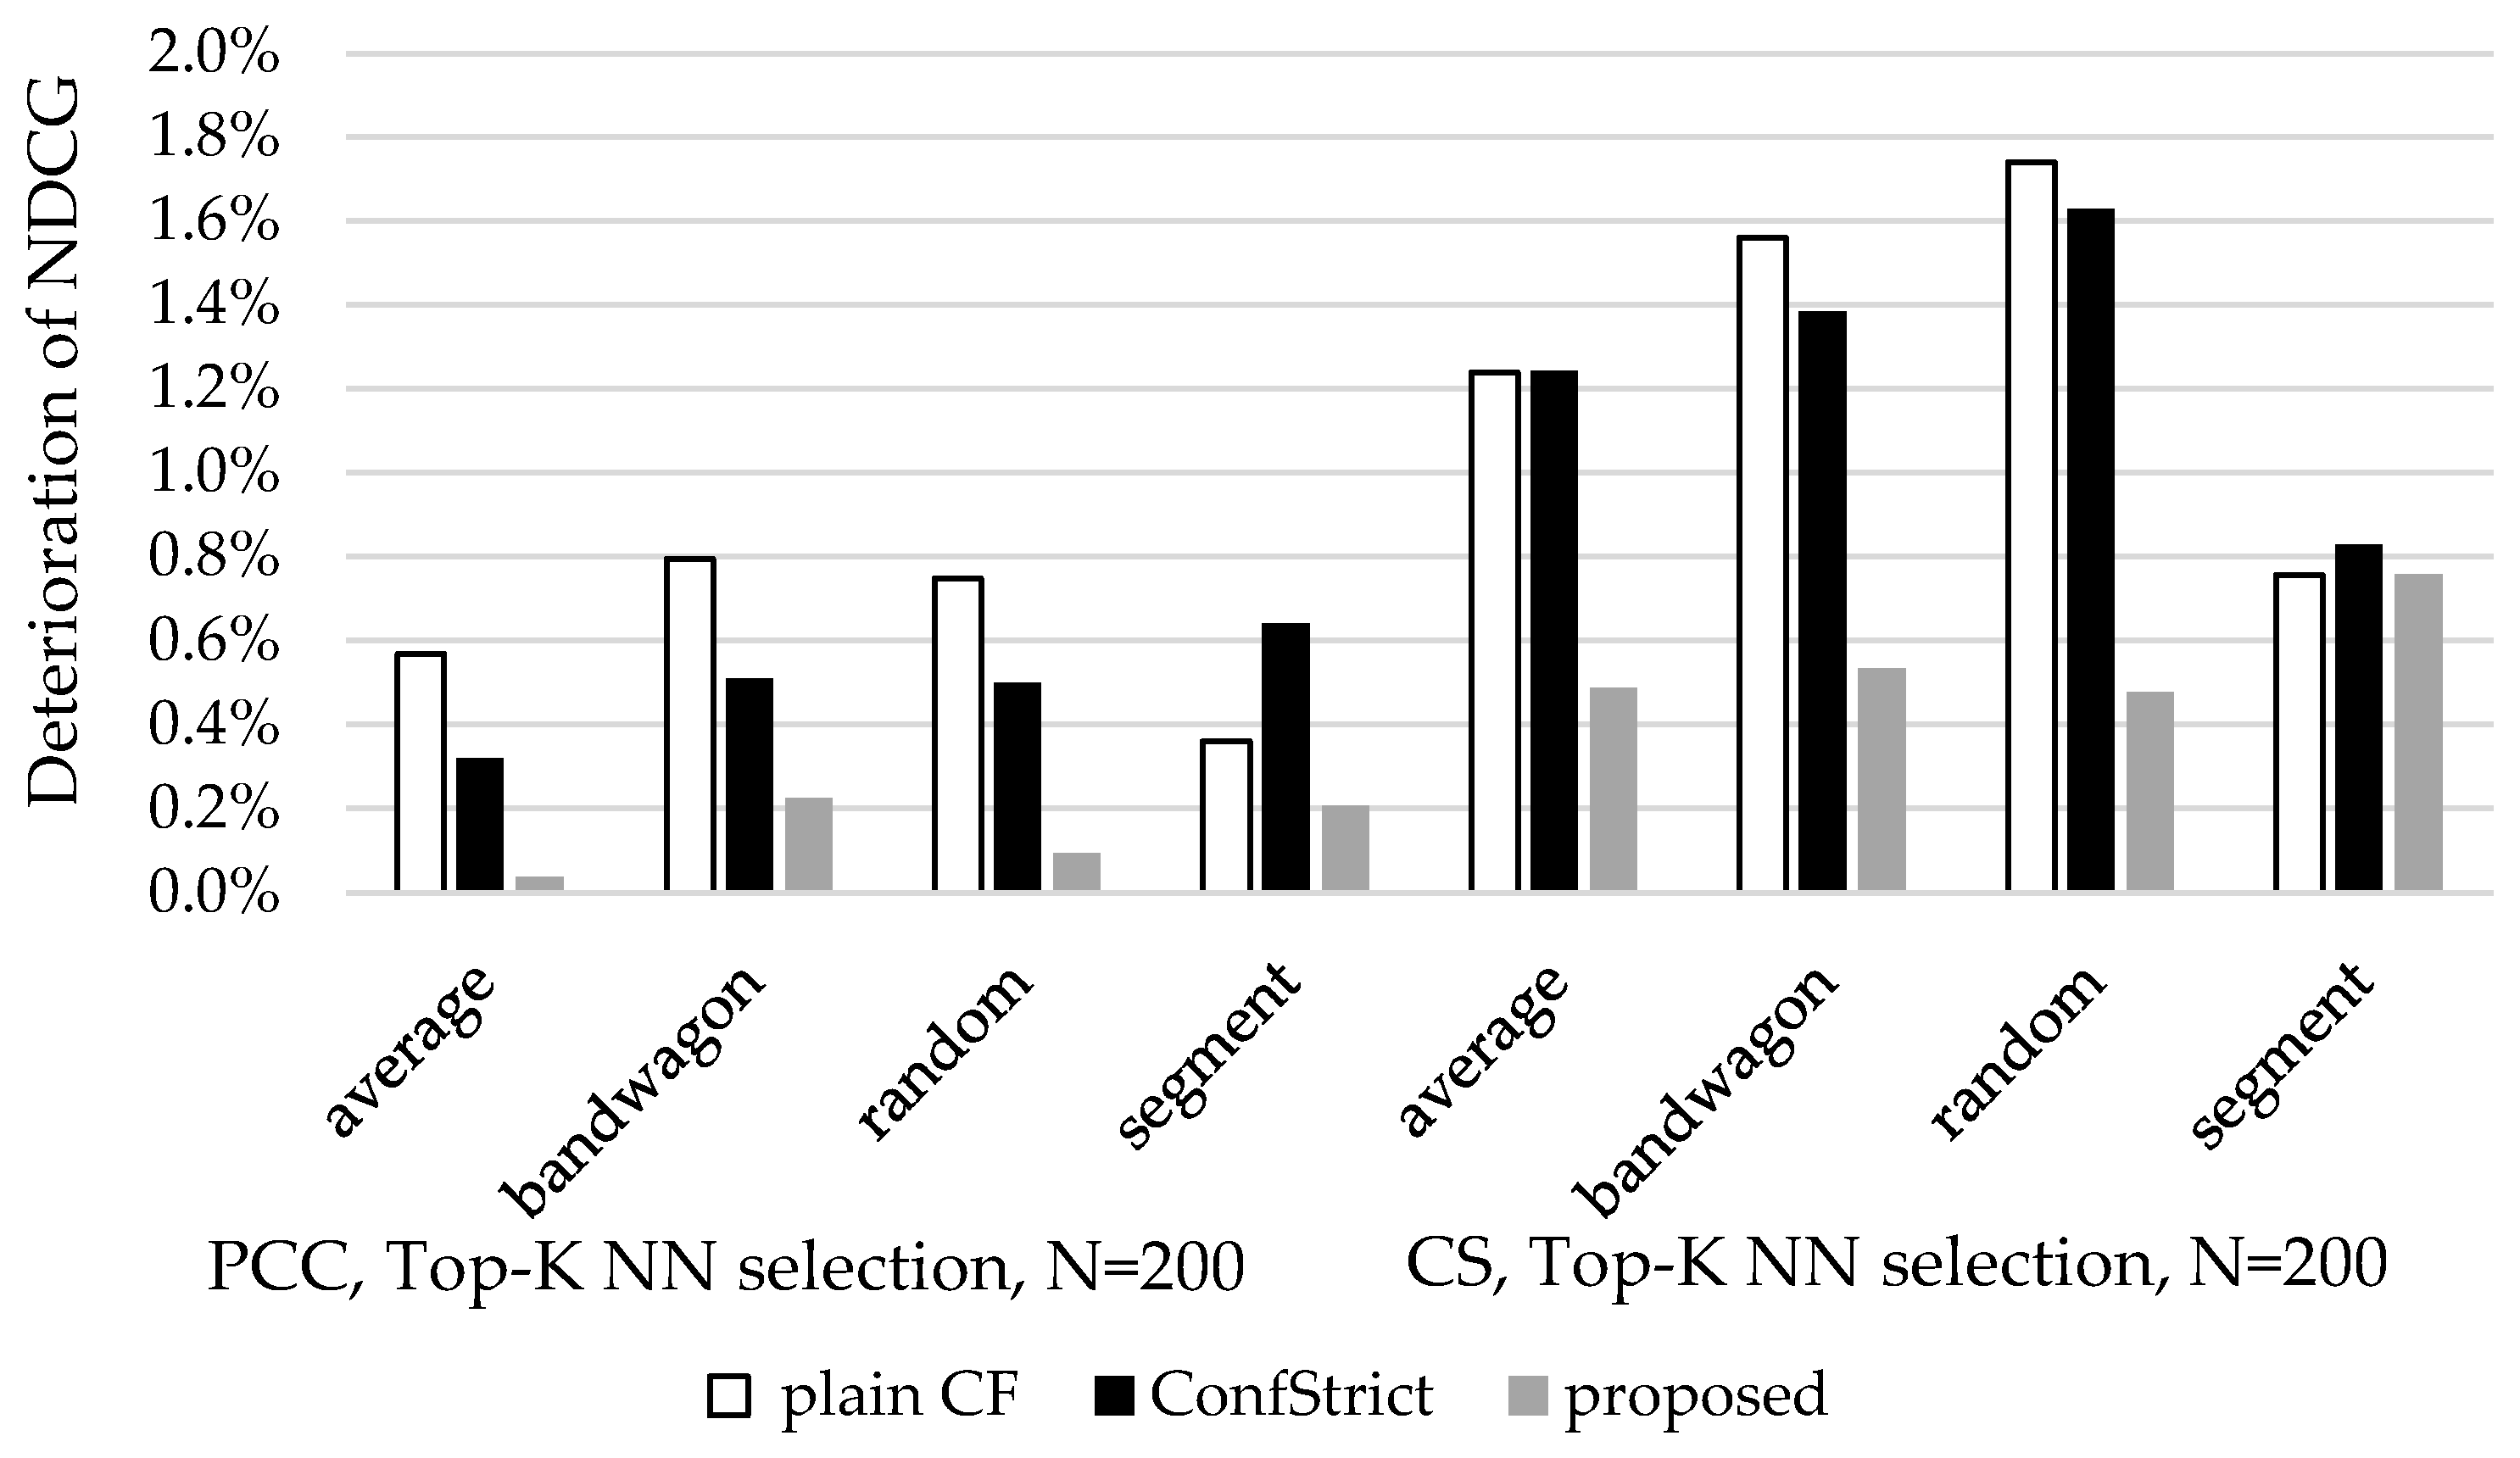
Figure 22 depict the deterioration of the three metrics (average real rating, recommendation precision, and NDCG) for the three algorithms (plainCF, ConfStrict, proposed) under different attack scenarios (average, bandwagon, random and segment) and varying similarity computation methods (PC and CS). Similar results have been obtained for the threshold-based NN selection method, and these results are not included here for brevity. In the three figures, we can observe that the proposed algorithm is the most resilient, exhibiting limited deterioration under all scenario attacks and parameter settings, as compared to the plain CF and ConfStrict algorithm. This is attributed to the fact that out of all three confidence factors, attacks are bound to affect only the mean rating value of the attack-boosted item, corresponding to factor F_avgI. The F_avgU factor is clearly not affected, since this depends only on the ratings of the benign user U. The F_NNc confidence factor, corresponding to the number of NNs contributing to the rating prediction of the attack-boosted item, has been observed to be affected only in very few occasions, which account for less than 1% of the overall cases. In these occasions, the number of benign profiles in the active user’s NN that contribute to the formulation of the rating prediction for the boosted item is marginally lower than the threshold for fulfilling the F_NNc confidence factor, and the addition of fake profiles increases the contributing number of NNs sufficiently to fulfill the F_NNc confidence factor.
Additionally, when benign NNs that have rated the attack-boosted item do exist, the effect of the fake profiles on the final rating prediction will be limited. After the results were analyzed, it was found that only items that would (a) have at least two benign NNs contributing to the rating prediction, and (b) having a rating prediction greater or equal to 3.15 based on the benign NNs, might be included in the final recommendation.
Consequently, typically there exist items fulfilling more confidence factors than the attack-boosted ones, and/or have higher rating prediction, and therefore these items achieve higher overall prediction score than the attack-boosted ones and, hence, take precedence in the recommendation.
Regarding nuke attacks, a nuked item is bound to be demoted to a lower confidence factor class by ceasing to satisfy the F_avgI factor. This might be partially compensated if the introduction of fake profiles enriches the near neighborhood of the user in such a way that the rating prediction now satisfies the F_NNc confidence factor, while previously it did not (c.f., the above discussion on boosting attacks). This has been found to affect individual items in some cases, but not the overall recommendation quality measured by the three metrics (average real rating, rating precision, NDCG).
On the other hand, the ConfStrict algorithm is more exposed since, if an attack-boosted item is moved to a higher class due to the effect of fake profiles, it takes precedence over benign items that may have lower rating prediction values. Finally, the plain CF algorithm is more exposed to attacks, since increased rating predictions suffice for an item to be included in the recommendation.
In
Figure 20,
Figure 21 and
Figure 22, we can also notice that the effect of attacks is more intense when CS is used for measuring similarity, as compared to the cases when user vicinity is measured using the PC algorithm. This is expected, since PC amortizes the rating values with the mean of each user’s rating, and since attacks for boosting items typically include many high values (for the boosted items), the contribution of each fake profile to the increase of an item’s prediction is more limited than in the case of CS.
Finally, we applied the CNN-LSTM hybrid shilling attack detector [
58] on the “poisoned” datasets to obtain sanitized datasets, which were subsequently used for generating recommendations. The CNN-LSTM hybrid shilling attack detector [
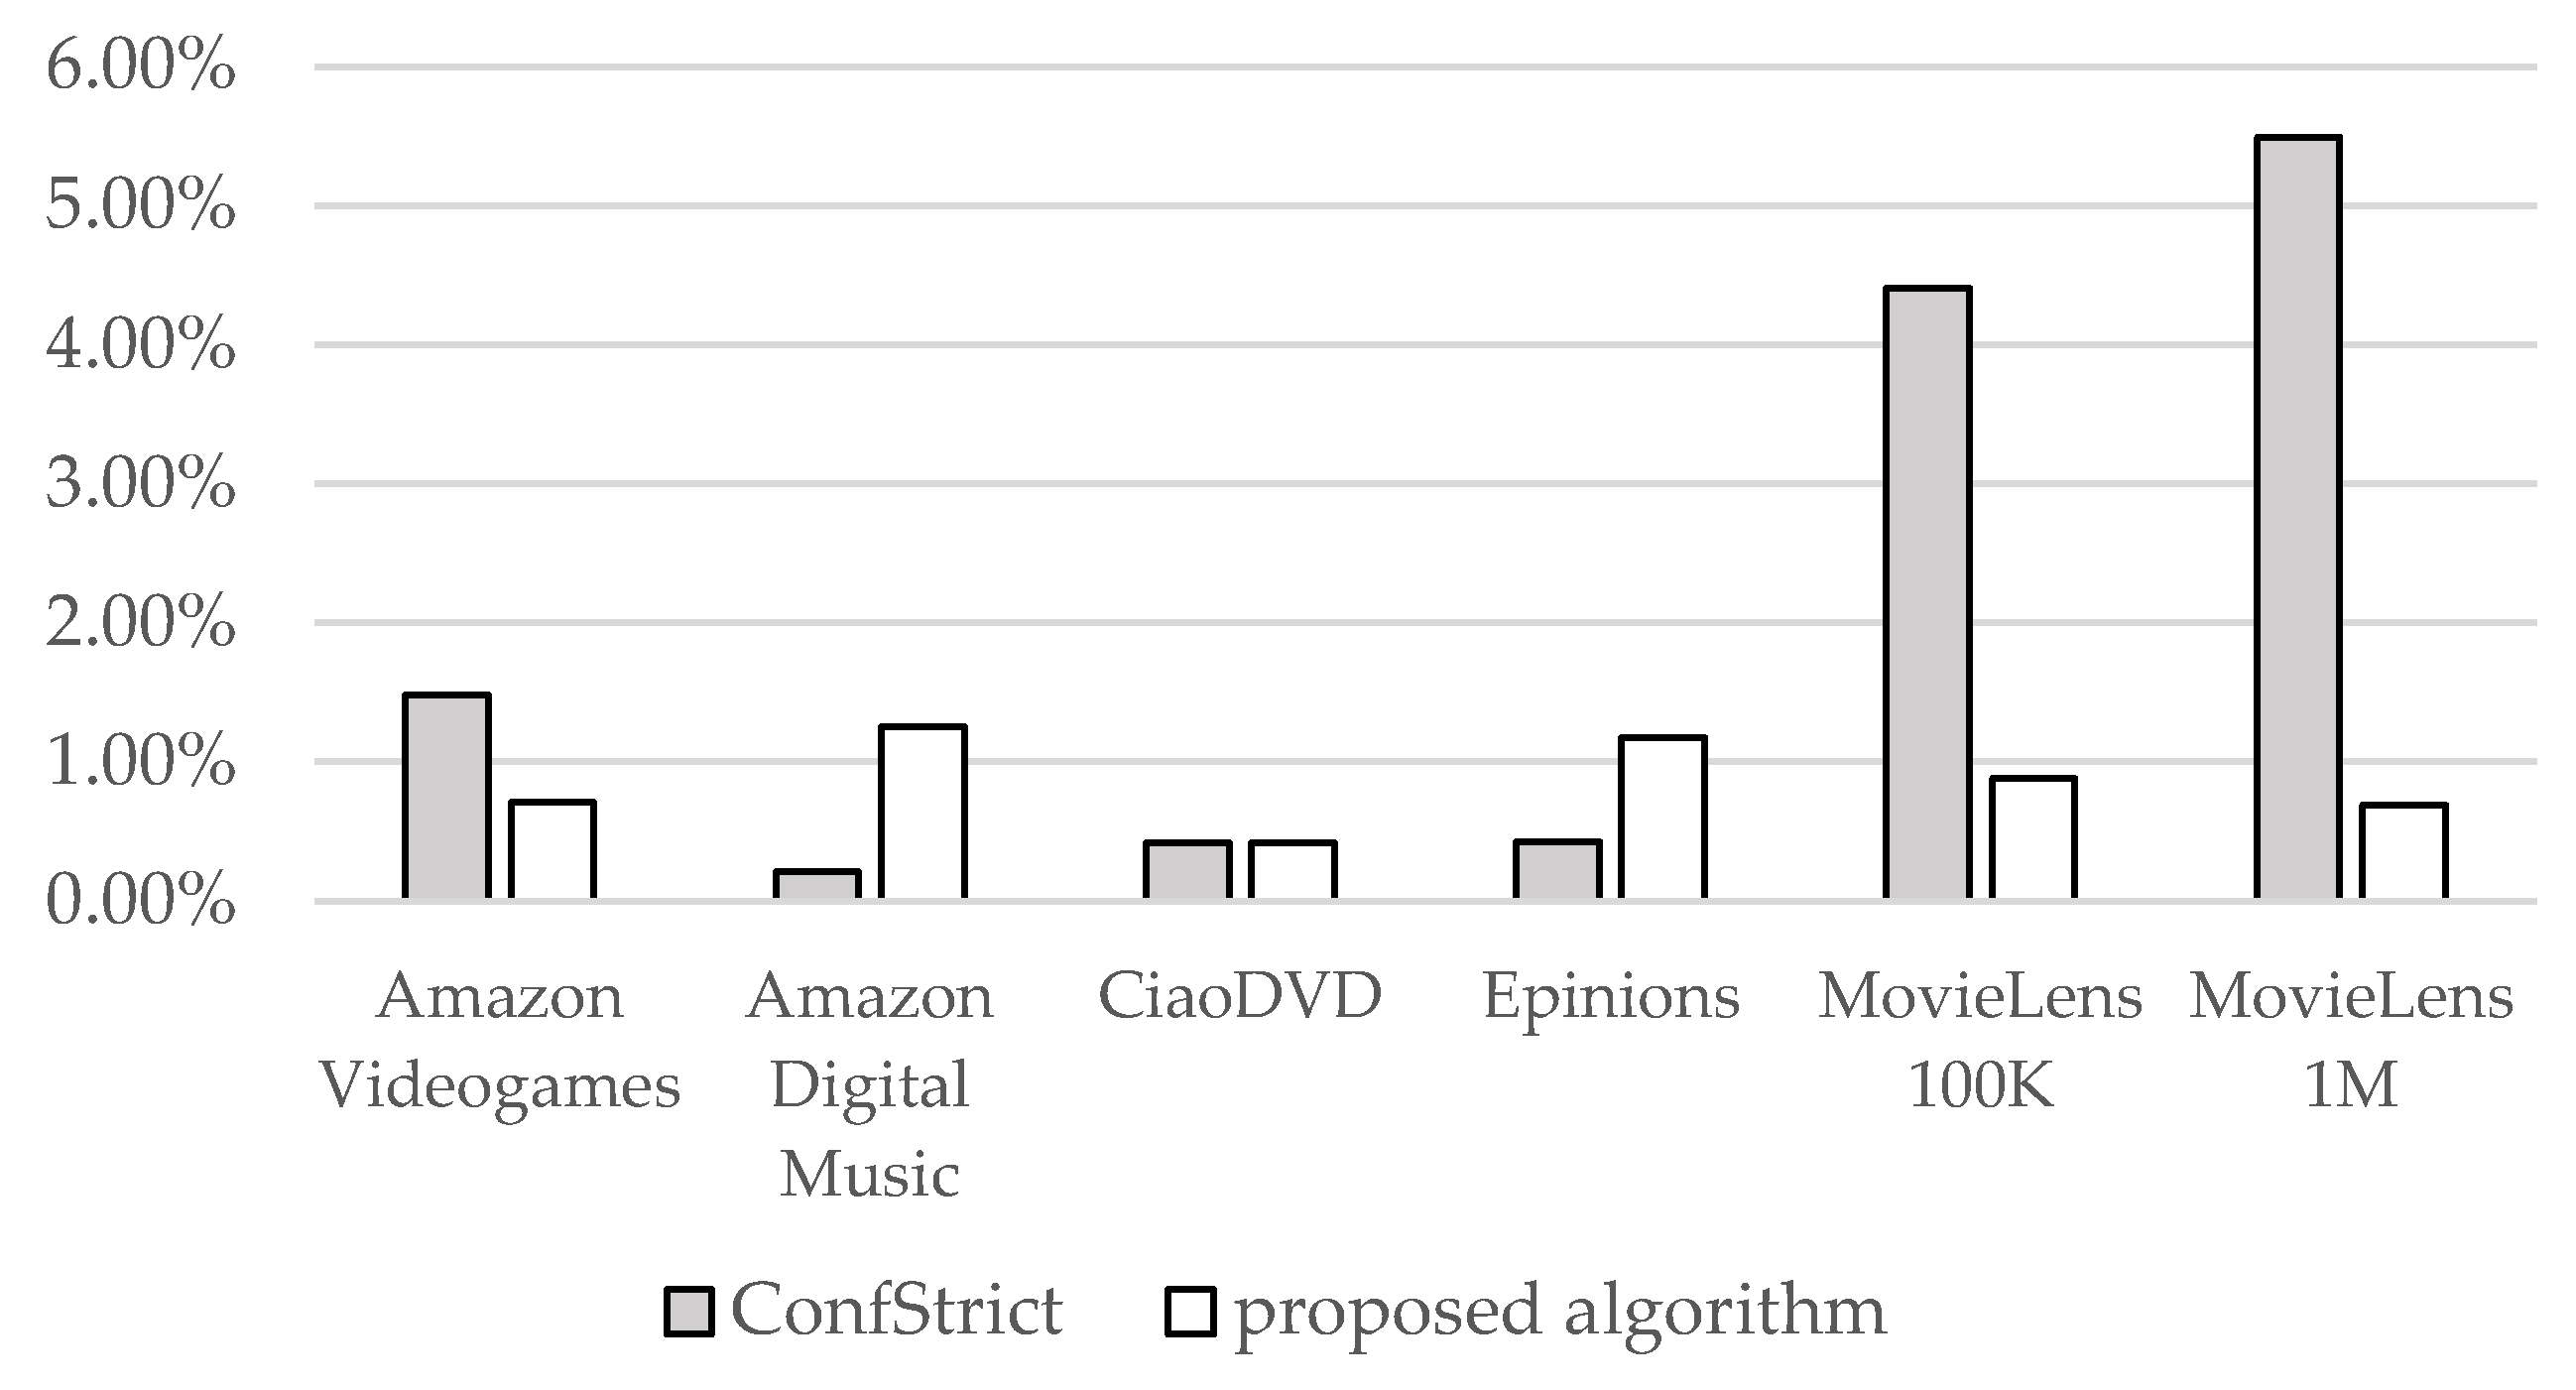
58] successfully removed 91% to 96% of the fake profiles, enabling the proposed algorithm to further reduce its losses in quality that were due to the introduction of fake ratings. More specifically, losses in average real rating ranges were up to 0.15% for the PC similarity metric and up to 1.02% for the CS similarity metric (the performance of the “clean” dataset is used as a baseline); losses in precision were bounded by 0.21% for the PC similarity metric and up to 1.94% for the CS similarity metric; and losses in NDCG were up to 0.06% for the PC similarity metric and up to 0.11% for the CS similarity metric. These results indicate that the proposed algorithm can be successfully combined with shilling attack detection algorithms.
Based on the above, the answer to research question RQ5 can be stated as follows:
5.4. Applicability
Since the presented algorithm requires no additional CF information, such as user demographics, attributes, categories of items, etc., as well as its application imposes negligible execution overhead, it can easily be applied in every CF dataset.
Based on the three aforementioned points, we can conclude that the proposed algorithm provides an easy and reliable solution towards CF RecSys quality enhancement.
5.5. Potential for Combination with Other Algorithms
It is worth noting that the proposed work may be directly combined with approaches targeting different stages of recommendation generation and/or pursuing different goals. Indicative categories of such potential combinations are as follows:
Works targeting the identification and removal of noisy or inaccurate data [
27,
28] allowing the creation of a sanitized dataset, which can then be used to calculate rating predictions and generate recommendations.
Works aiming to improve the resilience of the RecSys against attacks [
29,
33], such as the insertion of fake reviews or the creation of fake profiles, which lead to the manipulation of the recommendation generation procedure and outcomes. These works identify the fake reviews and profiles and, once identified, these elements can be removed, producing a cleansed dataset on which the proposed algorithm can be applied. Our initial experiments, presented in
Section 5.3, concur with this potential.
Algorithms targeting rating prediction improvement [
59,
60,
61], provided that the relevant algorithm supplies information regarding the number of NNs that have participated in rating prediction formulation, a precondition that is typically satisfied.
Approaches aiming to enhance the diversity, novelty, and serendipity of recommendations [
62,
63]. For example, in the algorithm presented in [
64], items are clustered according to their similarity and, then, one item from each cluster is selected in order to increase diversity. The proposed algorithm could be then used in the selection procedure from each cluster, thus maintaining diversity while increasing accuracy, mean item rating, and NCDG.
The quantification of the gains that can be achieved through these combinations, as well as an investigation of further potential for integration between the proposed algorithm and other algorithms, are considered as part of our future work.
6. Conclusions and Future Work
In this paper, we introduced a CF RecSys algorithm that takes into consideration not only the rating prediction value of the items produced by the CF algorithm, but also the confidence factors that each CF rating prediction fulfills, to upgrade the recommendation quality. More specifically, the presented algorithm uses a weighted average function to fuse two rating prediction characteristics, namely (a) the rating prediction value, and (b) the rating prediction confidence score into a single recommendation score for each item. The weight values for the characteristics represent the importance of each score, and their values are determined experimentally, tuning the algorithm to obtain optimal recommendation quality results. In particular, the optimal value for the weight (importance) of the rating prediction score has been found to be 40%. Respectively, the optimal weight (importance) of the rating prediction confidence score has been determined to be 60%. Finally, the algorithm recommends to the user the item(s) achieving the highest final recommendation score. The application of the presented algorithm is universal, since it is based only on the very basic CF information (user, item, and rating information).
The recommendation quality of the proposed algorithm was extensively evaluated under multiple parameters, using six CF datasets (including dense and sparse) from diverse sources, two user similarity metrics, two NN selection methods, and three recommendation quality metrics, all commonly used in CF RecSys research, for generalizability of the results. These experiments showed that the proposed algorithm accomplished satisfactory enhancement in recommendation accuracy, as calculated in terms of (i) recommendation precision, (ii) real rating value of recommendations, and (iii) NDCG metrics. At the same time, the execution overhead incurred due to the additional steps introduced by the algorithm is negligible.
The presented algorithm was also compared against a state-of-the-art algorithm [
8] (presented in 2024) targeting to upgrade CF recommendation quality, also considering prediction confidence factors and based only on the very basic CF information. The algorithm presented in this work was shown to exceed the performance of the aforementioned algorithm, on recommendation quality, for both similarity metrics and both NN selection methods tested. In particular, the presented algorithm was found to achieve an average recommendation precision of 86.9%, outperforming the performance of the algorithm introduced in [
8], which was measured at 85.4% (the respective recommendation precision of the plain CF was measured at 83.8%). The proposed algorithm has also been shown to exhibit increased resilience to four types of common attacks against RecSys, while it has been successfully combined with an attack detection algorithm.
In terms of practical implications, the CF RecSys algorithm presented in this work is shown to be both effective and efficient. Therefore, it can be directly used in CF datasets, regardless of their topic and density, to improve recommendation quality and, hence, user satisfaction. The low overhead of the algorithm and its small impact on the memory footprint further support its applicability, while its potential to be combined with other algorithms offering enhancements in other areas, such as elevated resilience against attacks and noisy data, as well as increased diversity and novelty, allowing the formulation of a pipeline whose properties match the goals of the organization hosting the RecSys.
Regarding future work, we are planning to identify additional features related to prediction accuracy and exploit them in the recommendation process. Furthermore, we will focus on including additional RecSys information sources, such as user demographics, attributes and categories of items, users’ social information, and others. We also plan to examine the adaptation of the proposed method for application in model-based CF approaches [
23,
65], as well as its usage for tasks including shilling attack detection [
31] and trust quantification [
66,
67].


