Article

A Frequency Regulation Strategy for Thermostatically Controlled Loads Combining Differentiated Deadband and Dynamic Droop Coefficients

State Grid Shandong Electric Power Research Institute, Jinan 250002, China
*
Authors to whom correspondence should be addressed.
Technologies 2025, 13(11), 510; https://doi.org/10.3390/technologies13110510 (registering DOI)
Submission received: 13 October 2025 / Revised: 5 November 2025 / Accepted: 6 November 2025 / Published: 8 November 2025
(This article belongs to the Special Issue Next-Generation Distribution System Planning, Operation, and Control)

Abstract

With a large number of traditional thermal power units being replaced by inverter-based resources, the system inertia and regulation capability have significantly decreased in certain countries, exposing a critical gap in traditional generation-side-dominated frequency regulation strategies. The decline in system inertia deteriorates frequency dynamics, creating a critical need for load-side regulation. To enhance frequency stability in low-inertia power systems, this paper proposes a frequency regulation strategy for thermostatically controlled loads (TCLs). The strategy incorporates a differential deadband that adjusts response thresholds based on frequency deviation, along with dynamic droop coefficients that self-adapt according to real-time TCL capacity. First, the operational principles of TCLs and the frequency response characteristics of thermal power units are analyzed to establish the foundation for load-side frequency regulation. Second, building upon the spatiotemporal distribution characteristics of system frequency, the nodal frequency under high renewable energy penetration is derived, and a differential dead zone setting method for TCLs is proposed. Then, a dynamic droop coefficient tuning method is developed to enable adaptive parameter adjustment according to the real-time regulation capacity of TCLs. Finally, these key elements are integrated within a hybrid control framework to formulate the complete TCL frequency regulation strategy. Simulation results demonstrate a 0.342% improvement in frequency nadir and 0.253% reduction in settling time compared to conventional methods, while ensuring reliable TCL operation. This work presents a validated solution for enhancing frequency stability in renewable-rich power systems, where the proposed framework with nodal frequency-based deadbands and adaptive droop coefficients demonstrates effective regulation capability under low-inertia conditions.

1. Introduction

In line with the near-term target of achieving carbon peaking by 2030, intermittent renewable energies such as wind and photovoltaic power are expected to evolve from supplementary sources to the primary contributors in power systems of some countries. The large-scale replacement of conventional thermal power units with renewable energy and power-electronically interfaced resources is leading to a shortage of system inertia and reserve capacity, raising significant concerns about frequency security [1]. This transformation process has resulted in the characteristic of high penetration of renewable energy and power electronic devices, posing new and severe challenges to the frequency security and stability of power systems [2]. Compared with conventional thermal generation, intermittent renewable sources such as wind and solar cause severe power disturbances, which pose adverse impacts on the secure, stable, and economic operation of the grid [3].
TCLs, characterized by their inherent capability of modulating various forms of energy (e.g., thermal, electrical, and chemical), are typically represented by central air conditioners and air-source heat pumps [4]. These loads exhibit advantages of flexibility and fast responsiveness. As demonstrated in transmission-level case studies, they can be aggregated to provide a substantial power reserve comparable to traditional spinning generation, offering rapid frequency support to the grid [5]. This capability is further evidenced at the component level, where control strategies—such as the on/off control of fixed-speed loads—can reduce average power consumption and provide effective frequency support within a short timescale [6]. At present, extensive research has been conducted to explore the potential participation of TCLs in system frequency regulation, which can be broadly categorized into the following two aspects:
(1)
Frequency Regulation Implemented Exclusively by Load Management
The method proposed in Reference [7] adopts a two-layer broadcast control framework, which divides the air conditioning load into six independent states and modulates the power regulation requirements into Temperature Set-Point Adjustment Probability (TSPAP) according to different states. The pioneering work in [8] first demonstrated the use of TCLs for frequency regulation. To address frequency deviation, a novel cluster control strategy was introduced in [9], accounting for the communication status of TCLs and user controllability. Centralized control of aggregated motor-driven loads has been implemented to provide precise primary frequency regulation [10]. Separately, thermostatically controlled loads have been coordinated through a virtual power plant to achieve the same objective [11]. A decentralized control algorithm was developed in [12] to ensure a fast response from TCLs. Hybrid control schemes, combining the unified management capability of centralized control with the rapid-response advantage of decentralized terminals, enable both fast and accurate frequency regulation [13]. For instance, a decentralized autonomous method was presented in 13 for load clusters to achieve droop characteristics by setting load-shedding frequency setpoints, enabling the entire cluster to collectively exhibit a droop response. Under a hybrid control framework, frequency regulation thresholds were established in [14] based on the operational states of air conditioners, facilitating rapid frequency support while adhering to user preferences.
(2)
Frequency Regulation Implemented by Coordination of Load and Generators
A source-load coordinated frequency support strategy incorporating network security constraints was put forward in [15], building on a source-load coordinated control mechanism. In [16], a wind power fast frequency response method considering demand response was introduced, utilizing thermostatically controlled loads to compensate for power drops during wind turbine cut-out and thus prevent secondary frequency dips. Within a detailed system model that includes synchronous machine excitation systems, governors, and grid topology, a hybrid dynamic load control strategy is proposed in [17]. This approach enables thermostatically controlled loads to autonomously optimize both primary and secondary frequency regulation effects, driving the system frequency back to its nominal value. An ensemble learning algorithm based on collective intelligence was proposed in [18], enabling massive load aggregation via load aggregators and achieving coordinated frequency control between distributed generation and loads. Cloud-based controllers are utilized in [19] to allocate frequency droop coefficients for grid-forming renewable energy sources and thermostatically controlled loads, thereby enhancing the frequency regulation capability of renewable energy. Additionally, heuristic algorithms are employed in [20] to forecast and optimize distributed power sources and massive loads, enabling intelligent regulation of thermostatically controlled loads.
The aforementioned studies have made certain contributions to developing system frequency support methods and strategies involving TCLs, but most are based on the assumption of uniform system frequency. However, due to factors such as network topology, generator distribution, unit parameters, and load types, the system frequency exhibits spatiotemporal distribution characteristics [21]. The integration of renewable energy has led to an uneven spatial-temporal distribution of system inertia, which necessitates a more precise characterization of this phenomenon [22]. This uneven inertia distribution further accentuates the spatiotemporal characteristics of system frequency during large disturbances, highlighting the need for coordinated emergency control across different locations and times [23].
Compared with conventional generation, TCLs due to their large scale and dispersed locations, are more significantly affected by the spatiotemporal distribution characteristics of system frequency. The frequency deviation and variation trends at their nodes can differ substantially from the Center of Inertia (COI) frequency, which can easily trigger undesired TCL actions, leading to frequent load adjustments. This not only impacts the operational lifespan of TCLs and normal user experience but may also further deteriorate frequency dynamics. Therefore, the proper setting of TCL frequency regulation deadbands is a critical prerequisite for ensuring control correctness. This study introduces two key innovations: a differential dead zone that dynamically adjusts response thresholds based on real-time frequency characteristics, and dynamic droop coefficients that self-adapt according to available TCL capacity. Unlike conventional fixed deadbands, this coordinated approach enables precise response coordination across diverse TCL clusters while maintaining grid stability representing a significant advancement in load-side frequency regulation. The proposed solution demonstrates distinct advantages in two key aspects. The hybrid control framework ensures rapid response capability, enabling immediate frequency regulation once deviations exceed deadband thresholds. Meanwhile, the control strategy achieves exceptional precision by fully utilizing available regulation capacity through dynamic coefficients, effectively eliminating both over-regulation and under-regulation issues.
To address the aforementioned issues, this paper proposes a frequency regulation strategy for thermostatically controlled loads (TCLs) that combines differentiated deadbands with dynamic droop coefficients. The main contributions and their improvements over existing methods are summarized as follows:
  • The operating mechanism of TCLs and the frequency response characteristics of thermal power units are analyzed, establishing a coordinated frequency regulation principle between TCLs and thermal power generation units based on the concept of “rapid compensation for deficiency.” This represents a significant improvement over conventional independent control strategies by enabling faster and more coordinated responses to frequency disturbances.
  • A system nodal frequency considering the integration of renewable energy into the network is derived, and a method for setting TCL deadbands based on nodal frequency is proposed. This approach overcomes the limitations of traditional uniform deadband settings by accounting for spatial and temporal frequency variations in renewable-rich power systems.
  • A dynamic droop coefficient adaptive tuning method for TCL frequency regulation is developed, enabling control parameters to be adaptively adjusted according to the regulation capability of TCLs. This innovation substantially enhances conventional fixed-coefficient methods by providing real-time self-adaptation to changing system conditions and available regulation resources.

2. Frequency Regulation Requirements Analysis of TCLs

2.1. Operational Principles Analysis of TCLs

Taking an air-source heat pump in cooling mode as an example, its basic operating principle is illustrated in Figure 1: The orange color indicates the period when the heat pump is operational, while the blue represents when the unit is shut down; the system determines the number of units in operation based on user-set temperature, ambient conditions, room insulation performance, and unit capacity, which subsequently modulates the total power consumption. Under idealized conditions, the energy conversion process of the heat pump can be represented as follows [24]:
Q ( t ) = P ( t ) COP ,
where Q is the equivalent thermal power of the heat pump, P is the electric power of the heat pump compressor, and COP is the coefficient of performance of the heat pump. Its equivalent thermodynamic model is expressed as follows [24]:
T t + 1 = T o t + 1 + s Q R T o t + 1 + s Q R T t e t / R C ,
where T(t + 1) and T(t) denote the indoor temperature at time instants t + 1 and t, respectively; T0(t + 1) represents the outdoor temperature at time instant t + 1; C is the equivalent thermal capacitance of the heat pump; R is the equivalent thermal resistance; and s { 0 , 1 } is the on/off state variable, with s = 1 indicating the heat pump is operating and s = 0 indicating it is shut down.
Therefore, the power of TCLs is decoupled from the system frequency and cannot actively respond to frequency variations in the grid. An additional power control strategy is required to enable frequency regulation.
Typically, TCLs have short actuation times and can achieve frequency response on the millisecond scale, enabling them to quickly meet system power demands. Since frequency regulation is required within a timeframe of minutes, the temperature variation in TCLs is minimal and barely perceptible to users, making their impact on comfort negligible. Therefore, TCLs represent a highly effective resource for frequency regulation.
However, to fully exploit the frequency regulation potential of TCLs and to coordinate them effectively with conventional power sources, an analysis of the frequency response characteristics of thermal power units is required.

2.2. Analysis of Frequency Response Characteristics of Thermal Power Generation Units

Thermal power units consist of a steam turbine and a governor. The transfer function of the turbine, Gtur(s), is given by [25]
G tur s = 1 + s F HP T RH 1 + s T CH 1 + s T RH ,
where FHP, TRH, and TCH denote the high-pressure cylinder power fraction, the reheater steam volume time constant, and the steam chest time constant, respectively.
The transfer function of the governor is given by [25]
G gov s = 1 R g 1 + s T g ,
where Rg and Tg are the governor droop coefficient and the governor time constant, respectively.
Therefore, from Equations (3) and (4), the transfer function of the thermal power unit, Gg(s), can be expressed as
G g ( s ) = G tur s G gov s = 1 + s F HP T RH R g 1 + s T g 1 + s T CH 1 + s T RH ,
The frequency response characteristics of a thermal power unit can be represented using a conventional low-order frequency response model, with its step response in the time domain, Δω(t), expressed as [26]
Δ ω ( t ) = R P step D R + K m 1 + a e ζ ω n t sin ( ω r t + ϕ ) ,
where Pstep denotes the magnitude of the step disturbance, D is the equivalent damping coefficient of the power system, Km is the mechanical power gain coefficient, ζ signifies the damping ratio, ωn refers to the natural frequency, ωr indicates the damped oscillation frequency, φ represents the phase angle, and a denotes a coefficient. H is the equivalent inertia time constant of the system; when the value of H increases, the system’s damped oscillation frequency ωr decreases, while the damping ratio ζ increases.
After a disturbance occurs, the thermal power unit sequentially taps into multiple energy sources—rotor kinetic energy, boiler thermal storage, and fuel—over cascading timescales to meet the sustained power demand. However, due to inherent disparities in their discharge rates, the activation of later-stage sources may be temporally mismatched, thereby compromising the overall effectiveness of frequency regulation.
Specifically, following a disturbance, the primary frequency response of a thermal power unit is inherently slow due to its physical structural limitations, preventing a rapid reaction to the disturbance. At the same time, with the increasing integration of renewable energy, some thermal units are being replaced, gradually diminishing the available energy reserves.

2.3. Frequency Regulation Principles of TCLs

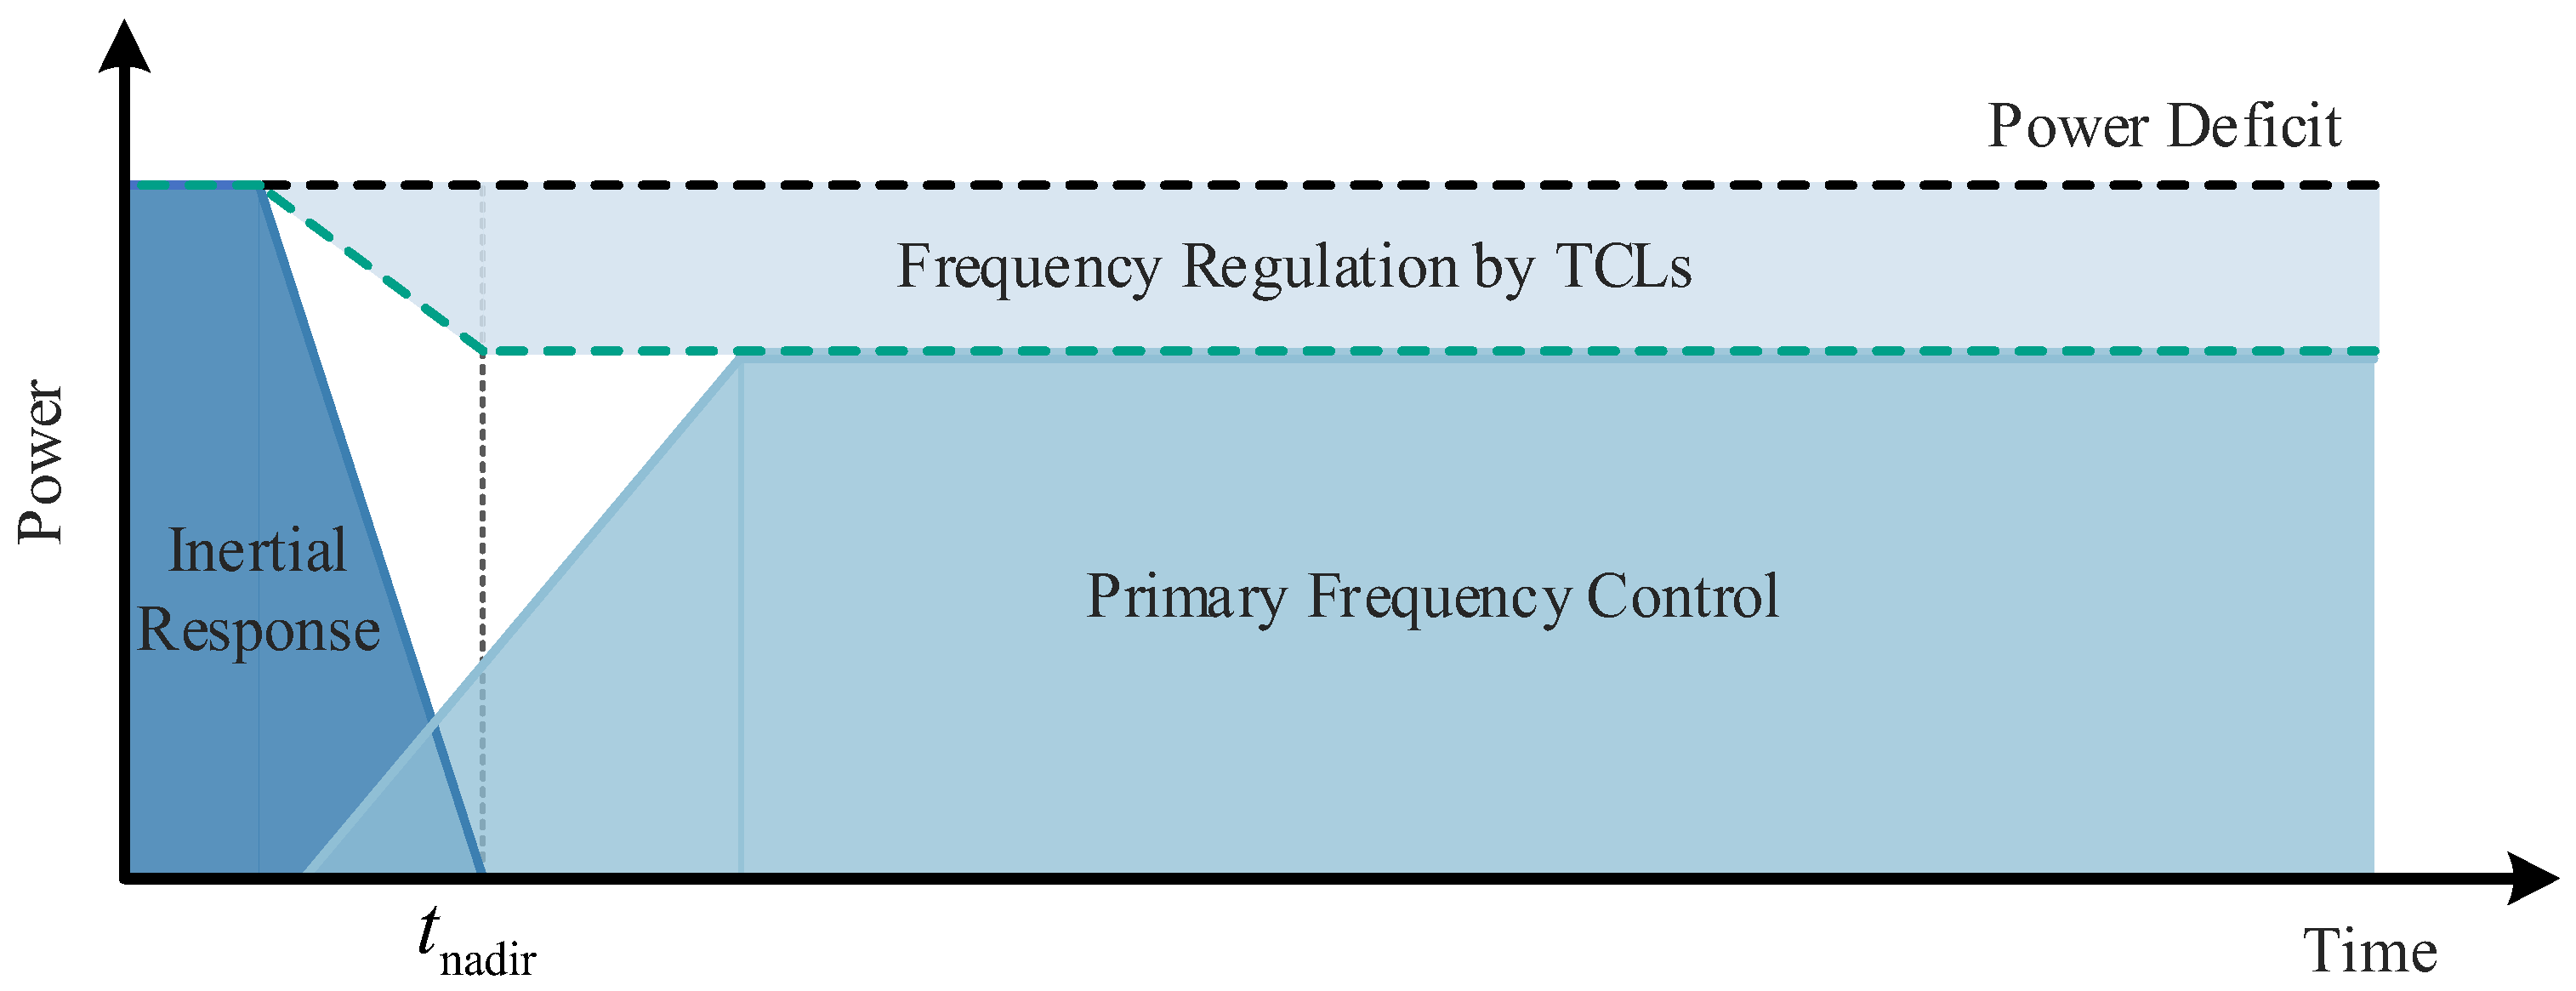
Thus, to address the short-term power deficit caused by the loose coupling between multi-timescale energy reserves during frequency regulation of thermal power units, TCLs can provide rapid frequency support by reducing their demand. As shown in Figure 2, the coordination principle between TCLs and thermal power units is ‘using speed to compensate for power shortfall,’ meaning that flexible resources respond quickly in the initial stage to offset the energy gap between stages, thereby ensuring real-time power balance in the system.
However, with the increasing prominence of spatiotemporal frequency distribution in renewable-rich power systems, achieving the above objectives faces two main challenges:
  • The deviation between nodal frequencies and the system COI frequency increases, and if the actuation deadbands are improperly set, TCLs are prone to undesired activations;
  • TCLs vary in real time according to user behavior, and conventional fixed-parameter approaches may fail to fully exploit their regulation capability, preventing optimal frequency regulation.
To address these issues, the following sections discuss the methods for differentiated nodal frequency deadband setting and adaptive tuning of dynamic droop coefficients.

3. Differentiated Deadband Setting Method Based on Nodal Frequency

3.1. Modeling of System Nodal Frequency

To analyze the mechanism underlying instantaneous frequency formation in power systems, a frequency response analysis method based on DC power flow is employed, and the network model can be simplified as follows [27]:
P = B θ
where P is the vector of net active power injections at each node, B is the system susceptance matrix, and θ is the vector of voltage phase angles at each node.
According to the principle of synchronous operation, in a synchronous AC power system, the frequency at each node is jointly determined by the rotor speeds of all synchronous generators. Accordingly, the active power–angle network equation can be expressed as:
P G P L = B 0 θ
where PG is the column vector of active power outputs of synchronous generators, PL is the column vector of active power demand of loads, and B0 is the system nodal susceptance matrix.
  • Synchronous Generator Model
The external characteristics of the synchronous generator are modeled as a voltage source. By neglecting the stator winding resistance and salient-pole effects of the synchronous machine, and assuming that both the internal EMF and terminal voltage are 1.0 p.u., the active power output PG of the synchronous generator can be expressed as:
P G = B G δ θ ,
where BG is the internal susceptance of the synchronous generator, δ is the rotor angle, and θ is the terminal voltage phase angle.
2.
Load Model
The simplified load model considers only its frequency regulation effect on active power and can be expressed as:
P L = P LN 1 + K L Δ f ,
where PL is the actual active power consumed by the load, PLN is the active power at rated voltage and frequency, KL is the load active power regulation coefficient, and Δf is the deviation of system frequency from the nominal value.
The power of TCL is adjusted according to the user’s temperature settings. For simplicity, when their frequency response is neglected, they can be equivalently modeled as constant-power loads, i.e., KL = 0, which can be expressed as
P C L = P C L N ,
where PCL denotes the actual active power consumed by the TCLs, and PCLN is the active power consumed under rated voltage and frequency.
3.
Renewable Energy Source Model
For grid-connected renewable energy sources, their external characteristics are typically modeled as a current source. Accordingly, their simplified model can be expressed as
P GFL = P GFLN 1 K GFL Δ f ,
where PGFL denotes the actual active power output of grid-following renewable sources, PGFLN is their rated output, and KGFL represents the active power regulation coefficient.
For grid-forming renewable energy sources, their external characteristics are typically modeled as a voltage source. Accordingly, their simplified model can be expressed as
P GFM = B GFM ( δ GFM θ ) ,
where PGFM denotes the actual active power output of grid-forming renewable sources, δGFM is the virtual rotor angle of the grid-forming source, and BGFM represents the virtual internal susceptance of the grid-forming source.
4.
Typical System Nodal Frequency Model Considering Renewable Energy
The typical nodal frequency model of a power system with integrated renewable energy is illustrated in Figure 3. The numbers represent bus numbers, and B represents susceptance. The network equations can be expressed as
P G + P GFM + P GFL P L P CL = B 0 θ ,
The system nodal susceptance matrix B0 is given by
B 0 = B 13 0 B 13 0 B 23 + B G + B GFM B 23 B 12 B 23 B 12 + B 23 ,
From Equations (10) and (12), it can be seen that grid-following renewable sources and loads exhibit similar frequency response characteristics. For simplification, they can be aggregated, and their combined model can be expressed as
P EL = P L P GEL = P ELN I + K EL f P ELN , i = P LN , i P GFLN , i K EL , i = K L , i + K GFL , i ,
where PEL denotes the active power output vector of the equivalent load, PELN is the rated active power vector of the equivalent load, I represents a unit vector, and KEL is the active power regulation coefficient vector of the equivalent load.
Similarly, from Equations (9) and (13), it can be seen that grid-forming renewable sources and synchronous generators exhibit similar frequency response characteristics. For simplification, they can be aggregated, and the equivalent active power output vector of the combined sources is denoted as PEG.
P EG = P G P GFM = B EG δ EG θ B EG , j = B G , j B GFM , j δ EG , j = B G , j δ j + B GFM , j δ GFM , j B G , j + B GFM , j ,
where PEG denotes the active power output vector of the equivalent sources, BEG is the diagonal matrix of internal susceptances of the equivalent sources, and δEG represents the rotor angle vector of the equivalent sources.
Substituting Equations (16) and (17) into Equation (14), the network equations can be further written as
P EG P EL P CL = B 0 θ
B EG δ EG θ P ELN I + K EL f P CL = B 0 θ ,
In a synchronous AC power system, the rotor angles δEG and frequencies fEG of synchronous sources, as well as the nodal voltage angles θ and nodal frequencies f, satisfy the following relationships [28]:
d δ EG d t = 2 π f EG d θ d t = 2 π f ,
By differentiating Equation (19) with respect to time and applying the Laplace transform, the relationship between the nodal frequencies f and the rotor speeds fEG of synchronous sources can be derived.
f ( s ) = W ( s ) f E G ( s ) ,
W = B 0 + B EG + s K EL P ELN 1 B EG = w 11 w 12 w 13 w 21 w 22 w 23 w 31 w 32 w 33 ,
In the equation, W represents the weight matrix for nodal frequencies, and wij denotes the influence weight of the generation at node j on the frequency at node i.
By applying the inverse Laplace transform to Equation (21), the time-domain expression of the nodal frequencies, f(t), can be obtained.
f t = L 1 W s f EG s ,

3.2. Differentiated Deadband Setting for Nodal Frequencies

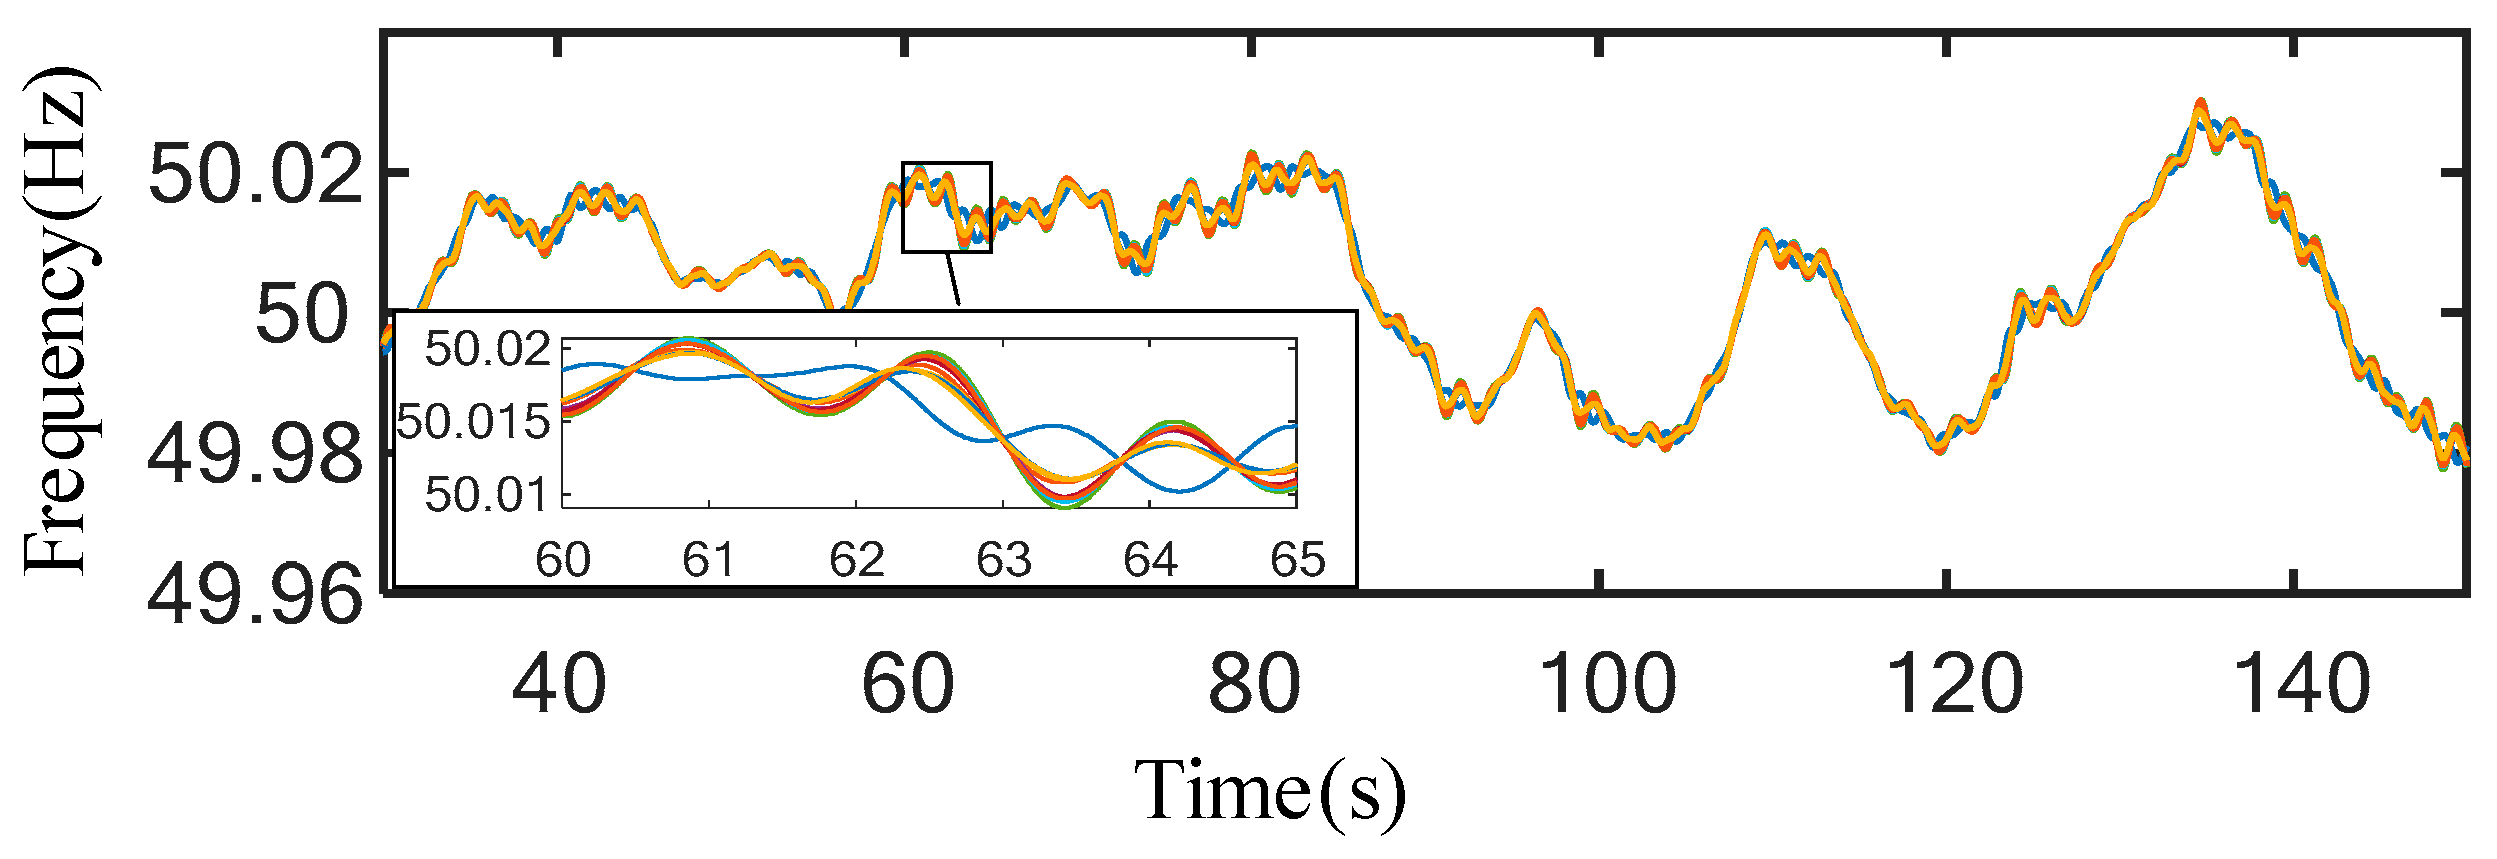
In renewable-dominated power systems, the increased penetration of renewable generation reduces system inertia and, combined with high-frequency load disturbances, exacerbates frequency fluctuations. As shown in Figure 4, different colors represent the frequencies of different bus nodes; the increasingly pronounced spatiotemporal disparities in frequency lead to more pronounced deviations of nodal frequencies from the system COI frequency.
TCLs exhibit rapid and precise power response and can provide frequency support when appropriately configured with a frequency deadband. This paper proposes a differentiated deadband strategy considering the spatiotemporal distribution of frequency. As shown in Figure 5, each node’s deadband is defined based on its normal frequency fluctuations. Under typical load variations, TCLs operate normally without altering their power. When the node frequency approaches or exceeds the deadband boundary, TCLs respond quickly to supply fast frequency support to the system.
From Equation (21), it can be seen that the frequency dynamics at different nodes are closely related to the location and magnitude of disturbances. Suppose a power disturbance ΔPLi occurs at node i. The disturbed power is first allocated according to the electrical distance between the generators and node i. The detailed allocation procedure is as follows:
Substituting Equation (17) into Equation (18)
θ = B 0 + B EG 1 B EG δ EG P EL + P CL ,
Substituting Equation (24) into Equation (17)
P EG = B EG I W δ EG + W T P EL + P CL ,
The variation in the instantaneous electromagnetic power of the synchronous generator at this moment can be obtained from the above equation.
Δ P E G = W T Δ P C L ,
The rotor motion equation can be used to obtain the speed fEGj of synchronous generator j [26].
2 H j f EG j d f EG j d t = Δ P EG j ,
Therefore, by combining Equations (21) and (23), the frequency fi at node i can be further determined.
To ensure the reasonableness and effectiveness of the deadband setting, a maximum load fluctuation ΔPLimax is specified at node i, and the corresponding node frequency deviation is used as the frequency regulation deadband for the TCLs at that node, which can be expressed as follows:
Δ f dz i = F Δ P L i max ,
In the equation, Δfdzi represents the frequency regulation deadband of the TCL at node i, ΔPLimax denotes the maximum load fluctuation at node i, and F is the mapping function between the disturbance magnitude and node frequency. The detailed calculation is provided in Equations (26), (27), (21) and (23).

4. Adaptive Tuning Method for Dynamic Droop Coefficients

To maximize the regulation potential of TCLs for rapid and precise frequency support, a set of performance indices is established to evaluate control strategies, based on which an adaptive droop coefficient tuning method is proposed to substantially improve the dynamic response of TCLs in frequency regulation.

4.1. Performance Indices for Frequency Regulation Strategies

To develop an effective load frequency regulation strategy, it is necessary to consider both the improvement of system frequency and the impact on users. Therefore, the following performance indices are defined:
  • Maximum Frequency Deviation Δfdev_max
Δ f dev _ max = f lim f N ,
where flim denotes the system’s extreme frequency.
  • Steady-State Frequency Deviation Δfdev_ss
Δ f dev _ ss = f ss f N ,
where fss denotes the system’s steady-state frequency.
  • False Activation Rate R
Define a decision function si: when the TCL changes its power by ΔPi under user participation, si = 0; when the TCL reacts erroneously under no user participation and normal load fluctuations, si = 1. Accordingly, the load misoperation rate can be expressed as:
R = i = 1 n Δ P i s i i = 1 n Δ P CL i , lim ,
where n denotes the number of TCL nodes.
  • Energy Metric ΔWCL
Δ W CL = i = 1 n 0 T PFR Δ P CL i d t Δ P CL i , lim T PFR ,
Here, the maximum frequency deviation Δfdev_max and the steady-state frequency deviation Δfdev_ss serve as system frequency indices, which can be used to evaluate the frequency regulation performance of TCLs; smaller values indicate better regulation. The load indices, including the misoperation rate R and the energy metric ΔWCL, reflect the utilization of TCLs’ controllable capacity, where smaller R and larger ΔWCL indicate higher utilization.

4.2. Adaptive Droop Coefficient Tuning

The power output of TCLs can be adjusted by changing the number of operating units. The adjustable power, ΔPCLi,lim, can be expressed as follows:
Δ P CL i , lim = P CL i max P CL i 0 , Δ f > 0 P CL i 0 , Δ f 0 ,
where PCLi0 and PCLi,max are the initial power and maximum operating power of TCL i, respectively.
To fully exploit the capability of TCLs, enhance the energy utilization index, and achieve adaptive adjustment under different disturbances, this paper employs an adaptive droop control approach, where the TCL power PCLi can be expressed as follows:
P CL i = P CL i 0 + K CL i f i f N ,
K CL i = Δ P CL i , lim Δ f lim , f i f N > Δ f dz i 0 , f i f N Δ f dz i ,
where KCLi denotes the droop coefficient of the thermostatically controlled load, fN is the nominal frequency, and Δflim represents the maximum allowable frequency deviation.
Simultaneously, to ensure that TCLs do not adversely affect normal user operation during frequency regulation and to reduce load misoperation, a time-based decision variable δi is defined. The load controller can autonomously decide whether to participate in frequency regulation based on δi, which can be expressed as follows:
δ i = 0 , Δ t i < T PFR 1 , Δ t i T PFR ,
where Δti is the allowable regulation time of load i, and TPFR is the duration of the system’s primary frequency response.
Therefore, the droop coefficient KCL,i can be further expressed as
K CL i = Δ P CL i , lim Δ f lim δ i , f i f N > Δ f dz i 0 , f i f N Δ f dz i ,

5. TCL Frequency Regulation Control Strategy

The frequency regulation strategy for TCLs, which combines differentiated deadbands and adaptive droop coefficients, adopts a hybrid control architecture, as shown in Figure 6. The control is organized into three layers: the Load Control Center, Load Controllers, and the TCLs themselves.
During normal system operation, the Load Controllers collect operational data from sensors and other devices, including operating status and user-set commands, and compute the adjustable power of each TCL, ΔPCLi,lim, and upload it to the Load Control Center. The Load Control Center computes the node frequencies and the differentiated deadbands Δfdzi using the network topology and generator parameters. At the same time, it determines the droop coefficients KCL,i based on the adjustable power ΔPCLi,lim of the TCLs and the system’s allowable maximum frequency deviation Δflim, and distributes these parameters to the Load Controllers. When an active power disturbance causes system frequency to drop, the Load Controllers continuously monitor the local frequency fi. Once the deviation exceeds the deadband Δfdzi, the controller directly commands an adjustment in load power.
The Load Control Center exchanges information with the Load Controller via communication devices. Since the power of TCLs typically does not change abruptly over short periods, the evaluation interval under normal operation can be set to 5 min, imposing only modest requirements on the communication system. In contrast, the Load Controller is directly connected to the TCLs, without going through a communication layer, allowing for near-instantaneous response with negligible actuation time.

6. Case Studies

6.1. Case Background

In this study, a modified IEEE 39-bus system with renewable energy integration is modeled on the DIgSILENT/PowerFactory platform, as illustrated in Figure 7. The system comprises ten synchronous generators. At Bus 9 and Bus 23, 20 × 5-MW grid-following renewable generation units are connected at each bus, respectively. They are represented in green in the diagram. A 5 MW grid-forming wind generation unit is connected at Bus 17. In addition, thermostatically controlled loads are installed at Bus 1, Bus 9, Bus 13, Bus 16, Bus 17, and Bus 21, with capacities of 65 MW, 15 MW, 50 MW, 20 MW, 10 MW, and 5 MW, respectively. They are represented in blue in the diagram.

6.2. Verification of Differentiated Deadband Effects

To verify the effectiveness of the proposed nodal frequency-dependent deadband in preventing maloperations of TCLs, this section establishes a comparative analysis of the system frequency response and TCL actions under three control strategies under four different load fluctuation cases: no frequency regulation deadband control, fixed deadband control, and differentiated deadband control. The simulation aims to examine whether the control strategy can promptly provide frequency support during actual power deficits while avoiding unnecessary frequent switching operations under normal load fluctuations.
Under the load fluctuation condition, simulating sudden, transient power disturbances caused by industrial load variations or feeder switching operations, the load power exhibits intense, irregular pulsations within the 150 s observation period, ranging from 1074 MW to 1143 MW. As shown in Figure 8, the fluctuation profile is characterized by a series of steep rising and falling edges with high variation rates, demonstrating no discernible periodicity or trend.
Three methods—no frequency regulation deadband, fixed deadband, and differentiated deadband—are configured for comparative validation:
  • No frequency regulation deadband: The deadband is set to 0.
  • Fixed deadband: Based on the load fluctuations in the first condition, a fixed deadband of ±0.03 Hz is applied.
  • Differentiated deadband: Building on the fluctuation data from the first condition, the frequency variation ranges at each monitoring node in the system are statistically analyzed. The maximum and minimum frequency deviations among all nodes are identified, and the largest absolute deviation from the steady-state frequency value is taken as the deadband width.
Specific parameter settings for each deadband configuration are provided in Table 1. Deadband Setting Results under the First Condition.
The simulation results are shown in Table 2. In the absence of a frequency deadband, normal load fluctuations caused widespread maloperation of TCLs, consequently degrading the system’s frequency regulation capability. With a fixed deadband (±0.0300 Hz), maloperation of some loads was avoided; however, Loads 13, 16, 17 and 21 still exhibited maloperation, resulting in a reduction in controllable capacity by 0.29% to 0.47%. In contrast, the proposed differentiated deadband completely eliminated maloperation across all TCL clusters while preserving their full controllable capacity. This successful outcome not only validates the rationality and accuracy of the proposed approach but, more importantly, demonstrates how the differentiated deadband, unlike fixed deadbands, effectively coordinates diverse load responses while maintaining system stability under varying operating conditions.

6.3. Effectiveness Verification of TCL Frequency Regulation Strategy Under Multiple Disturbance Scenarios

To validate the effectiveness and superiority of the frequency regulation strategy for thermostatically controlled loads proposed in this paper, this section establishes four load disturbance scenarios under the same normal load fluctuation condition, based on the content outlined in Section 6.2. Meanwhile, three strategies are designed for simulation comparison. The following three control strategies are designed for comparative analysis:
  • Strategy 1: TCLs participate in frequency regulation with a fixed droop coefficient and no deadband.
  • Strategy 2: TCLs participate in frequency regulation with a fixed droop coefficient and a differentiated deadband.
  • Strategy 3: TCLs participate in frequency regulation with a dynamic droop coefficient and a differentiated deadband.
(1) Scenario 1
At 40 s, a sudden load increase of 200 MW is applied at Bus 23. The settings of the droop coefficients for each strategy are summarized in Table 3.
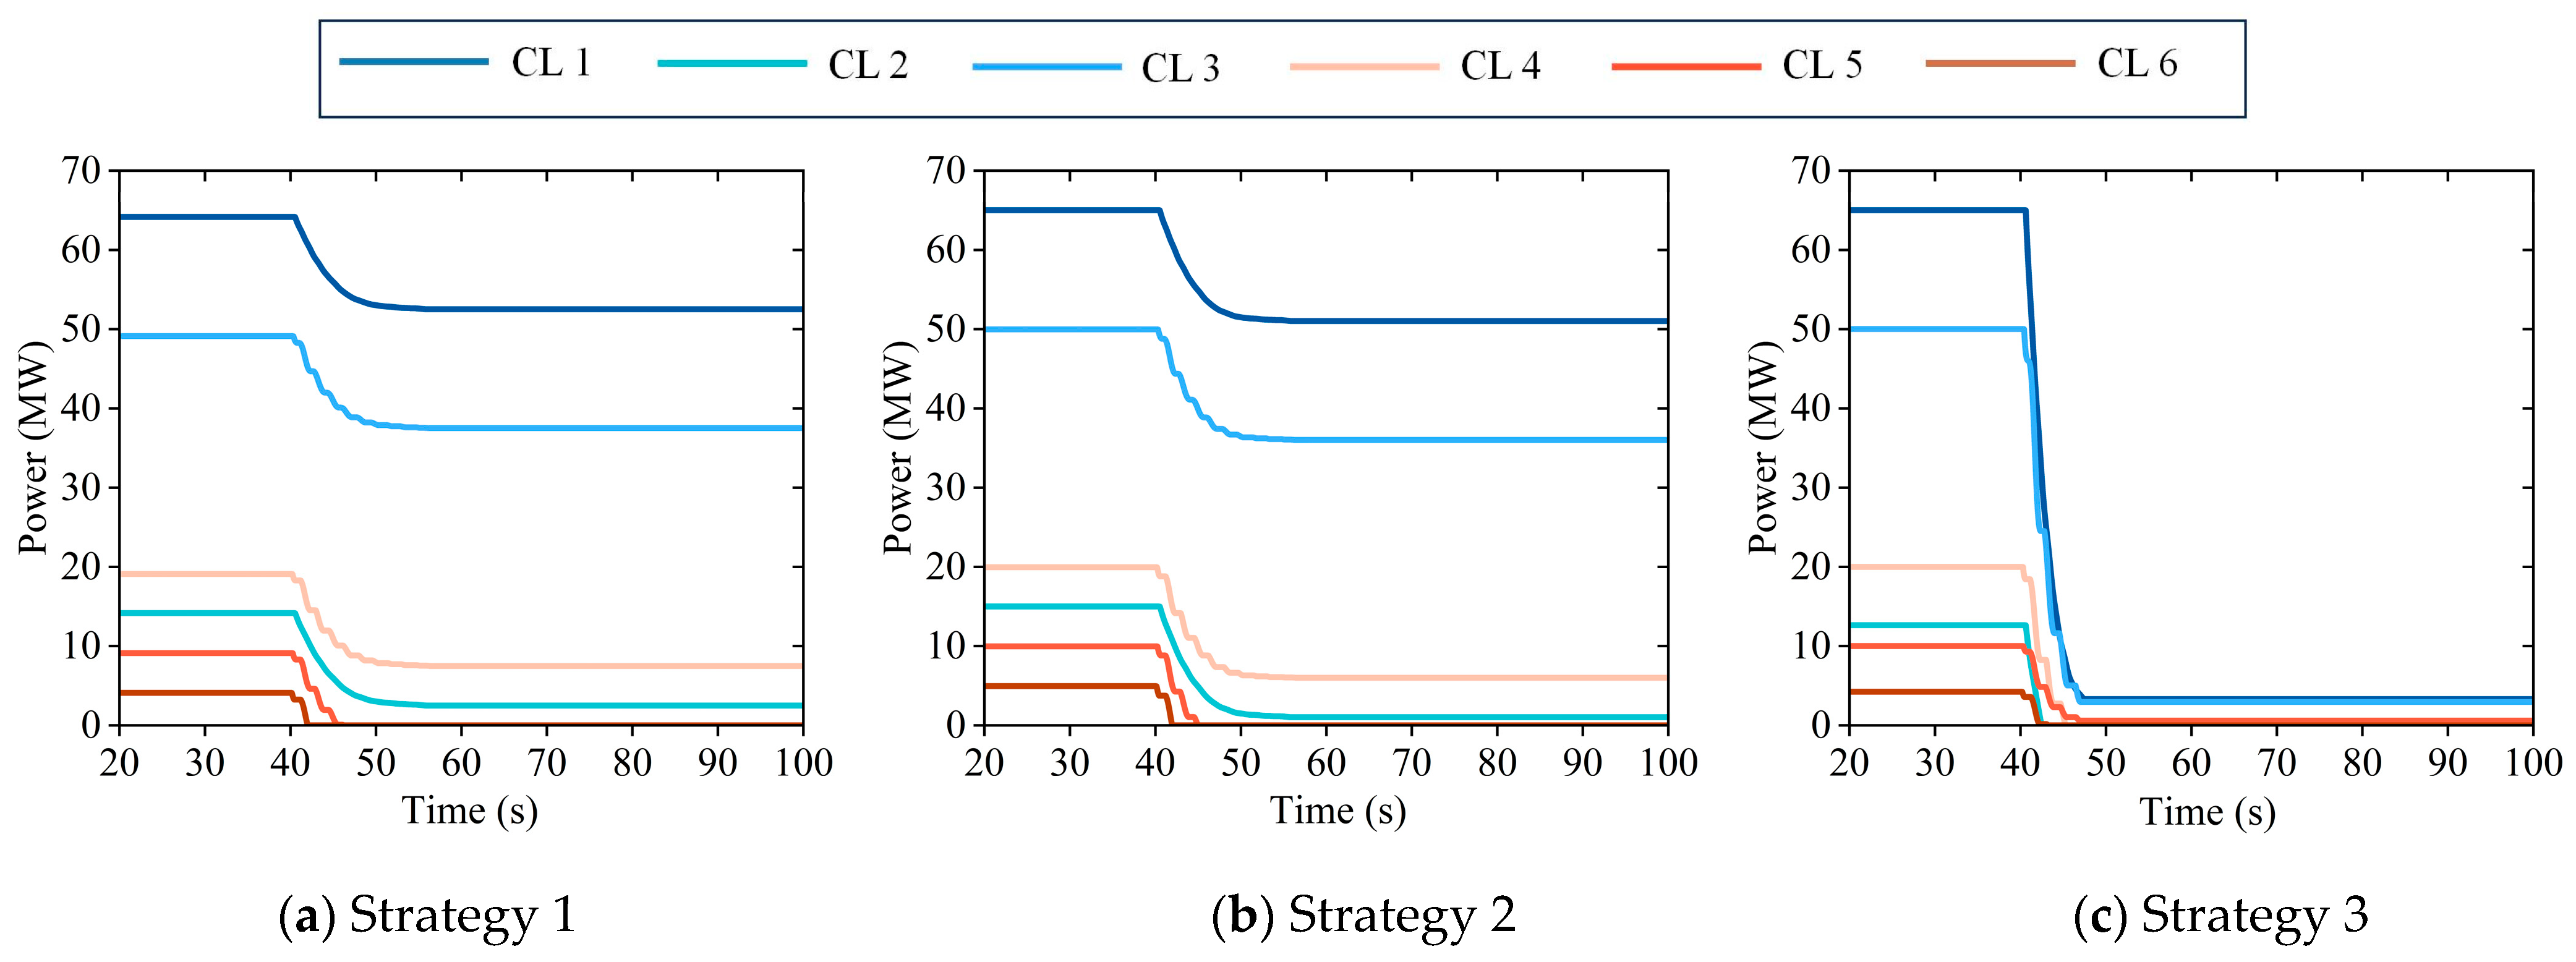
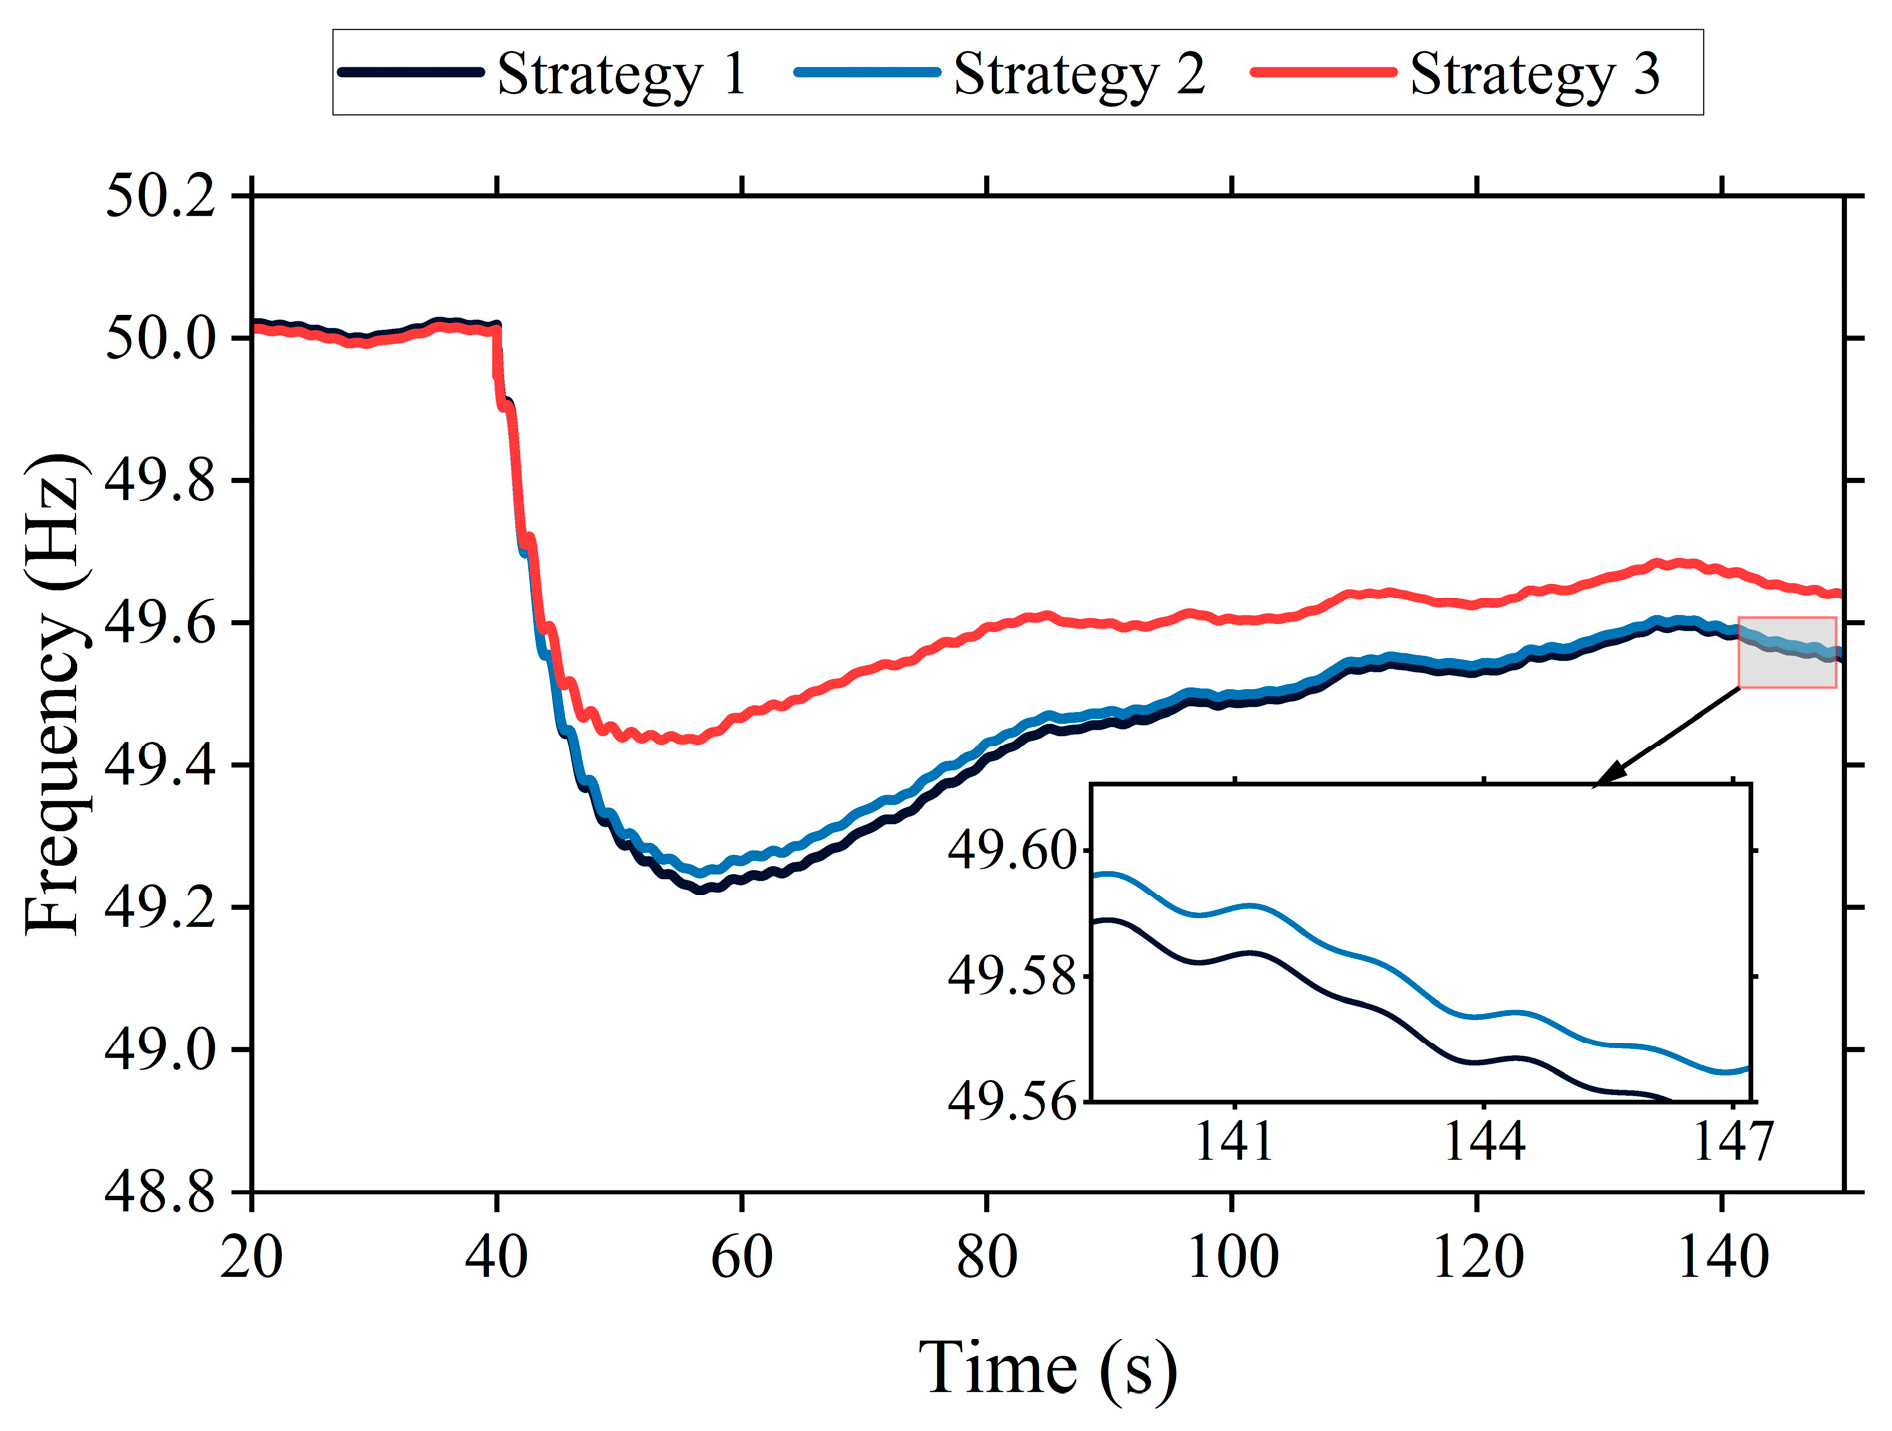
The system frequency response curves are shown in Figure 9. Under Scenario 1, Strategy 1 and Strategy 2 reach their frequency nadirs at t = 50.302 s and t = 50.231 s, with minimum values of 49.670 Hz and 49.682 Hz, respectively. The steady-state frequencies are 49.768 Hz and 49.775 Hz. In contrast, under Strategy 3, the frequency nadir occurs at t = 46.894 s with a minimum value of 49.840 Hz, representing improvements of 0.342% and 0.318% compared with the other strategies. The steady-state frequency is approximately 49.894 Hz, corresponding to improvements of 0.253% and 0.239% As shown in Figure 10, the load frequency regulation capability is efficiently utilized under the proposed strategy.
(2) Scenario 2
At 40 s, a sudden load increase of 300 MW is applied at Bus 23. The settings of the droop coefficients for each strategy are summarized in Table 4.
The system frequency response curves are shown in Figure 11. Under Scenario 2, Strategy 1 and Strategy 2 reach their frequency nadirs at t = 56.394 s and t = 56.373 s, with a minimum frequency of 49.479 Hz and 49.496 Hz, and steady-state frequencies of 49.659 Hz and 49.667 Hz. In contrast, Strategy 3 reaches its frequency nadir earlier at t = 48.593 s with a minimum frequency of 49.655 Hz, representing improvements of 0.356% and 0.321% compared to the other strategies. Its steady-state frequency stabilizes at approximately 49.773 Hz, showing enhancements of 0.230% and 0.213%, respectively. As shown in Figure 12, the load frequency regulation capability is efficiently utilized un-der the proposed strategy.
(3) Scenario 3
At 40 s, a sudden load increase of 400 MW is applied at Bus 23. The settings of the droop coefficients for each strategy are summarized in Table 5.
The system frequency response curves are shown in Figure 13. Under Scenario 3, Strategy 1 and Strategy 2 reach their frequency nadirs at t = 56.588 s and t = 56.556 s, with a minimum frequency of 49.225 Hz and 49.250 Hz, and steady-state frequencies of 49.550 Hz and 49.557 Hz. In contrast, Strategy 3 reaches its frequency nadir earlier at t = 56.387 s with a minimum frequency of 49.436 Hz, representing improvements of 0.429% and 0.378% compared to the other strategies. Its steady-state frequency stabilizes at approximately 49.639 Hz, showing enhancements of 0.180% and 0.165%, respectively. As shown in Figure 14, the load frequency regulation capability is efficiently utilized un-der the proposed strategy.
(4) Scenario 4
At 40 s, a sudden load increase of 500 MW is applied at Bus 23. The settings of the droop coefficients for each strategy are summarized in Table 6.
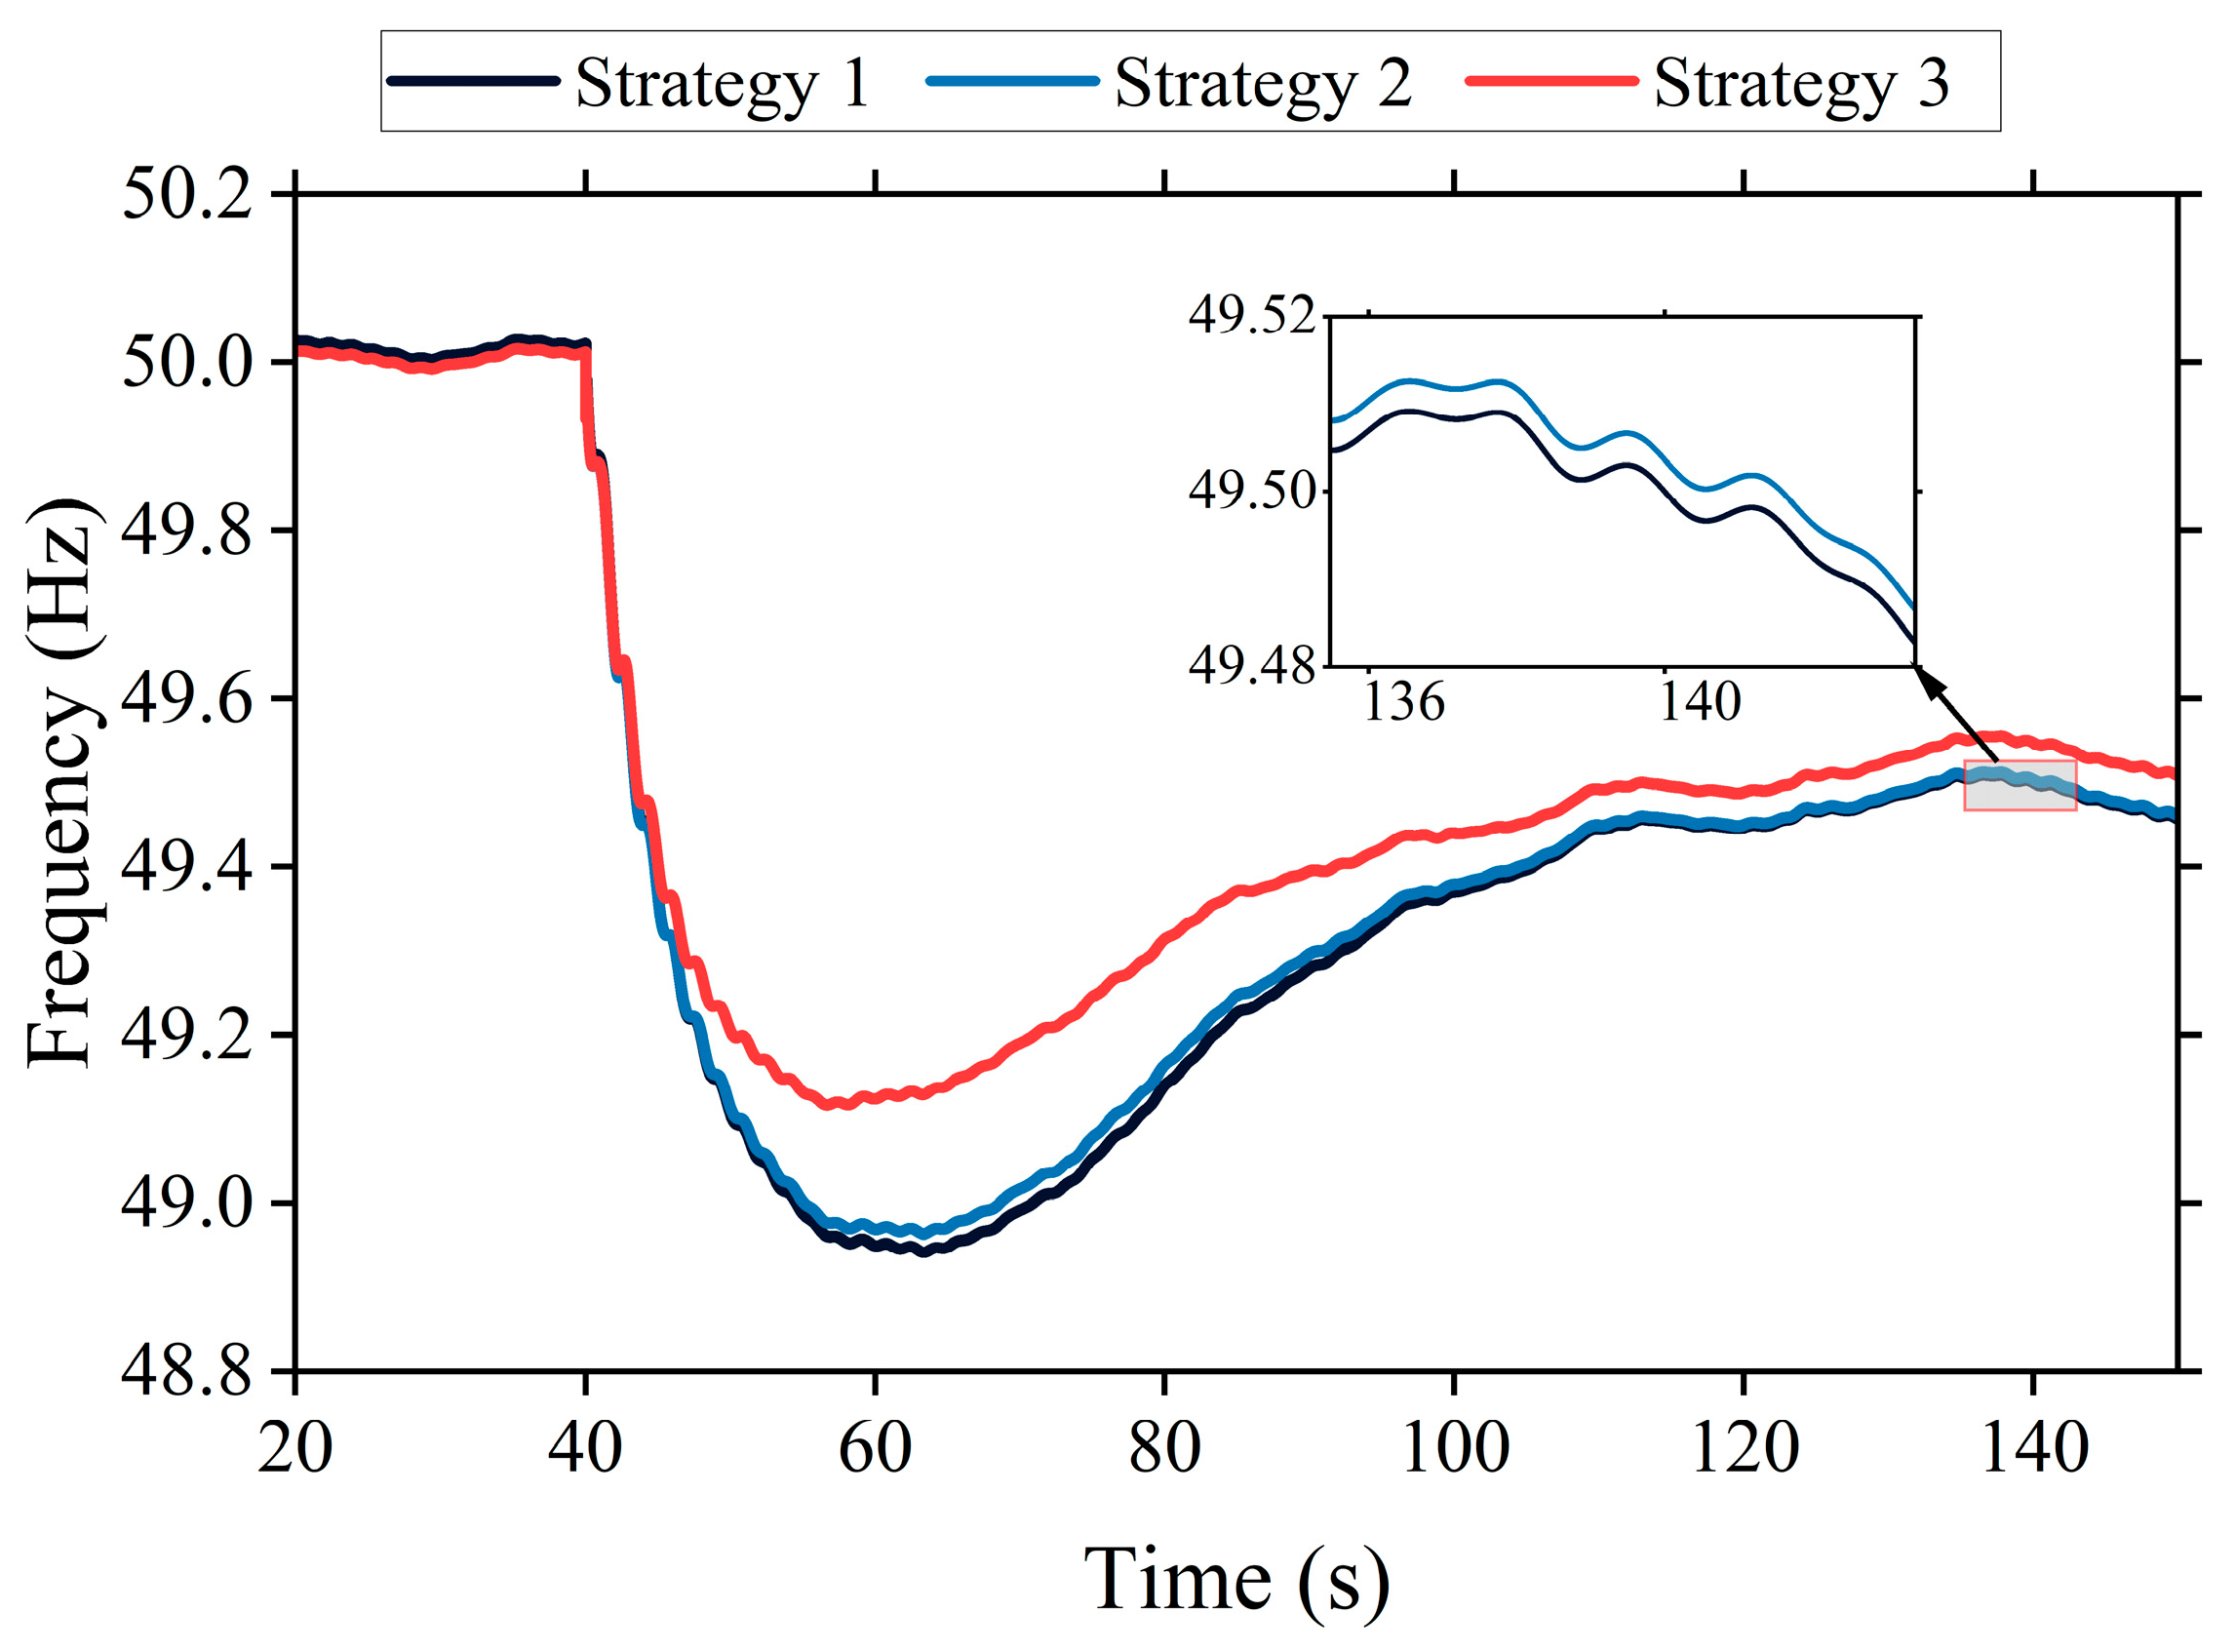
The system frequency response curves are shown in Figure 15. Under Scenario 3, Strategy 1 and Strategy 2 reach their frequency nadirs at t = 63.339s and t = 63.323 s, respectively, with a minimum frequency of 48.942 Hz and 48.964 Hz, and steady-state frequencies of 49.457 Hz and 49.461 Hz. In contrast, Strategy 3 reaches its frequency nadir earlier at t = 56.653 s with a minimum frequency of 49.117 Hz, representing improvements of 0.358% and 0.312% compared to the other strategies. Its steady-state frequency stabilizes at approximately 49.508Hz, showing enhancements of 0.103% and 0.095%, respectively. As shown in Figure 16, the load frequency regulation capability is efficiently utilized un-der the proposed strategy.
In summary, compared with conventional control strategies, the proposed coordinated control strategy incorporating differentiated deadbands and dynamic droop coefficients demonstrates significant advantages. By employing an adaptive regulation mechanism, it effectively elevates the system frequency nadir during transient events and maintains a higher steady-state operating frequency, thereby comprehensively enhancing the dynamic frequency response characteristics of the system.

7. Conclusions

This study comprehensively addresses the challenges of integrating TCLs into power system frequency regulation. The cornerstone of our approach is the development of a novel strategy that integrates node-specific differentiated deadbands with adaptive droop coefficients. This design enables the precise and rapid utilization of TCLs’ inherent fast-response characteristics, strategically leveraging them to compensate for the short-term power deficits that occur between the response stages of conventional thermal generation units.
The efficacy of the proposed strategy was rigorously validated through simulation studies conducted on a modified IEEE 39-bus system using DIgSILENT/PowerFactory2022SP2. The results yield the following critical conclusions:
  • The proposed differentiated deadband strategy effectively prevents TCL misoperation compared to conventional configurations;
  • The developed TCL regulation strategy outperforms alternative approaches in elevating frequency nadir and improving the dynamic frequency response;
  • The proposed evaluation metrics provide an accurate and comprehensive assessment of regulation effectiveness, TCL utilization efficiency, and user impact, with the strategy exhibiting excellent performance across all indices.
The proposed strategy demonstrates three distinctive advantages over conventional methods: rapid response through its differentiated deadband design, precise regulation via adaptive droop coefficients, and complete prevention of maloperations, collectively ensuring reliable frequency control while maintaining user comfort.
Building upon the proactive frequency support framework established in this study, future research will investigate the implementation of load-based frequency regulation, with a specific focus on aligning the strategy with national policies and existing electricity market structures. This direction is crucial for enhancing the practical applicability and real-world implementation potential of the proposed strategy.

Author Contributions

Methodology, M.L.; Software, M.L., S.G. and N.L.; Formal analysis, S.G., N.L. and Y.L.; Writing—original draft, M.L.; Writing—review & editing, M.L., S.G., Y.L. and Y.S.; Visualization, M.L., N.L. and Y.L.; Funding acquisition, Y.S. All authors have read and agreed to the published version of the manuscript.

Funding

This research was funded by Science and Technology Foundation of State Grid Shandong Electric Power Company “Research on Characteristic Analysis and Control Technology of Power Systems with Grid-Forming Centralized Renewable Energy/Energy Storage” (52062624000Z).

Data Availability Statement

The original contributions presented in this study are included in the article. Further inquiries can be directed to the corresponding authors.

Conflicts of Interest

The authors declare no conflict of interest.

References

  1. Xu, D.; Wu, Z.; Guan, L.; Yanling, L. Distributionally robust frequency constrained unit commitment considering load side frequency support. Power Syst. Prot. Control 2025, 9, 1–13. [Google Scholar]
  2. Zhang, Z.; Zhang, N.; Du, E.; Kang, C.; Wang, Z. Review and Countermeasures on Frequency Security Issues of Power Systems with High Shares of Renewables and Power Electronics. Proc. CSEE 2022, 42, 1–25. [Google Scholar]
  3. Wang, Q.; Yu, P.; Guo, J.; Zhang, Z.; Li, J.; Wang, Z. The Wind Turbine Participates in the Virtual Inertia Optimization Control of the System’s Primary Frequency Modulation. Proc. CSEE 2025, 45, 6368–6380. [Google Scholar]
  4. Shi, Q.; Li, F.; Liu, G.; Shi, D.; Yi, Z.; Wang, Z. Thermostatic Load Control for System Frequency Regulation Considering Daily Demand Profile and Progressive Recovery. IEEE Trans. Smart Grid 2019, 10, 6259–6270. [Google Scholar] [CrossRef]
  5. Chakravorty, D.; Chaudhuri, B.; Hui, S.Y.R. Rapid Frequency Response From Smart Loads in Great Britain Power System. IEEE Trans. Smart Grid 2017, 8, 2160–2169. [Google Scholar] [CrossRef]
  6. Liu, Y.; Wu, Z.; Lai, X.; Xu, D. Cooperative control strategy for heterogeneous air-conditioning loads participating infrequency regulation of multi-area power systems. Power Syst. Prot. Control 2025, 53, 47–57. [Google Scholar]
  7. Bao, Y.; Yao, Z. Probability Control Strategy of Temperature Set-Point for Air Conditioning Load Participating in Frequency Regulation of Power System. Autom. Electr. Power Syst. 2023, 47, 69–78. [Google Scholar]
  8. Schweppe, F.C.; Tabors, R.D.; Kirtley, J.L.; Outhred, H.R.; Pickel, F.H.; Cox, A.J. Homeostatic Utility Control. IEEE Trans. Power Appar. Syst. 1980, PAS-99, 1151–1163. [Google Scholar] [CrossRef]
  9. Sun, Y.; Li, Z.; Liu, D.; Li, B.; Li, D.; Zheng, A. An Optimization Control Strategy for Intelligent UFLS Using Dynamically Aggregated Controllable Loads. Proc. CSEE 2018, 38, 1913–1921+2207. [Google Scholar]
  10. Vorwerk, J.; Markovic, U.; Aristidou, P.; Vrettos, E.; Hug, G. Modelling of variable-speed refrigeration for fast-frequency control in low-inertia systems. IET Smart Grid 2020, 3, 924–936. [Google Scholar] [CrossRef]
  11. Ranginkaman, S.; Mashhour, E.; Saniei, M. Bidding strategy of the virtual power plant consisting of thermal loads controlled by thermostats for providing primary frequency control ancillary service. Sustain. Energy Grids Netw. 2024, 38, 101242. [Google Scholar] [CrossRef]
  12. Muhssin, M.T.; Cipcigan, L.M.; Jenkins, N.; Slater, S.; Cheng, M.; Obaid, Z.A. Dynamic Frequency Response from Controlled Domestic Heat Pumps. IEEE Trans. Power Syst. 2018, 33, 4948–4957. [Google Scholar] [CrossRef]
  13. Zhou, T.; Zhou, Y.; Wang, S.; Zhang, N. Review on Synthetic Inertia Support of Inverter-Based Thermostatically Controlled Loads Participating in Power System Frequency Regulation. Proc. CSEE 2025, 1–26. [Google Scholar] [CrossRef]
  14. Wu, X.; He, J.; Xu, Y.; Lu, J.; Lu, N.; Wang, X. Hierarchical Control of Residential HVAC Units for Primary Frequency Regulation. IEEE Trans. Smart Grid 2018, 9, 3844–3856. [Google Scholar] [CrossRef]
  15. Liu, M.; Chu, X.; Zhang, W.; Wang, H. Cooperative Generation-Load Frequency Control Strategy Accounting for Power Network Constraints. Trans. China Electrotech. Soc. 2016, 31, 195–205. [Google Scholar]
  16. Wang, S.; Tomsovic, K. Fast Frequency Support from Wind Turbine Generators with Auxiliary Dynamic Demand Control. IEEE Trans. Power Syst. 2019, 34, 3340–3348. [Google Scholar] [CrossRef]
  17. Shi, Q.; Cui, H.; Li, F.; Liu, Y.; Ju, W.; Sun, Y. Hohai University A hybrid dynamic demand control strategy for power system frequency regulation. CSEE J. Power Energy Syst. 2017, 3, 176–185. [Google Scholar] [CrossRef]
  18. Wang, D.; Zhang, X.; Liu, Q.; Yu, T.; Pan, Z. Ensemble Learning for Generation-Consumption Coordinated Frequency Control in an Islanded Microgrid. Autom. Electr. Power Syst. 2018, 42, 46–52. [Google Scholar]
  19. Liu, M.; Li, Y.; Li, N.; Li, K.; Hong, Z.; Yang, W. Adaptive Frequency Control Strategy for the Coordination of Flexible Loads and Grid-Forming Wind Turbines. In Proceedings of the 3rd International Conference on Power Science and Technology (ICPST), Kunming, China, 16–18 May 2025; IEEE: Piscataway, NJ, USA, 2005. [Google Scholar]
  20. Lou, P.; Bian, X.; Cui, Y.; Wang, X.; Lin, F.; Zhao, Y. Optimal control strategy of source-load coordinated frequency regulation in microgrid considering ancillary service. Electr. Power Autom. Equip. 2022, 42, 156–163+177. [Google Scholar]
  21. Han, L.; Xu, G.; Wang, C.; Bi, T. Correlation Analysis and Distribution Characterization of Frequency Regulation Resources and Frequency Spatiotemporal Dynamics in Renewable Energy Power Systems. Proc. CSEE 2025, 45, 5106–5119. [Google Scholar]
  22. Li, W.; Ding, Q. A Preliminary Research on the Representation Form of Spatial-Temporal Distribution Characteristics of Power System Inertia Under Large Disturbances. Proc. CSEE 2024, 44, 4601–4615. [Google Scholar]
  23. Wu, X.; Li, Z.; Liu, F.; Zhu, L.; Duan, F.; Fan, W. Analysis of the emergency control strategy of system frequency considering system frequency distribution characteristics under large power disturbance. Power Syst. Prot. Control 2021, 49, 104–114. [Google Scholar]
  24. Liu, M.; Xie, X.; Yang, W.; Xu, F.; Gao, S.; Ding, L.; Liang, H. A two-level optimal scheduling control strategy for air source heat pump loads with phase change energy storage. IET Gener. Transm. Distrib. 2025, 19, e70004. [Google Scholar] [CrossRef]
  25. Li, C.; Feng, C.; Li, J.; Hu, D.; Zhu, X. Comprehensive frequency regulation control strategy of thermal power generating unit and ESS considering flexible load simultaneously participating in AGC. J. Energy Storage 2023, 58, 106394. [Google Scholar] [CrossRef]
  26. Anderson, P.; Mirheydar, M. A low-order system frequency response model. IEEE Trans. Power Syst. 1990, 5, 720–729. [Google Scholar] [CrossRef]
  27. Li, C.; Liu, Y.; Zhang, H.; Li, C.; Liu, Y.; Zhang, H.; Zhuang, K.; Cao, L.; Huang, Z. Power System Frequency Response Analysis Based on the Direct Current Loadflow. CSEE J. Power Energy Syst. 2009, 29, 36–41. [Google Scholar]
  28. Liu, W. Power System Frequency Regulation and Automatic Generation Control; China Electric Power Press: Beijing, China, 2006. [Google Scholar]
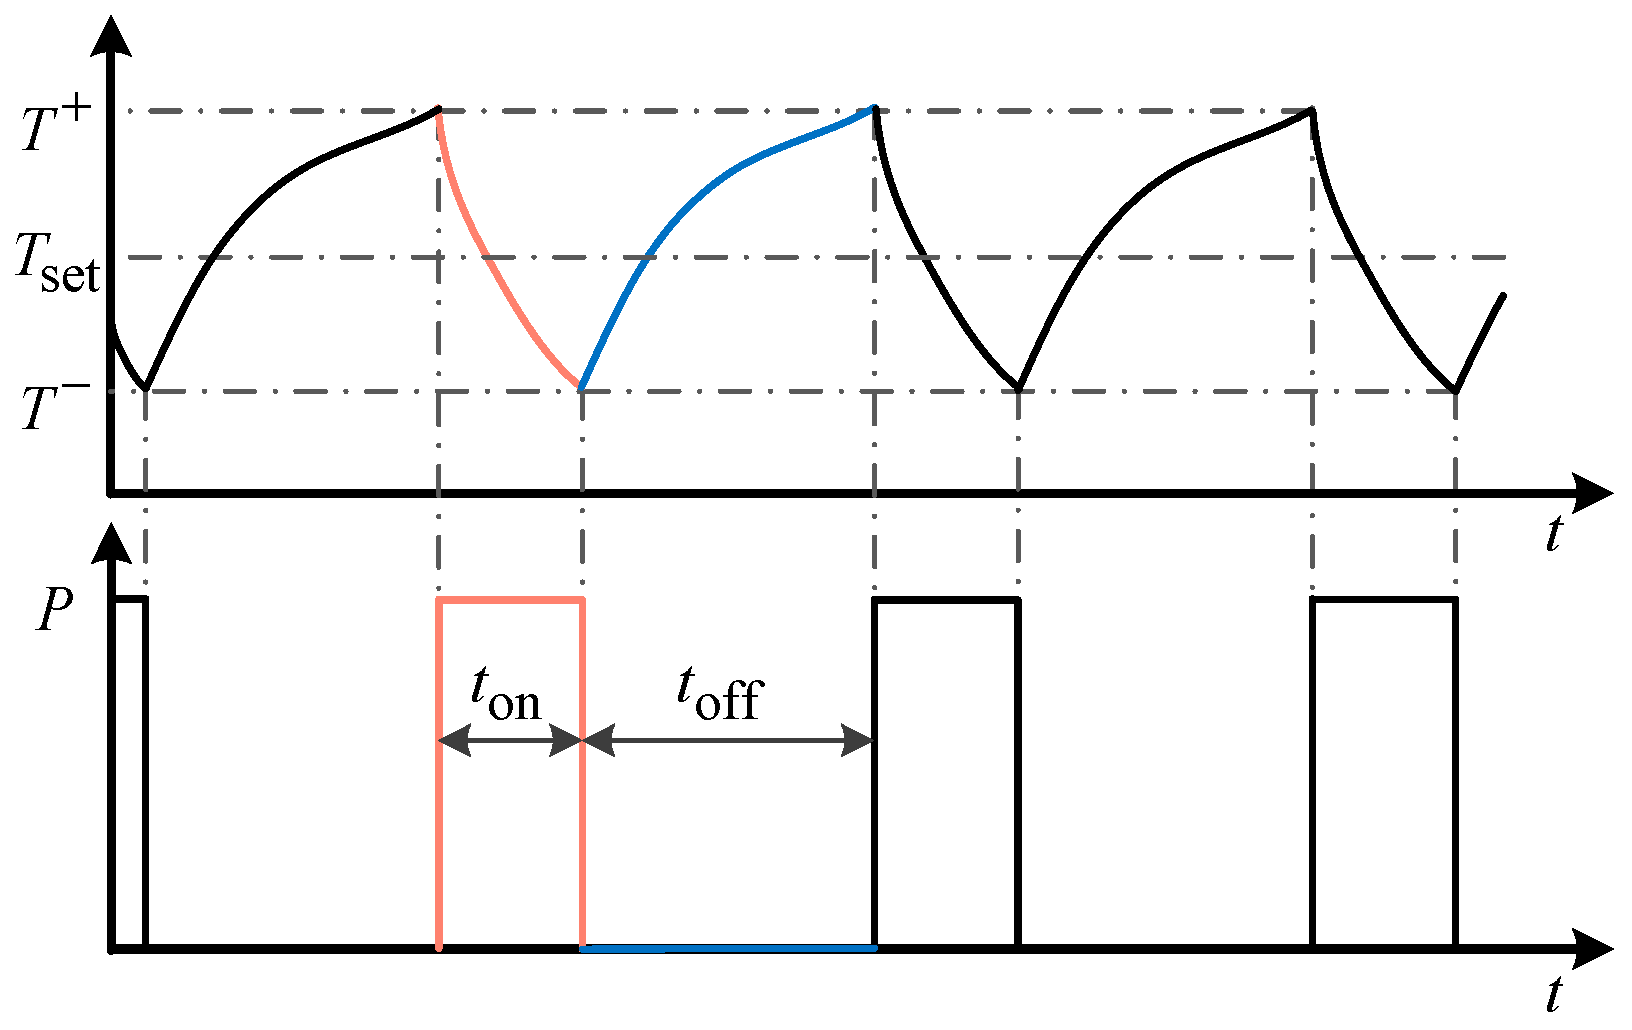
Figure 1. Differential Characteristics of Indoor Temperature and Air Source Heat Pump Power.
Technologies 13 00510 g001
Figure 2. Power Response Schematic Diagram.
Technologies 13 00510 g002
Figure 3. Typical System Model Incorporating New Energy.
Technologies 13 00510 g003
Figure 4. Frequency Response Curves of Each Node Under Load Fluctuation.
Technologies 13 00510 g004
Figure 5. Differential Dead Zone Schematic Diagram of Node Frequency.
Technologies 13 00510 g005
Figure 6. Schematic Diagram of Load Control Architecture.
Technologies 13 00510 g006
Figure 7. Simulation System Schematic Diagram.
Technologies 13 00510 g007
Figure 8. Load Fluctuation under the First Condition.
Technologies 13 00510 g008
Figure 9. System Frequency Response under Scenario 1.
Technologies 13 00510 g009
Figure 10. Load Power Variation under Scenario 1. (a) Load Power Variations under Strategy 1; (b) Load Power Variations under Strategy 2; (c) Load Power Variations under Strategy 3.
Technologies 13 00510 g010
Figure 11. System Frequency Response under Scenario 2.
Technologies 13 00510 g011
Figure 12. Load Power Variation under Scenario 2. (a) Load Power Variations under Strategy 1; (b) Load Power Variations under Strategy 2; (c) Load Power Variations under Strategy 3.
Technologies 13 00510 g012
Figure 13. System Frequency Response under Scenario 3.
Technologies 13 00510 g013
Figure 14. Load Power Variation under Scenario 3. (a) Load Power Variations under Strategy 1; (b) Load Power Variations under Strategy 2; (c) Load Power Variations under Strategy 3.
Technologies 13 00510 g014
Figure 15. System Frequency Response under Scenario 4.
Technologies 13 00510 g015
Figure 16. Load Power Variation under Scenario 4. (a) Load Power Variations under Strategy 1; (b) Load Power Variations under Strategy 2; (c) Load Power Variations under Strategy 3.
Technologies 13 00510 g016
Table 1. Deadband Setting Results under the First Condition.
Bus No.Deadband Width (Hz)
No DeadbandFixed DeadbandDifferentiated Deadband
100.03000.0319
900.03000.0321
1300.03000.0297
1600.03000.0274
1700.03000.0279
2100.03000.0270
Table 2. False Operation Status of the Three Methods under the First Condition.
Bus No.1913161721
False OperationNo DeadbandYesYesYesYesYesYes
Fixed DeadbandNoNoYesYesYesYes
Differentiated DeadbandNoNoNoNoNoNo
Table 3. Droop Coefficient Setting Results under Scenario 1.
Bus No.Droop Coefficient (MW/Hz)
Strategy 1Strategy 2Strategy 3
13030519
93030130
133030367
163030110
17303090
21303048
Table 4. Droop Coefficient Setting Results under Scenario 2.
Bus No.Droop Coefficient (MW/Hz)
Strategy 1Strategy 2Strategy 3
13030211.1
9303060
133030165.1
16303060
17303057.1
21303022
Table 5. Droop Coefficient Setting Results under Scenario 3.
Bus No.Droop Coefficient (MW/Hz)
Strategy 1Strategy 2Strategy 3
13030129.1
9303029.1
133030103.1
16303049.1
17303026
21303031.1
Table 6. Droop Coefficient Setting Results under Scenario 4.
Bus No.Droop Coefficient (MW/Hz)
Strategy 1Strategy 2Strategy 3
1303081.1
9303040
13303090
16303040
17303040
21303039
Disclaimer/Publisher’s Note: The statements, opinions and data contained in all publications are solely those of the individual author(s) and contributor(s) and not of MDPI and/or the editor(s). MDPI and/or the editor(s) disclaim responsibility for any injury to people or property resulting from any ideas, methods, instructions or products referred to in the content.