Article

Implementation of a Wireless Sensor Network for Environmental Measurements

by
Rosa M. Woo-García
1,2,
José M. Pérez-Vista
1,
Adrián Sánchez-Vidal
1,
Agustín L. Herrera-May
2,3,*,
Edith Osorio-de-la-Rosa
4,
Felipe Caballero-Briones
5 and
Francisco López-Huerta
1,*
1
Faculty of Electrical and Electronic Engineering, Universidad Veracruzana, Boca del Río 94294, Veracruz, Mexico
2
Facultad de Ingeniería de la Construcción y el Hábitat, Universidad Veracruzana, Boca del Río 94294, Veracruz, Mexico
3
Micro and Nanotechnology Research Center, Universidad Veracruzana, Boca del Río 94294, Veracruz, Mexico
4
CONAHCYT, Universidad Autónoma del Estado de Quintana Roo, Chetumal 77019, Quintana Roo, Mexico
5
Instituto Politécnico Nacional, Materiales y Tecnologías para Energía, Salud y Medio Ambiente (GESMAT), CICATA, Altamira 89600, Tamaulipas, Mexico
*
Authors to whom correspondence should be addressed.
Technologies 2024, 12(3), 41; https://doi.org/10.3390/technologies12030041
Submission received: 30 January 2024 / Revised: 6 March 2024 / Accepted: 12 March 2024 / Published: 16 March 2024
(This article belongs to the Special Issue Perpetual Sensor Nodes for Sustainable Wireless Network Applications)

Abstract

:
Nowadays, the need to monitor different physical variables is constantly increasing and can be used in different applications, from humidity monitoring to disease detection in living beings, using a local or wireless sensor network (WSN). The Internet of Things has become a valuable approach to climate monitoring, daily parcel monitoring, early disease detection, crop plant counting, and risk assessment. Herein, an autonomous energy wireless sensor network for monitoring environmental variables is proposed. The network’s tree topology configuration, which involves master and slave modules, is managed by microcontrollers embedded with sensors, constituting a key part of the WSN architecture. The system’s slave modules are equipped with sensors for temperature, humidity, gas, and light detection, along with a photovoltaic cell to energize the system, and a WiFi module for data transmission. The receiver incorporates a user interface and the necessary computing components for efficient data handling. In an open-field configuration, the transceiver range of the proposed system reaches up to 750 m per module. The advantages of this approach are its scalability, energy efficiency, and the system’s ability to provide real-time environmental monitoring over a large area, which is particularly beneficial for applications in precision agriculture and environmental management.

1. Introduction

Due to the great demand for higher crop yields, farmers and researchers have developed processes to increase the productivity of parcels using technologies such as precision agriculture, which allows for making management decisions by analyzing the environment, soil, and even plant health [1,2]. Precision agriculture uses several technological tools from the Internet of Things (IoT), such as satellite positioning systems, smart sensors, radios (transmission and reception), and tools for soil condition analysis. This approach enhances crop yield and material efficiency through a precise analysis of soil variability and crop needs [3,4,5], as well as by the real-time analysis of weather conditions such as relative humidity, insolation, UV index, precipitation, and wind speed and direction. These data can be used to improve the production of future crop generations, incorporating the results of each test to determine adjustments to yield margins (quantity/quality) [4]. Thus, precision agriculture allows for the determination of the necessary machinery and amounts of primary materials along the planting space, optimizing the resources within a limited area, considering conditions such as fertilizer doses, seed densities, seeding dates, and gaps between rows, among other variables, as well as the alerting of risky conditions for crop development.
Other features of precision agriculture are the information technology (IT) and transmission systems for data collection, processing, management, and storage. These data are submitted to a control point where decisions and actions are implemented [1]. These data allow for the remote monitoring of crop conditions and access to real-time information to make necessary adjustments. In addition, the mapping of the crop area can be performed using drones, which record crop conditions [6].
Wireless sensor networks (WSNs) are at the core of IoT technologies. Their integration into precision agriculture increases the efficiency, productivity, and profitability of many agricultural production systems. A WSN is composed of different components and technologies. The most important is the sensor node (SN), which allows for monitoring and communicating with another SN and a base station (BS) to access the cloud/internet. For a sensor node of a WSN, its internal structure consists of four main units. The element that interacts with the physical environment, recording the physical phenomenon of interest, is known as the sensing unit. The controller unit (e.g., microcontroller, Raspberry® Pi 4, Arduino® uno, ESP32® S2, or any other) can process, store, and connect to other units and peripheral devices. The communication unit, depending on the routing architecture of the WSN, can be cell phones (e.g., 4G/5G/LTE/NB-IoT), low-power (e.g., long-range, Bluetooth low energy, SIGFOX® V2, Zigbee® 3), Lo-RaWAN, WiFi, or another suitable communication technology. Finally, the WSN can be directly energized with the electricity line or battery-powered with/without the support of energy harvesting techniques, such as photovoltaic cells or piezoelectric transductors [7,8,9,10,11,12,13,14,15].
The base station provides two-way communication with the cloud/user, and the WSN handles resource-intensive computational tasks and performs control, network construction, event sampling planning, and network monitoring. The base station can use communication standards like those of the sensor node. Furthermore, these communication standards allow for communication with the cloud services technologies that host the applications, the event data analysis engines, the security protocols, the robust IoT applications, the user interface, and the event database. Finally, the graphical user interface (GUI) allows for monitoring and control via web and/or mobile applications.
To increase the monitoring coverage area, a conventional WSN connects sensor nodes in a cluster network [16] with a static network topology using multiple base stations that propagate sensor data across multiple repeating nodes [17]. Another option to increase the coverage is distributing the power load among the sensor nodes. Therefore, a WSN can use multiple nodes as repeating nodes that can transmit the sensor data to the base station. As a result, the WSN implements complex routing algorithms which can create additional processing loads for the sensor nodes with the subsequent increase in power consumption. Thus, the components, technologies, and topologies in the WSN design for regional deployment must be carefully selected according to the final user requirements and local conditions; for instance, the use of LoRa or BLE protocols, as well as renewable energy for powering WSNs, is suitable in areas without cell communications and off the electrical grid.
Visconti et al. [18] reported a tree topology to improve the performance of a WSN-enabled agricultural monitoring system. This system included a cheap sensor node like a commercial sensor or a NodeMCU® ESP8266 module that can transmit data to the control unit using WiFi. Data processing and thresholding techniques were employed to monitor and optimize fertilizer usage, fertigation processes, and various agricultural operations, ensuring efficient resource management in farming practices. Additionally, the authors developed an agronomic model that incorporates cost-effective technology with traditional crop management with climate monitoring and sensor data. In addition, a minimal environmental impact was achieved due to the great savings in fertilizers and water [18].
Tagarakis et al. [19] developed a non-expensive and low-power WSN to monitor orchards. They used a WSN with a star communication protocol for a communication range longer than 250 m. This WSN can safely cover the needs of orchards and any other agricultural fields, sized up to 36 ha, with only one network. Moreover, this system can support up to seven nodes in a 30 min data acquisition cycle or 14 nodes in an hourly cycle.
As discussed, precision agriculture requires cost-effective WSNs for the real-time monitoring of several parameters, such as temperature, moisture, light intensity, gases, acid rain amounts, and soil pollution, with appropriate power management.
Herein, a simple, off-the-grid, and versatile WSN in a tree topology for precision agriculture with novel features is proposed. The WSN was tested in and around Veracruz City on the Southwestern coast of the Gulf of Mexico. The manuscript delineates the integration of photovoltaic-driven autonomous energy systems within a tree-topology-based WSN, augmented by an intuitive LabView® 2022 Q3 package, and graphical user interface; the system demonstrates an extended signal transmission range up to 750 m, thereby enhancing the efficacy of environmental monitoring protocols. Thereafter, the results and discussion show the implementation of the WSN nodes both in city and countryside environments, comparing their performance and capabilities to, finally, state the conclusions and enhance the novelty and highlights of the work and the future work to be done.

2. Materials and Methods

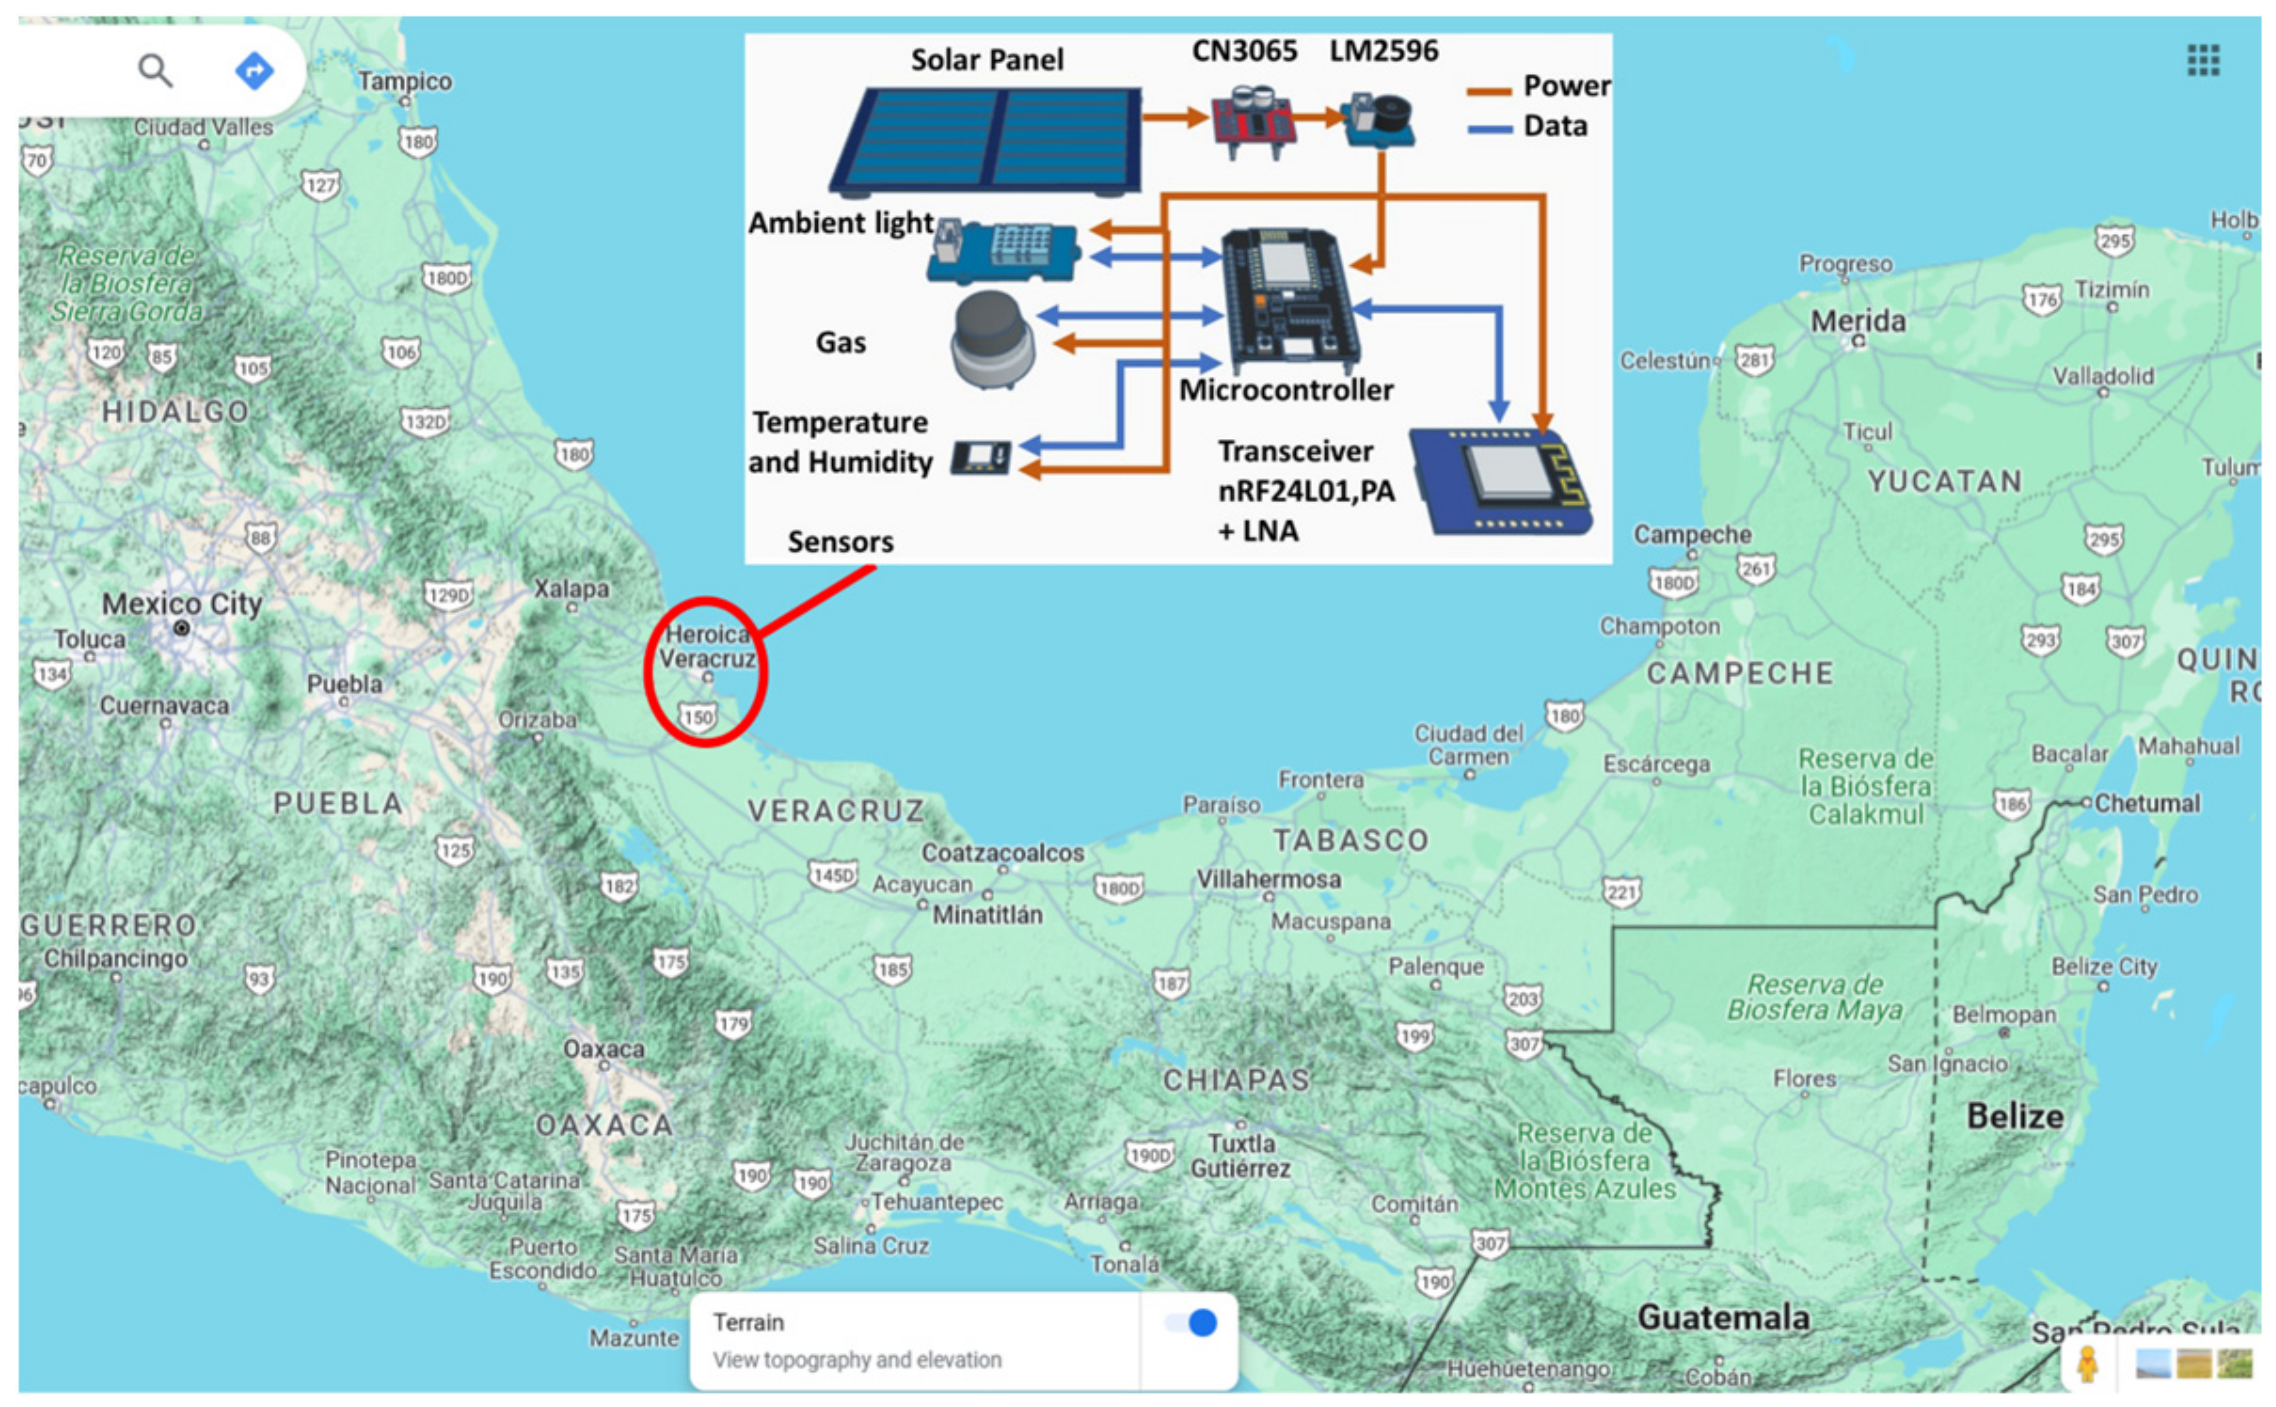
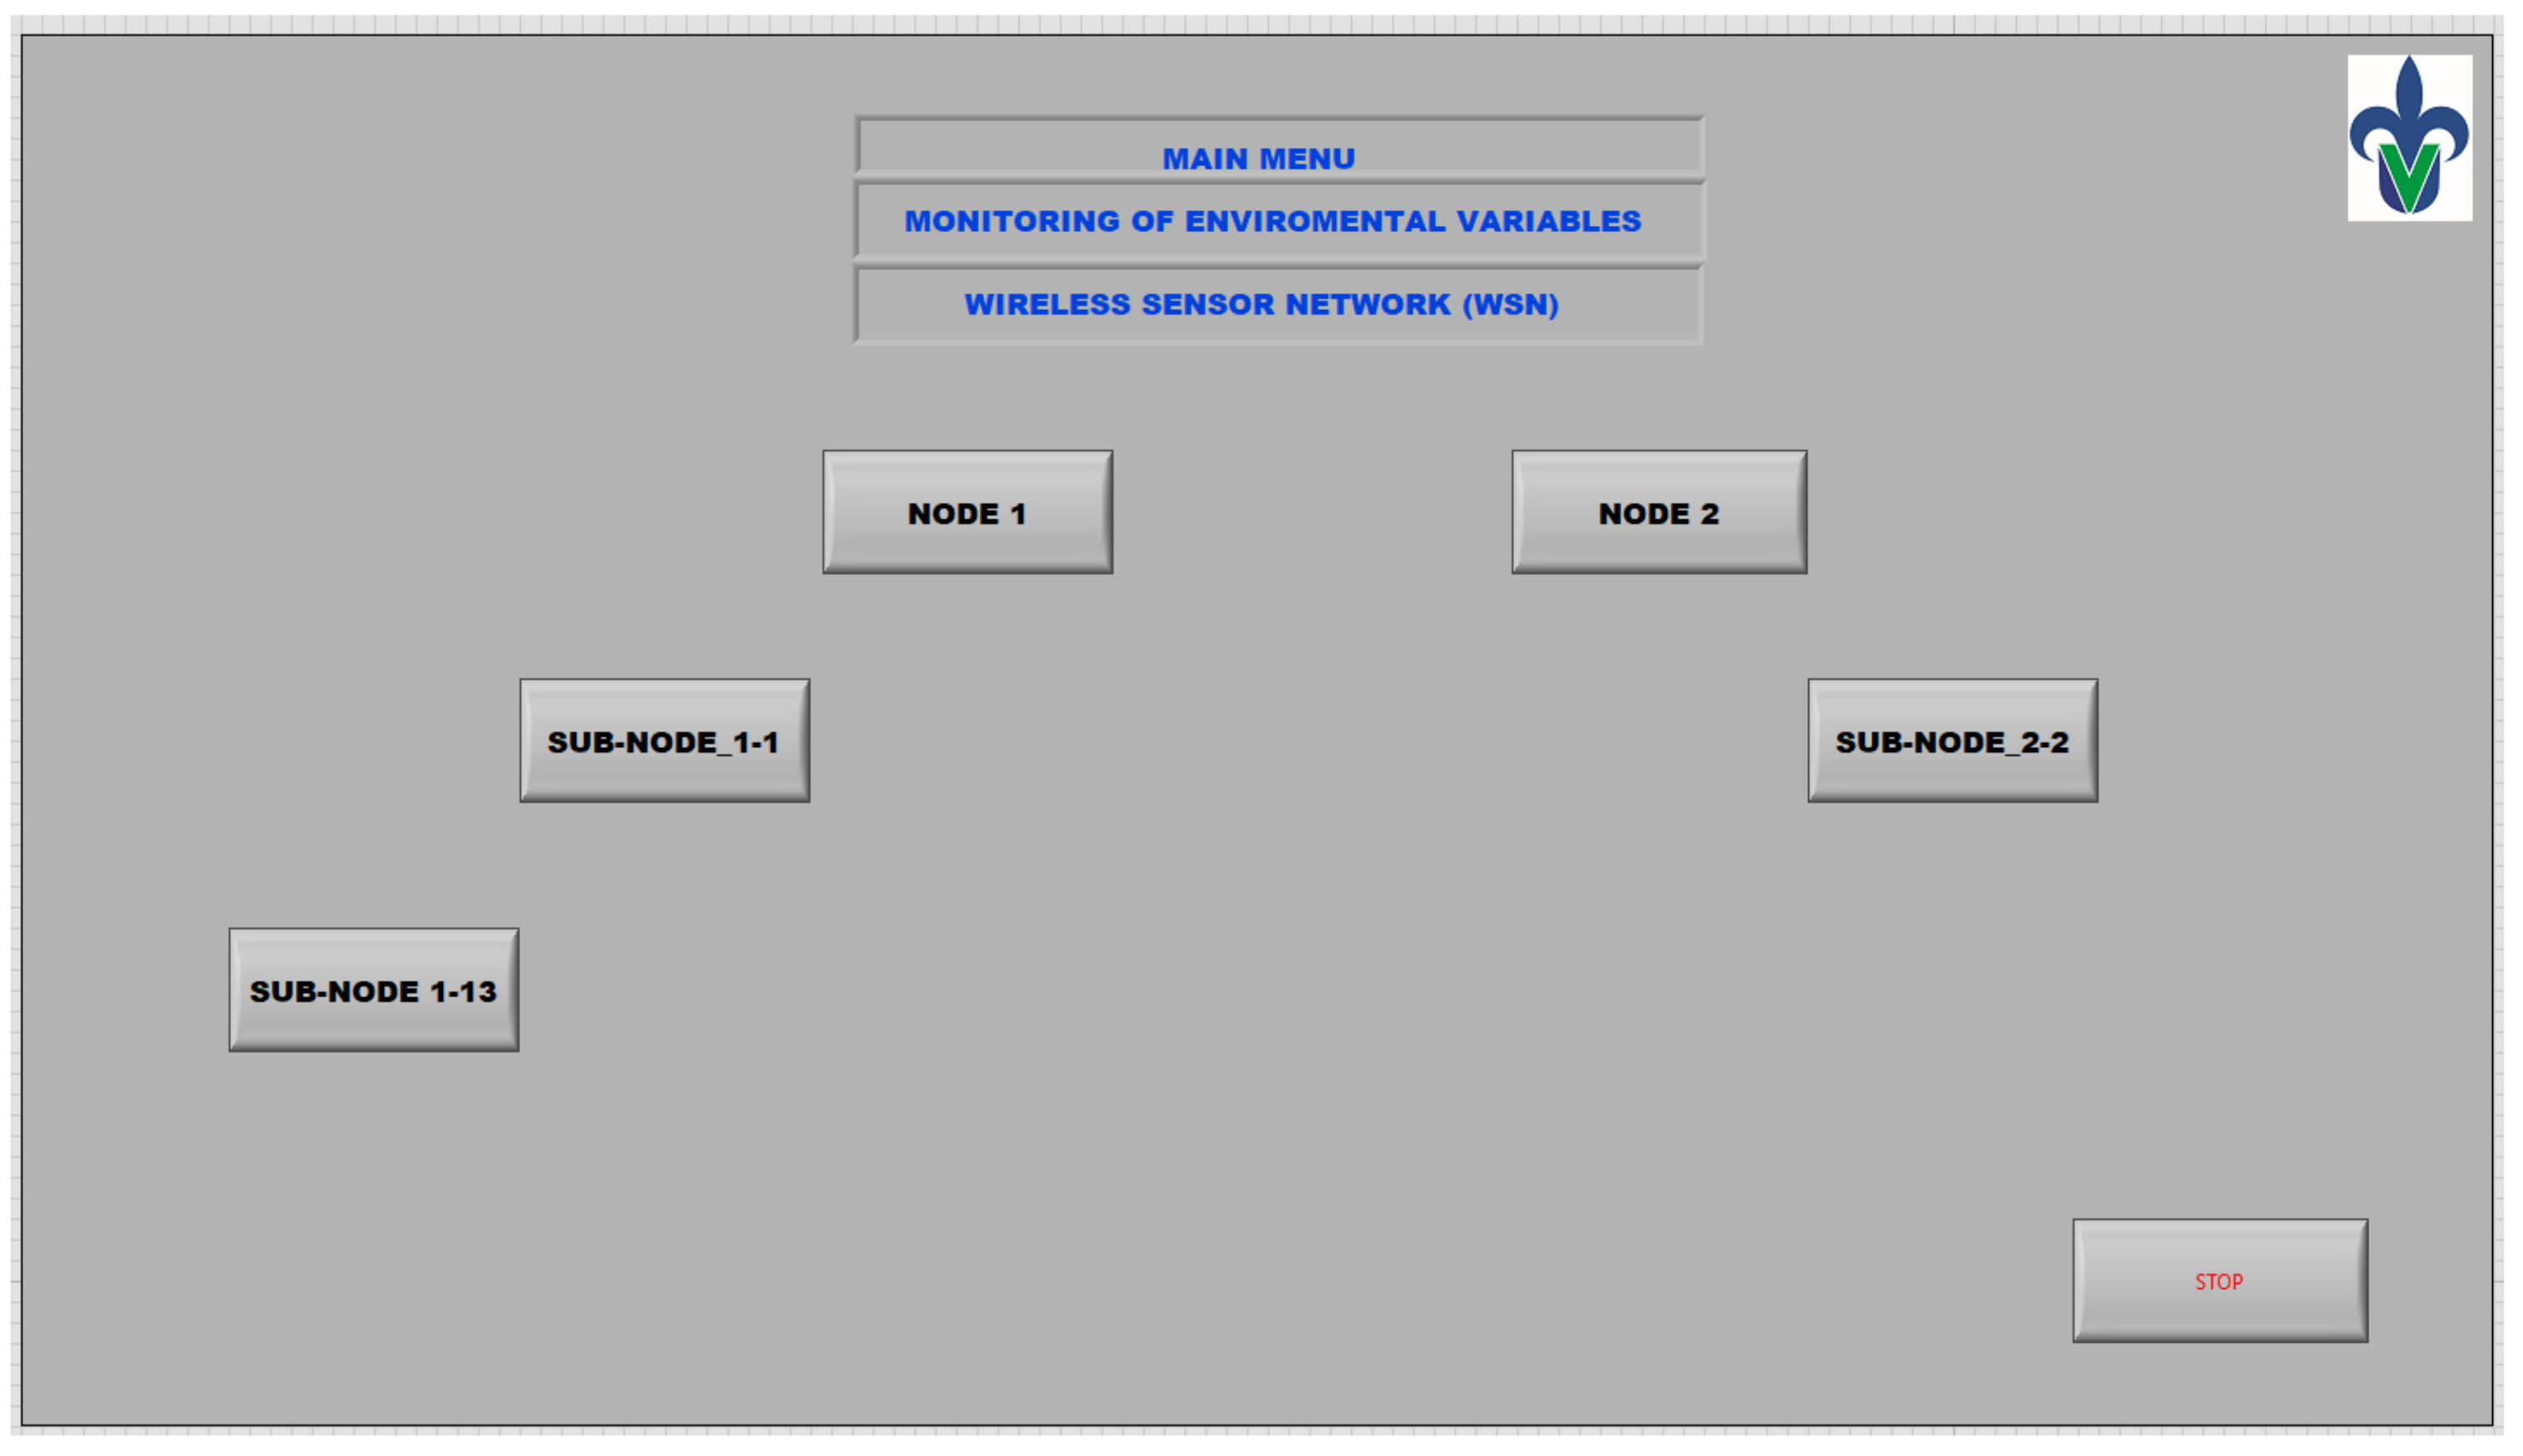
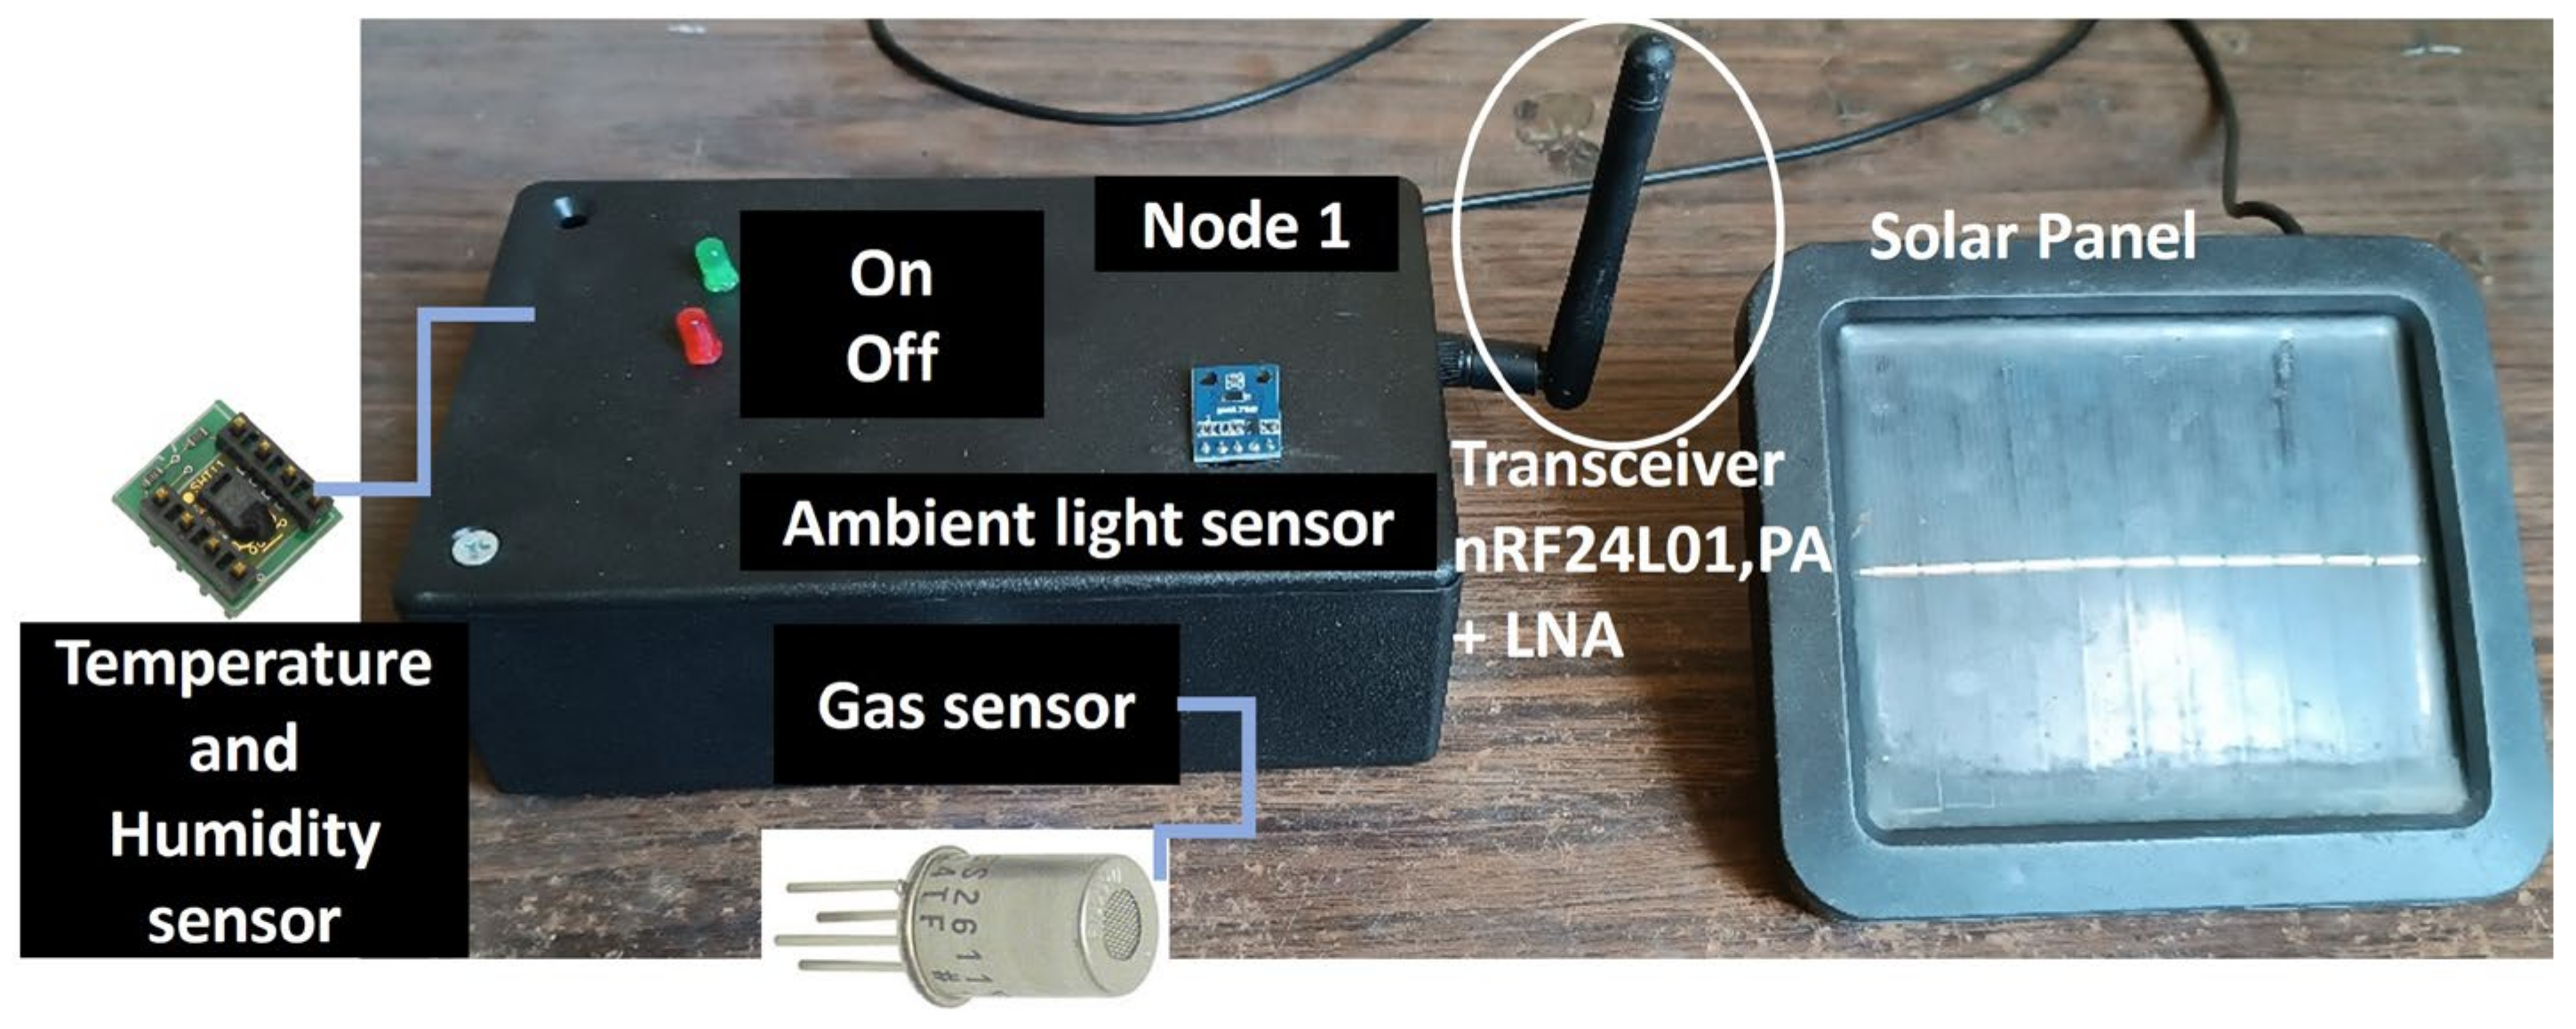
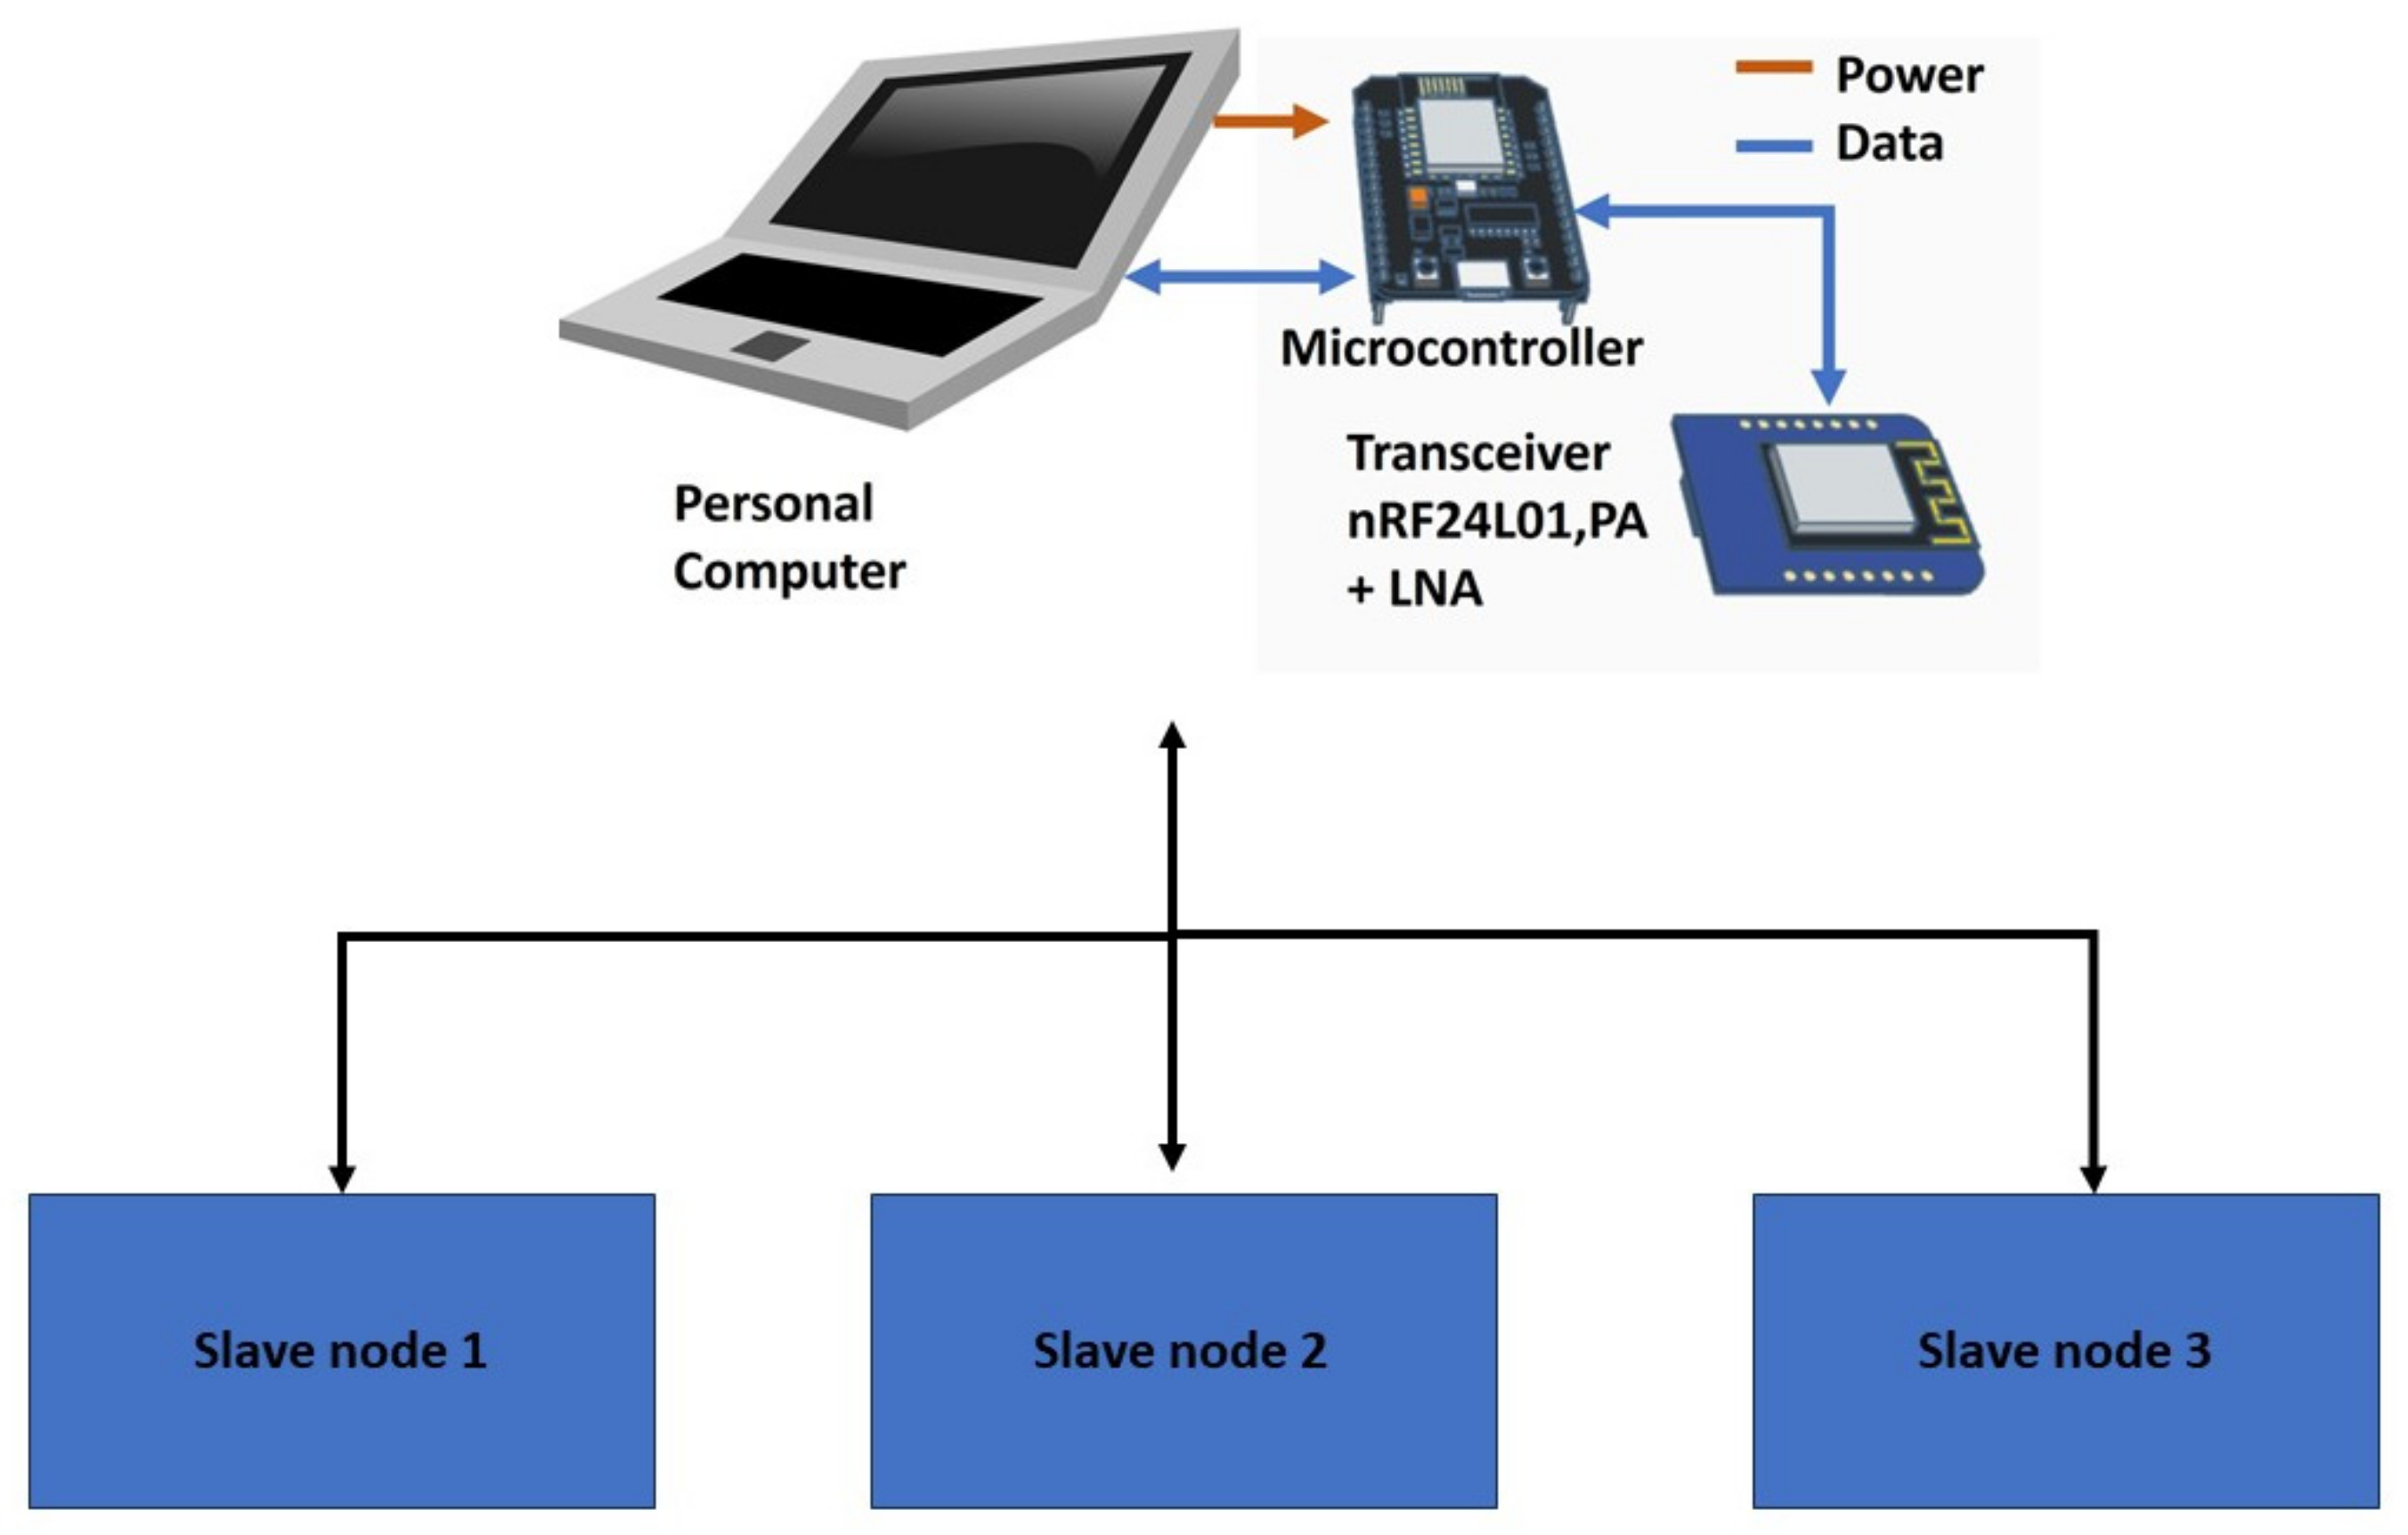
2.1. System Description

The master node of the WSN includes an 8-bit microcontroller, an nRF24L01 WiFi module, a personal computer, and a GUI developed in a LabView® 2022 Q3 environment using a block graphical visual programming language. The WSN also includes moisture, temperature, gas, and light sensors. These sensors monitor the environmental parameters and display them on the GUI. The entire system is powered by a 1 W photovoltaic cell. The sensing system monitored the variables in Veracruz, a city located in central-eastern Mexico on the Gulf of Mexico coast, with a population of approximately 420 thousand residents. Veracruz is the second most important commercial seaport in Mexico, and it has a warm tropical climate, with an average annual temperature of 25.7 °C, an average annual rainfall of 1724 mm, and a terrain with small heights and valleys, with an average altitude of 10 m.a.s.l. The localization of Veracruz in Mexico and the scheme of a single slave node of the proposed WSN are shown in Figure 1.
The tree topology, used in the proposed WSN, is shown in Figure 2. The tree topology differs from the mesh topology in that the relationship between nodes is not equal and there is a clear master–slave relationship. In this structure, the top nodes of the network are the coordinators, the second-level nodes are the routers, and the terminal nodes are the end devices. One of the advantages of the tree topology is that as a hierarchical network, the latency of data transmission can be predicted. The master always keeps track of the status of its nodes, and the connection status of the network is aggregated along the root of the tree, making it easy to know the connection status of the entire network. In addition, more sensors can be added to form branches at any level of the network [20]. The proposed tree topology network is connected by five nodes and a master node to shorten the transmission time in the entire network. Two nodes are first-level nodes, two second-level nodes, and one third-level node, with an approximate separation of 200 to 300 m between nodes.
The entire system is composed of four slave nodes and one master node. The slave node includes one 8-bit microcontroller, and a SHT11 temperature/humidity sensor, which operates on a voltage range of 2.4–5.5 V, with a power consumption of 5 µW in sleep mode and 3 mW in measuring mode, and an average of 150 µW. A TGS 2611-E00 gas sensor and a BH1750 light intensity sensor are also included. The latter sensor uses the I2C communication protocol, operates on a voltage range of 2.4–3.6 V, consumes a current of 0.12 mA, and has an accuracy of +/−20%. For data communication, an nRF24L01 WiFi chip with a 2.4 GHz transceiver and an embedded baseband protocol, operating in the worldwide ISM frequency band at 2.400–2.4835 GHz, is used. The nRF24L01 is configured and operated through a Serial Peripheral Interface. The air data rate supported by the nRF24L01 is configured to 2 Mbps and has internal voltage regulators with a wide power supply range of 1.9 to 3.6 V. A rechargeable 18,650 lithium battery with 3.7 V and 2900 mAh, with a CN3065 solar charger, is the complete constant-current/constant-voltage linear charge for single cell Li-ion and Li-polymer rechargeable batteries with the protection of high temperatures during high-power operations or high ambient temperatures. The DC-DC LM2596 voltage regulator provides all the active functions for a step-down (buck) switching regulator, with a maximum driving load of 3 A and an excellent line and load regulation. These devices are available in fixed output voltages of 3.3, 5, and 12 V, including an adjustable output version. The system is powered by a 1 W photovoltaic cell. The WSN configuration allows for efficient hierarchical data management and network scalability, characteristic of tree topology networks. The 8-bit microcontroller acts as the central processing unit, managing computations and control functions. The nRF24L01 WiFi module facilitates wireless communication with the slave nodes. The personal computer offers more extensive data processing capabilities and storage, while the LabView® 2022 Q3 GUI provides a user-friendly interface for real-time network monitoring and control, enhancing the usability and management efficiency of the WSN.
LabView® 2022 Q3 uses the data flow diagram programming paradigm and determines program execution. When a program is generated, three windows are activated: the front panel window, the block diagram, and the connector and icon panel. The block diagram contains the graphical source code. The front panel is the user interface of the graphical program that incorporates the controls and the interactive elements, which are inputs to the system and supply information to the block diagram. In addition, this panel considers the indicators that simulate output devices and displays the data that the block diagram acquires and/or generates. Figure 3 displays the GUI’s front panel, developed within the LabView® 2022 Q3 environment, tailored to the tree topology configuration of the proposed WSN. This user-friendly interface features a main menu for easy selection and a display with information from each node. When a node is selected, the GUI smoothly transitions to present detailed data specific to that node, such as operational status and sensor readings. The intuitive design of the GUI reflects the hierarchical structure of the tree topology, enabling users to quickly grasp the network layout and efficiently monitor each node’s health and performance.
The GUI’s design is particularly adept at facilitating the identification of potential issues or maintenance needs within the network. It provides clear visual indicators for the status of each node, including alerts for connectivity problems, sensor malfunctions, or power issues. This level of detail in visualization is essential for maintaining the network’s functionality, especially in scenarios requiring real-time data monitoring and swift responses to environmental changes. The GUI, thus, plays a crucial role in enhancing the ease of network management and troubleshooting in the WSN.
The front panel shown in Figure 3 displays five icons which open a secondary menu for each node or sub-node. The sub-nodes are the links to the higher-level nodes, as shown in Figure 4. The Stop icon halts the entire acquisition system process.
Each node displays a menu such as that of the front panel of Figure 5, which shows the readings of every environmental variable. The information can be displayed either in a numerical or graphical form. The historical information for each node can be presented by day, week, month, or year.

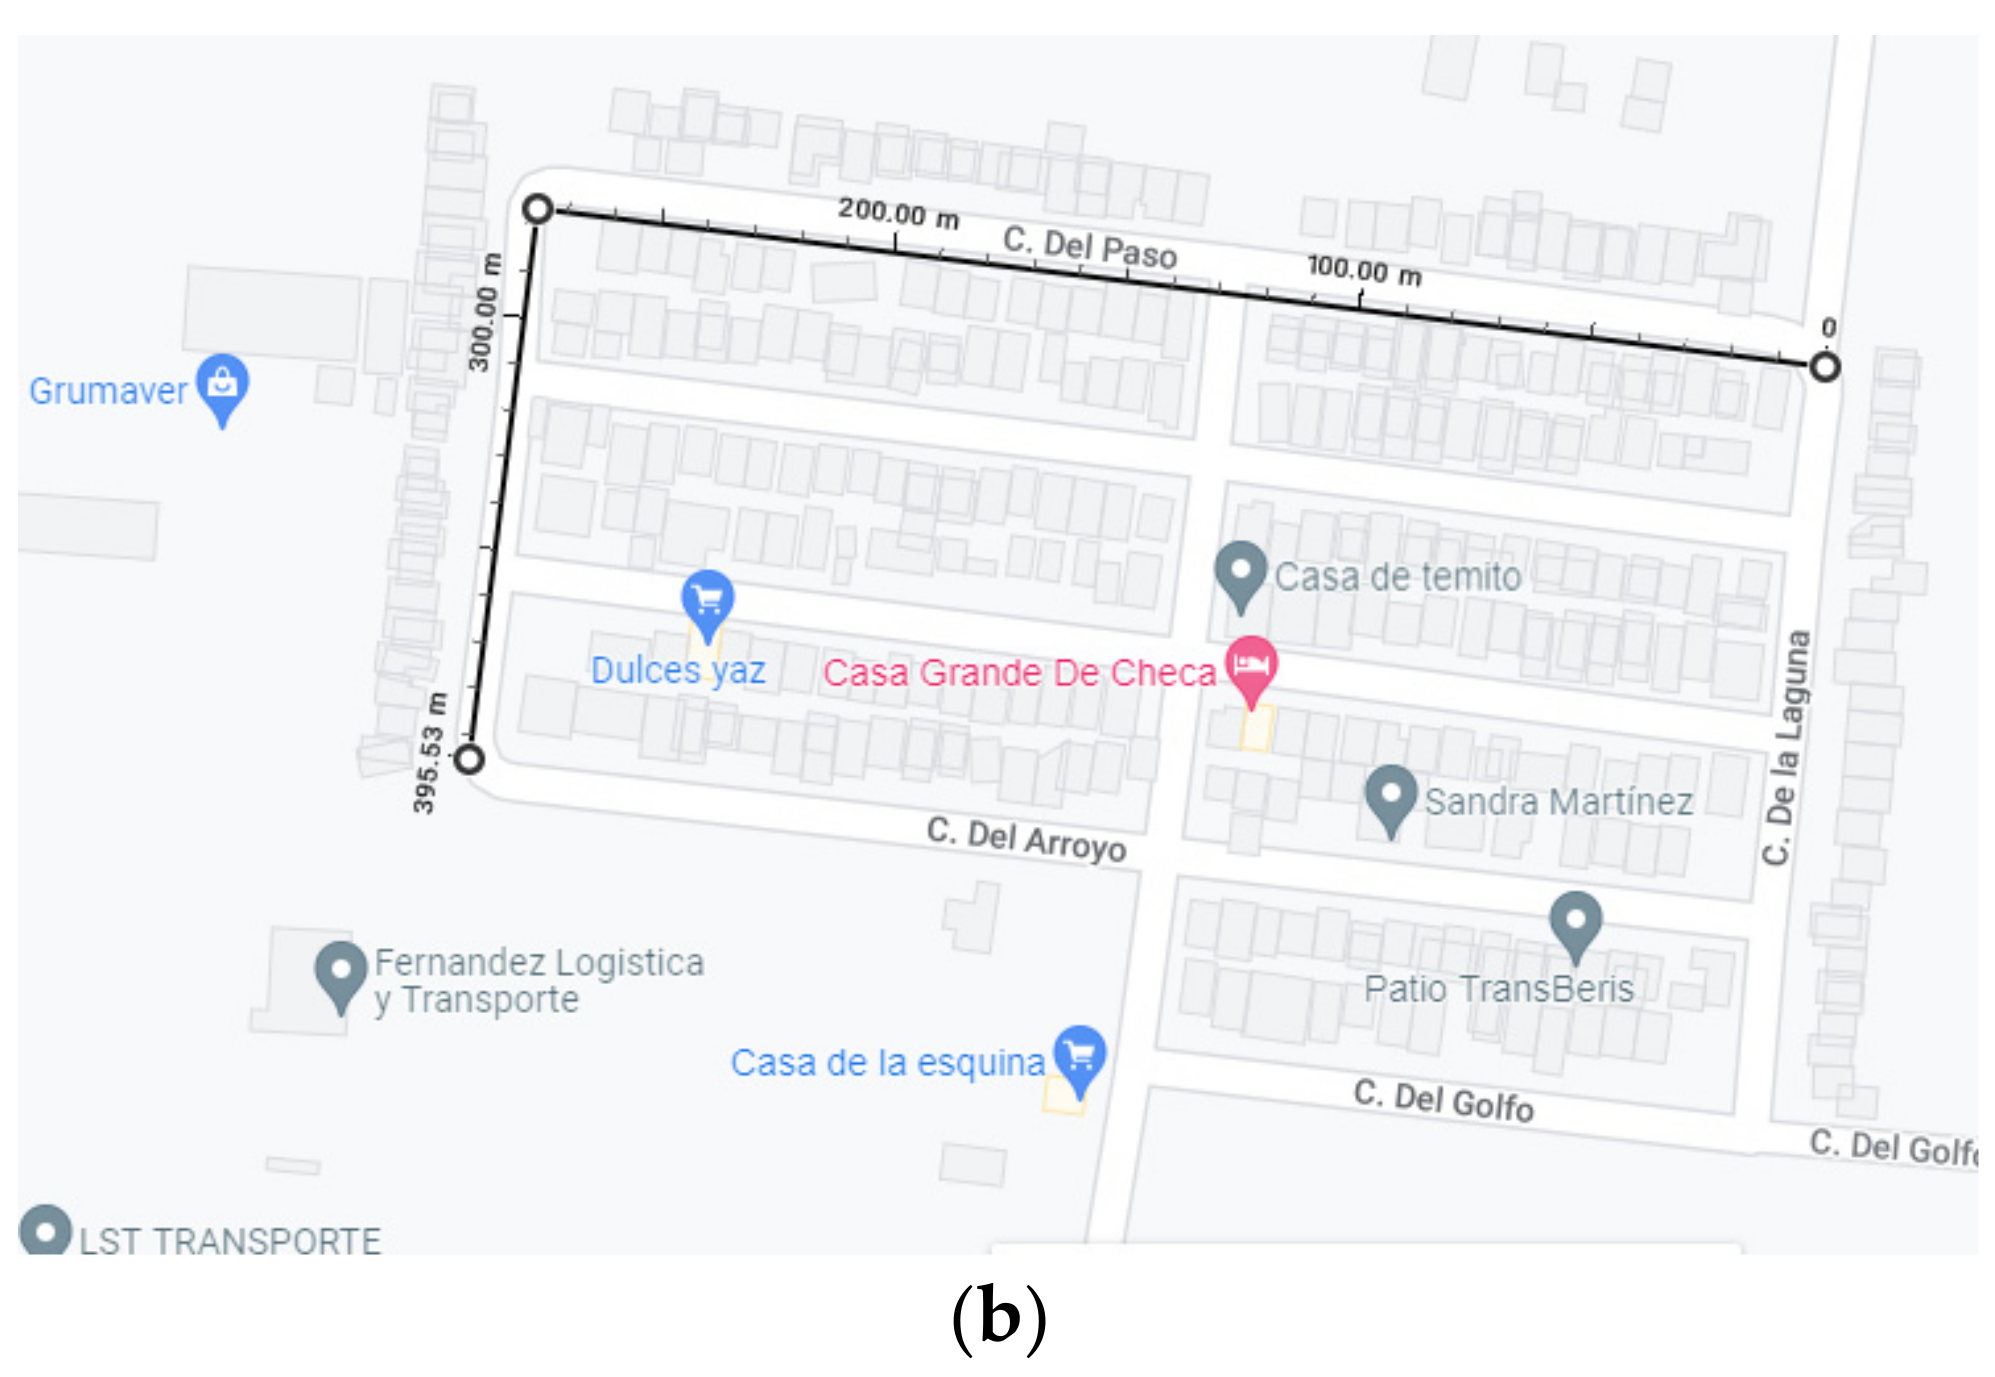
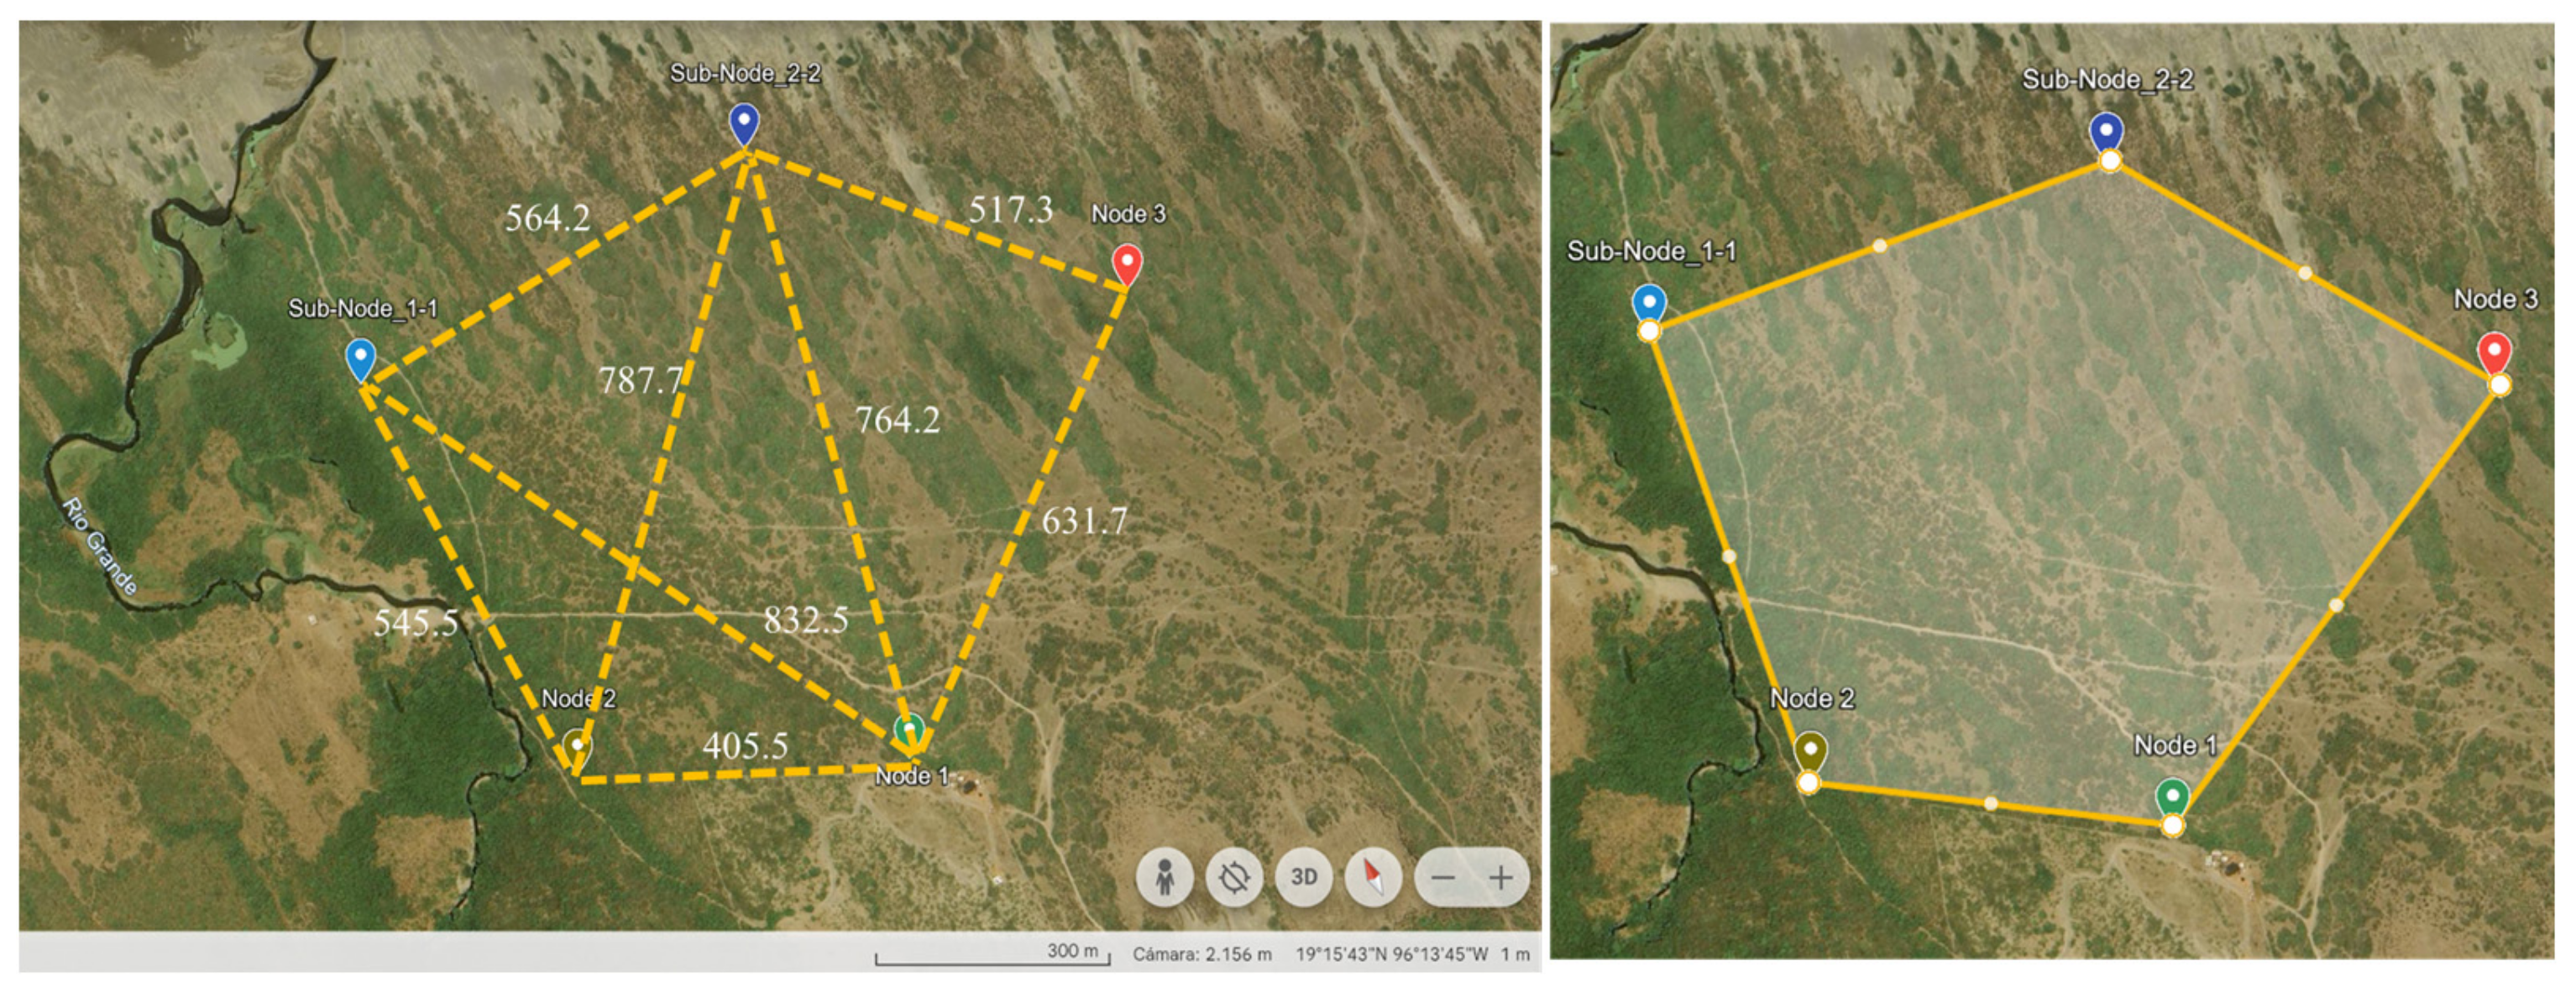
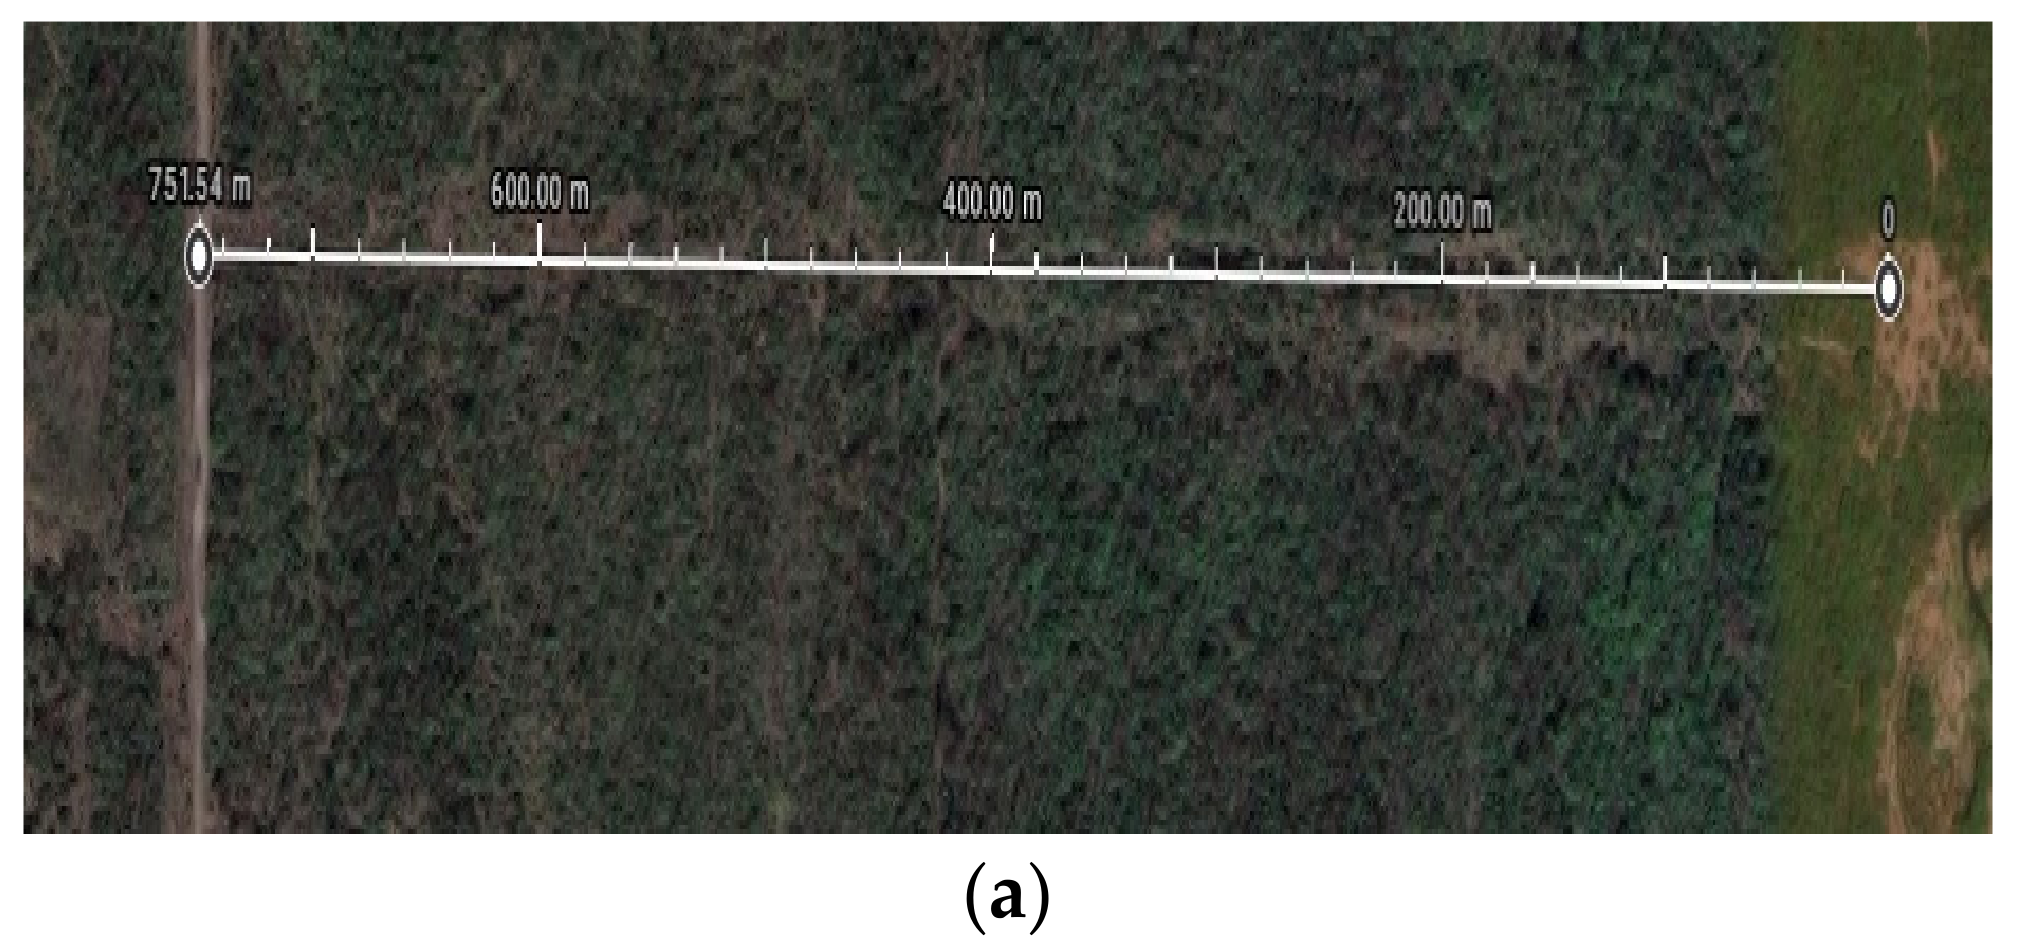
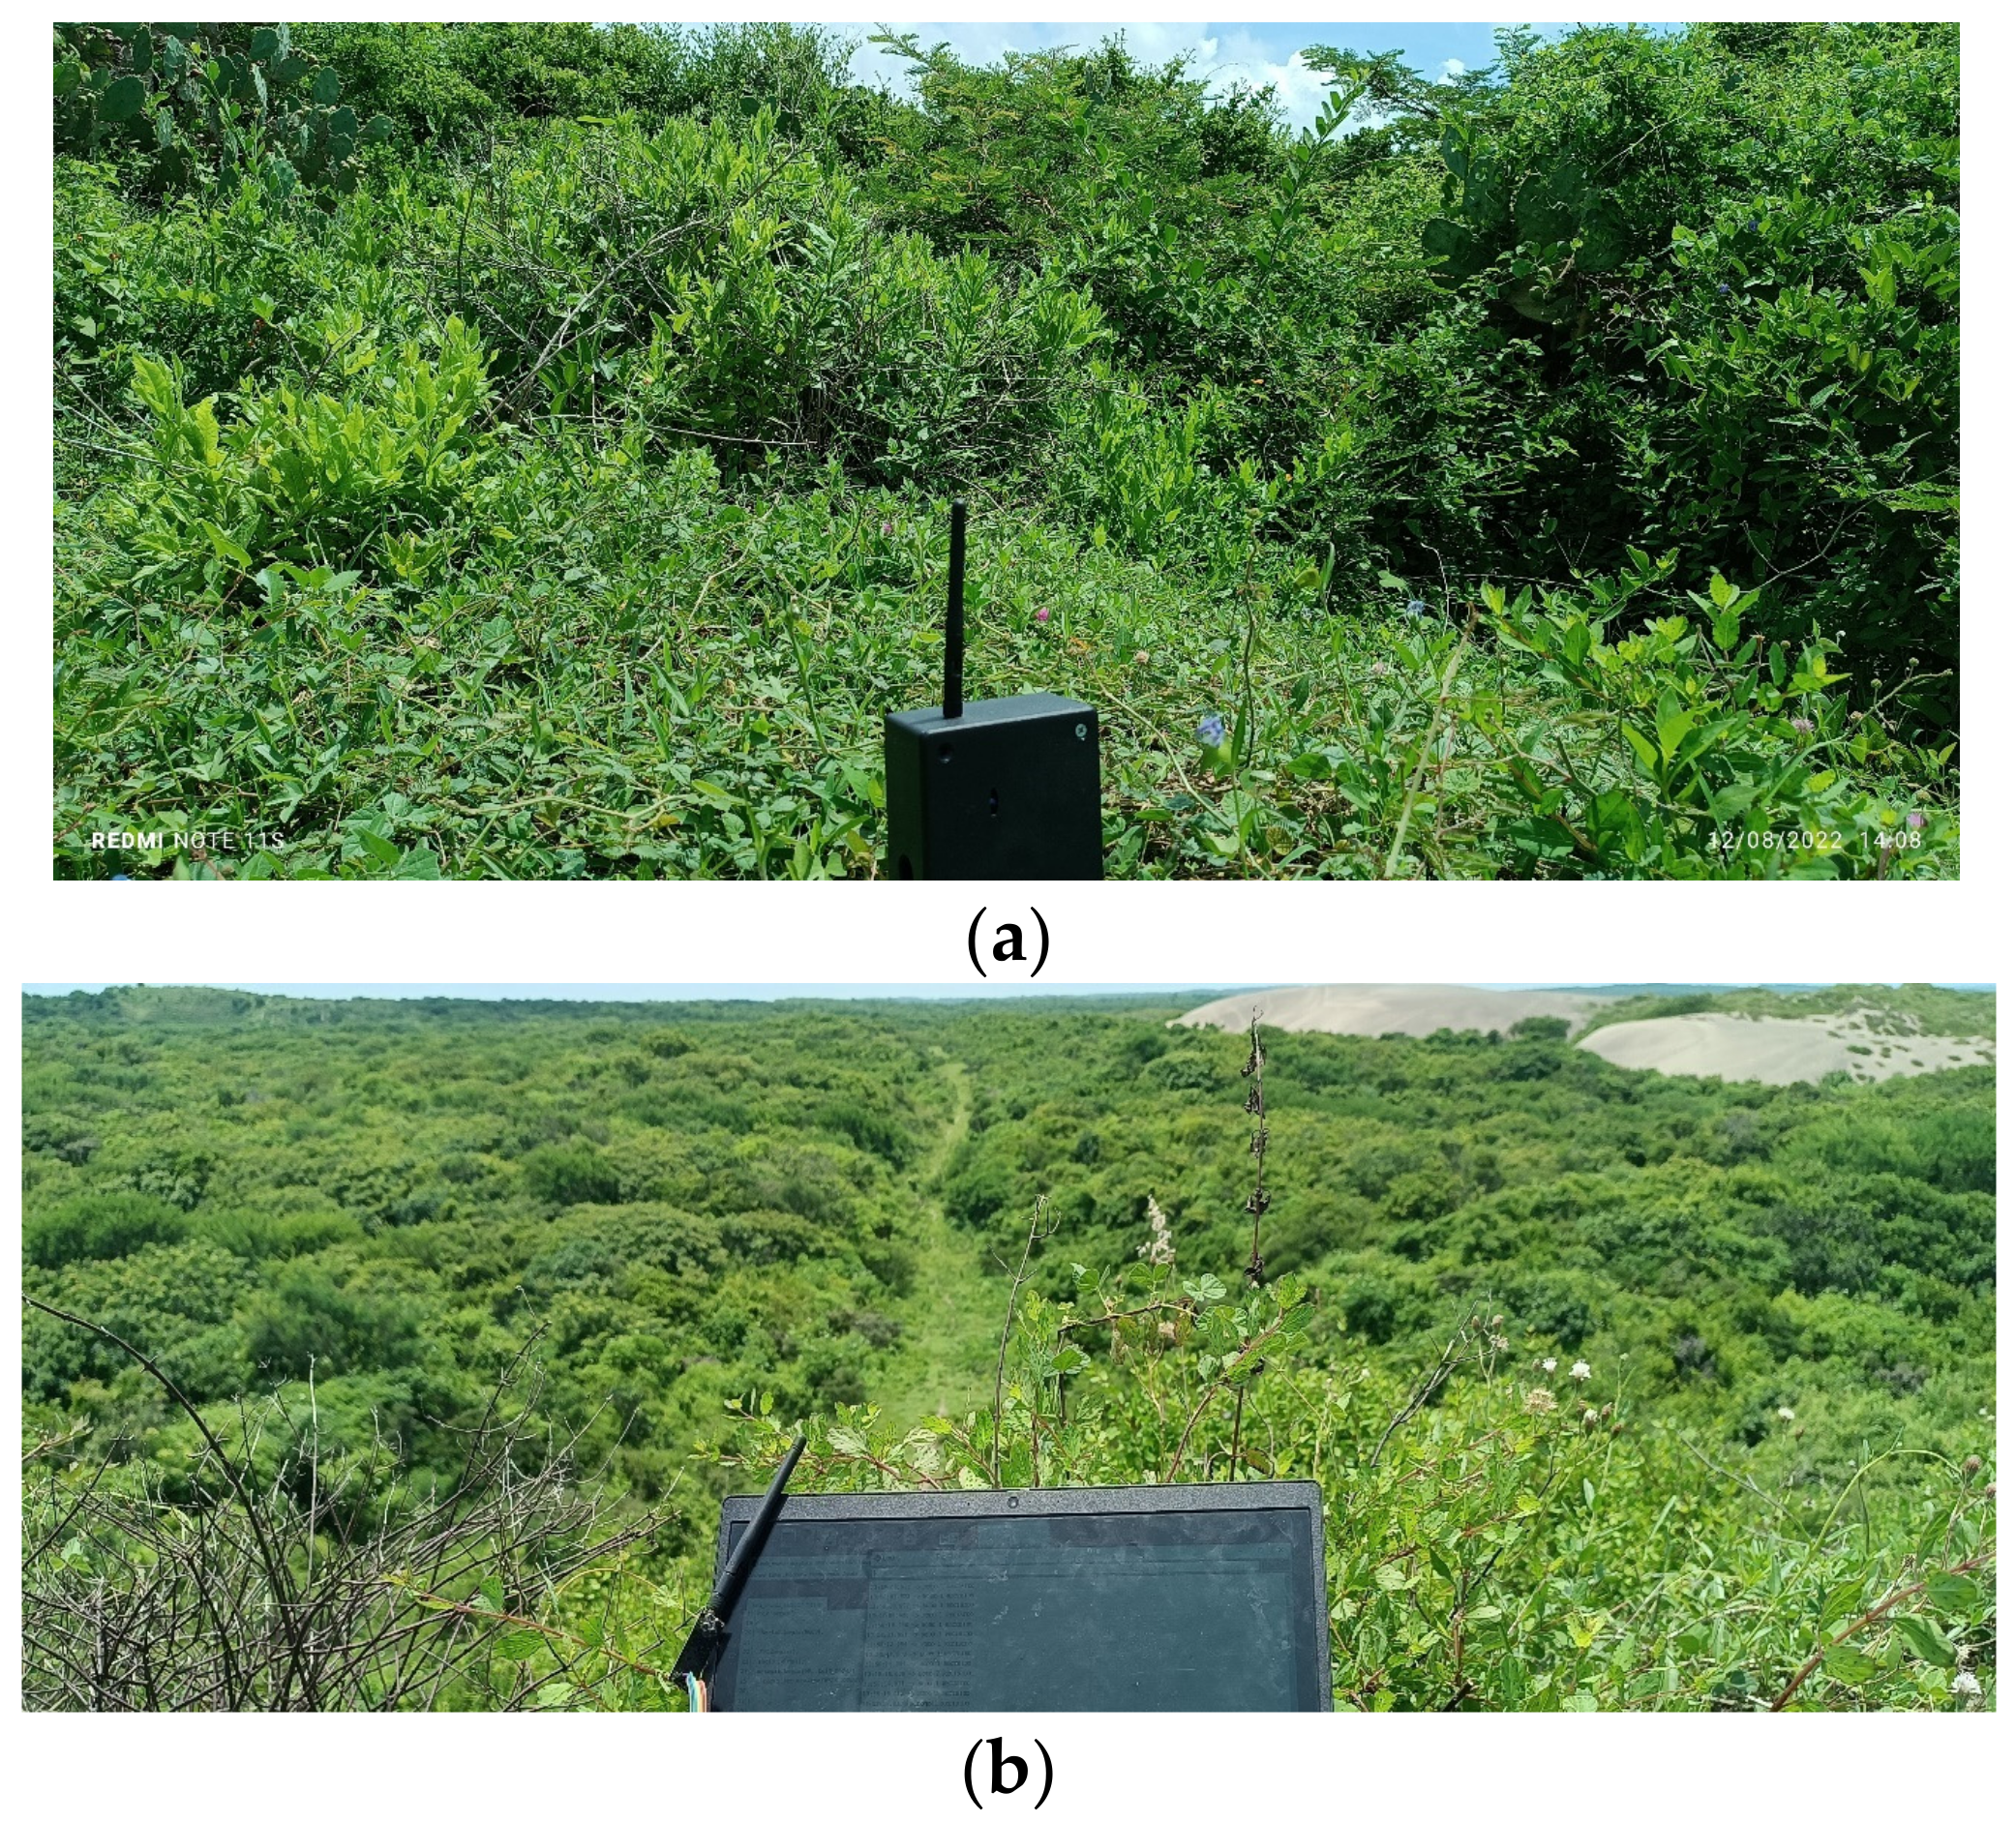
2.2. WSN Implementation Sites

This section aims to provide a comprehensive understanding of the physical context and environmental conditions surrounding the WSN operation.
The image presents either a map or a satellite view, focusing on the precise geographical location of the WSN. It showcases the surrounding topography and landscape features, highlighting the diverse environmental elements within the network neighborhood.
The vegetation of the WSN-deploying site consists of secondary vegetation derived from a coastal dune tropical dry forest. Like most of the coastal ecosystems of Veracruz, most of the dunes have been disturbed by the continuous extraction of trees and shrubs used for firewood and the use of the surfaces for cattle grazing, generally sheep. For this reason, most of the area is covered by grasslands with patches of low bushes and secondary vegetation with elements of tropical dry forest.
The vegetation covers approximately 60% of the property’s surface, which generates a wide vegetation cover that significantly reduces radiation levels. It has been demonstrated that the environmental temperature presents significant differences according to the vegetation cover that exists in the study area. For example, in the Yucatan Peninsula, it has been determined that the temperature of the earth’s surface decreases by between 2 to 4 °C in areas with urban vegetation [21].

3. Results and Discussions

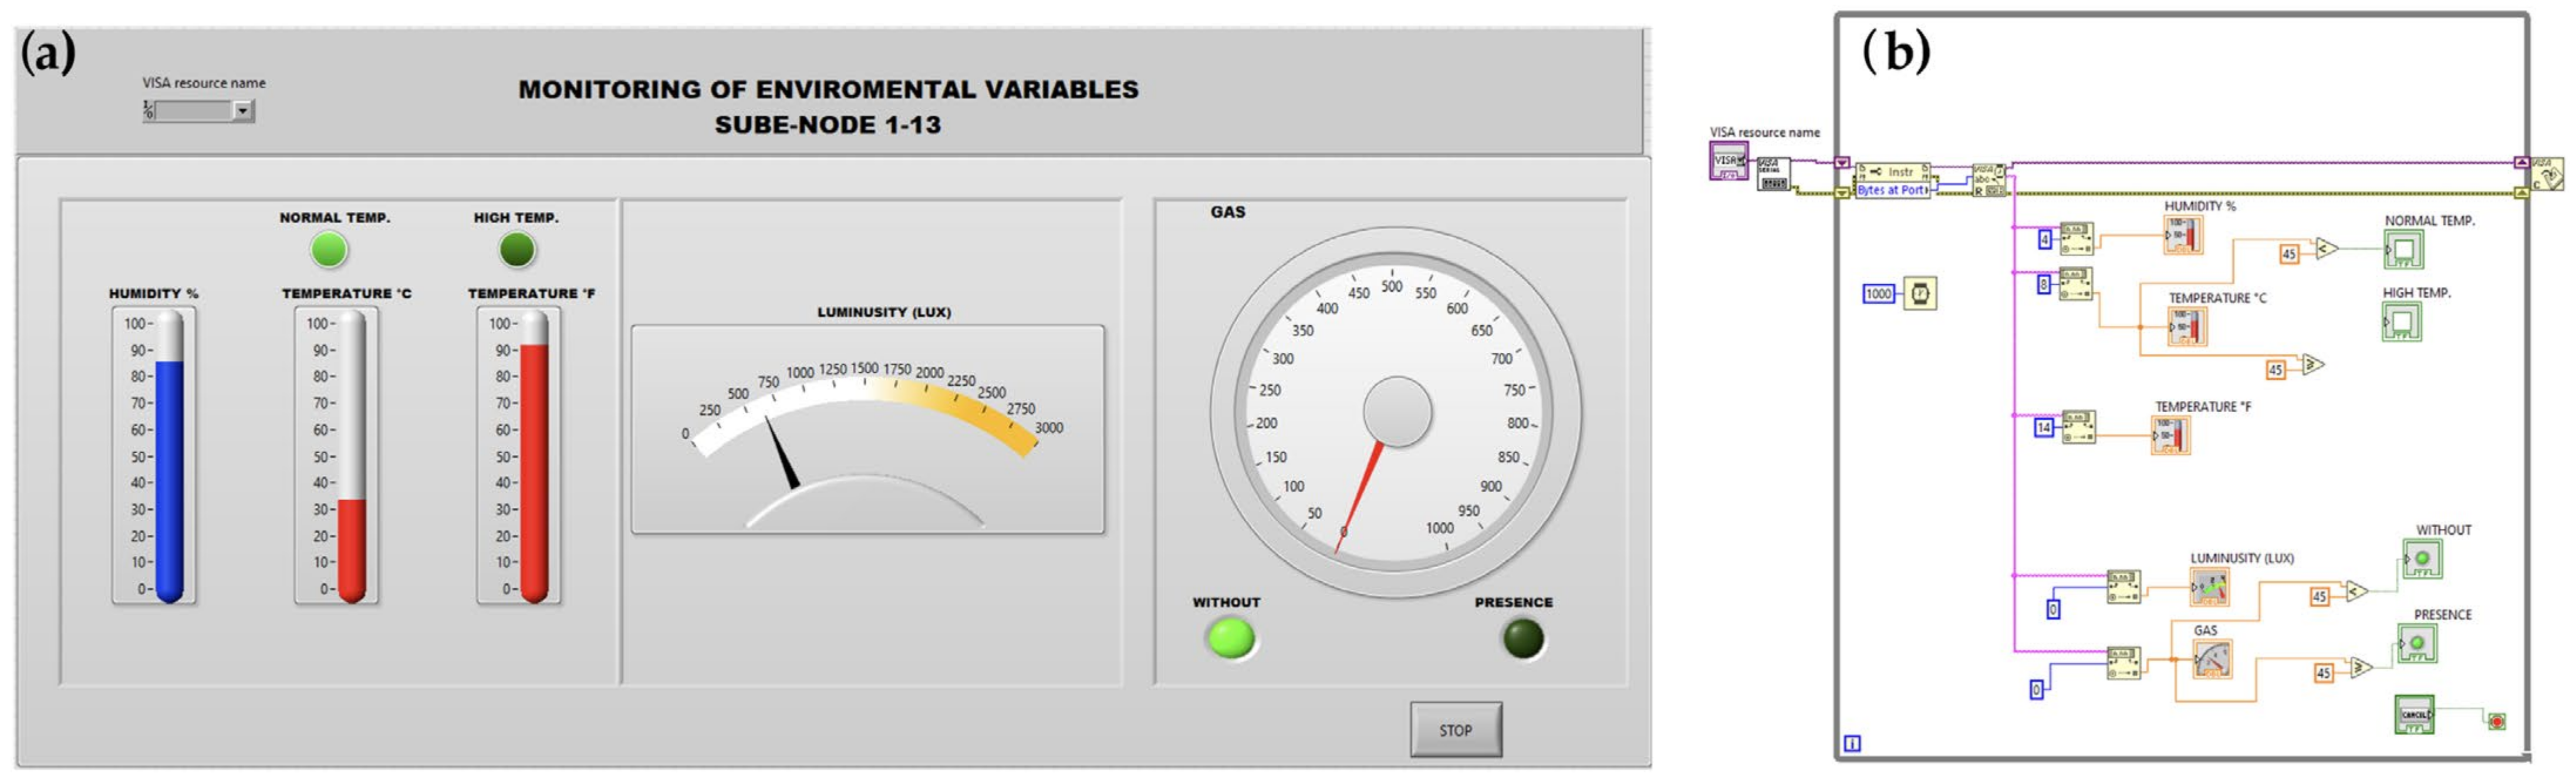
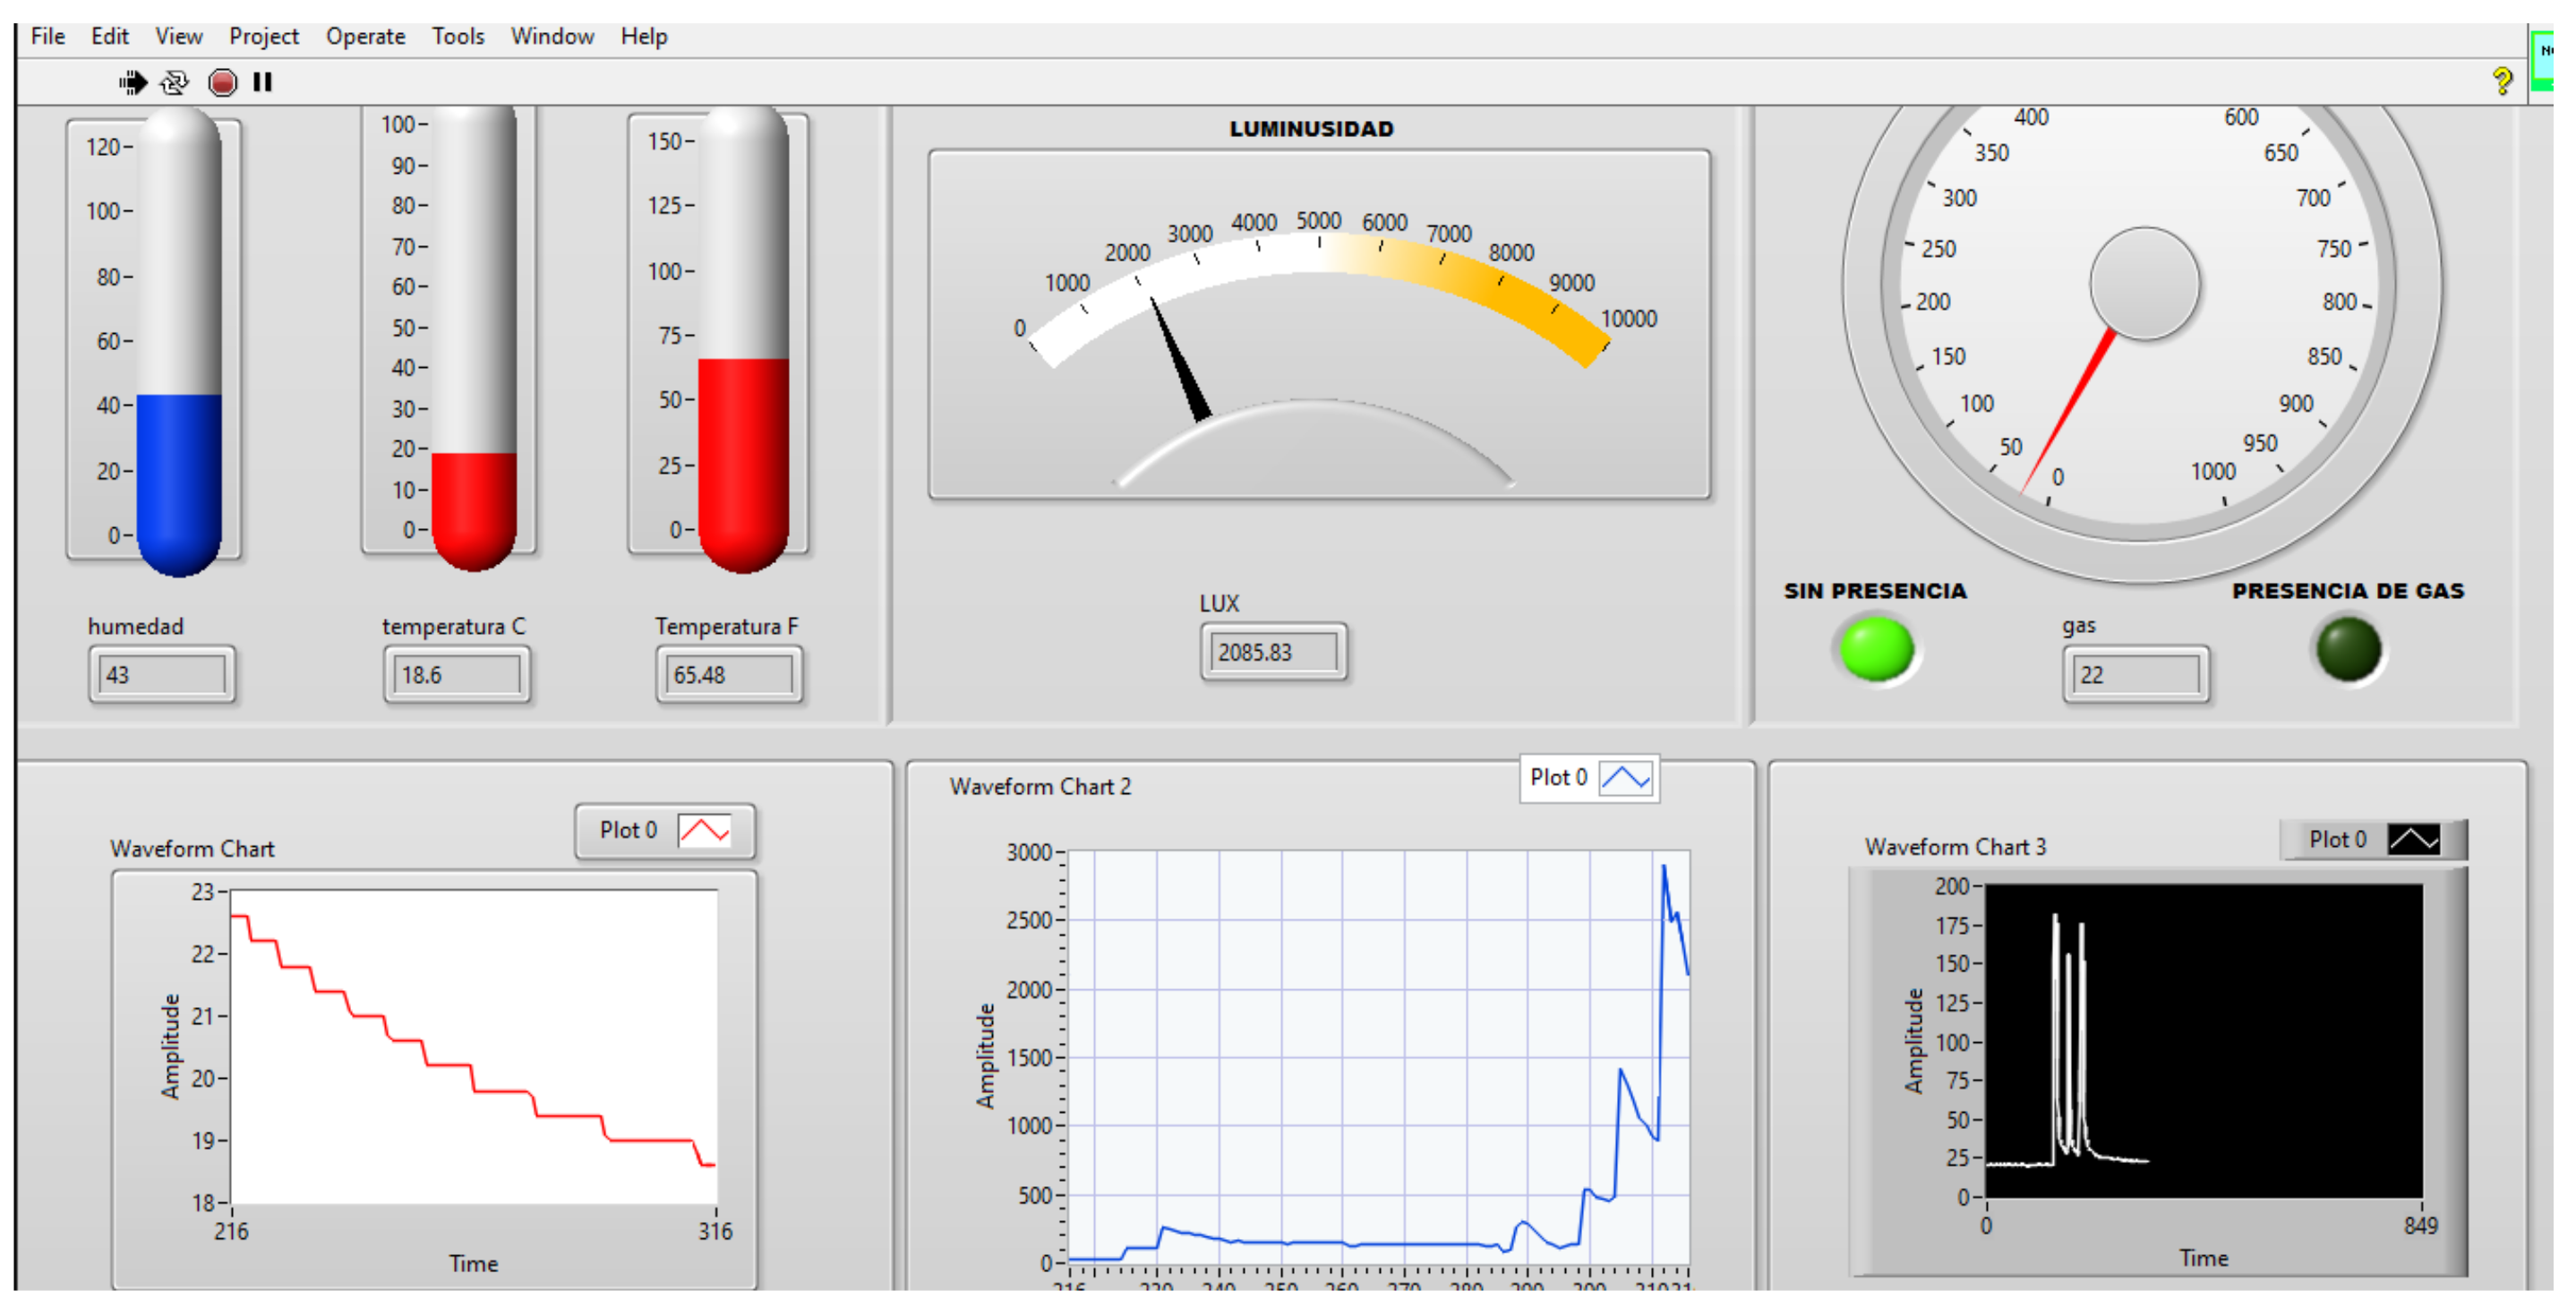
3.1. Sensor and GUI Testing

In this section, the performance of the proposed WSN is reported. Figure 5 represents a slave node, including the sensors and electronic components associated with the node. In the deployment scenario, master and slave microcontrollers acquire data every 2 min and average data every 10 min to be displayed in the GUI.
To evaluate the performance of the sensors in the laboratory, temperature was varied between 14 °C and 40 °C and relative humidity between 40% and 80%. For the gas sensor, methane (CH4) values between 100 ppm and 700 ppm were used with distances of 0 cm to 4 cm between the source gas and the sensor. For the light sensor, values between 50 lux and 300 lux were set for the excitation source lamp. An example of the values displayed in the GUI for each sensor is shown in Figure 6. The top indicators show the relative humidity (humedad, in Spanish), the temperature (temperatura, in Spanish) in °C and °F, the luminosity in lux, and the gas concentration with an additional “presence” or “non-presence” LED indicator; the bottom waveform shows the behavior for each variable, and the values can be saved in txt format.

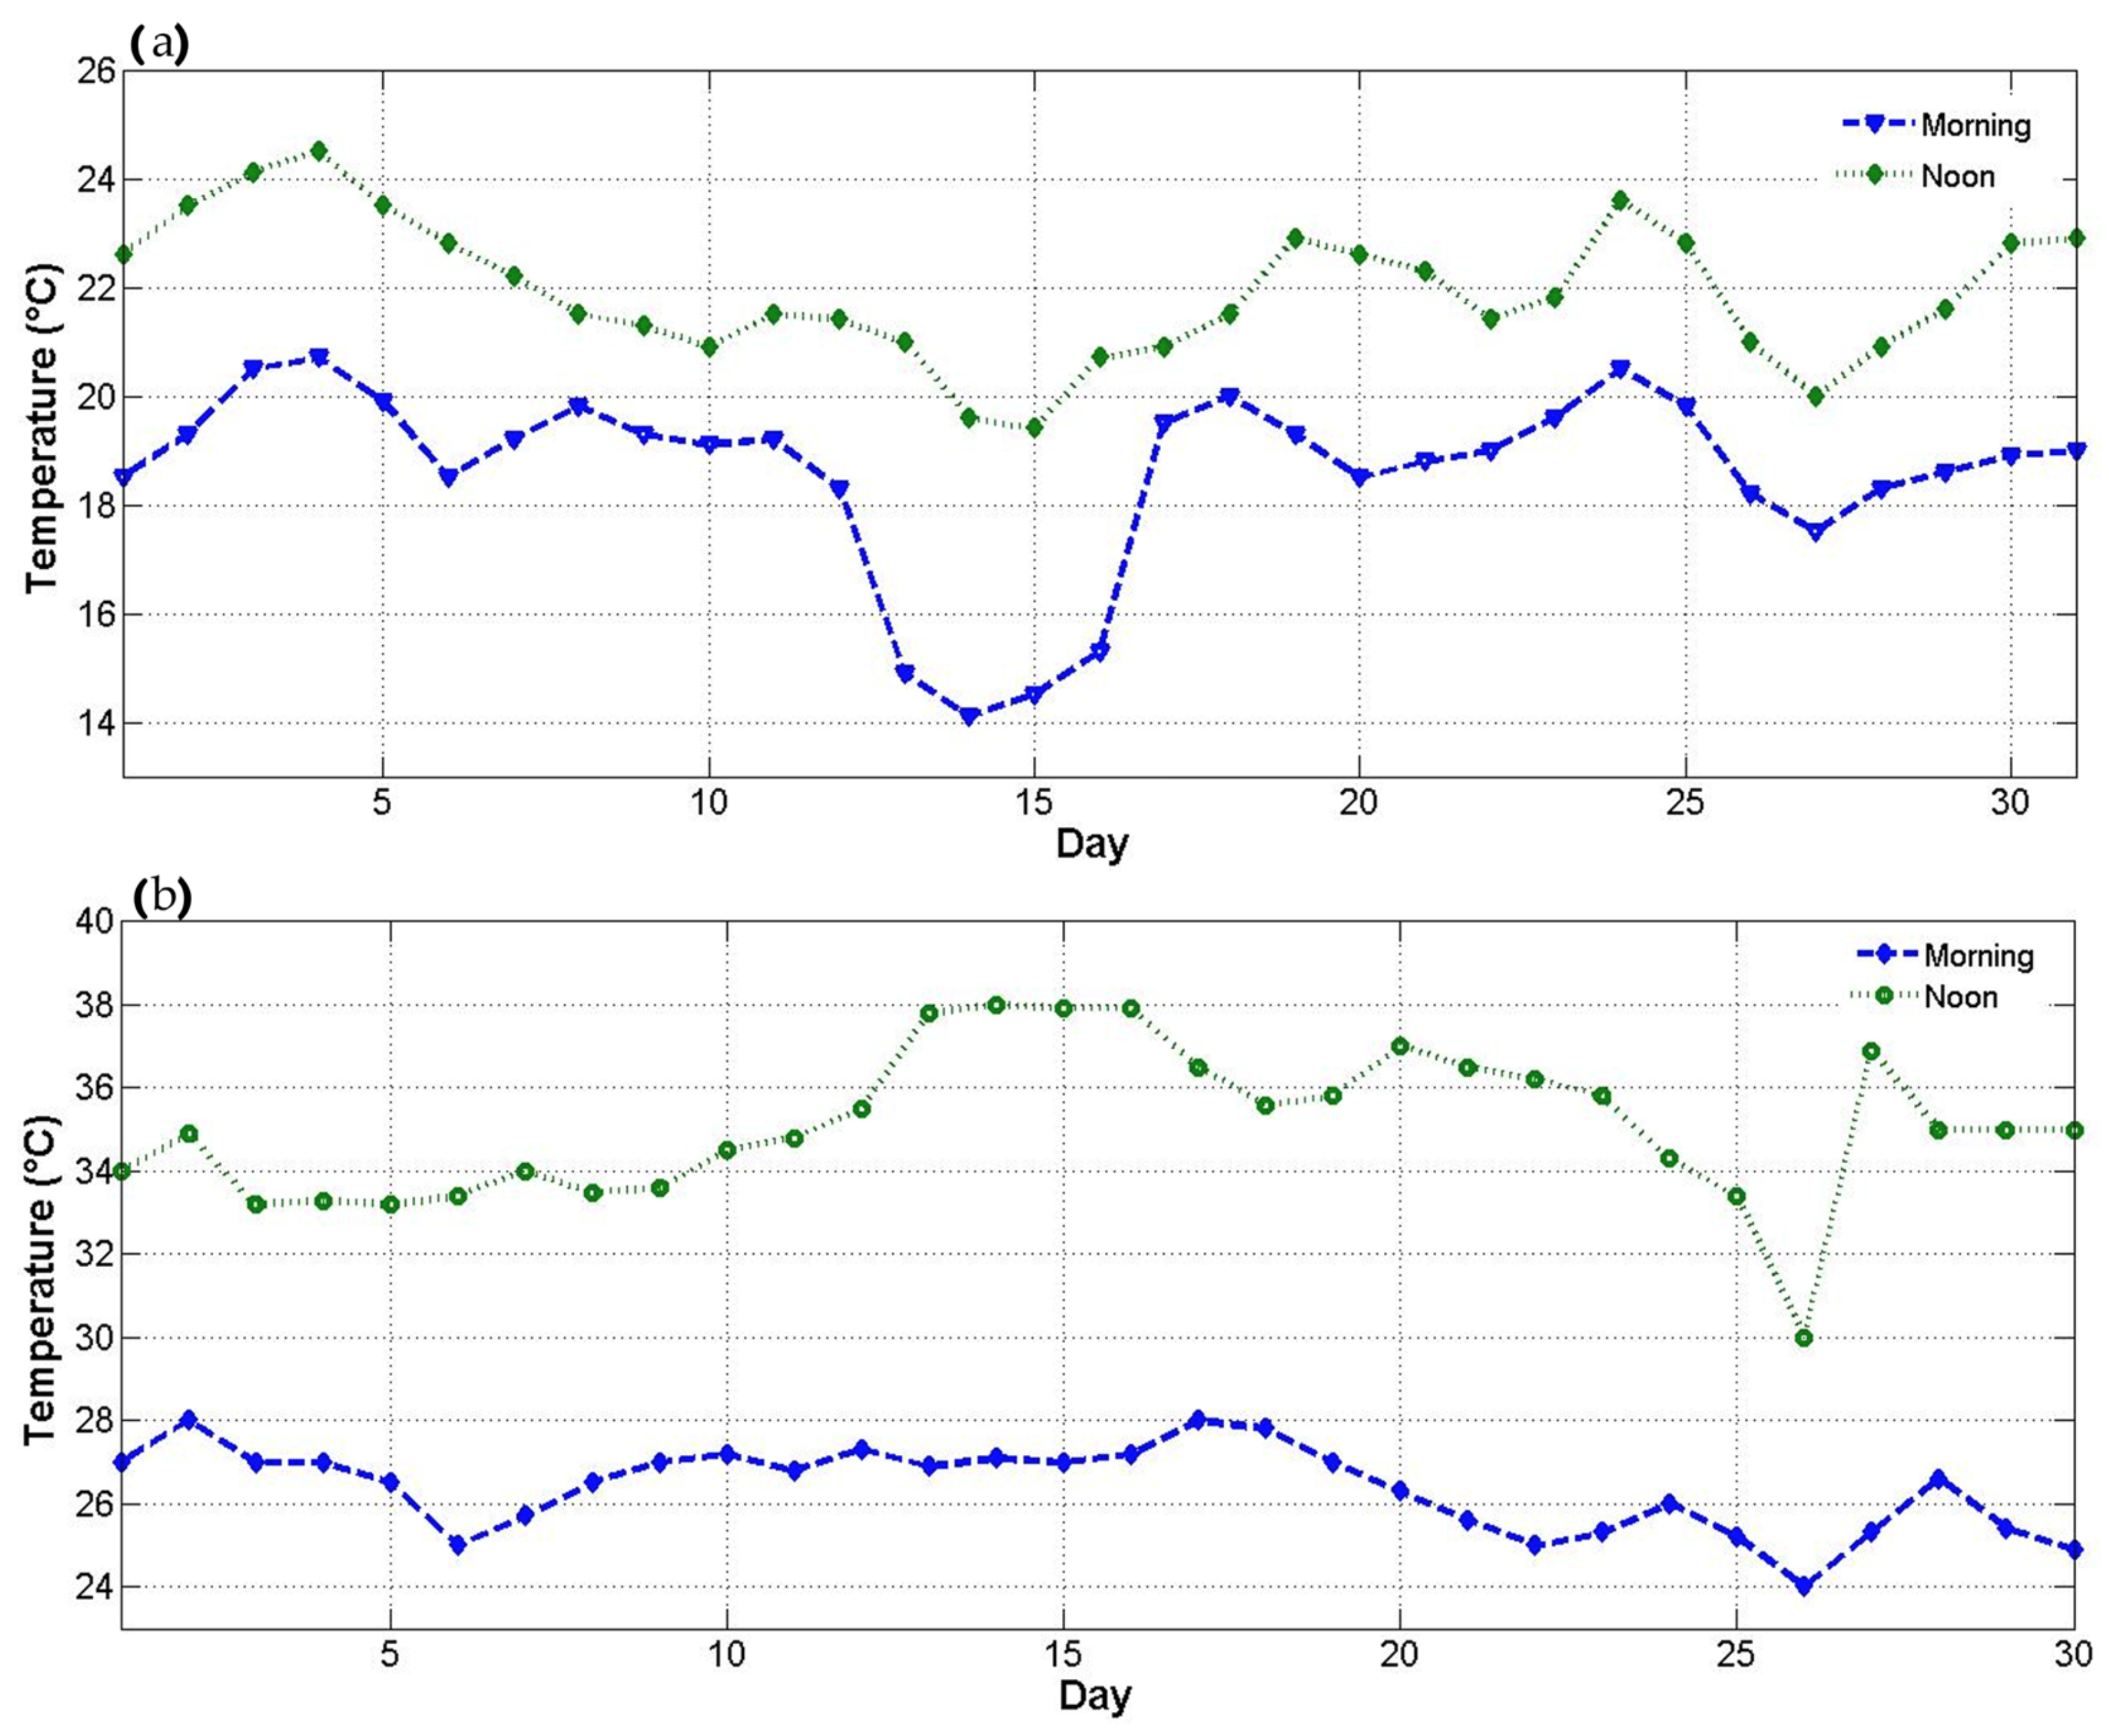
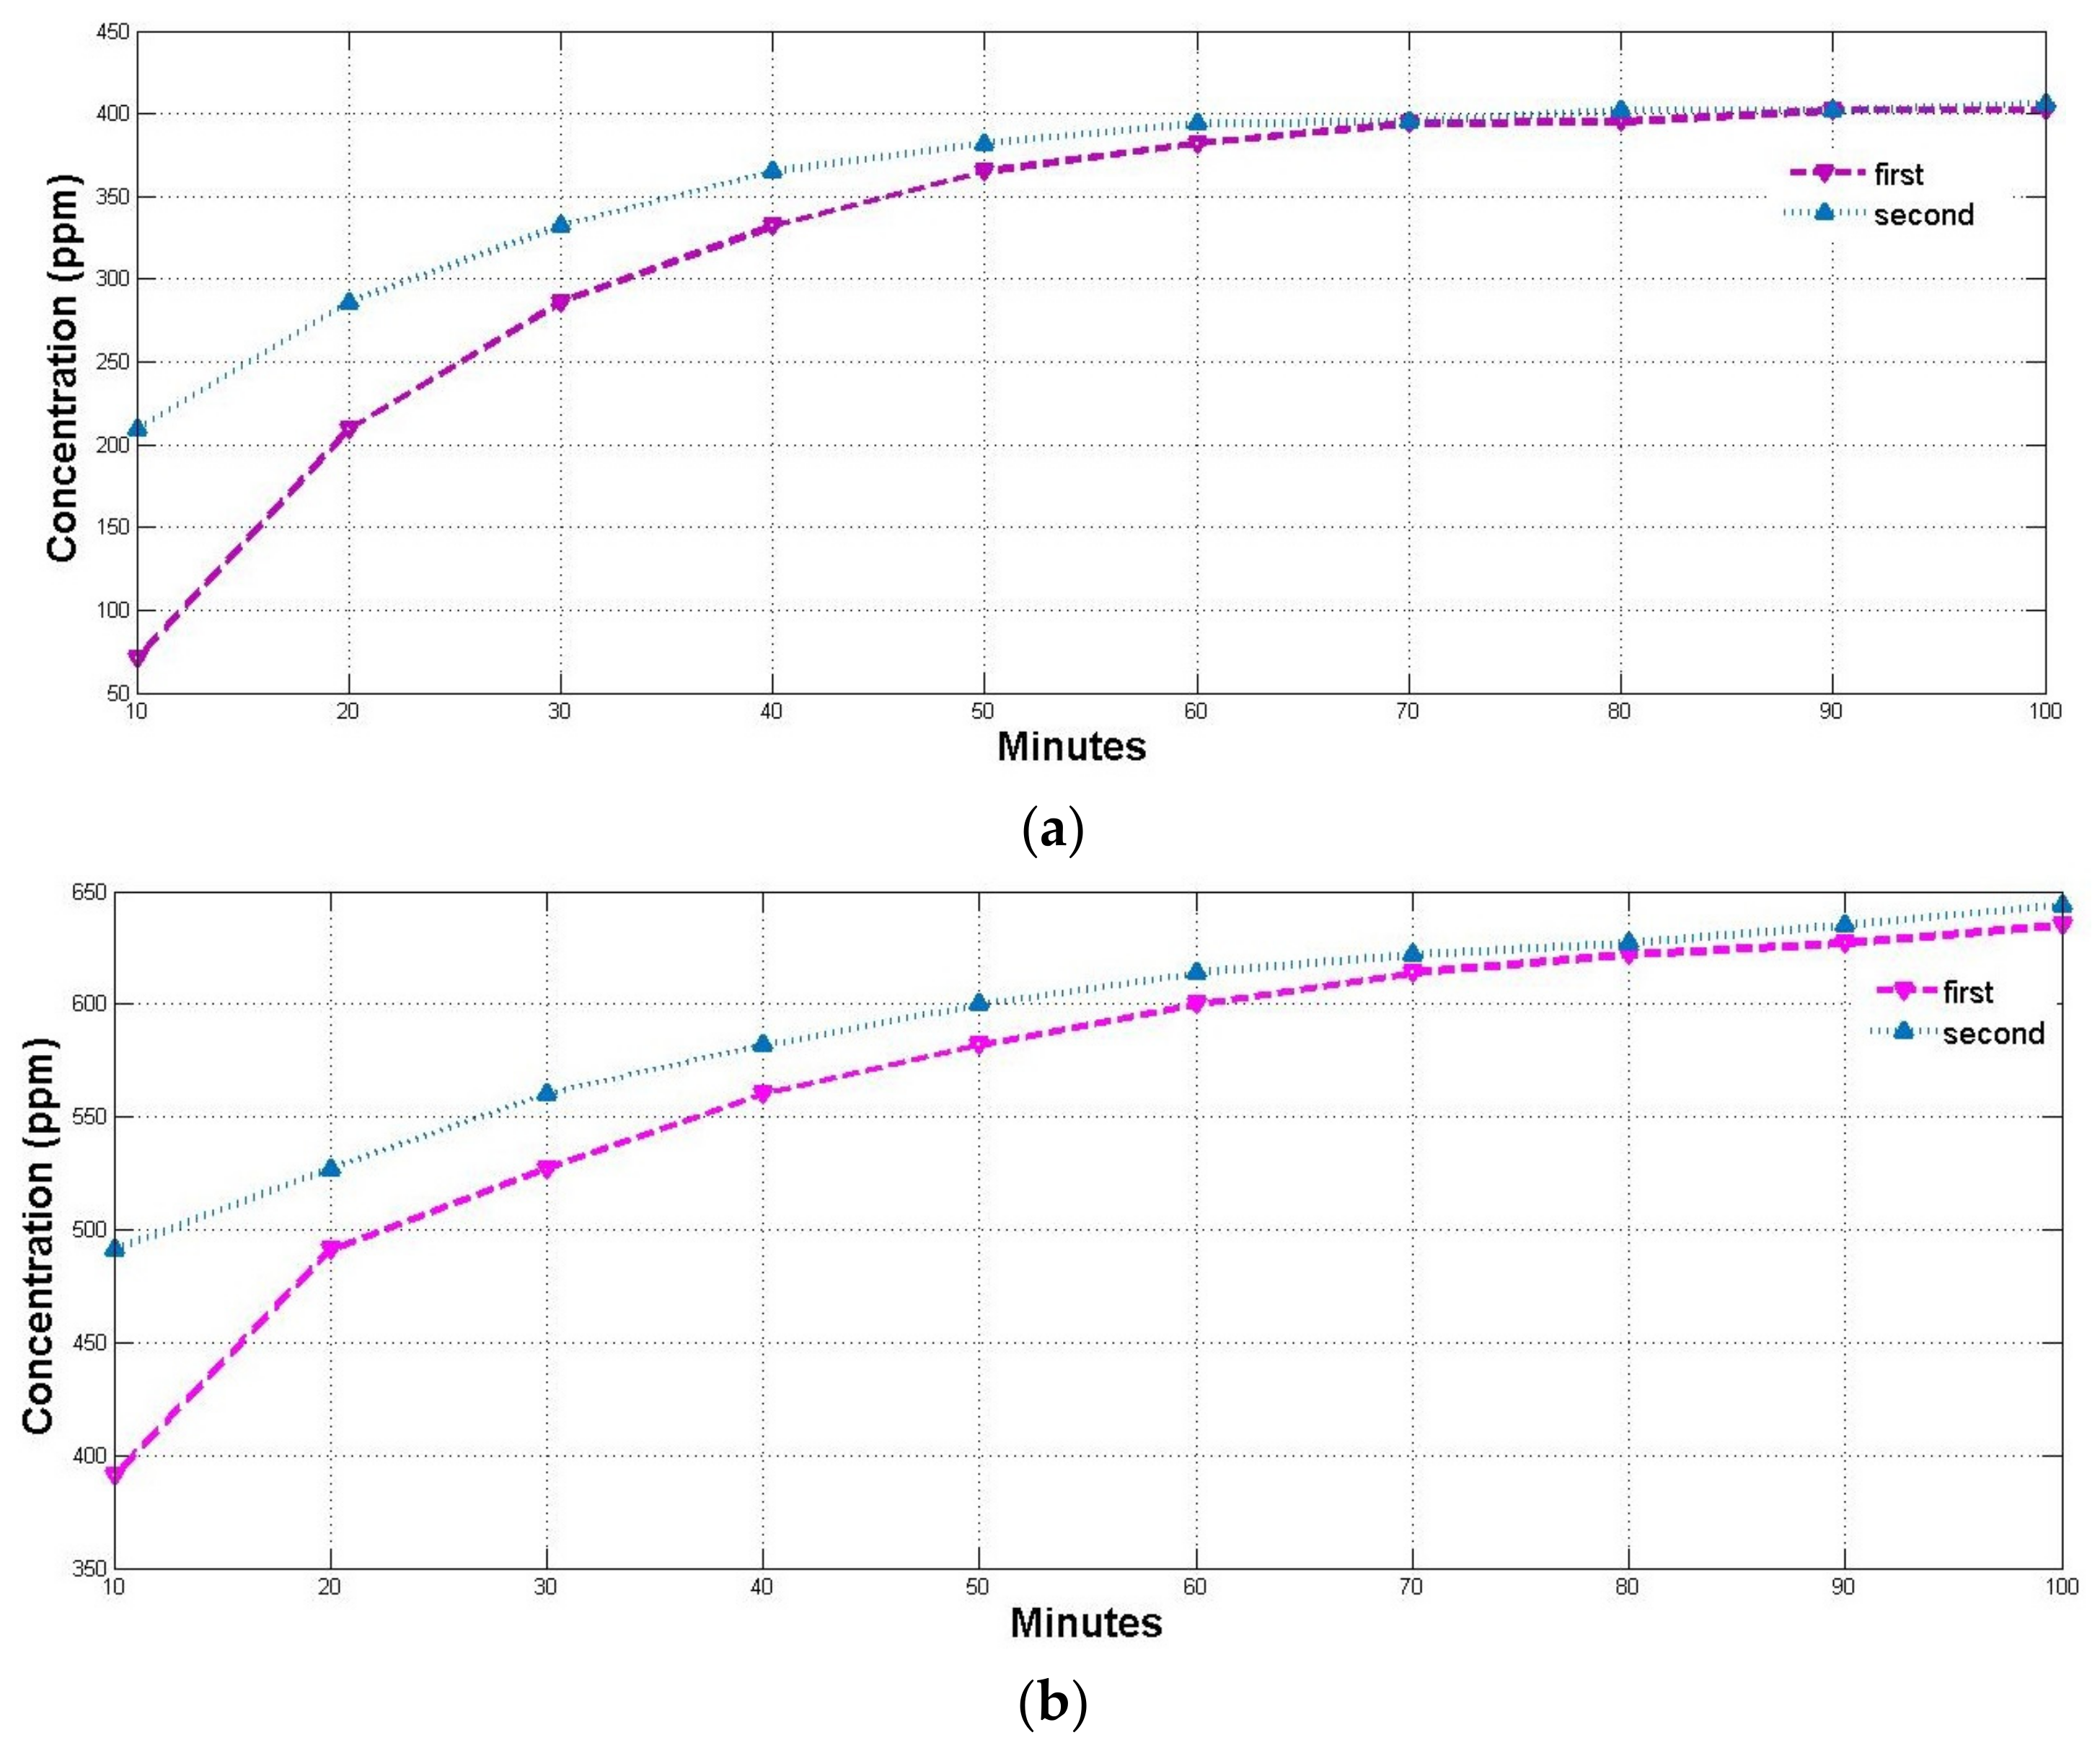
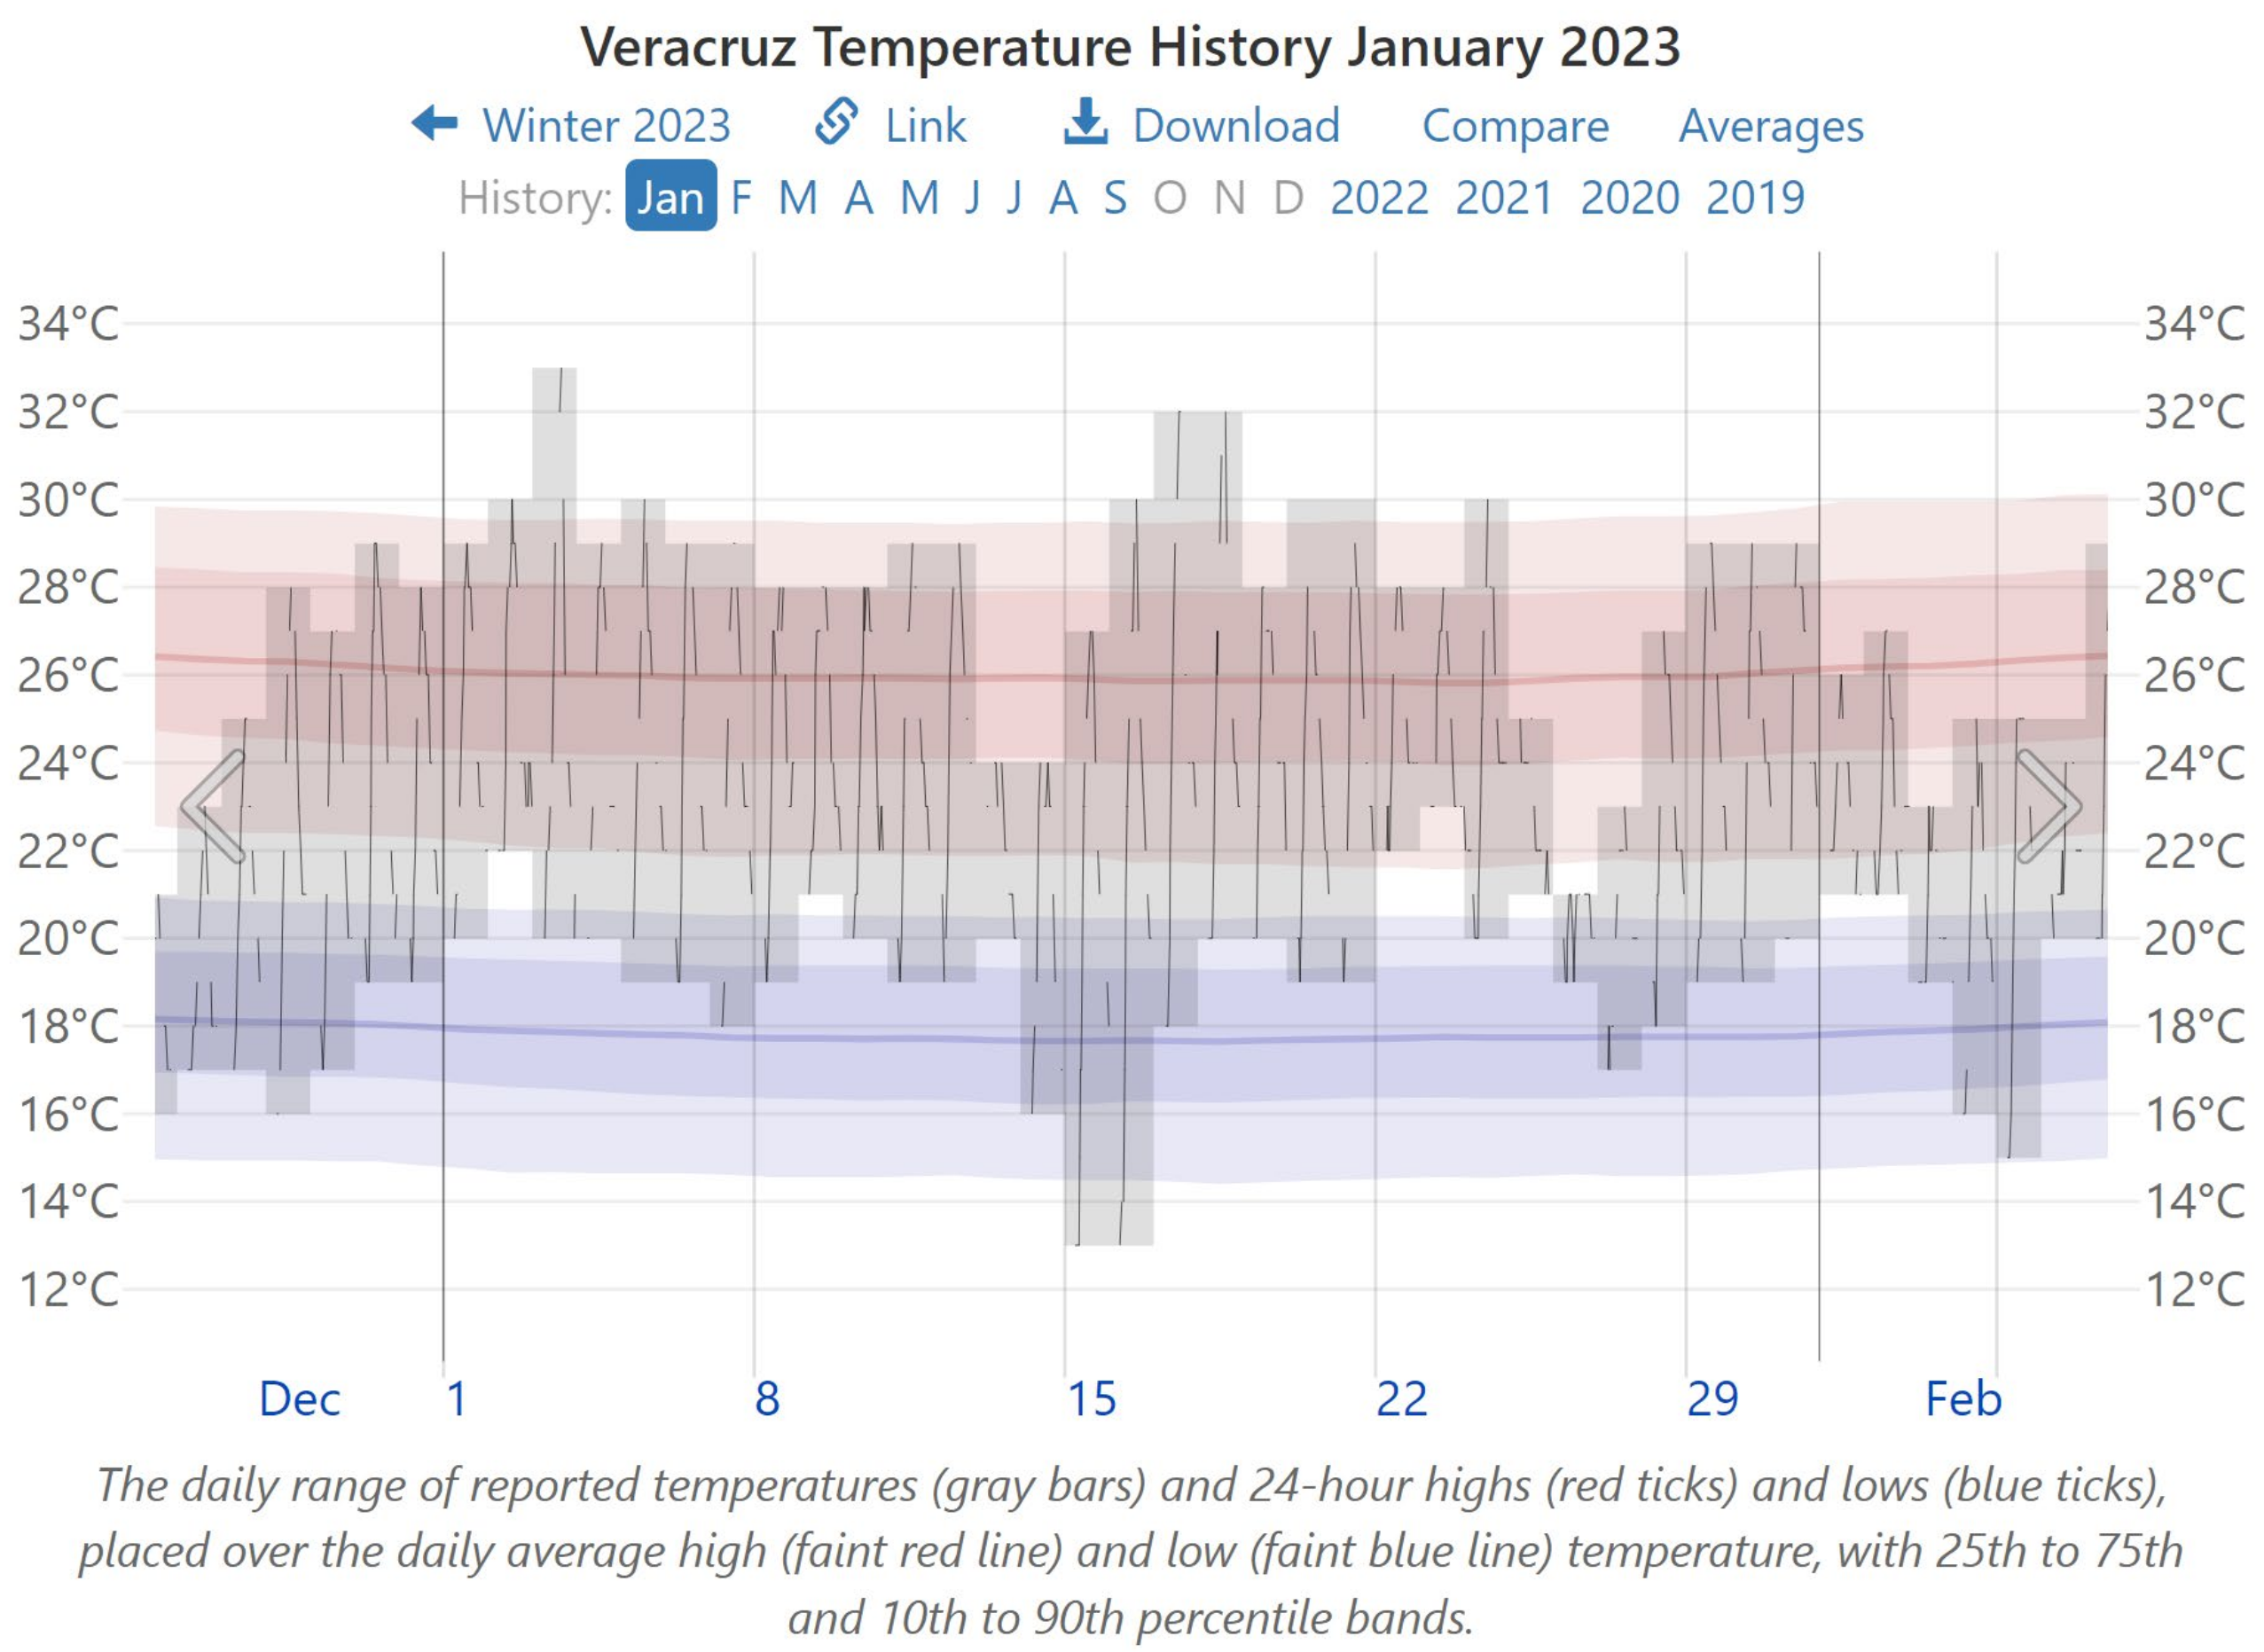
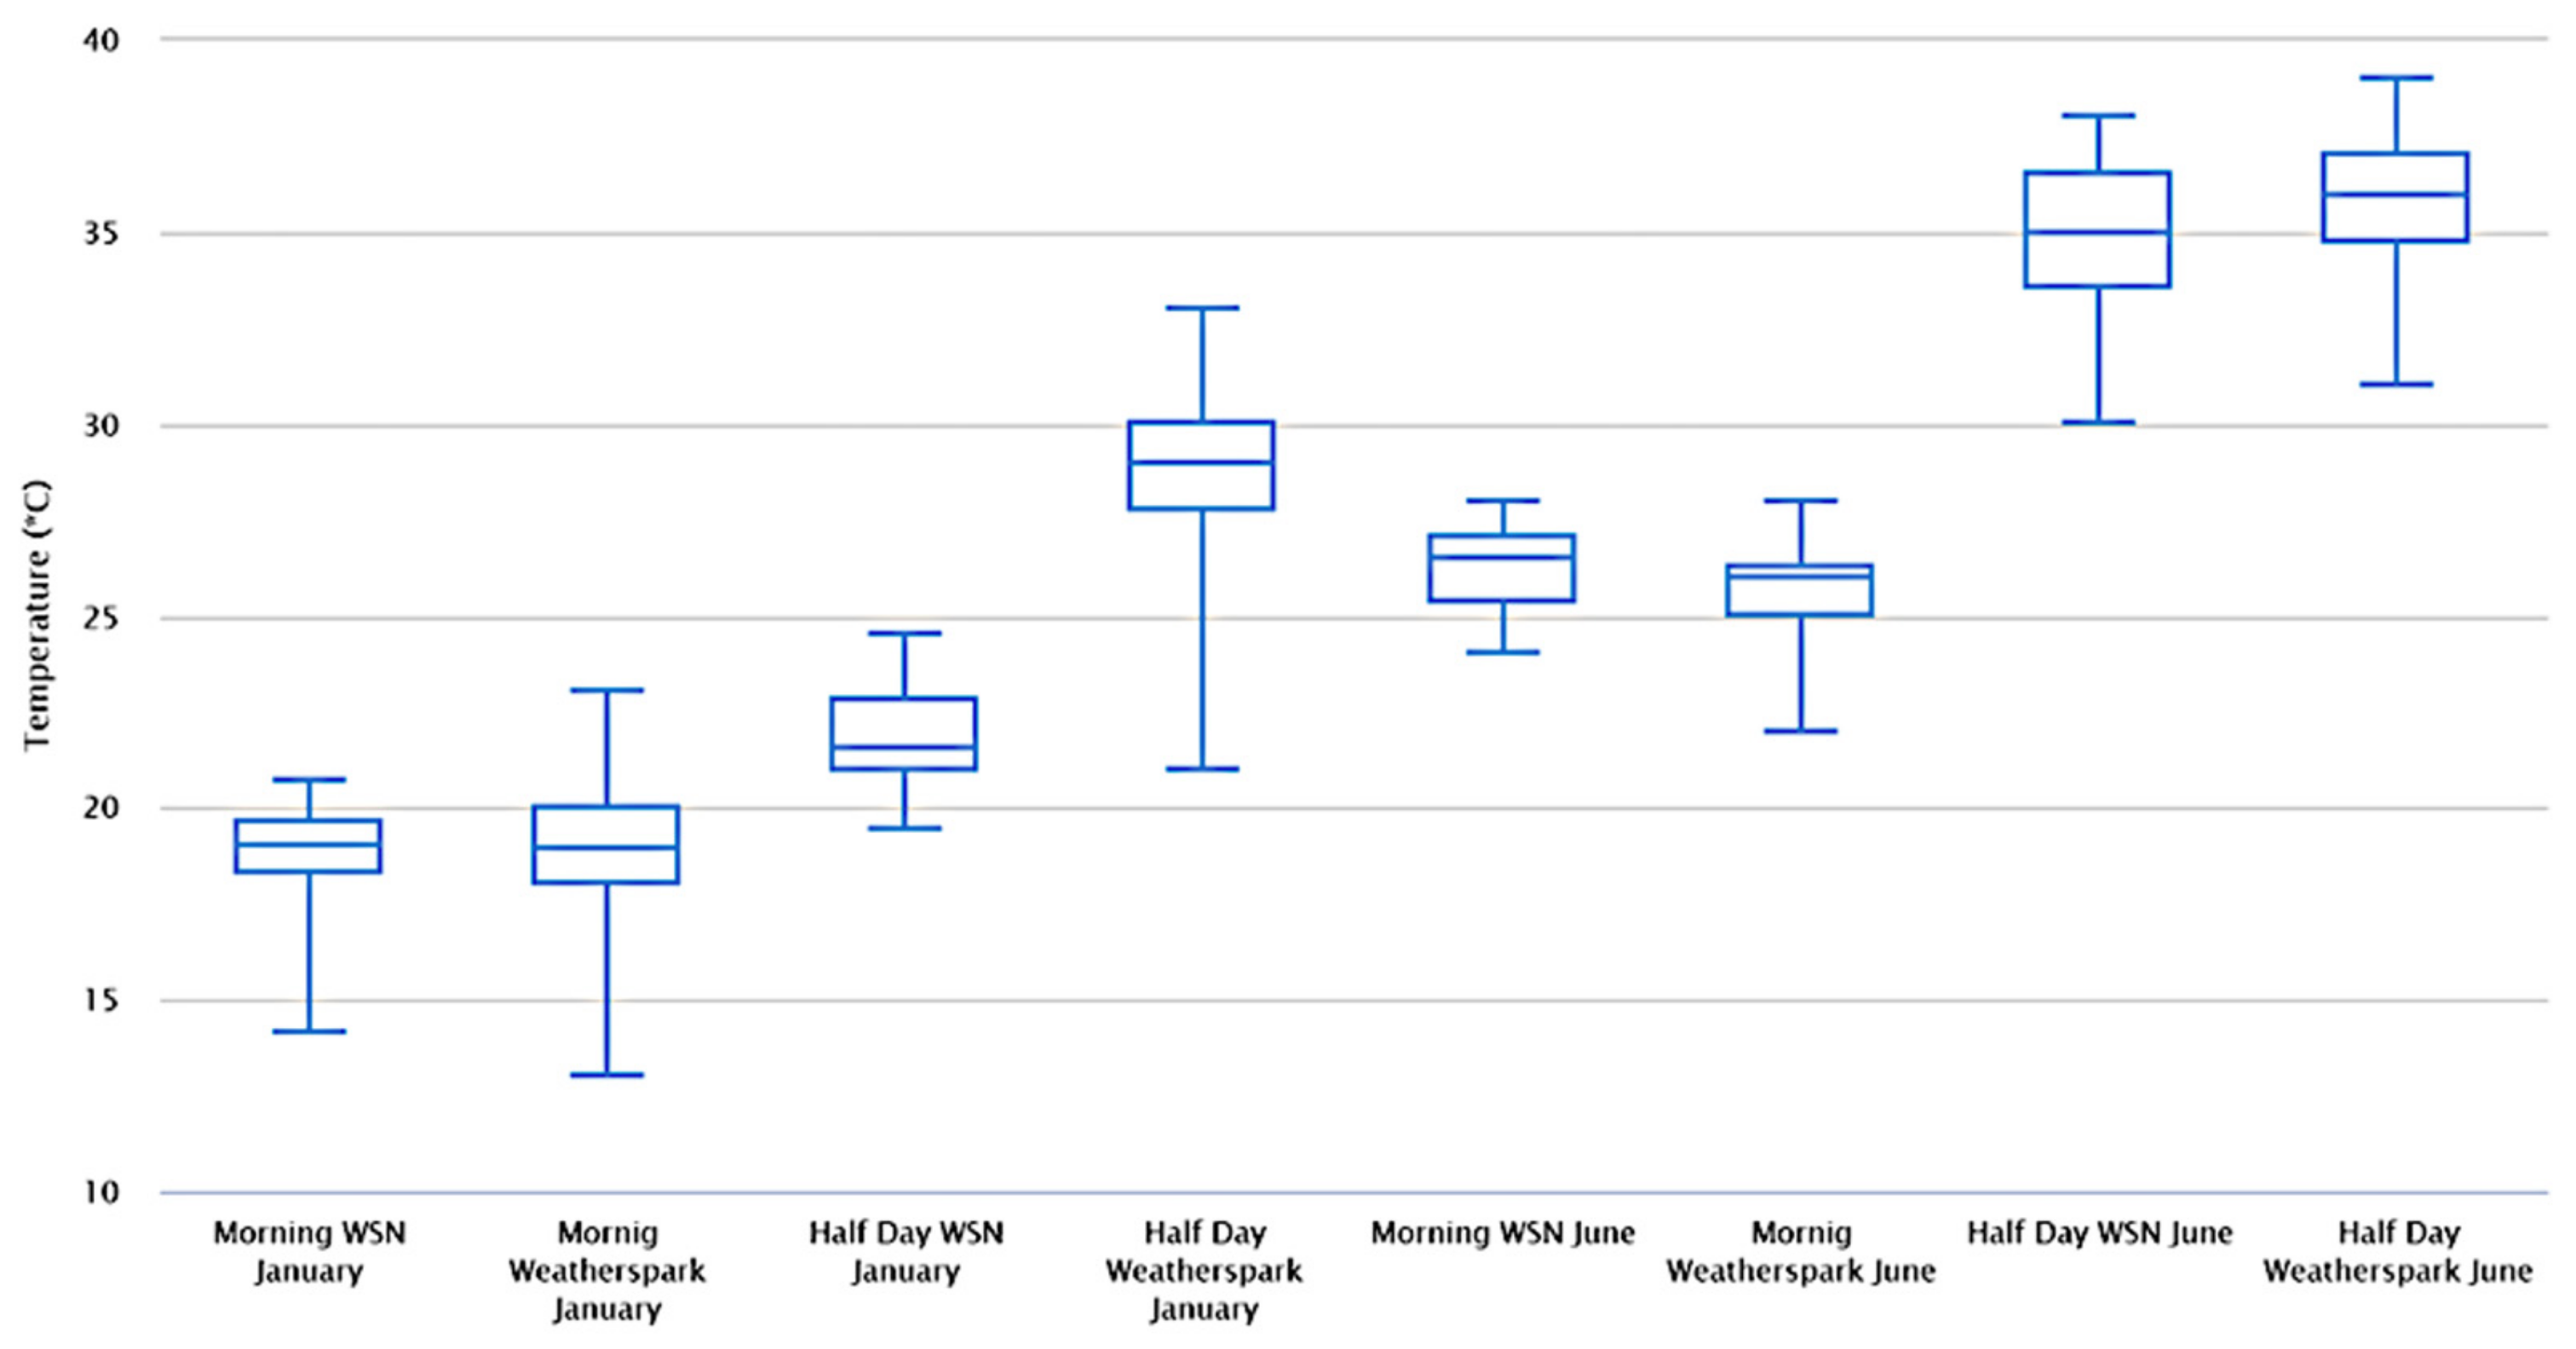
3.2. Testing at Environmental Conditions

For each sensor node, the different environmental variables were measured. Temperature and humidity were recorded in the morning and at noon in January and June, and winter and summer, respectively. The humidity recorded by the WSN was around 75 and 80%, which is similar to the values reported on the Weatherspark website [21]. The average and noon temperatures recorded by the WSN in January and June are shown in Figure 7a,b.
The higher variations in January were due to the drop in temperature caused by the predominant north winds. In June, the temperature oscillated between 32 °C and 38 °C at noon and between 25 °C and 28 °C in the morning. The results obtained were compared with the historical data recorded on the webpage dedicated to climate measurements [21]. In Figure 8, the temperature variations are seen because the webpage records the temperature 24 h a day. It can be seen that the temperature data recorded in the WSN reported a maximum of 25 °C at half day, while in the webpage data, the maximum is 32 °C; the difference is attributed to the local vegetation coverage and measuring height over the ground level with respect to the meteorological dedicated stations.
The city of Veracruz is dominated by asphalt constructions, buildings, sidewalks, commercial areas, as well as automobile storage yards, in addition to asphalt- and concrete-covered streets and public areas, which produce a significantly different climate than the surrounding rural areas; therefore, it is noteworthy to observe the creation of heat islands in intensely urbanized areas with few green spaces. It is known that the environmental temperature usually differs significantly depending on the vegetation cover in the evaluated area; for example, in the Yucatan Peninsula, it has been reported that the temperature of the land surface increased by between 2 and 4 °C in deforested areas. In addition, heat islands of variable intensity were detected in 80% of the urban territory [21]. While in southern Europe, temperatures in urban areas with trees were up to 4 °C lower and in central Europe 8 °C to 12 °C lower [23].
The average temperatures of Veracruz are of 29.3 °C in summer and 21.7 °C in winter. It is interesting to observe in Figure 9 the average and centroid of the morning and midday temperatures acquired by the proposed WSN with respect to those reported in Weatherspark [22] for the months of January and June; the higher variation occurs in winter at noon, where the mean is considerably lower in the area where the WSN is located compared to that registered by Weatherspak [22], which is most likely because the location of the WSN is an area dominated by vegetation [23].
In summer, the temperatures do not present a significant variation compared to the center of the city and the area monitored with WSN at noon (average variation of 1%), which could be due to two causes: the amount and type of vegetation, which plays an important role in reducing the heat island, and the fact that the city of Veracruz is directly adjacent to the Gulf of Mexico, directly receiving the sea breeze which tends to flow perpendicularly towards the coast. In Veracruz, the recorded constant wind speed in June was 8 m/s per hour, while in January, the maximum speed was 5 m/s with 4 atypical days which reached gusts of ca. 12 m/s, although the wind speed by geographic zones also depends on the terrain orography.
Each sensor node records the information of different variables and sends it to the master node for storage. For gas sensing, methane emissions derived from the organic matter around each node were recorded. Figure 10a,b show the methane gas measurements, where the first data were recorded every ten minutes (purple line), and the second every five minutes after the first measurement (blue line). The difference in methane concentration between recordings is due to the sensor not reaching its ideal operating temperature before 60 min [24].
Additionally, transmission distance tests were performed with only one transmitter node and the open field receiver, reaching a maximum average distance of 750 m (Figure 11a). The Google Maps app was used to display these results, which allowed for a quick measurement of the distance.
The range tests show that the data packets received by the master node were between 50 and 750 m (Figure 11a). Packet loss is very significant when the distance between master and slave exceeds 800 m. Several authors have reported lower transmission ranges with the same RF communication module (NRF24L01); for example, in Ref. [25], transmission distances of 50, 100, and 150 m were reported between master and slave in a tree-blocked open space, and based on the data losses, the prototype had a good performance at distances below 100 m. Other reports have indicated an effective transmission range of 100 m for the NRF2401+ device (Nordic Semiconductor, Trondheim, Norway) in an open area [26]. The large differences between the reported transmission ranges may be due to vegetation affecting the RF transmission module. To meet the requirements of the radio, the RF module must be installed in an open area.
Tests between two slave nodes and a master were also performed, obtaining average distances between 200 m and 300 m, depending on the current traffic and the obstructions of the city (Figure 11b). The distance was again measured with Google Maps. In Ref. [6], an outdoors range of 93 m was reported using the NRF2401+ module. For topology comparison, a low-cost and low-power WSN developed for the surveillance of orchards using a star communication protocol achieved a communication range longer than 250 m [19].
The geographical location of the nodes is seen in Table 1; the monitored area covered a perimeter of 2693.8 m and an area of 481,742.3 m2. The geographical location of each node was intended to be equidistant; however, due to the vegetation and terrain unevenness in the area, nodes were placed at the closest possible distances (see Figure 12).
Environmental variables were measured in an area of varied vegetation. The nodes were placed at different points to cover a wider area. The transmitters were placed in cleared areas to avoid a loss of data transmission. If the transmitters are placed in forested areas, communication can be lost. The receiver was placed near 25 m to achieve better data reception, as shown in Figure 13a,b.
The implemented WSN consists of nodes dedicated to capture data in a heterogeneous environment, with the capacity to change the type of sensors, allowing for it to adapt to possible changes in the environment and even having mobile nodes that can move around the deployment area of the network.
The present study with the proposed WSN primarily focused on its immediate performance, such as range and signal reliability, but did not explore long-term durability and performance. The future expansion and scalability of the WSN will be a key focus of upcoming research, where its performance will be rigorously tested in varied environmental conditions such as rain, dust, and wind, as well as over extended periods. This future work aims to validate the network’s resilience and reliability in diverse, real-world scenarios, determining its practicality for large-scale deployment and long-term operation. This comprehensive testing is essential to establish the WSN’s adaptability and sustainability in a wide range of applications and environments.
The data collected by the sensors must be efficiently processed and analyzed. For instance, machine learning can improve the capability of computing techniques, including wireless sensors and data analytics. In this sense, the future roadmap for this sensor network envisions the development of a WSN with machine learning, enhanced security, and diversified sensor types. This advanced WSN will incorporate a software library supporting wireless sensor applications based on HFSM, improving efficiency in state transitions and interrupting service routines. The hierarchical state machine architecture will allow for subdividing complex algorithms into manageable submodules, optimizing memory usage, and ensuring deterministic system timings, which are crucial for microcontroller resource constraints. This approach will significantly enhance code modularity and reusability. Coupled with broader sensor capabilities, advanced IoT integrations, and a focus on sustainability, robust data security, and durability upon environmental conditions, these developments aim to revolutionize sustainable and efficient resource management. Other future research directions are the development of a WSN with enhanced security, including other sensor types, and testing other communication technologies such as LoRA WAN for areas with a low cellphone signal coverage.

4. Conclusions

In the present work, a WSN for monitoring temperature, moisture, gas, and light intensity based on a tree topology with five nodes was implemented. The adopted topology enhances the data transmission efficiency and facilitates expansion or adaptation to different needs and environments. The nodes were powered using 200 mA photovoltaic cells and rechargeable batteries, which allowed for their deployment in off-the grid locations. Each node sent the measurement values through a WiFi communication protocol with a response time of 2 s. The proposed WSN registered a scope of 750 m in an open field and 230 m inside the city, which is greater than similar reports. This WSN incorporated an easy-to-access graphical user interface and a user-friendly environment which controlled the WSN and recorded the variables of each node. Temperature information punctuated in a delimited area was captured by days, providing valuable information regarding the diurnal temperature variation, allowing for the indirect quantification of the solar radiation based on temperature, the inclination of the Earth’s axis, the sensed geographic zone altitude, and the latitude and translation movement of the Earth around the Sun. Overall, the winter noon temperature presented a greater difference from that reported on a website dedicated to climate measurements than that recorded in the WSN in Veracruz City, most likely due to the vegetation present in the area where the sensing was performed. The information of the presence of gas in the area suggests the possibility of correlating the presence, quantity, and type of gas with the variations in temperature and wind for a future analysis of this parameter.
In conclusion, the advances in the proposed WSN technology balance immediate functionality with cost and energy efficiency, paving the way for future investigations into its long-term performance.
Future research directions are the development of a WSN with enhanced security, including other sensor types, and testing other communication technologies such as LoRA WAN. Furthermore, a future WSN would consider a software library that supports the development of wireless sensor applications based on Hierarchical Finite State Machines (HFSM). This implementation will generate a high efficiency in state transitions and interrupt service routine execution. By introducing a hierarchical state machine architecture, it will be possible to split a complex algorithm into submodules, enabling a small memory footprint and deterministic system timings to comply with the resource limitations of the microcontroller. Thus, the code modularity and reusability will be improved.

Author Contributions

Conceptualization and investigation, J.M.P.-V., R.M.W.-G., E.O.-d.-l.-R., F.L.-H. and A.S.-V.; methodology and software, J.M.P.-V. and R.M.W.-G.; formal analysis, R.M.W.-G., E.O.-d.-l.-R. and F.C.-B.; writing—review and editing, A.L.H.-M., F.C.-B. and F.L.-H. All authors have read and agreed to the published version of the manuscript.

Funding

This work was supported by the National Council of Humanities, Science and Technology (CONAHCYT), through a Frontier Science 2019-40798 grant, and Universidad Veracruzana.

Institutional Review Board Statement

Not applicable.

Informed Consent Statement

Not applicable.

Data Availability Statement

Data are contained within this article.

Conflicts of Interest

The authors declare no conflicts of interest.

References

  1. Palniladevi, P.; Sabapathi, T.; Kanth, D.A.; Kumar, B.P. IoT Based Smart Agriculture Monitoring System Using Renewable Energy Sources. In Proceedings of the 2nd International Conference on Vision Towards Emerging Trends in Communication and Networking Technologies (ViTECoN), Vellore, India, 5–6 May 2023. [Google Scholar] [CrossRef]
  2. Bandara, T.M.; Mudiyanselage, W.; Raza, M. Smart farm and monitoring system for measuring the Environmental condition using wireless sensor network—IOT Technology in farming. In Proceedings of the 5th International Conference on Innovative Technologies in Intelligent Systems and Industrial Applications (CITISIA), Sydney, Australia, 25–27 November 2020. [Google Scholar] [CrossRef]
  3. Olivares, G.D. Energy-Efficent Operation of IoT Sensors in Precision Agriculture. Master’s Thesis, Norwegian University of Science and Technology, Trondheim, Norway, 2020. [Google Scholar]
  4. Ayaz, M.; Ammad-Uddin, M.; Sharif, Z.; Mansour, A.; Aggoune, E.-H.M. Internet-of-Things (IoT)-Based Smart Agriculture: Toward Making the Fields Talk. IEEE Access 2019, 7, 129551–129583. [Google Scholar] [CrossRef]
  5. Reza, Y.M.; Mohammad, R.A. Application of GIS and GPS in precision agriculture (a review). Int. J. Adv. Biol. Biomed. Res. 2015, 3, 7–9. Available online: http://www.ijabbr.com/article_12516_2a5ce07582300658c478705d7c31218e.pdf (accessed on 13 January 2024).
  6. Puri, V.; Nayyar, A.; Raja, L. Agriculture drones: A modern breakthrough in precision agriculture. J. Stat. Manag. Syst. 2017, 20, 507–518. [Google Scholar] [CrossRef]
  7. Kour, V.P.; Arora, S. Recent developments of the internet of things in agriculture: A survey. IEEE Access 2020, 8, 129924–129957. [Google Scholar] [CrossRef]
  8. Singh, R.K.; Berkvens, R.; Weyn, M. AgriFusion: An Architecture for IoT and Emerging Technologies Based on a Precision Agriculture Survey. IEEE Access 2021, 9, 136253–136283. [Google Scholar] [CrossRef]
  9. Khanna, A.; Kaur, S. Evolution of Internet of Things (IoT) and its significant impact in the field of Precision Agriculture. Comput. Electron. Agric. 2019, 157, 218–231. [Google Scholar] [CrossRef]
  10. Chen, J.; He, S.; Li, X. A study of big data application in agriculture. J. Phys. Conf. Ser. 2021, 1757, 012107. [Google Scholar] [CrossRef]
  11. Gutierrez, J.; Villa-Medina, J.F.; Nieto-Garibay, A.; Porta-Gandara, M.A. Automated Irrigation System Using a Wireless Sensor Network and GPRS Module. IEEE Trans. Instrum. Meas. 2014, 63, 166–176. [Google Scholar] [CrossRef]
  12. Jawad, H.; Nordin, R.; Gharghan, S.; Jawad, A.; Ismail, M. Energy-Efficient Wireless Sensor Networks for Precision Agriculture: A Review. Sensors 2017, 17, 1781. [Google Scholar] [CrossRef] [PubMed]
  13. Quaglia, G.; Visconte, C.; Scimmi, L.S.; Melchiorre, M.; Cavallone, P.; Pastorelli, S. Design of a UGV Powered by Solar Energy for Precision Agriculture. Robotics 2020, 9, 13. [Google Scholar] [CrossRef]
  14. Oliveira, T.E.; Reis, J.R.; Caldeirinha, R.F.S. Implementation of a WSN for Environmental Monitoring: From the Base Station to the Small Sensor Node. Sensors 2022, 22, 7976. [Google Scholar] [CrossRef] [PubMed]
  15. Effah, E.; Thiare, O.; Wyglinski, A.M. A Tutorial on Agricultural IoT: Fundamental Concepts, Architectures, Routing, and Optimization. IoT 2023, 4, 265–318. [Google Scholar] [CrossRef]
  16. Arjunan, S.; Sujatha, P. A survey on unequal clustering protocols in Wireless Sensor Networks. J. KSU Comput. Inf. Sci. 2019, 31, 304–317. [Google Scholar] [CrossRef]
  17. Gharaei, N.; Al-Otaibi, Y.; Butt, S.; Sahar, G.; Rahim, S. Energy-Effcient and Coverage-Guaranteed Unequal-Sized Clustering for Wireless Sensor Networks. IEEE Access 2019, 7, 157883–157891. [Google Scholar] [CrossRef]
  18. Visconti, P.; Giannoccaro, N.I.; de Fazio, R.; Strazzella, S.; Cafagna, D. IoT-oriented software platform applied to sensors-based farming facility with smartphone farmer app. Bull. Electr. Eng. Inform. 2020, 9, 1095–1105. [Google Scholar] [CrossRef]
  19. Tagarakis, A.C.; Kateris, D.; Berruto, R.; Bochtis, D. Low-Cost Wireless Sensing System for Precision Agriculture Applications in Orchards. Appl. Sci. 2021, 11, 5858. [Google Scholar] [CrossRef]
  20. Yu, Y.; Xue, B.; Chen, Z.; Qian, Z. Cluster tree topology construction method based on PSO algorithm to prolong the lifetime of ZigBee wireless sensor networks. J. Wirel. Commun. Netw. 2019, 199. [Google Scholar] [CrossRef]
  21. Carrillo-Niquete, G.A.; Andrade, J.L.; Valdez-Lazalde, J.R.; Reyes-García, C.; Hernández-Stefanoni, J.L. Characterizing spatial and temporal deforestation and its effects on surface urban heat islands in a tropical city using Landsat time series. Landsc. Urban Plan. 2022, 217, 104280. [Google Scholar] [CrossRef]
  22. Weather History in Veracruz. Available online: https://weatherspark.com/h/m/8657/2023/1/Historical-Weather-in-January-2023-in-Veracruz-Mexico#Figures-Temperature (accessed on 7 August 2023).
  23. Schwaab, J.; Meier, R.; Mussetti, G.; Seneviratne, S.; Bürgi, C.; Davin, E.L. The role of urban trees in reducing land surface temperatures in European cities. Nat. Commun. 2021, 12, 6763. [Google Scholar] [CrossRef] [PubMed]
  24. Figaro. TGS 2611. Available online: https://www.figaro.co.jp/product/entry/tgs2611-e00.html (accessed on 11 September 2023).
  25. Radi, M.; Purwantana, B.; Muzdrikah, F.S.; Nuha, M.S.; Rivai, M. Design of Wireless Sensor Network (WSN) with RF Module for Smart Irrigation System in Large. In Proceedings of the International Conference on Computer Engineering, Network and Intelligent Multimedia (CENIM), Surabaya, Indonesia, 26–27 November 2018; pp. 181–185. [Google Scholar] [CrossRef]
  26. Af’idah, D.I.; Rochim, A.F.; Widianto, E.D. Design of Wireless Sensor Networks (WSN) to Monitor Temperature and Humidity Using nRF24L01+. J. Teknol. Dan Sist. Komput. 2014, 2, 267–276. [Google Scholar]
Figure 1. Localization of Veracruz and schematic view for each slave node of the proposed WSN.
Technologies 12 00041 g001
Figure 2. The tree topology of the sensor and master node.
Technologies 12 00041 g002
Figure 3. The front panel of the GUI for the activation of each WSN node.
Technologies 12 00041 g003
Figure 4. (a) GUI front panel for the activation of each node; (b) block diagram for each node and the sub-node.
Technologies 12 00041 g004
Figure 5. Setup for each slave node of the WSN.
Technologies 12 00041 g005
Figure 6. GUI of the WSN showing the environmental variables in each node.
Technologies 12 00041 g006
Figure 7. Ambient temperatures were measured in the morning and at noon for (a) January 2023 and (b) June 2023 using the constructed WSN.
Technologies 12 00041 g007
Figure 8. Temperatures recorded at 24 h of June 2023; screenshot of [22].
Technologies 12 00041 g008
Figure 9. Information on temperatures in Veracruz was recorded by WSN and [22].
Technologies 12 00041 g009
Figure 10. Gas concentration in (a) node 1 and (b) node 3 of the proposed WSN.
Technologies 12 00041 g010
Figure 11. Maximum range obtained in (a) the open-field satellite image and (b) the city (19.233750, −96.210612) for the proposed WSN.
Technologies 12 00041 g011aTechnologies 12 00041 g011b
Figure 12. Satellite images of the physical distribution of nodes and sub-nodes.
Technologies 12 00041 g012
Figure 13. Photograph of the location of (a) slave node and (b) master node for the proposed WSN.
Technologies 12 00041 g013
Table 1. Physical distribution of nodes and sub-nodes.
NodeLatitudeLengthNext NodeDistance from Actual to Next Node (m)
Node 119°25′53″−96°22′33″Node 2405.5
Node 219°26′03″−96°22′36″Sub-Node_1-1545.5
Sub-Node_1-119°26′06″−96°21′83″Sub-Node_1-2564.2
Sub-Node_1-219°25′73″−96°21′48″Node 3517.3
Node 319°25′38″−96°21′96″Node 1631.7
Node 1 Sub-Node_1-1832.5
Node 2 Sub-Node_1-1787.7
Node 1 Sub-Node_2-2841.8
Disclaimer/Publisher’s Note: The statements, opinions and data contained in all publications are solely those of the individual author(s) and contributor(s) and not of MDPI and/or the editor(s). MDPI and/or the editor(s) disclaim responsibility for any injury to people or property resulting from any ideas, methods, instructions or products referred to in the content.

