Abstract
Cognitive radio is a promising technology that emerged as a potential solution to the spectrum shortage problem by enabling opportunistic spectrum access. In many cases, cognitive radios are required to sense a wide range of frequencies to locate the spectrum white spaces; hence, wideband spectrum comes into play, which is also an essential step in future wireless systems to boost the throughput. Cognitive radios are intelligent devices and therefore can be opted for the development of modern jamming and anti-jamming solutions. To this end, our article introduces a novel AI-enabled energy-efficient and robust technique for wideband radio spectrum characterization. Our work considers a wideband radio spectrum made up of numerous narrowband signals, which could be normal communications or signals disrupted by a stealthy jammer. First, the receiver recovers the wideband from significantly low sub-Nyquist rate samples by exploiting compressive sensing technique to decrease the overhead caused by the high complexity analog-to-digital conversion process. Once the wideband is recovered, each available narrowband signal is given to a cyclostationary feature detector that computes the corresponding spectral correlation function and extracts the feature vectors in the form of cycle and frequency profiles. Then profiles are concatenated and given as input features set to an artificial neural network which in turn classifies each NB signal as legitimate communication with a specific modulation or disrupted by a stealthy jammer. The results show a classification accuracy of about 0.99 is achieved. Moreover, the algorithm highlights significantly high performances in comparison to recently reported spectrum classification techniques. The proposed technique can be used to design anti-jamming systems for military communication systems.
1. Introduction
Cognitive Radio (CR) is proposed as a promising solution to the spectrum scarcity and inefficient spectrum utilization problems, by enabling its capabilities of Opportunistic Spectrum Access (OSA) [,,]. CR has received significant interest, specifically in TV white spaces (TVWS) [,,,], 5G [], and 6G networks, where the Secondary Users (SU) sense a wide range of radio spectrum and dynamically alter their transmission parameters to access the spectrum licensed to Primary User (PU). For example, 5G NR Release 16 proposes Dynamic Spectrum Access (DSA) which is a new approach that allows the co-existence of Long-Term Evolution (LTE) and 5G in the same frequency band []. Moreover, it is recommended that the communication system and radar will use the same spectral band []. Therefore, spectrum sensing plays a fundamental role in CR-based Dynamic Spectrum Access (DSA) techniques.
Several sensing methods have been introduced in the previous decades, including the energy detector (ED) [], the matching filter detector (MFD) [], and the cyclostationary feature detector (CFD) []. Because of its ease of implementation and lack of need for signal knowledge, ED is included in IEEE 802.22. However, it fails in situations where low-power signals are needed to be detected. On the other hand, MFD is the best detector, but it requires extensive knowledge of the transmitted signal and, therefore, needs a dedicated receiver architecture, which makes it inadequate for use in many practical spectrum-sensing applications in the context of CR. On the other hand, CFD not only detects the signals in low-SNR conditions but also has the potential to differential the legitimate signals from interference [,]. CFD exploits the built-in periodicity in man-made signals, such as carrier frequencies, and symbol rates, to differentiate between communications signals []. It computes the spectral correlation function (SCF) of signals that is, in fact, the Fourier Transform of cyclic auto-correlation function (CAF), and hence it produces different patterns for different communications signals under the consideration [,]. Therefore, SCF can be used to differentiate between modulated legitimate signals and potentially malicious waveforms.
In most cases, CR monitors the wideband spectrum to find the multiple idle sub-bands for data transmission, hence increasing the throughput of the system. However, the bandwidth of the scanned wideband signals is very large, from a few hundred MHz to several GHz; therefore, as a result of the Nyquist rate sampling bottleneck, the analog-to-digital (A/D) converters with significantly high resolution and computational power are needed which results in heavy memory overhead and power consumption. On the other hand, Compressed sensing (CS) [] is a revolutionary signal processing technique that alleviates the requirements of Nyquist sampling rates on the condition that the signal under observation is scant in a proper domain. Hence, the fundamental need for CS in order to be used for spectrum sensing is signal sparsity, which is a practical assumption in the case of CR networks due to the fact of spectrum underutilization by primary system []. As a result of the PU’s low spectral occupancy, the wideband signal is sparse in the frequency domain. To find the sparsest solution for wideband signal, CS requires non-linear optimization, which can be accomplished using greedy algorithms, for example, Matching Pursuit (MP) [] or Orthogonal MP []. Another method is Basis Pursuit (BP) that uses Convex Programming to estimate the wideband. The SCF of the detected signals in the reconstructed wideband (WB) spectrum, must then be estimated by CFD. One method that has emerged is to first recover the WB at the Nyquist rate from sub-Nyquist samples, then find the SCF of each occupied sub-band signal and extract features. This method is described in []. The author used a modulated wideband converter (MWC) to recover Nyquist samples []. In contrast, the authors of [,] used a different method to compute SCF directly from sub-Nyquist samples by using sparsity in both cyclic and angular frequency domains.
Although CR technology was initially introduced as a solution for OSA, due to its intelligent nature it has also raised serious concerns about communications security. Due to its sensing capabilities, CR node can monitor activities over a wide range of the spectrum, and, therefore, is able to disrupt the ongoing communications by launching smart jamming attacks [,]. Further, it can imitate the legitimate user and conduct the primary user emulation (PUE) attacks []. Because the radio communications channel is unprotected, therefore, the physical layer (PHY-layer) is particularly vulnerable to radio frequency (RF) jamming assaults. As a result, the need for communications security in the Cyber-Physical Systems (CPSs) and Internet-of-Things (IoT) frameworks [], has forced the development of a suitable paradigm. The SHIELD project, which incorporates approaches and algorithms for creating secure embedded communication systems [], is a significant progress in this direction. TVWS [] technology has also addressed the issue of detecting unauthorized users.
Our article focuses on stealthy jamming attacks; such jammers embed the spectrum sensing capability and therefore, only initiate transmission once energy is detected in a frequency band and terminate its transmission once the targeted signal stops transmission. Hence, such jamming attacks are hard to spot using conventional detection methods on the network layer. Most of the previous studies that explore RF jamming assumed tone-jamming attacks [,]. However, in more recent works [,], authors showed that modulated pulsed jamming attacks could be more effective than tone jamming in power-constrained environments; therefore, they are studied in this work. Moreover, a stealthy jammer embeds a feature detector (FD) and therefore extracts features of the targeted signals and identifies their modulation schemes, hence using the best jamming scheme to jam the targeted signal. A reliable detection technique is required to design an anti-jamming system to mitigate stealthy jamming attacks. Therefore, this work introduces a robust and energy-efficient algorithm to not only detect stealthy jamming attacks but also classify legitimate modulated signals. The key contributions of the article are as follows: (i) using CS, CFD, and artificial neural networks, classify the multiple available NB signals in the WB spectrum into their corresponding modulation schemes; and (ii) detect stealthy modulated pulse jamming attacks using the previously trained artificial neural network.
Our newly proposed algorithm can be explained as follows. The CR node scans a WB spectrum made up of M sub-bands. The WB is sparsely occupied with narrow-band (NB) communications, which could be either licit or blocked by the stealthy jammer. Compressed sensing is exploited to ease the requirements of Nyquist rate sampling and the WB spectrum that is sparsely occupied is reconstructed from sub-Nyquist samples. Then each NB signal in WB is sent to CFD which computes the SCF and the corresponding frequency (f) profile and cycle () frequency profile are used as a feature vector for training the artificial neural network that classifies signals as legitimate communications with a specific modulation type or as jammed by a pulse-modulated stealthy jammer. The algorithm’s performance is further evaluated with an independent set of signals that are obtained at different compression ratios and SNRs from the one used in the previous stage. The algorithm has been shown to achieve high accuracy for both jammer detection and signals classification at low compression rates and SNRs compared to techniques discussed in the literature.
2. Materials and Methods
We assumed a WB signal of W Hz divided into M sub-bands is at the disposal of the CR node. The received WB signal is given as
shows the k- NB signal, is the k- Rayleigh fading channel coefficient, * represents the convolution operation, and n(t) denotes the AWGN. NB signals were produced using various modulation techniques, for example, binary modulation schemes such as binary phase shift keying (BPSK), binary amplitude shift keying (BASK), binary frequency shift keying (BFSK) and multi-level modulation schemes such as quadrature amplitude modulation (QAM), quadrature phase shift keying (QPSK) as depicted in Figure 1. Moreover, the PUs in the vicinity may adopt any other modulation scheme over time.

Figure 1.
Wideband signal made up of multiple transmissions, whereas a stealthy jammer with pulsed jamming capabilities tries to disrupt multiple ongoing transmissions.
For our system model, it is considered that the stealthy jammer embedded an FD, making it capable of identifying the modulations of the targeted signal and employing the most effective jamming techniques against them, as presented in Figure 1. The pulsed (modulated) jamming is especially successful in energy-constrained conditions, and the jamming strategies against different target signals are provided in Table 1. The transmitted signals are generated by the signal model:
here A denotes the amplitude of the transmitted signal, represents the root-raised-cosine filter (RRC) pulse shaping filter with a roll-off factor , denotes the symbol period, denotes the symbol rate, and, M denotes the number of phases, denotes the carrier frequency, and denotes the i-th transmitted symbol.

Table 1.
Optimal jamming strategy in a coherent scenario [].
2.1. Compressed Sensing
The WB signal can be represented in the frequency domain by taking the discrete Fourier transform of the in (1):
here is equivalent frequency domain WB signal, is a channel matrix, and , , and are acquired frequency-domain samples of , , and , consecutively.
WB signal in (2) could be expressed in a more generalized form as given below:
here represents the NB received signals in frequency domain, and is the corresponding channel matrix. From Equation (3), it can be noticed that the WB sensing needs to measure the when and are provided. Since a sparse WB signal is at its disposal, the receiver can exploit the compressed sensing, a sub-Nyquist signal recovery technique, to alleviate the Nyquist rate A/D sampling requirements. A number of computationally efficient techniques, for example, Orthogonal Matching Pursuit (OMP) [] or Basis Pursuit [], were used to estimate the received signal accurately from the samples acquired at the sub-Nyquist sampling rate. The receiver needs to collect the compressed time domain samples of the WB signal and, therefore, measurement matrix is used to obtain a sample vector of size from the WB signal as given:
where is the discrete-time representations of at the Nyquist sampling rate with and is the projection matrix. Various schemes are reported in the literature for compressive sampler design such as random sampler [] and non-uniform sampler []. It should be noted that , and given K compressive samples, the spectrum could now be obtained in (4), as below:
here shows white Gaussian noise vector. Due to the under-utilization of the spectrum by primary users in cognitive radio networks framework, the signal vector is sparsely populated. The sparsity of the signal is calculated using the p-norm such as , , with indicating definite sparsity. Therefore, (6) presents a linear regression problem with a sparsely populated WB () which could be approximated by solving the linear convex optimization problem:
The problem in (7) is solved using a variety of methods, including Convex Programming, as in BP [] which is opted in this work to estimate the sparse WB signal. After obtaining the reconstructed WB using compressive sensing, the SCF is computed for each NB signal in WB, which is given in Section 2.2.
2.2. Spectral Correlation Function
The NB signal is treated as a cyclostationary process if the mean and auto-correlation function of the is periodic with given as:
Therefore, the auto-correlation of a cyclostationary signal can be represented by Fourier series.
here, , where a is an integer. is CAF of signal and can be given by the following equation
as is periodic, therefore, (10) can be written as
SCF is obtained by taking the Fourier Transform (FT) of in (11)
where denotes the SCF of the NB signal , the shows cycle frequency and f represents the linear frequency.
The main advantage of exploiting the SCF for feature extraction is that it is not impacted by background noise because noise is random in nature. Hence, it can also be used in low-SNR conditions. However, the estimated SCF is strongly influenced by how good the WB spectrum was approximated using compressed sensing, which is influenced by signal sparsity and compression rate. SCF of the signals considered in this work, namely, BPSK and QPSK, is depicted in Figure 2a,b. Because SCF estimation produces a huge amount of data, it cannot be used as a feature vector to train a classifier. As a result, SCF yields two profiles, -profile and given in (13) and (14), which are merged to create a feature set, which is then fed to a classifier that is discussed in the following section.
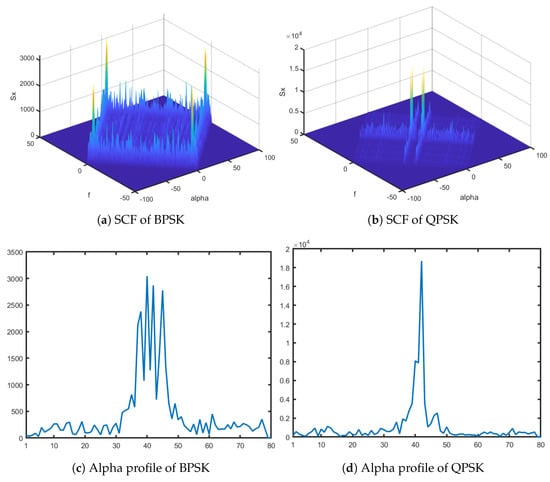
Figure 2.
The SCFs obtained at −5 dB for NB signals (a) BPSK signal (b) QPSK signal, and corresponding alpha profiles (c) BPSK signal. (d) QPSK signal.The WB signal is reconstructed with a compression ratio of 0.50.
2.3. Classifier and Proposed Algorithm
Artificial Neural Network (ANN) has been employed in different fields for classification problems. Our proposed algorithm uses an ANN classifier because of its successful applications for pattern recognition in both signal and image processing. Moreover, it has the ability to generalize the model to any compression ratio, SNRs, carrier frequency, and symbol rate. These characteristics make it a natural choice for spectrum characterization in the presence of stealthy jamming attacks that use modulated pulses to jam the targeted signal in WB. It is used to characterize the available NB signals in the received WB spectrum into four broad classes, with two legitimate signal classes, namely BPSK and QPSK, and two jamming signal classes, BPSK-jammed and QPSK-jammed. ANN consists of an input layer with 100 neurons related to the input features vector, one hidden layer that contains 16 neurons, and an output layer associated with targeted output classes. The hidden layer uses the sigmoid as a transfer function which is given as
The ANN like all other supervised learning algorithms works in two stages. First, the ANN is trained offline and then tested online. For training the ANN, we used a back-propagation algorithm, namely, scale conjugate gradient []. The output layer produces four outputs between 0 and 1, corresponding to each class of signal, and the class with the highest value between (0,1) among the four is marked as the targeted signal class. A large dataset of 48,000 received WB signals, corresponding to different SNRs and compression ratios, is collected. The dataset is split into three parts, 70% is used for training, 15% for validation, and 15% for testing. ANN architecture is trained for hundred runs with the dataset being randomly divided and weights being randomly initialized in each run. An average accuracy of over 98% is reported for true positive classification; hence, increasing the number of layers will not increase accuracy further but only increase the training time. Therefore, the ANN architecture with 16 neurons in a hidden layer that offers the highest accuracy is used for spectrum characterization. Figure 3 shows the ANN architecture discussed above.

Figure 3.
The architecture of artificial neural network used to classify various types of signals.
Our proposed algorithm is reported in Figure 4, where a CR received a WB composed of many NB signals. CR set the compression rate (K/N) to a specific value and used the random sampler to sample the WB signal and collect the related measurement matrix . Then the WB signal is reconstructed by exploiting BP from sub-Nyquist samples. Following this, the cyclostationary spectral analysis is performed and SCF is computed for each NB signal, and the corresponding features vector is formed by combining the f and profiles. The features vector is then used to train the ANN that classifies each NB signal in the occupied subband as a normal communication with a specific modulation or NB signal blocked by the stealthy jammer. In the end, the classifier is tested with an independent dataset.
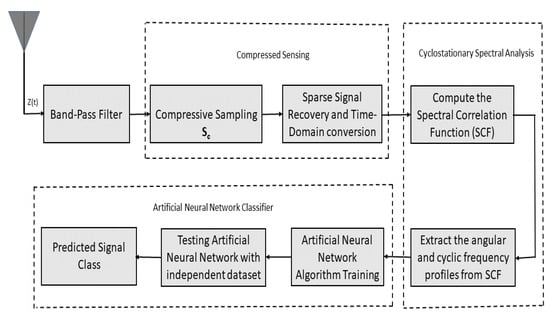
Figure 4.
Functional diagram of the proposed algorithm.
3. Results and Discussions
A WB of 100 MHZ, divided into 10 sub-bands, is sensed by a CR node. These sub-bands are sparsely populated by NB signals, which are generated using BPSK and QPSK modulations, and a stealthy jammer with modulated pulsed jamming capabilities is considered. The monitored WB signal is affected by AWGN and it is reconstructed through CS by using the BP algorithm. The spectrum analysis is performed at to extract the expert features as AWGN has no spectral correlation due to its random nature. The classification results are shown with the help Test confusion matrix. Further, the algorithm performances are evaluated in both AWGN and multipath Rayleigh fading channels with the independent signal set from the training phase that was created using various SNRs and compression rates.
An ANN architecture is selected by taking in account the procedure outlined in Section 2.3. The ANN is trained, tested, and validated with a dataset of 48,000 signals, that was created by acquiring WB signals at different compression ratios, and SNRs. Therefore, the performance of the algorithm is independent of these parameters. In Figure 5, the total accuracy of the ANN-based classifier in the existence of a pulsed modulated stealthy jammer is depicted as a test confusion matrix, demonstrating a classification accuracy of about 98.5%. The test signals account for 15% (7200) of the entire recorded signals in the dataset. Further, it can be seen from the figure that the licit signals, BPSK and QPSK, are identified with approximately 100% accuracy, whereas for jammed bands, BPSK-Jammed and QPSK-Jammed, the accuracy is 98.3% and 96.3%, respectively.
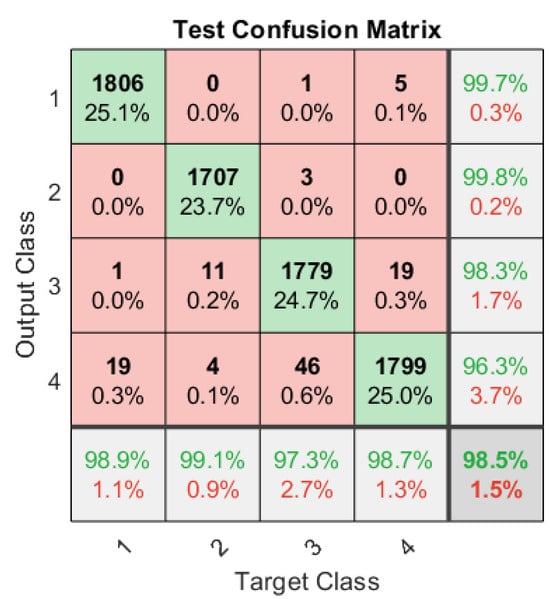
Figure 5.
Test confusion matrix with four target classes: BPSK, QPSK, BPSK-Jammed, and QPSK-Jammed.
In the second phase, ANN is further tested online for the 1000 independent samples at multiple SNRs and compression ratios in the AWGN and Rayleigh fading channel. Figure 6 shows the classification rate at −5 dB for different compression ratios, where, for ANN classified the BPSK and QPSK with a rate of 0.63 and 0.64 respectively. On the other hand, the jammed sub-bands, BPSK-jammed and QPSK-jammed are classified with an accuracy of approximately 0.60. Then, by increasing the ratio, more samples are available to reconstruct the WB signal, therefore, SCF has a better estimation compared to the previous case. Hence, accuracy is improved by increasing to 0.25, it is approximately 0.86 for licit signals (BPSK to BPSK and QPSK to QPSK) and 0.88 for jammed signals (BPSK-jammed and QPSK-jammed). It is possible to infer from the figure that a classification accuracy of about 1 is obtained for . On the other hand, for the Rayleigh fading channel, the classification rate is significantly low at low compression ratios (0.15–0.4) as compared to AWGN, whereas it is comparable to accuracy achieved at high compression ratios (0.5–1).
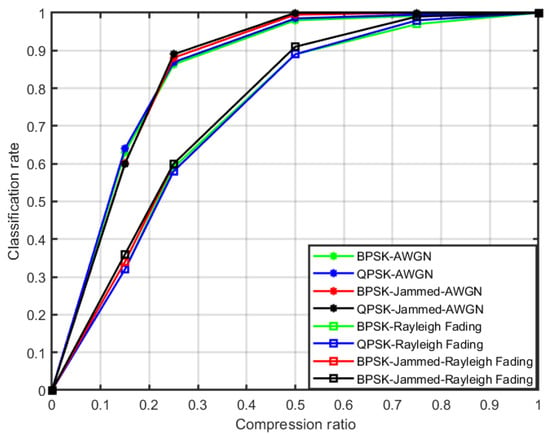
Figure 6.
Classification accuracy of the algorithm at −5 dB in the AWGN and Rayleigh fading channel.
The algorithm’s performance is also evaluated at 0 dB and 5 dB, and results are reported in Figure 7 and Figure 8, respectively. A similar trend is observed when is moved from 0.15 to 1. Classification performance is increased, for instance, the classification rate at 0 dB for is approximately 0.72 as compared to 0.63 at −5 dB for un-jammed BPSK and QPSK signals, and similarly, the trend is noticed for the signals jammed by stealthy jammer (BPSK-jammed and QPSK-jammed) and it is 0.71, compared to 0.60 at −5 dB. An accuracy of approximately 100% is attained at and above , which shows that the ANN correctly identifies all the signals. Similarly, it can also be inferred from Figure 8 that an accuracy of 100% is also achieved for at 5 dB.
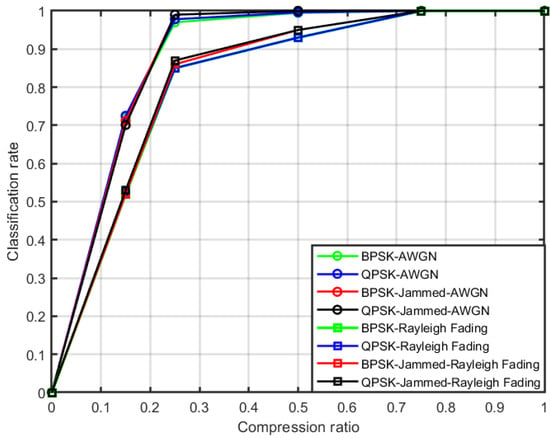
Figure 7.
Classification accuracy of the algorithm at 0 dB in the AWGN and Rayleigh fading channel.
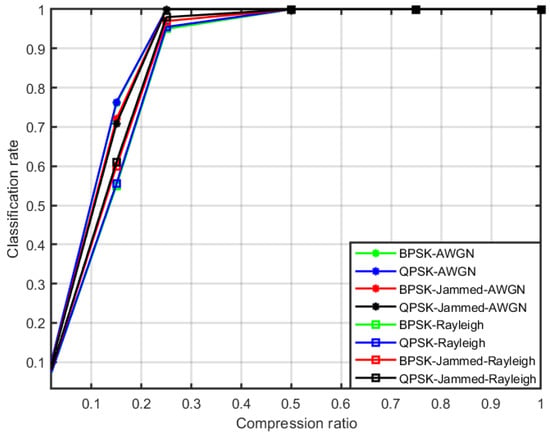
Figure 8.
Classification accuracy of the algorithm at 5 dB in the AWGN and Rayleigh fading channel.
The results show that even at low SNR −5 dB and 50% of Nyquist rate samples, the algorithm correctly classified all the signals to their targeted classes. Further, it is possible to get an error-free classification by using only 25% of Nyquist rate samples at 0 dB to reconstruct the WB signal. The algorithm obtained such a high performance because SCF of various types of communications signals produces highly diverse patterns, and hence yields highly distinct feature vectors. Further, the algorithm is shown as a robust and energy-efficient tool to recognize signals at low SNRs and compression ratios.
Our novel algorithm ensures high accuracy when compared to techniques reported in the literature [,,,,] that required 10–20 dB SNR to achieve comparable performances. Further, the performance of our algorithm is compared to work in [] where classification was performed using the traditional databases matching method. The authors used the same set of signals as considered in our work. They acquired signals only at 0 dB by varying compression ratio between 0.25 to 1 under the AWGN channel conditions. Figure 9 shows that embedding the ANN to the spectrum characterization algorithm not only increased the signal classification accuracy but also remarkably increased the detection rates for the jammers. The detection rate for the jammer is about 1 for at 0 dB as compared to 0.45 (average) in database parameters matching methods. Moreover, ref. [] could only able to detect the jammer with a rate of 0.9 at Nyquist rate sampling. On the other hand, in [], the algorithm used features like bandwidths, center frequencies, and maximum amplitude of the PSDs of the signals for the naive Bayes Classifier (NBC). They acquired the signals at 5 dB and 10 dB by varying the compression ratios between 0.7 and 1 under the Rayleigh fading channel. Our algorithm performance is compared for Rayleigh fading channel with this technique in Table 2 and the result shows that our newly developed algorithm outperforms this technique both in terms of jammer detection and signal classification rates. The algorithm in [] is able to classify the un-jammed modulated signals BPSK and QPSK at 5 dB with a rate of 0.76, 0.80, 8.80, and 0.82 for K/N of 0.70, 0.80, 0.90 and 1, respectively. Similarly, for BPSK-Jammed and QPSK-Jammed, the jammer detection rate is 0.40, 0.48, 0.59, and 0.70 for K/N of 0.70, 0.80, 0.90, and 1, respectively. Our approach, on the other hand, obtained signal classification and jammer detection rates of 1 for all K/N (0.7 to 1). Further, it can be noticed from Figure 6 and Figure 7 that our algorithm obtained a total classification rate of approximately 0.9 and 0.95 at −5 dB and 0 dB, respectively, in Rayleigh fading environments for the compression rate of 0.50. These high performances are acquired by using SCF of the signals, which is highly distinct for different signals, along with the ANN classifier.
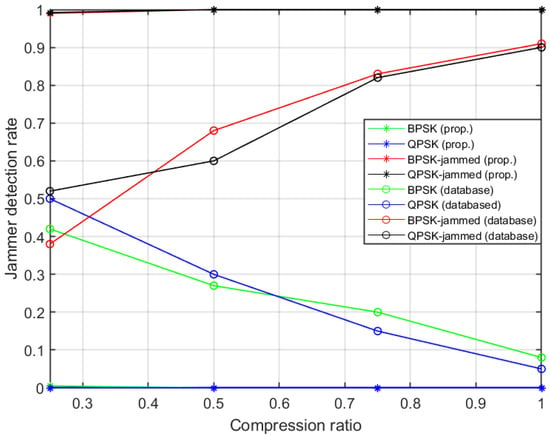
Figure 9.
Performance comparison with detection algorithm in []. The algorithm in [] used a conventional database matching method for signal classification, whereas our proposed algorithm used an artificial neural network as a classifier.

Table 2.
Performance comparison with [].
4. Conclusions
This paper presents a novel algorithm for spectrum characterization in WB radios. The WB spectrum is made up of various NB signals that can be either licit or blocked by a stealthy jammer. The jammer is equipped with the feature detection capability of CR, and, therefore, exploits the optimum pulse-modulated jamming signals to disrupt the communications of targeted licit NB signals. In order to decrease the A/D process complexity, compressive sensing is used to reconstruct the WB signal from the samples acquired at sub-Nyquist rates. Then, in each occupied sub-band, the signals are sent to the CFD detector that computed the SCF oand corresponding f and profiles are extracted and concatenated to form a features vector. The feature vectors are then used to train and test the ANN-based classifier that classified the signals available in each occupied sub-bands either as normal communications signals with particular modulation types or jammed by the stealthy jammer. Moreover, the testing of the ANN using independent test signals revealed that it functioned effectively at low SNRs and high compression settings. The algorithm guaranteed both jammer detection and signal classification rates of 1 at SNRs as low as −5 dB with a compression ratio of 0.50. It is shown that the ANN-based technique greatly increased the classification performances in comparison to plain database-matching methods. Further, it is also shown that our technique outperformed the recently developed feature-based jammer detection methods.
Our future work will include the collection of a new dataset using software-defined radios and exploring deep learning for anomaly detection and signal classification.
Author Contributions
Conceptualization, T.N.; methodology, T.N.; software, T.N. and R.S.N.; validation, T.N.; formal analysis, T.N. and R.S.N.; investigation, T.N. and R.S.N.; resources, T.N.; data curation, T.N. and R.S.N.; writing—original draft preparation, T.N. and R.S.N.; writing—review and editing, T.N. and R.S.N.; visualization, T.N. and R.S.N.; supervision, T.N.; project administration, T.N.; funding acquisition, T.N. and R.S.N. All authors have read and agreed to the published version of the manuscript.
Funding
This work has been carried out under the financial support of grant GRANT2942 of the Deanship of Scientific Research (DSR), Vice Presidency of Graduate Studies and Scientific Research, King Faisal University, Saudi Arabia.
Institutional Review Board Statement
Not applicable.
Informed Consent Statement
Not applicable.
Data Availability Statement
The data used to support the findings of this study are available from the corresponding author upon request.
Acknowledgments
The authors gratefully recognize the Deanship of Scientific Research (DSR) at King Faisal University for financial assistance provided through grant GRANT2942.
Conflicts of Interest
The authors declare no conflict of interest.
References
- Mitola, J.; Maguire, G.Q. Cognitive radio: Making software radios more personal. IEEE Pers. Commun. 1999, 6, 13–18. [Google Scholar] [CrossRef]
- Nasser, A.; Al Haj Hassan, H.; Abou Chaaya, J.; Mansour, A.; Yao, K.C. Spectrum Sensing for Cognitive Radio: Recent Advances and Future Challenge. Sensors 2021, 21, 2408. [Google Scholar] [CrossRef] [PubMed]
- Arjoune, Y.; Kaabouch, N. A Comprehensive Survey on Spectrum Sensing in Cognitive Radio Networks: Recent Advances, New Challenges, and Future Research Directions. Sensors 2019, 19, 126. [Google Scholar] [CrossRef]
- Holland, O.; Ping, S.; Aijaz, A.; Chareau, J.M.; Chawdhry, P.; Gao, Y.; Qin, Z.; Kokkinen, H. To white space or not to white space: That is the trial within the Ofcom TV white spaces pilot. In Proceedings of the 2015 IEEE International Symposium on Dynamic Spectrum Access Networks (DySPAN), Stockholm, Sweden, 29 September–2 October 2015; pp. 11–22. [Google Scholar]
- Qin, Z.; Gao, Y.; Parini, C.G. Data-assisted low complexity compressive spectrum sensing on real-time signals under sub-Nyquist rate. IEEE Trans. Wirel. Commun. 2015, 15, 1174–1185. [Google Scholar] [CrossRef]
- Qin, Z.; Gao, Y.; Plumbley, M.D.; Parini, C.G. Wideband spectrum sensing on real-time signals at sub-Nyquist sampling rates in single and cooperative multiple nodes. IEEE Trans. Signal Process. 2015, 64, 3106–3117. [Google Scholar] [CrossRef]
- Martin, J.H.; Dooley, L.S.; Wong, K.C.P. New dynamic spectrum access algorithm for TV white space cognitive radio networks. IET Commun. 2016, 10, 2591–2597. [Google Scholar] [CrossRef]
- Lin, S.; Kong, L.; Gao, Q.; Khan, M.K.; Zhong, Z.; Jin, X.; Zeng, P. Advanced dynamic channel access strategy in spectrum sharing 5G systems. IEEE Wirel. Commun. 2017, 24, 74–80. [Google Scholar] [CrossRef]
- De Lima, C.; Belot, D.; Berkvens, R.; Bourdoux, A.; Dardari, D.; Guillaud, M.; Isomursu, M.; Lohan, E.S.; Miao, Y.; Barreto, A.N.; et al. Convergent Communication, Sensing and Localization in 6G Systems: An Overview of Technologies, Opportunities and Challenges. IEEE Access 2021, 9, 26902–26925. [Google Scholar] [CrossRef]
- Wild, T.; Braun, V.; Viswanathan, H. Joint Design of Communication and Sensing for Beyond 5G and 6G Systems. IEEE Access 2021, 9, 30845–30857. [Google Scholar] [CrossRef]
- Chin, W.L.; Li, J.M.; Chen, H.H. Low-complexity energy detection for spectrum sensing with random arrivals of primary users. IEEE Trans. Veh. Technol. 2015, 65, 947–952. [Google Scholar] [CrossRef]
- Zhang, X.; Gao, F.; Chai, R.; Jiang, T. Matched filter based spectrum sensing when primary user has multiple power levels. China Commun. 2015, 12, 21–31. [Google Scholar] [CrossRef]
- Kozłowski, S. Implementation and verification of cyclostationary feature detector for DVB-T signals. IET Signal Process. 2016, 10, 162–167. [Google Scholar] [CrossRef]
- Nawaz, T.; Alzahrani, A. Machine-Learning-Assisted Cyclostationary Spectral Analysis for Joint Signal Classification and Jammer Detection at the Physical Layer of Cognitive Radio. Sensors 2023, 23, 7144. [Google Scholar] [CrossRef] [PubMed]
- Nawaz, T.; Marcenaro, L.; Regazzoni, C.S. Stealthy jammer detection algorithm for wide-band radios: A physical layer approach. In Proceedings of the 2017 IEEE 13th International Conference on Wireless and Mobile Computing, Networking and Communications (WiMob), Rome, Italy, 9–11 October 2017; pp. 79–83. [Google Scholar] [CrossRef]
- Toma, A.; Nawaz, T.; Gao, Y.; Marcenaro, L.; Regazzoni, C.S. Interference mitigation in wideband radios using spectrum correlation and neural network. IET Commun. 2019, 13, 1336–1347. [Google Scholar] [CrossRef]
- Gardner, W.; Cadzow, J.A. Statistical spectral analysis: A nonprobabilistic theory. Appl. Opt. 1990, 29, 1399. [Google Scholar] [CrossRef]
- Roberts, R.S.; Brown, W.A.; Loomis, H.H.; Loomis, H., Jr. Computationally efficient algorithms for cyclic spectral analysis. IEEE Signal Process. Mag. 1991, 8, 38–49. [Google Scholar] [CrossRef]
- Donoho, D.L. Compressed sensing. IEEE Trans. Inf. Theory 2006, 52, 1289–1306. [Google Scholar] [CrossRef]
- Duarte, M.F.; Wakin, M.B.; Baraniuk, R.G. Fast Reconstruction of Piecewise Smooth Signals from Random Projections. In Proceedings of the Workshop on Signal Processing with Adaptative Sparse Structured Representations (SPARS), Rennes, France, 16–18 November 2005. [Google Scholar]
- Tropp, J.A.; Gilbert, A.C. Signal Recovery From Random Measurements Via Orthogonal Matching Pursuit. IEEE Trans. Inf. Theory 2007, 53, 4655–4666. [Google Scholar] [CrossRef]
- Cohen, D.; Rebeiz, E.; Jain, V.; Eldar, Y.C.; Cabric, D. Cyclostationary feature detection from sub-Nyquist samples. In Proceedings of the 2011 4th IEEE International Workshop on Computational Advances in Multi-Sensor Adaptive Processing (CAMSAP), San Juan, PR, USA, 13–16 December 2011; pp. 333–336. [Google Scholar]
- Mishali, M.; Eldar, Y.C. From Theory to Practice: Sub-Nyquist Sampling of Sparse Wideband Analog Signals. IEEE J. Sel. Top. Signal Process. 2010, 4, 375–391. [Google Scholar] [CrossRef]
- Tian, Z. Cyclic Feature Based Wideband Spectrum Sensing Using Compressive Sampling. In Proceedings of the 2011 IEEE International Conference on Communications (ICC), Kyoto, Japan, 5–9 June 2011; pp. 1–5. [Google Scholar]
- Tian, Z.; Tafesse, Y.; Sadler, B.M. Cyclic Feature Detection With Sub-Nyquist Sampling for Wideband Spectrum Sensing. IEEE J. Sel. Top. Signal Process. 2012, 6, 58–69. [Google Scholar] [CrossRef]
- Wang, L.; Wyglinski, A.M. A combined approach for distinguishing different types of jamming attacks against wireless networks. In Proceedings of the 2011 IEEE Pacific Rim Conference on Communications, Computers and Signal Processing, Victoria, BC, Canada, 23–26 August 2011; pp. 809–814. [Google Scholar]
- Pelechrinis, K.; Iliofotou, M.; Krishnamurthy, S.V. Denial of Service Attacks in Wireless Networks: The Case of Jammers. IEEE Commun. Surv. Tutor. 2011, 13, 245–257. [Google Scholar] [CrossRef]
- Chen, R.; Park, J.M.; Reed, J.H. Defense against Primary User Emulation Attacks in Cognitive Radio Networks. IEEE J. Sel. Areas Commun. 2008, 26, 25–37. [Google Scholar] [CrossRef]
- Gao, Y.; Qin, Z.; Feng, Z.; Zhang, Q.; Holland, O.; Dohler, M. Scalable and reliable IoT enabled by dynamic spectrum management for M2M in LTE-A. IEEE Internet Things J. 2016, 3, 1135–1145. [Google Scholar] [CrossRef]
- Fiaschetti, A.; Noll, J.; Azzoni, P.; Uribeetxeberria, R. Measurable and Composable Security, Privacy, and Dependability for Cyberphysical Systems: The SHIELD Methodology; CRC Press: Boca Raton, FL, USA, 2017. [Google Scholar]
- Poiselr, R.A. Introduction to Communication Electronic Warfare Systems. In Proceedings of the 2014 IEEE Global Communications Conference, Orleans, LA, USA, 30 November–4 December 2008. [Google Scholar]
- Mughal, M.O.; Kim, S. Signal Classification and Jamming Detection in Wide-Band Radios Using Naïve Bayes Classifier. IEEE Commun. Lett. 2018, 22, 1398–1401. [Google Scholar] [CrossRef]
- Amuru, S.; Buehrer, R.M. Optimal jamming strategies in digital communications-Impact of modulation. In Proceedings of the 2014 IEEE Global Communications Conference, Austin, TX, USA, 8–12 December 2014; pp. 1619–1624. [Google Scholar]
- Amuru, S.; Buehrer, R.M. Optimal Jamming Against Digital Modulation. IEEE Trans. Inf. Forensics Secur. 2015, 10, 2212–2224. [Google Scholar] [CrossRef]
- Chen, S.S.; Donoho, D.L.; Saunders, M.A. Atomic Decomposition by Basis Pursuit. SIAM J. Sci. Comput. 1998, 20, 33–61. [Google Scholar] [CrossRef]
- Yu, Z.; Hoyos, S.; Sadler, B.M. Mixed-signal parallel compressed sensing and reception for cognitive radio. In Proceedings of the 2008 IEEE International Conference on Acoustics, Speech and Signal Processing, Las Vegas, NV, USA, 31 March–4 April 2008; pp. 3861–3864. [Google Scholar]
- Feng, P.; Bresler, Y. Spectrum-blind minimum-rate sampling and reconstruction of multiband signals. In Proceedings of the 1996 IEEE International Conference on Acoustics, Speech, and Signal Processing Conference Proceedings, Atlanta, GA, USA, 9 May 1996; Volume 3, pp. 1688–1691. [Google Scholar]
- Møller, M.F. A scaled conjugate gradient algorithm for fast supervised learning. Neural Netw. 1993, 6, 525–533. [Google Scholar] [CrossRef]
- Lee, S.H.; Kim, K.Y.; Shin, Y. Effective Feature Selection Method for Deep Learning-Based Automatic Modulation Classification Scheme Using Higher-Order Statistics. Appl. Sci. 2020, 10, 588. [Google Scholar] [CrossRef]
- Zhang, R.; Yin, Z.; Wu, Z.; Zhou, S. A Novel Automatic Modulation Classification Method Using Attention Mechanism and Hybrid Parallel Neural Network. Appl. Sci. 2021, 11, 1327. [Google Scholar] [CrossRef]
- Shi, W.; Liu, D.; Cheng, X.; Li, Y.; Zhao, Y. Particle Swarm Optimization-Based Deep Neural Network for Digital Modulation Recognition. IEEE Access 2019, 7, 104591–104600. [Google Scholar] [CrossRef]
- Hu, S.; Pei, Y.; Liang, P.P.; Liang, Y.C. Deep neural network for robust modulation classification under uncertain noise conditions. IEEE Trans. Veh. Technol. 2019, 69, 564–577. [Google Scholar] [CrossRef]
- Nawaz, T.; Marcenaro, L.; Regazzoni, C.S. Defense against stealthy jamming attacks in wide-band radios: A physical layer approach. In Proceedings of the 2017 IEEE Global Conference on Signal and Information Processing (GlobalSIP), Montreal, QC, Canada, 14–16 November 2017; pp. 497–501. [Google Scholar] [CrossRef]
Disclaimer/Publisher’s Note: The statements, opinions and data contained in all publications are solely those of the individual author(s) and contributor(s) and not of MDPI and/or the editor(s). MDPI and/or the editor(s) disclaim responsibility for any injury to people or property resulting from any ideas, methods, instructions or products referred to in the content. |
© 2023 by the authors. Licensee MDPI, Basel, Switzerland. This article is an open access article distributed under the terms and conditions of the Creative Commons Attribution (CC BY) license (https://creativecommons.org/licenses/by/4.0/).