1. Introduction
Smart grids are crucial for efficiently distributing electricity to a growing consumer base in the future. Ensuring an uninterrupted power supply is essential for consumers’ daily activities. The development and implementation of smart grid technologies play a vital role in meeting the increasing demands for reliable and efficient electricity distribution. Due to the surge in the electricity demand by the consumers and a lack of power generation, the power supply rate does not satisfy the demand of the consumers. A power plant is an industrial facility for electric power generation [
1]. The power plant comprises single or multiple generators and a rotor that converts mechanical energy into electric energy. Most of the power plants across the world use fossil fuels, such as coal, natural gas, and oil, for electricity generation. Other power plants use nuclear power and renewable natural energy sources, like solar energy, wind energy, tidal energy, and hydroelectric energy. Nowadays, the planning of a power system is affected by the economic, technical, and environmental loss. The usage of a multi-criteria analysis in power plant planning has attracted the attention of a number of researchers for a long time [
2].
A number of research studies have been conducted for detailed study to find the optimal design and size of a power plant. The increase in environmental awareness regarding the installation of a power plant has resulted in the usage of multi-criteria analysis for planning purposes. Since the successful installation of power plants is a long-term process, it takes many years to construct power plants, such as nuclear, thermal, wind, and hydroelectric power plants. Hence, prior planning is required for power plant installation. Power plants have different efficiencies, greenhouse gas emission rates, and operational characteristics [
3,
4]. To find the optimal power plant, the issues related to power plants must be analyzed. Hence, the analysis is performed on different aspects, such as low cost, low emission, high amount of power generation, and high availability of the resources. It describes the issues of the power plants belonging to renewable and non-renewable energy sources. Energy can be generated by using non-renewable and renewable resources. Based on these resources, the energy generated by the corresponding power plant is classified as renewable or non-renewable energy. Power plants such as nuclear and thermal power plants generate energy that belongs to non-renewable energy, and other power plants, such as wind, solar, hydro, biomass, and geothermal, produce energy that belongs to renewable energy. The optimal power plant is found based on these issues [
5].
This comparative study of renewable energy sources provides a comprehensive analysis of solar, wind, hydroelectric, geothermal, and biomass energy. Solar energy, harnessed through photovoltaic panels or concentrated solar power systems, stands out for its abundance and versatility. Despite being a clean and sustainable source with no greenhouse gas emissions during operation, solar energy’s intermittent nature necessitates energy storage solutions for a consistent power supply. Wind energy, converting wind kinetic energy into electricity through turbines, is a mature technology with high potential for large-scale generation. Clean and variable, it requires suitable locations and backup power systems due to its dependency on wind speed. Hydroelectric power, generated from flowing or falling water, offers stability but raises concerns about significant environmental and social impacts in large-scale projects. Geothermal energy, tapping into Earth’s interior heat, provides reliable and continuous power with a small environmental footprint, albeit being limited to specific regions. Biomass energy, derived from organic matter, is versatile for heating, power generation, and biofuels but requires responsible sourcing to avoid competition with food production and careful emissions management.
In a comparative study, crucial factors such as resource availability, scalability, technological maturity, cost-effectiveness, environmental impacts, and policy support must be considered to determine the optimal mix of resources for sustainable energy generation in specific geographic, economic, and social contexts. Some key points that can be considered for detailed study and types of energy sources are shown in
Figure 1.
This research makes a significant contribution by addressing the critical need for accurate prediction and optimal utilization of power plants in the context of growing electricity demand and evolving smart grids. Through the development of an issue-based power plant dataset and the application of multiple criteria decision making (MCDM) with self-organizing maps (SOM), this study offers a comprehensive framework for assessing the performance of various sustainable energy systems. By prioritizing criteria such as low gas emissions, installation and maintenance costs, high power generation, and resource availability, this research provides valuable insights to guide the selection and planning of power plants, emphasizing the importance of renewable energy sources for achieving sustainable and environmentally friendly electricity generation.
2. Literature Survey
The superiority of the suggested approach was validated using the Unified Electric Power System (UEPS) of Russia. The authors [
6] analyzed multiple aspects for evaluating the energy alternatives. The multi-criteria decision-making methods were classified into two types, namely, the analytic hierarchy process (AHP) and the analytic network process (ANP). In the AHP method, the problem was constructed as a hierarchy. The experts input information and decision makers were considered for the pair-wise comparison. Among the alternatives, the optimal alternative was chosen based on rank. In the ANP methodology, the complexities of various problems were handled using the unidirectional relationship characteristics. The exploitation of the multi-criteria decision analysis (MCDA) technique was considered an optimal methodology for the rank alternative renewable energy resources, technologies, and projects. The analysis of various methodologies in the MCDM methods proved that the AHP method was optimal among all the MCDM methods [
6,
7].
Akash et al. [
8] suggested the AHP method for comparing various electricity power production options in Jordan. Systems such as nuclear, solar, wind, hydropower, and fossil fuel power plants were used for electricity power production. The analysis results showed that solar, wind, and hydropower were the optimal choices for electricity generation, whereas nuclear electricity and fossil fuel electric power were considered the worst options for generating electricity power. Hefny et al. [
9] proposed an efficient fuzzy analytic network process (ANP) model for generating electrical power in Egypt. Instead of using triangular numbers, Gaussian fuzzy numbers were used. The suggested model prevented the case of zero weights. From the analysis, it was found that the decision makers in nuclear power stations had to perform necessary steps for increasing the electricity demand by 25% in Egypt. Further, the solar power stations had to be constructed to cover 5% of the generated electricity.
Moravej and Afshar [
10] proposed a multi-criteria decision-making (MCDM) approach for selecting the optimal microgrid planning options. Multiple plans were generated using conventional and renewable energy resources. Attributes such as profit from injecting power into the grid at peak load, cost of energy (COE), total emissions, capital costs, and energy not served were taken into consideration. The importance of these criteria was analyzed using the analytical hierarchy process (AHP) method. Different plans were prioritized using the multi-objective optimization by ratio analysis (MOORA) method. The plans were ranked based on the uncertainty in demand [
11,
12] The loading conditions, such as high, medium, and low, were considered. The uncertainty in the future load was obtained by ranking the plans. The plan that produced the optimal performance under various loading conditions was considered as the optimal plan.
Üçtuğ et al. [
13] conducted a multi-criteria decision-making analysis to compare power source technologies for automotive use. Their study focused on assessing various technologies for automobiles, providing insights into cleaner and sustainable energy solutions [
7]. The research aimed to guide informed decisions regarding the selection of power sources for automotive applications.
Jayalakshmi et al. [
14] proposed a center for the ideal arrangement of distributed generation (DG) sources on a spiral feeder for a sudden decrease with distinguishing sorts of concentrated burden circulations. In uniformly disseminated loads, expanding centrally appropriated loads and equally progressively dispersed burdens is achieved utilizing the Newton–Raphson technique, and furthermore, simulation strategies were incorporated for an optimal placement distributed generation (DG) source on the outspread system. Sarma et al. proposed a study on renewable energy sources (RES) that work in parallel with conventional power plants, and these play a lead role in narrowing the difference between supply and demand [
15,
16]. They analyzed the natural advantage of each resource and its reliability to the utility. Due to nonlinear loads, power quality issues arose at the point of common coupling.
Mardani et al. [
17] scrutinized sustainable and renewable energy techniques, including AHP, fuzzy-AHP, ANP, TOPSIS, fuzzy-TOPSIS, PROMETHEE, integrated methods, and others. Their analysis affirmed the efficacy of multiple criteria decision making (MCDM) in optimizing energy system choices, planning, management, and economic considerations, highlighting its superiority in achieving optimal results across various parameters. Mitchell (Mitchell) proposed a goal-programming and analytical hierarchy process (AHP) multi-criteria decision-making method for selecting the optimal energy portfolio [
18,
19]. The suggested method determined the weights of the energy sources in the goal programming model. Based on the real-world numbers, the government policies and the amount of energy obtained from the renewable energy sources were increased. The increased price reductions and technology improvements bridged the gap between renewable energy and traditional energy sources. The weights of the AHP were used for estimating the optimal solution for job creation, cost, and CO
2 emissions.
Vadivelu et al. [
20] introduced the firefly algorithm for the optimal assignment of flexible AC transmission systems (FACTS) in a unified system, specifically focusing on generator assignment using the algorithm. Validation on IEEE 30 bus and 72 bus real-time systems showcased the effectiveness of the FACTS device placement compared to the literature results [
21,
22]. This paper employs genetic algorithm (GA) and artificial bee colony (ABC) algorithms for optimizing powder metallurgy-based Al-SiC MMCs production process parameters.
Gangadhara Rao et al. [
23] presented aluminum-based metal matrix composites (MMC) as being valuable in aircraft, automotive, and armaments due to a high Young’s modulus, specific strength, and improved wear properties. They addressed a single-objective problem using GA and ABC, treating it as a maximization challenge. Both optimization algorithms for the input process parameters [
24].
Li, Lin, and Ding [
25] developed a novel MCDM-based hybrid model that integrates rough sets and VIKOR to assess the performance of sustainable energy systems. The study focuses on evaluating and enhancing sustainable energy systems through a comprehensive and innovative approach, providing valuable insights for decision making [
26,
27].
Benkouider et al. [
28] conducted a multi-criteria analysis to evaluate the performance of sustainable energy systems, focusing on aspects of sustainability. The study, published in
Sustainable Cities and Society, provides insights into the holistic assessment of sustainable energy systems, contributing valuable information for decision making in the field. The summary of some related work is as shown in
Table 1.
3. Materials and Methods
3.1. Multi-Criteria Decision Making (MCDM)
Multi-criteria decision making (MCDM) is a field of study that involves evaluating and selecting the best alternative among a set of options based on multiple criteria or objectives. Various mathematical equations and techniques can be used in MCDM. Here are some commonly used equations [
29]:
- a.
Weighted sum model: The weighted sum model is a simple and intuitive approach where each criterion is assigned a weight, and the alternatives are evaluated based on the weighted sum of their scores on each criterion. The overall score for alternative i is calculated as follows:
where Score(i, j) is the score of alternative i on criterion j, and Weight(j) is the weight assigned to criterion j.
- b.
Weighted product model: The weighted product model is another approach that considers the multiplication of scores instead of the sum. The overall score for alternative i is calculated as follows:
where Score(i, j) is the score of alternative i on criterion j, and Weight(j) is the weight assigned to criterion j.
- c.
Analytic hierarchy process (AHP): AHP is a widely used MCDM method that allows decision makers to systematically compare and prioritize criteria and alternatives. It involves constructing pairwise comparison matrices and calculating priority weights for criteria and alternatives. The AHP process involves several equations, including the following:
Calculation of pairwise comparison matrices: Decision makers assign relative weights to criteria or alternatives based on their preference or judgment.
Calculation of priority weights: Eigenvalue calculation, normalization, and consistency ratio calculations are used to obtain the priority weights for criteria and alternatives.
Order of preference by similarity to ideal solution (TOPSIS): TOPSIS is a method that measures the proximity of alternatives to an ideal solution based on multiple criteria. It involves calculating the distance between each alternative and the ideal solution and the negative ideal solution. The TOPSIS method uses the following equations:
Normalization of decision matrix: Each criterion is normalized by dividing each element by the square root of the sum of squares of all elements in the column.
Calculation of weighted normalized decision matrix: Each criterion is multiplied by its corresponding weight.
Calculation of ideal and negative ideal solutions: The ideal solution is obtained by selecting the maximum value for each criterion, and the negative ideal solution is obtained by selecting the minimum value for each criterion.
Calculation of ideal and negative ideal solutions: The ideal solution is determined by selecting the maximum values for each criterion, and the negative ideal solution is obtained by selecting the minimum values for each criterion.
Calculation of the distance between each alternative and the ideal solutions: The distance between the alternatives and ideal solutions is computed using Euclidean or other distance measures, assessing the proximity of each alternative to both the ideal and negative ideal solutions [
29,
30]. The flowchart for MCDM is shown in
Figure 2 and explained as follows.
Performance Evaluation: Assess the performance of each alternative with respect to each criterion. This involves gathering data or information about the alternatives and evaluating their performance against the defined criteria. Various quantitative or qualitative methods can be used for performance evaluation, depending on the nature of the criteria and available data.
Aggregation and Ranking: Aggregate the individual performance assessments to obtain an overall evaluation for each alternative. This can be achieved through different aggregation methods, such as weighted sum, weighted product, or outranking methods like the technique for order of preference by similarity to the ideal solution (TOPSIS) or the preference ranking organization method for enrichment evaluation (PROMETHEE). The result is a ranking or scoring of the alternatives based on their overall performance [
31].
Sensitivity Analysis: Perform a sensitivity analysis to assess the robustness of the results and investigate the impact of changes in the criteria weights or performance evaluations. This analysis helps in understanding the stability of the rankings and the influence of different factors on the final decision.
Decision Making and Interpretation: The final step involves interpreting the results and making a decision based on the MCDA model outcomes. Decision makers can consider the rankings, sensitivity analysis, and other relevant factors to select the preferred alternative or to gain insights for further analysis or improvement.
MCDA provides a structured and transparent approach to decision making, allowing decision makers to consider multiple criteria and their interdependencies when evaluating alternatives. It is a valuable tool in complex decision problems where there are trade-offs and conflicting objectives. In the context of power plant selection, an MCDA model can help identify the optimal power plant based on the desired criteria, contributing to informed and effective decision making.
3.2. Self-Organizing Maps (SOM)
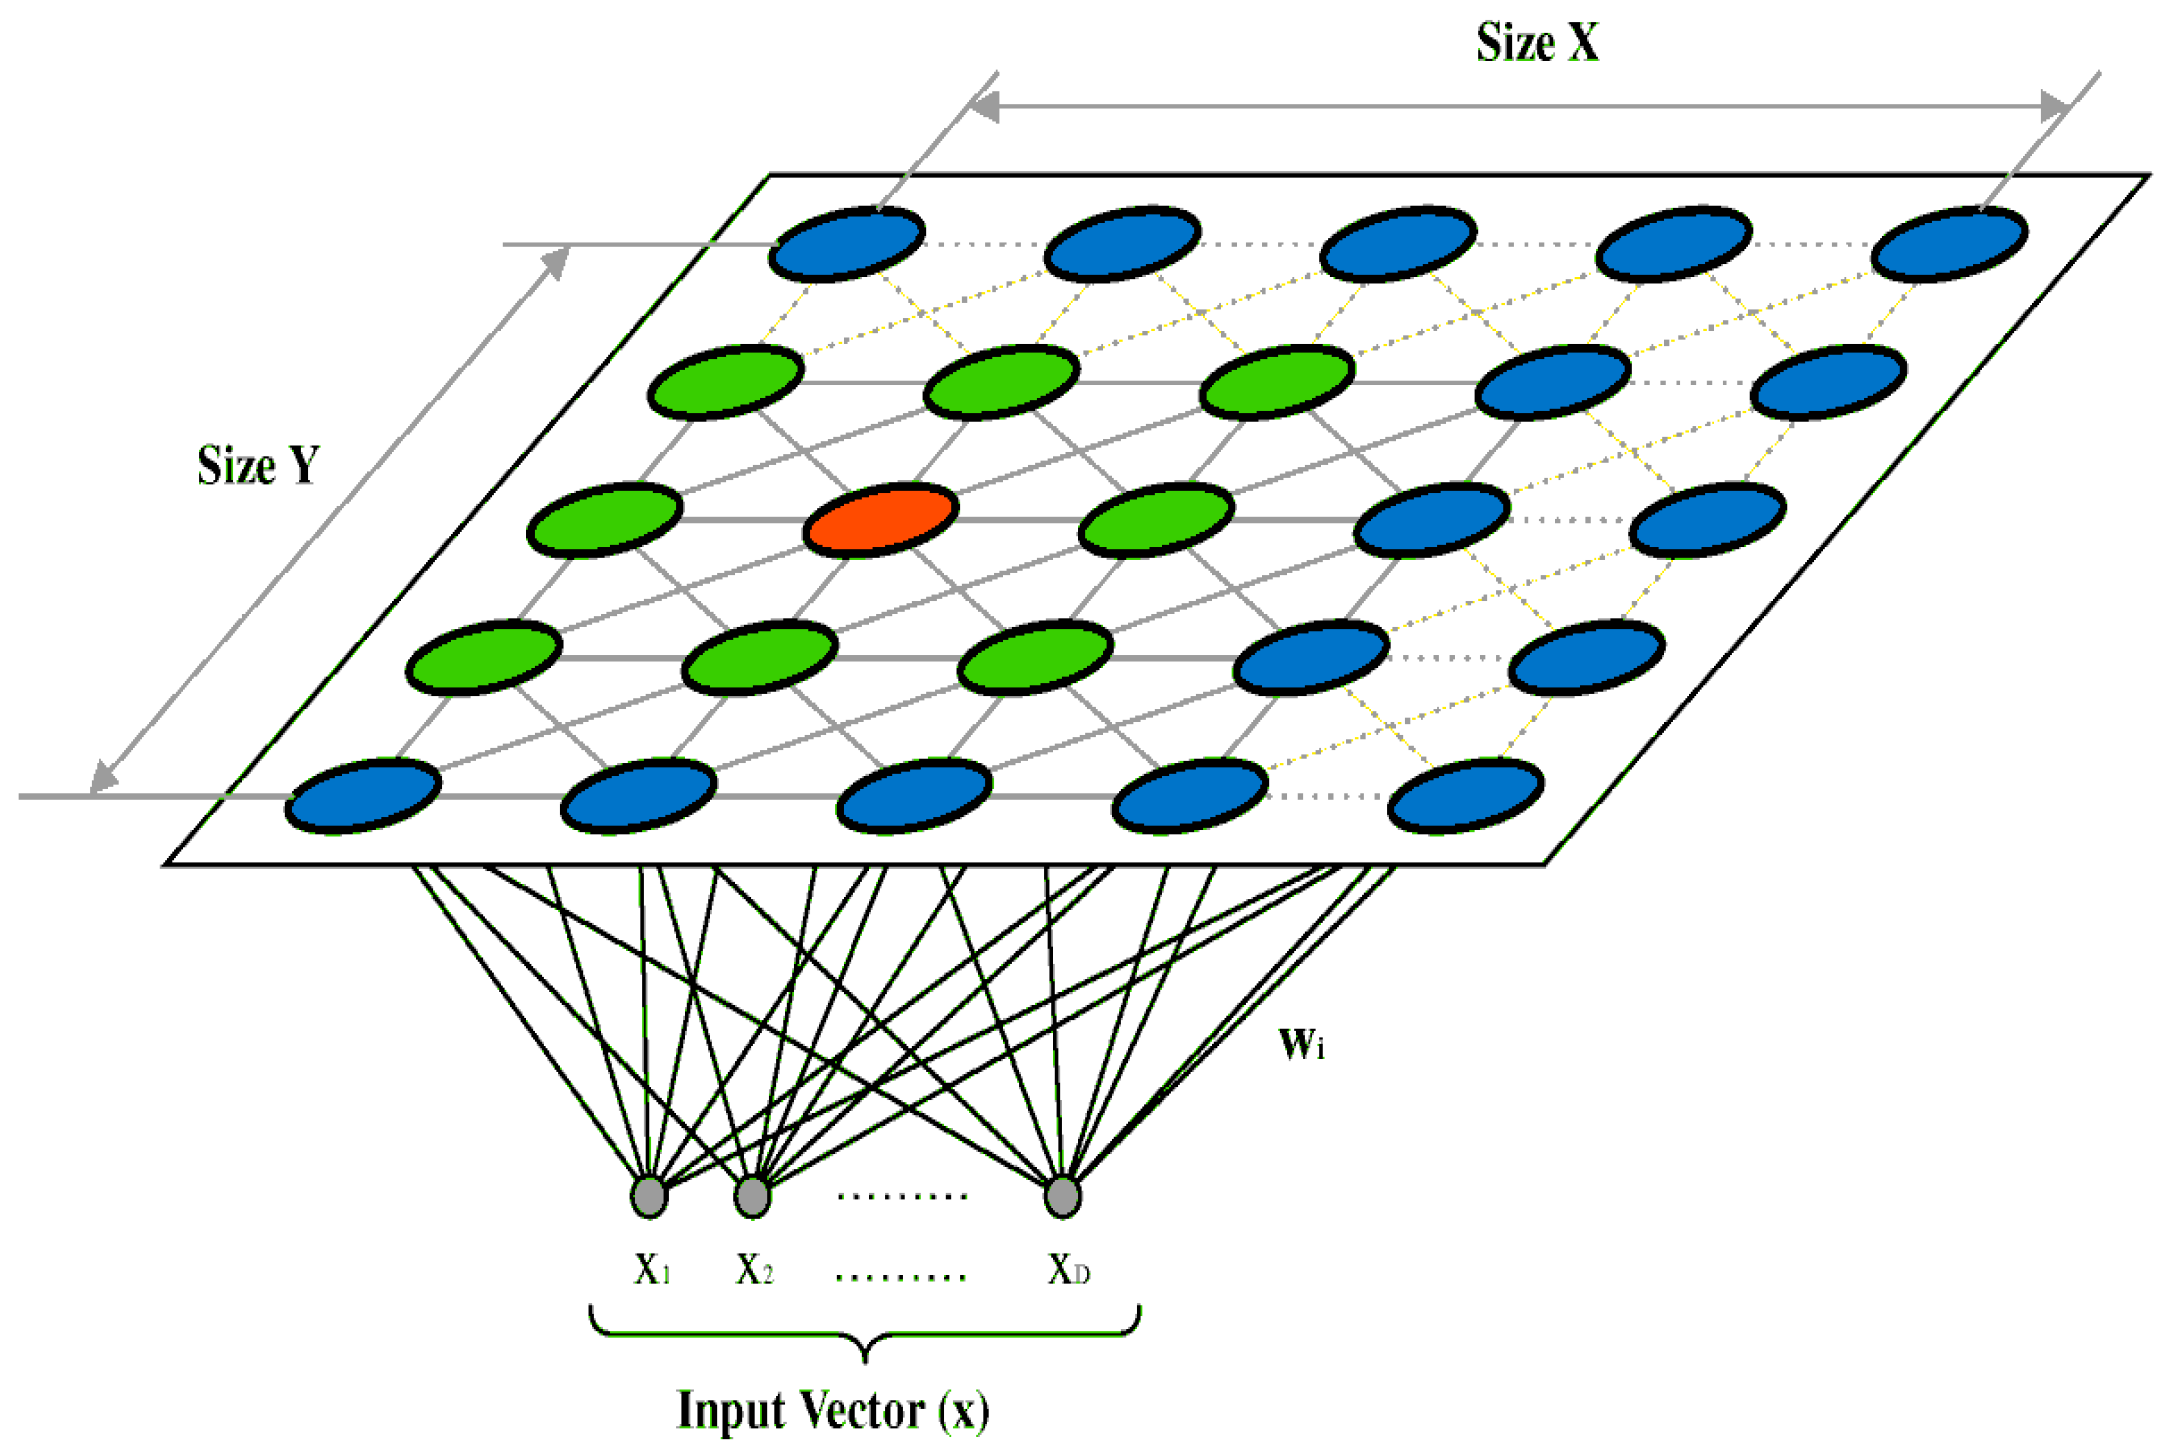
The key idea behind SOM is to map high-dimensional input data onto a lower-dimensional grid or lattice, typically two-dimensional. The lattice consists of nodes or neurons, each representing a weight vector of the same dimension as the input data. During the training process, the SOM adjusts the weights of the neurons to represent the input data in a topological manner [
32]. Self-organizing maps (SOMs) are a type of artificial neural network that can be used for unsupervised learning and data visualization. They are commonly used for clustering and dimensionality reduction tasks. The mathematical equations involved in SOMs include the following:
Euclidean distance: The most commonly used distance measure in SOMs is the Euclidean distance between two vectors. For two vectors x and y, the Euclidean distance is given by the following:
Gaussian neighborhood function: The neighborhood function determines the influence of a neuron on its neighboring neurons during the learning process. The Gaussian neighborhood function is commonly used and is defined as follows:
where x is the winning neuron, t is a neighboring neuron, and sigma(t) is the neighborhood radius at time t.
Learning rate decay: The learning rate determines the magnitude of weight updates during the training process. Typically, the learning rate is initialized with a larger value and gradually decreases over time. A common approach is to use a decaying learning rate according to the following equation:
where alpha(t) is the learning rate at time t, alpha_0 is the initial learning rate, and tau is a time constant.
SOM weight update rule: The weight update rule is used to adjust the weights of neurons in the SOM based on the input data and the neighborhood function. The weight update equation is typically given by the following:
where Delta W_i(t) is the weight update for neuron i at time t, alpha(t) is the learning rate at time t, h(x, t) is the neighborhood function, X is the input vector, and W_i(t) is the weight vector of neuron i at time t.
The SOM training process consists of the following steps:
Initialization: Initialize the weight vectors of the neurons with random values. Each neuron’s weight vector represents a point in the input data space.
Competition: For each input data point, find the best-matching unit (BMU), which is the neuron with the weight vector closest to the input data point. The similarity between the input data and the weight vectors is typically measured using the Euclidean distance [
21].
Cooperation: Update the weights of the BMU and its neighboring neurons to move them closer to the input data point. This step encourages nearby neurons to become more similar to each other, leading to the formation of clusters or groups in the lattice. The training process for SOM is shown in
Figure 3.
Neighborhood Function: Define a neighborhood function that determines the extent of influence of the BMU on its neighboring neurons. Typically, the influence decreases as the distance from the BMU increases.
Iteration: Repeat the competition, cooperation, and neighborhood function steps for multiple iterations or until convergence. This allows the SOM to gradually organize the input data into distinct clusters and develop a topological representation of the data, as shown in
Figure 3.
One of the main advantages of SOM is its ability to preserve the topological structure and relationships of the input data. The resulting two-dimensional lattice can be visualized to gain insights into the underlying patterns, clusters, or similarities in the data. The visualization often takes the form of a “map”, where different colors or markers represent different clusters or groups [
22].
SOMs have found applications in various fields, including data analysis, pattern recognition, image processing, and feature extraction. In the context of power plant assessment, SOMs can be used to analyze and visualize the relationships and patterns among different power plants based on their performance criteria. This can assist in understanding similarities, identifying groups of power plants with similar characteristics, and supporting decision-making processes [
23]. The Architecture for self-organizing maps is shown in
Figure 4.
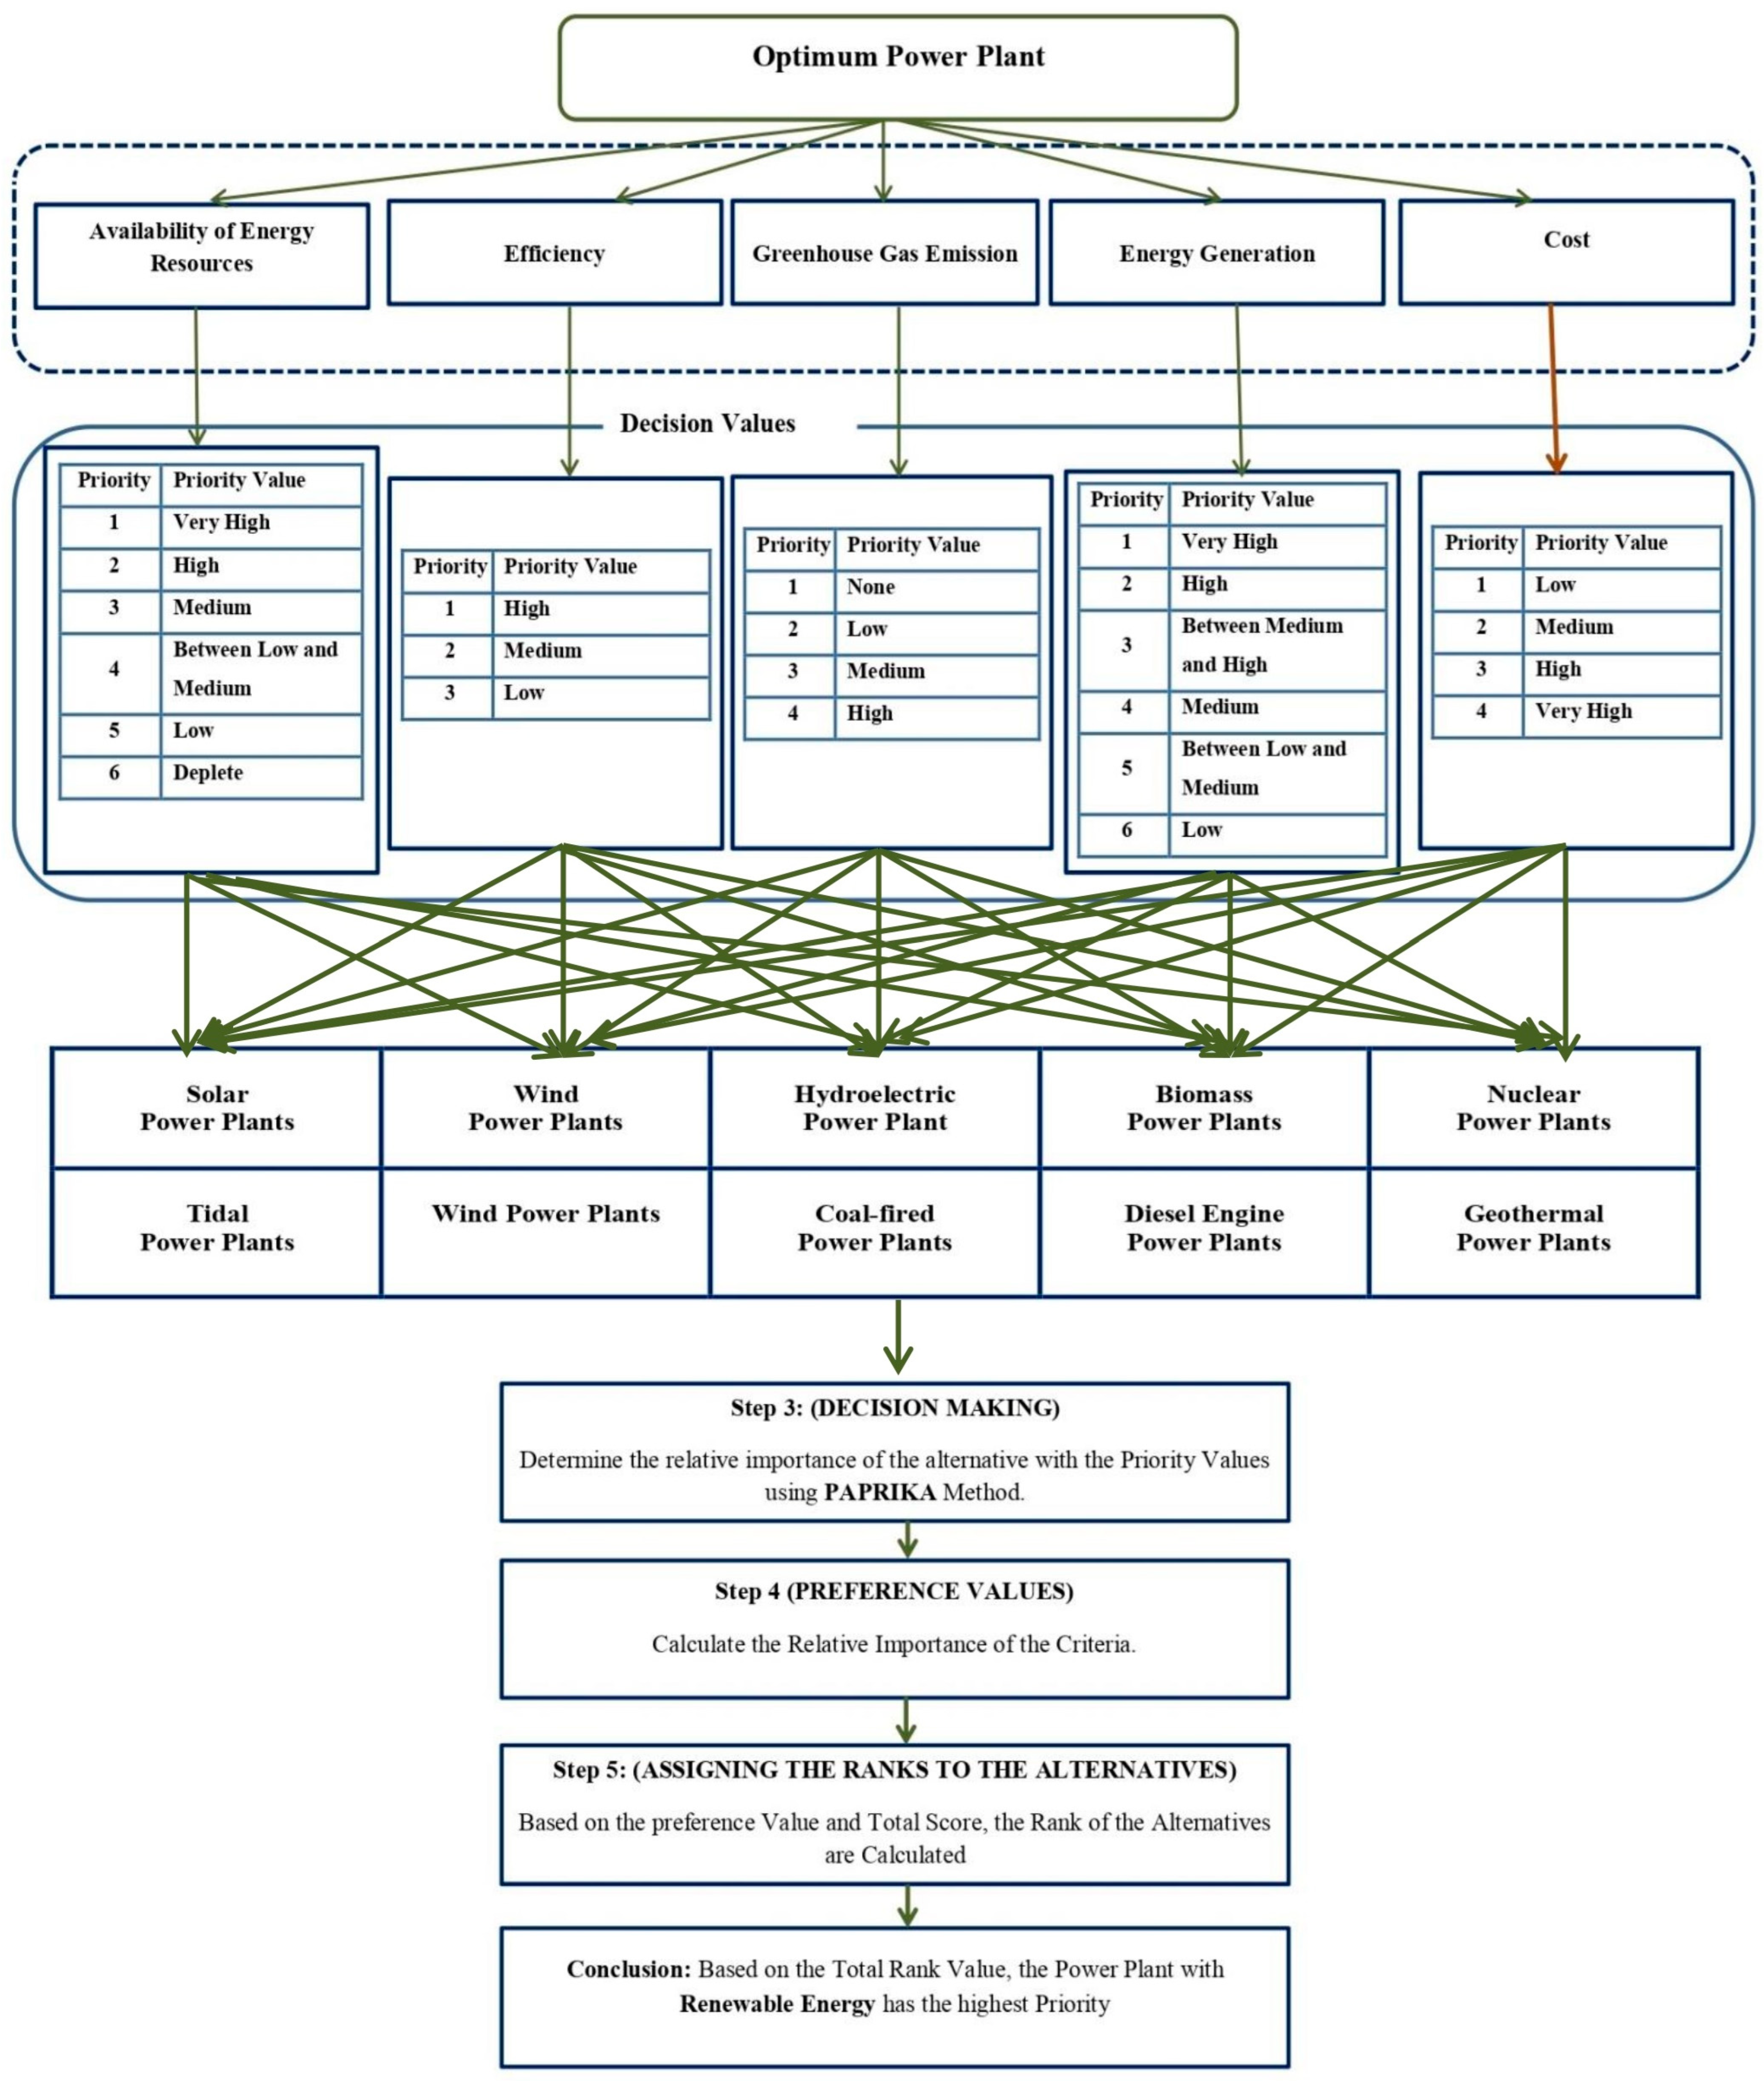
MCDA with an SOM is proposed to find an optimum power plant using the issues of power plants.
Figure 5 shows the proposed framework. Five criteria are used to find optimal power plants, including availability of energy resources, efficiency, greenhouse gas emissions, energy generation, and cost, in order to achieve sustainable power generation. The categorical values assigned to every power plant on certain criteria are very high, high, between high and medium, medium, between medium and low, and low [
24,
27]. The power plant prediction depends on the results obtained from multiple-criteria decision analysis (MCDA).
Table 2 lists the five criteria and their descriptions to analyze the power plants [
34].
4. Results and Discussion
Decision-making software 1000minds (DMS)
https://www.1000minds.com/ is used to help individuals and organizations rank, sort, and select from the alternatives in the software. Based on the decision maker’s preferences, the method of conjoint analysis called potentially all pairwise rankings of all possible alternatives (PAPRIKA) is implemented via software called 1000minds. With this implementation, the point values (‘weights’) that represent the relative importance of the attributes of decision makers are calculated. In addition to that, they are used to rank alternatives and enable the decision makers to prioritize or choose [
26]. The steps to analyze the power plant are listed in
Table 3 as follows:
Step 1: Initialization Criteria
Table 3.
List of criteria’s priority and their priority values.
Table 3.
List of criteria’s priority and their priority values.
| Criteria | Priority | Priority Value |
|---|
| Availability of energy resources | 1 | Very high |
| 2 | High |
| 3 | Medium |
| 4 | Between low and medium |
| 5 | Low |
| 6 | Deplete (very high but energy resources are diminishing over the years) |
| Efficiency | 1 | High |
| 2 | Medium |
| 3 | Low |
| Green house gas emissions | 1 | None |
| 2 | Low |
| 3 | Medium |
| 4 | High |
| Energy generation | 1 | Very high |
| 2 | High |
| 3 | Between medium and high |
| 4 | Medium |
| 5 | Between low and medium |
| 6 | Low |
| Cost | 1 | Low |
| 2 | Medium |
| 3 | High |
| 4 | Very high |
Step 2: List of Alternatives
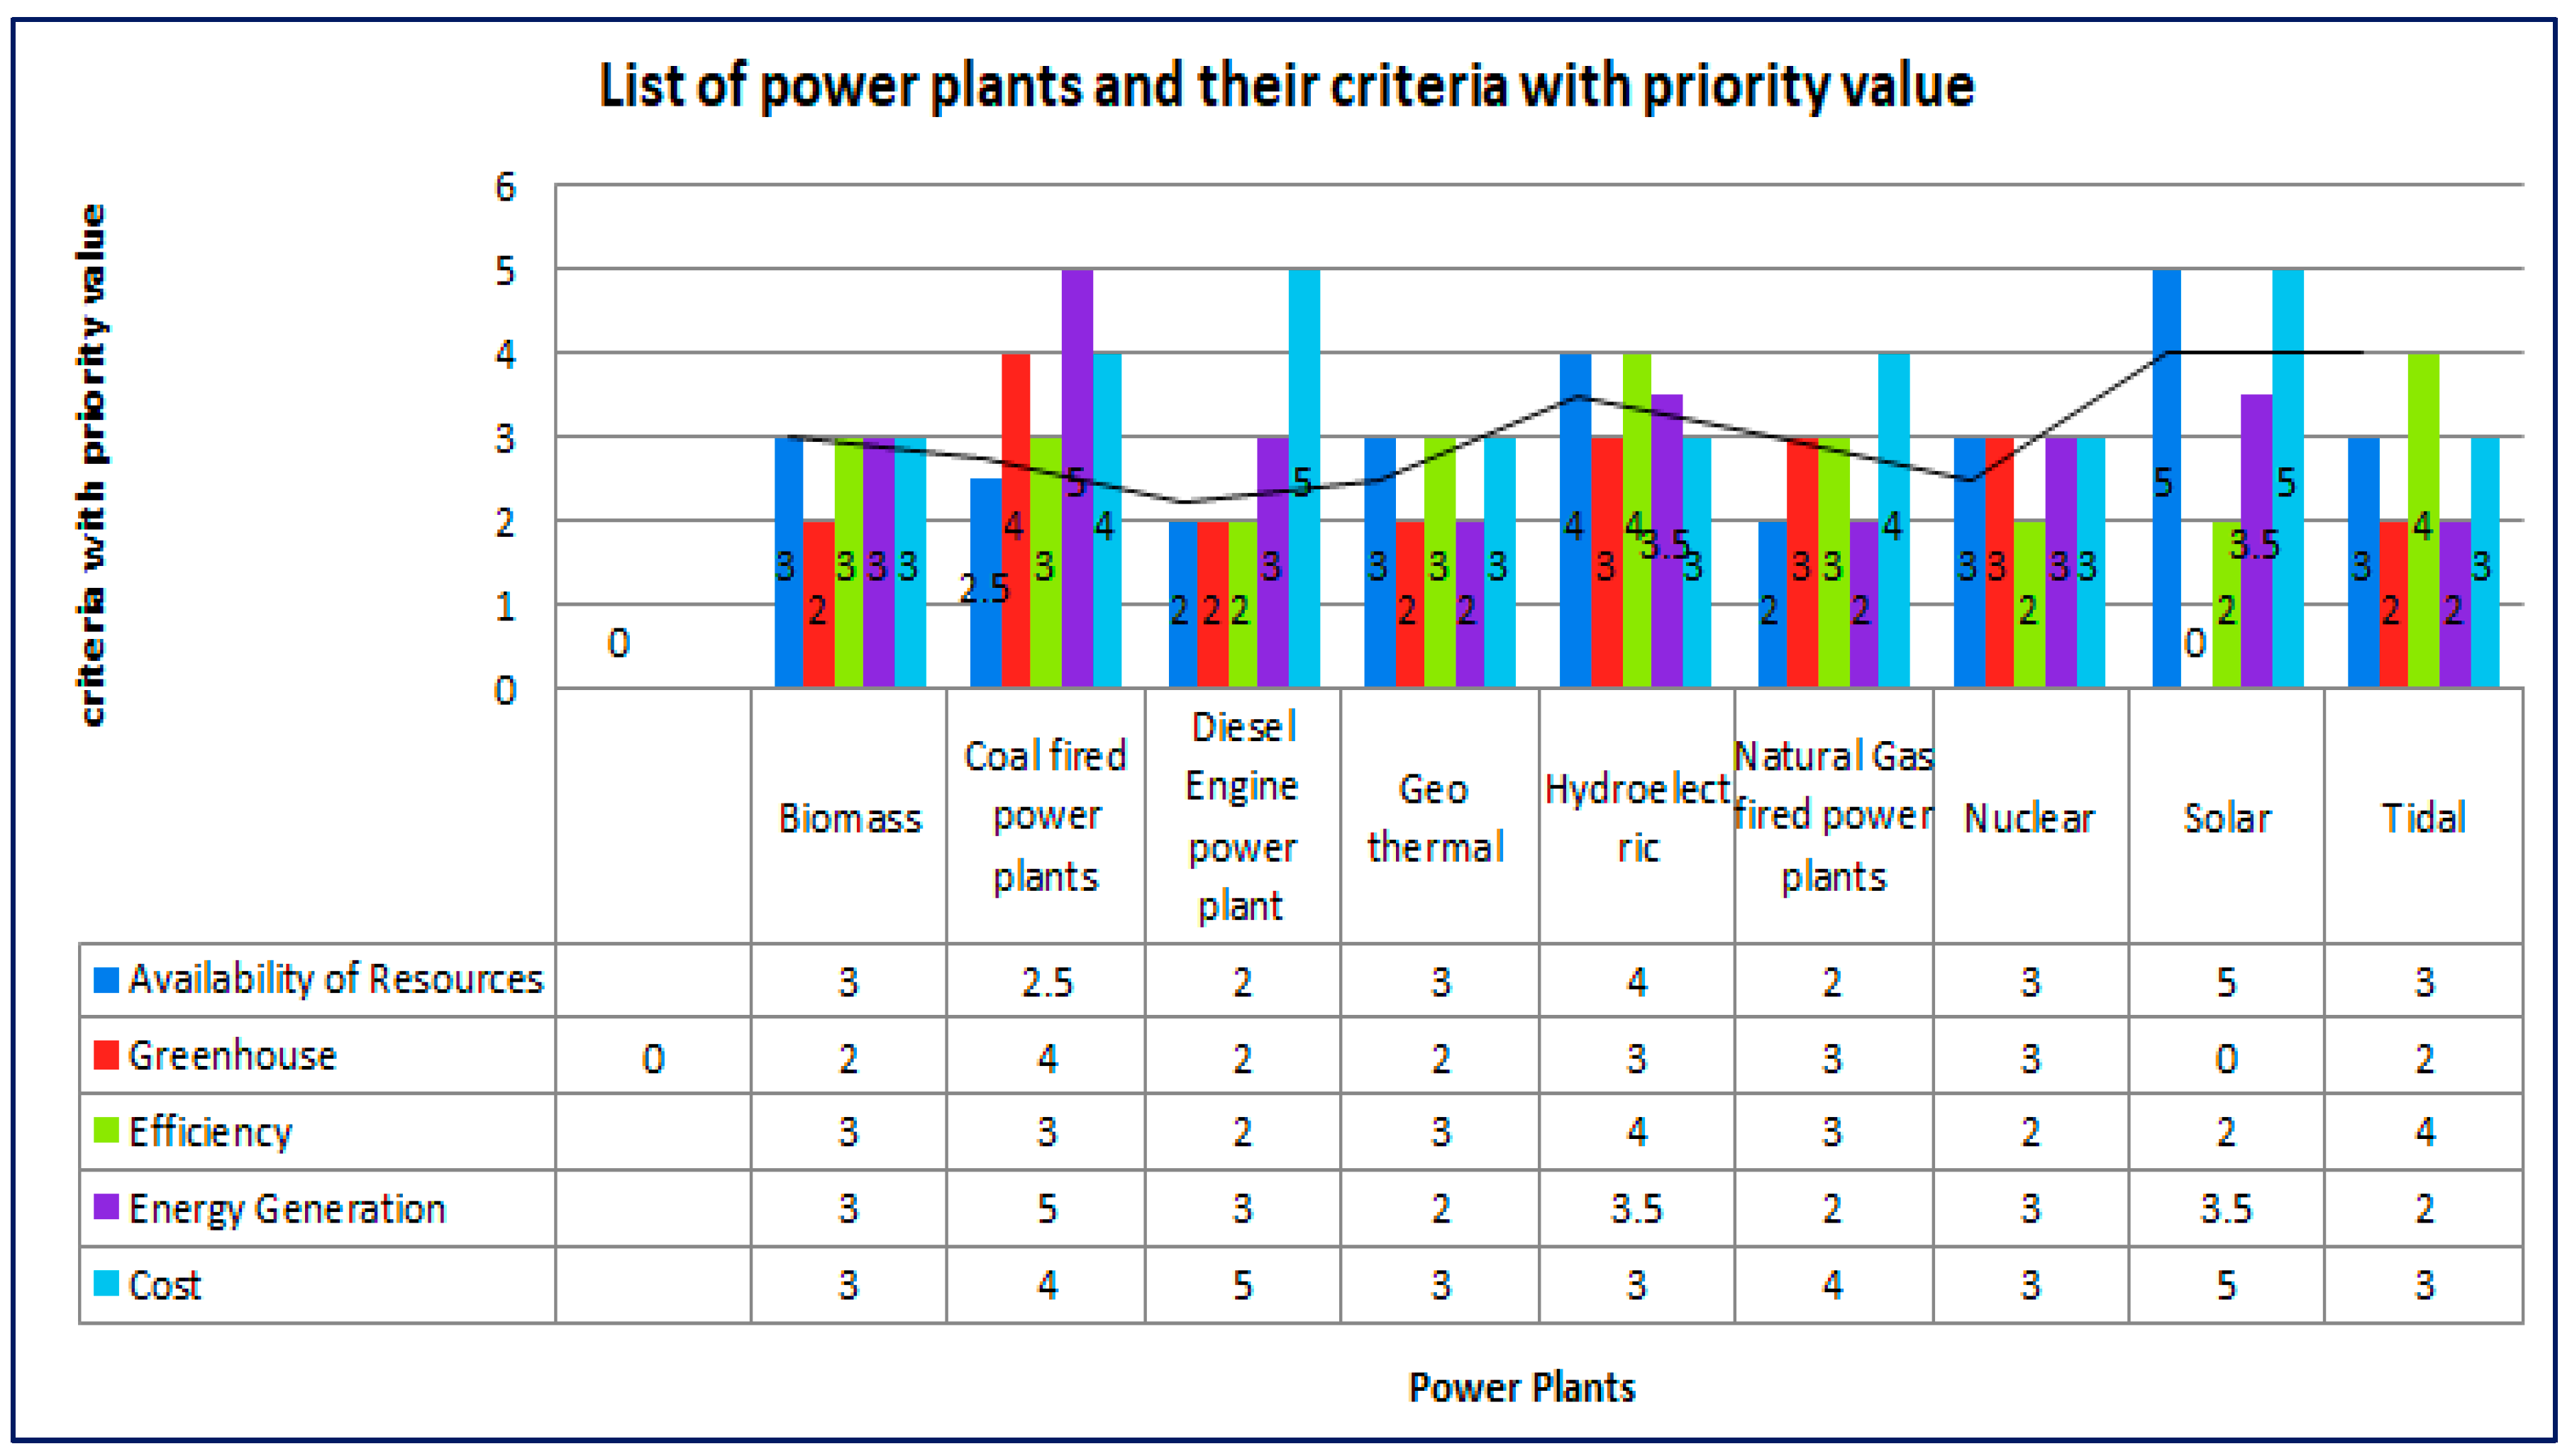
The priority values are assigned to the different number of power plants based on the number of criteria listed in
Table 2 and the characteristics of the power plants. The priority values formed and used as a dataset to find the optimum power plant are shown in
Table 4.
Step 3: Decision Making
Traditionally, the analysis of power plants is based on the assumptions of random guesses of the relative importance (weights) of the criteria and assigning equal importance to all the criteria. However, 1000minds determines the relative importance by using the PAPRIKA method. In this method, the researchers ask a series of simple questions on the basis of two hypothetical alternatives with two criteria at a time. The answers corresponding to the researchers’ questions are used to determine the weights on the criteria. The number of questions depends on the dimensionality of the criteria. There are 90 questions used to determine the relative importance of the alternatives with the criteria for the dataset used in this paper. The preference values and the ranking of alternatives are performed by validating the answers.
Step 4: Preference Values
The weights assigned to the criteria refer to ‘preference values’ that reflect the relative importance to the researchers. These values are alternatively called part-worth utilities (in a conjoint analysis) and points system. The relative importance of the criteria is represented as the weight value (‘High’). The highest and the lowest preference values represent the criterion’s relative importance and level.
Table 5 shows the relative importance of the criteria based on the marginal rate of substitution (ratio of column criterion to row criterion).
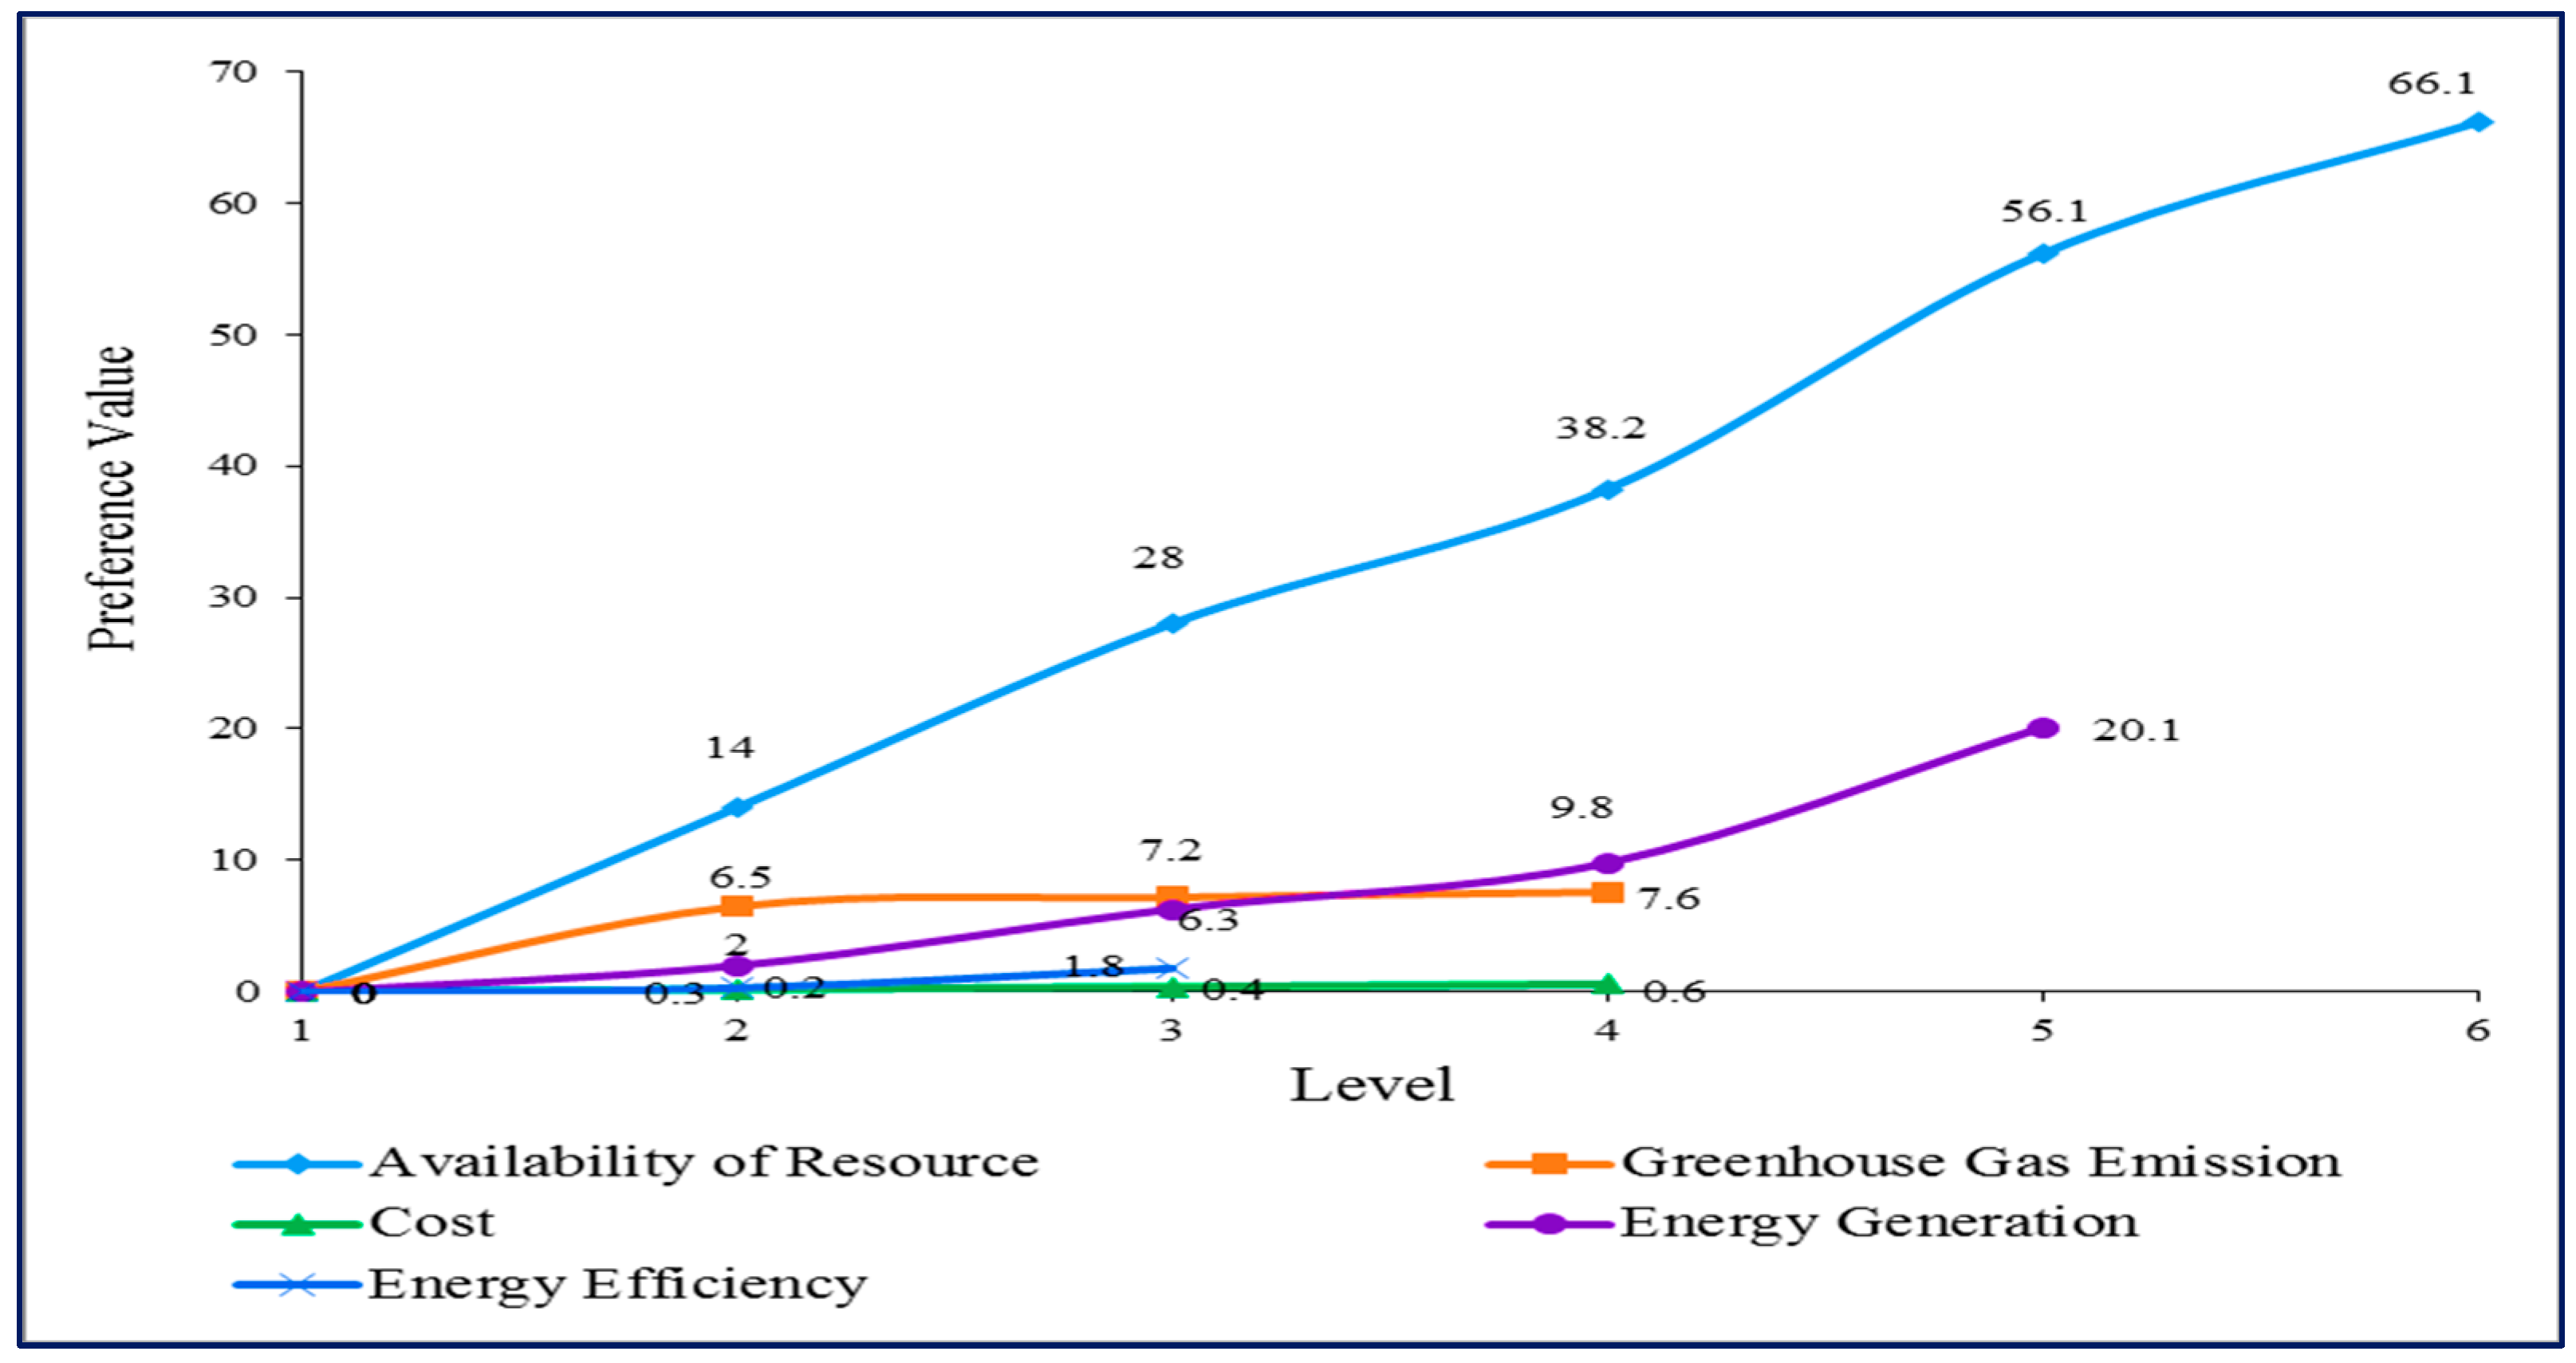
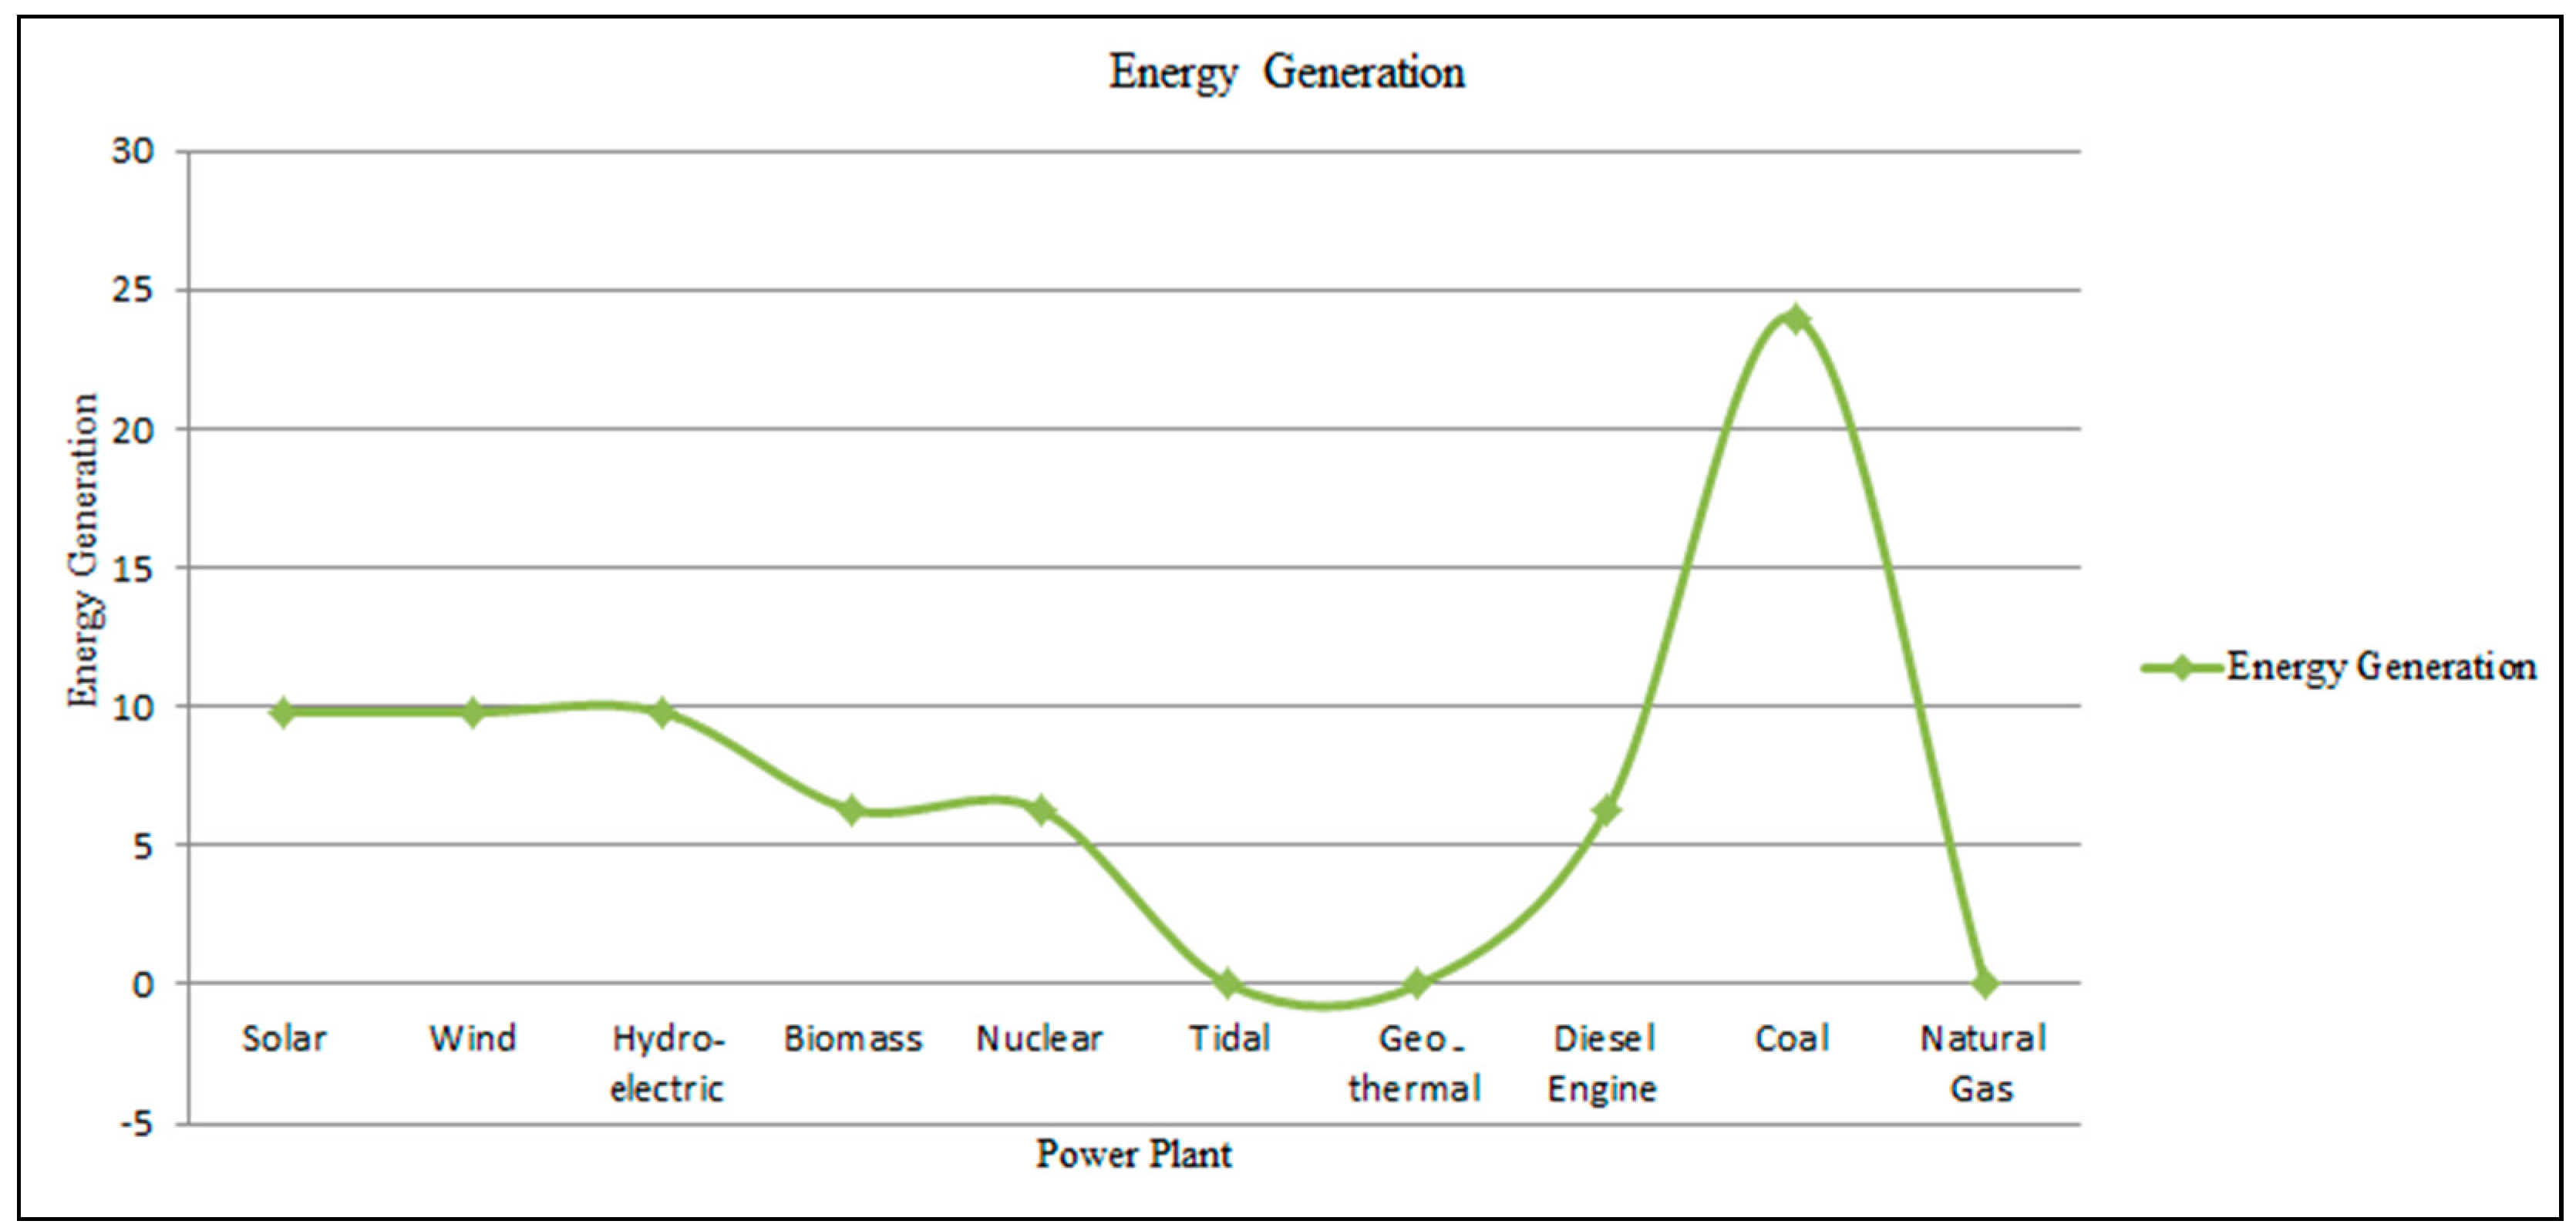
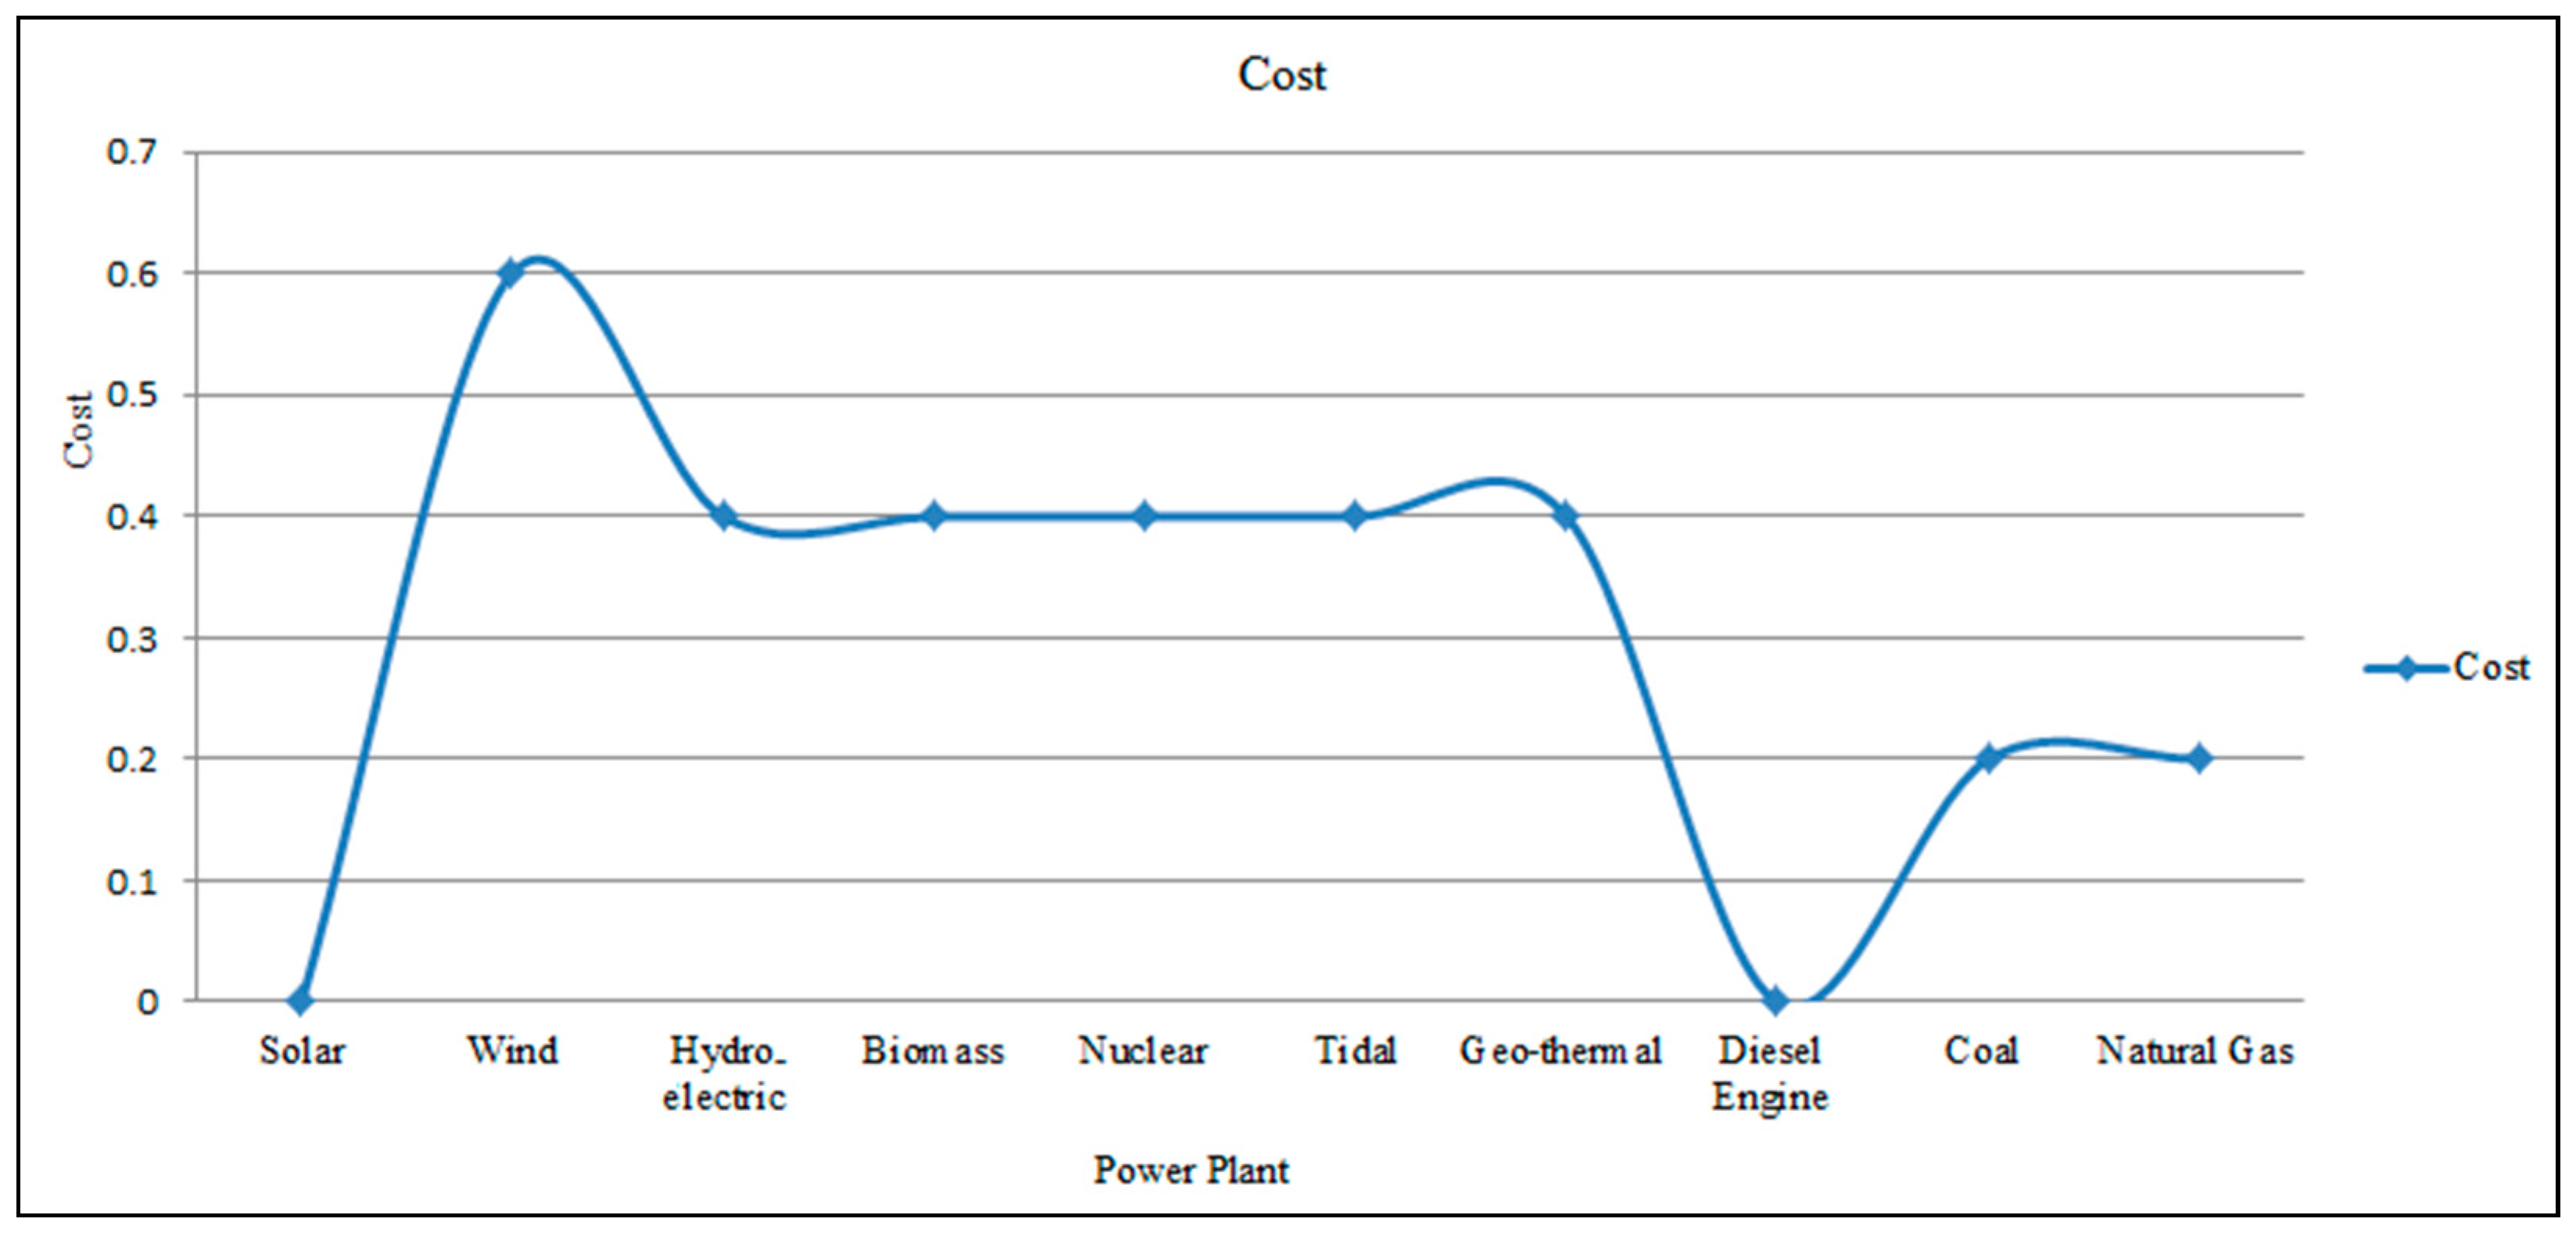
The variations of the criterion value functions over different levels are shown in
Figure 6, while the criterion value functions are shown in
Figure 7. Among these multiple criteria, the availability of resources and the amount of generation has the maximum preference values. The obtained maximum preference value is used to rank the power plant. The relative importance values between the criteria are modified with the normalized values and single scores, as in
Table 6 and citation values in
Table 7Step 5: Assigning of Rank to the Alternatives
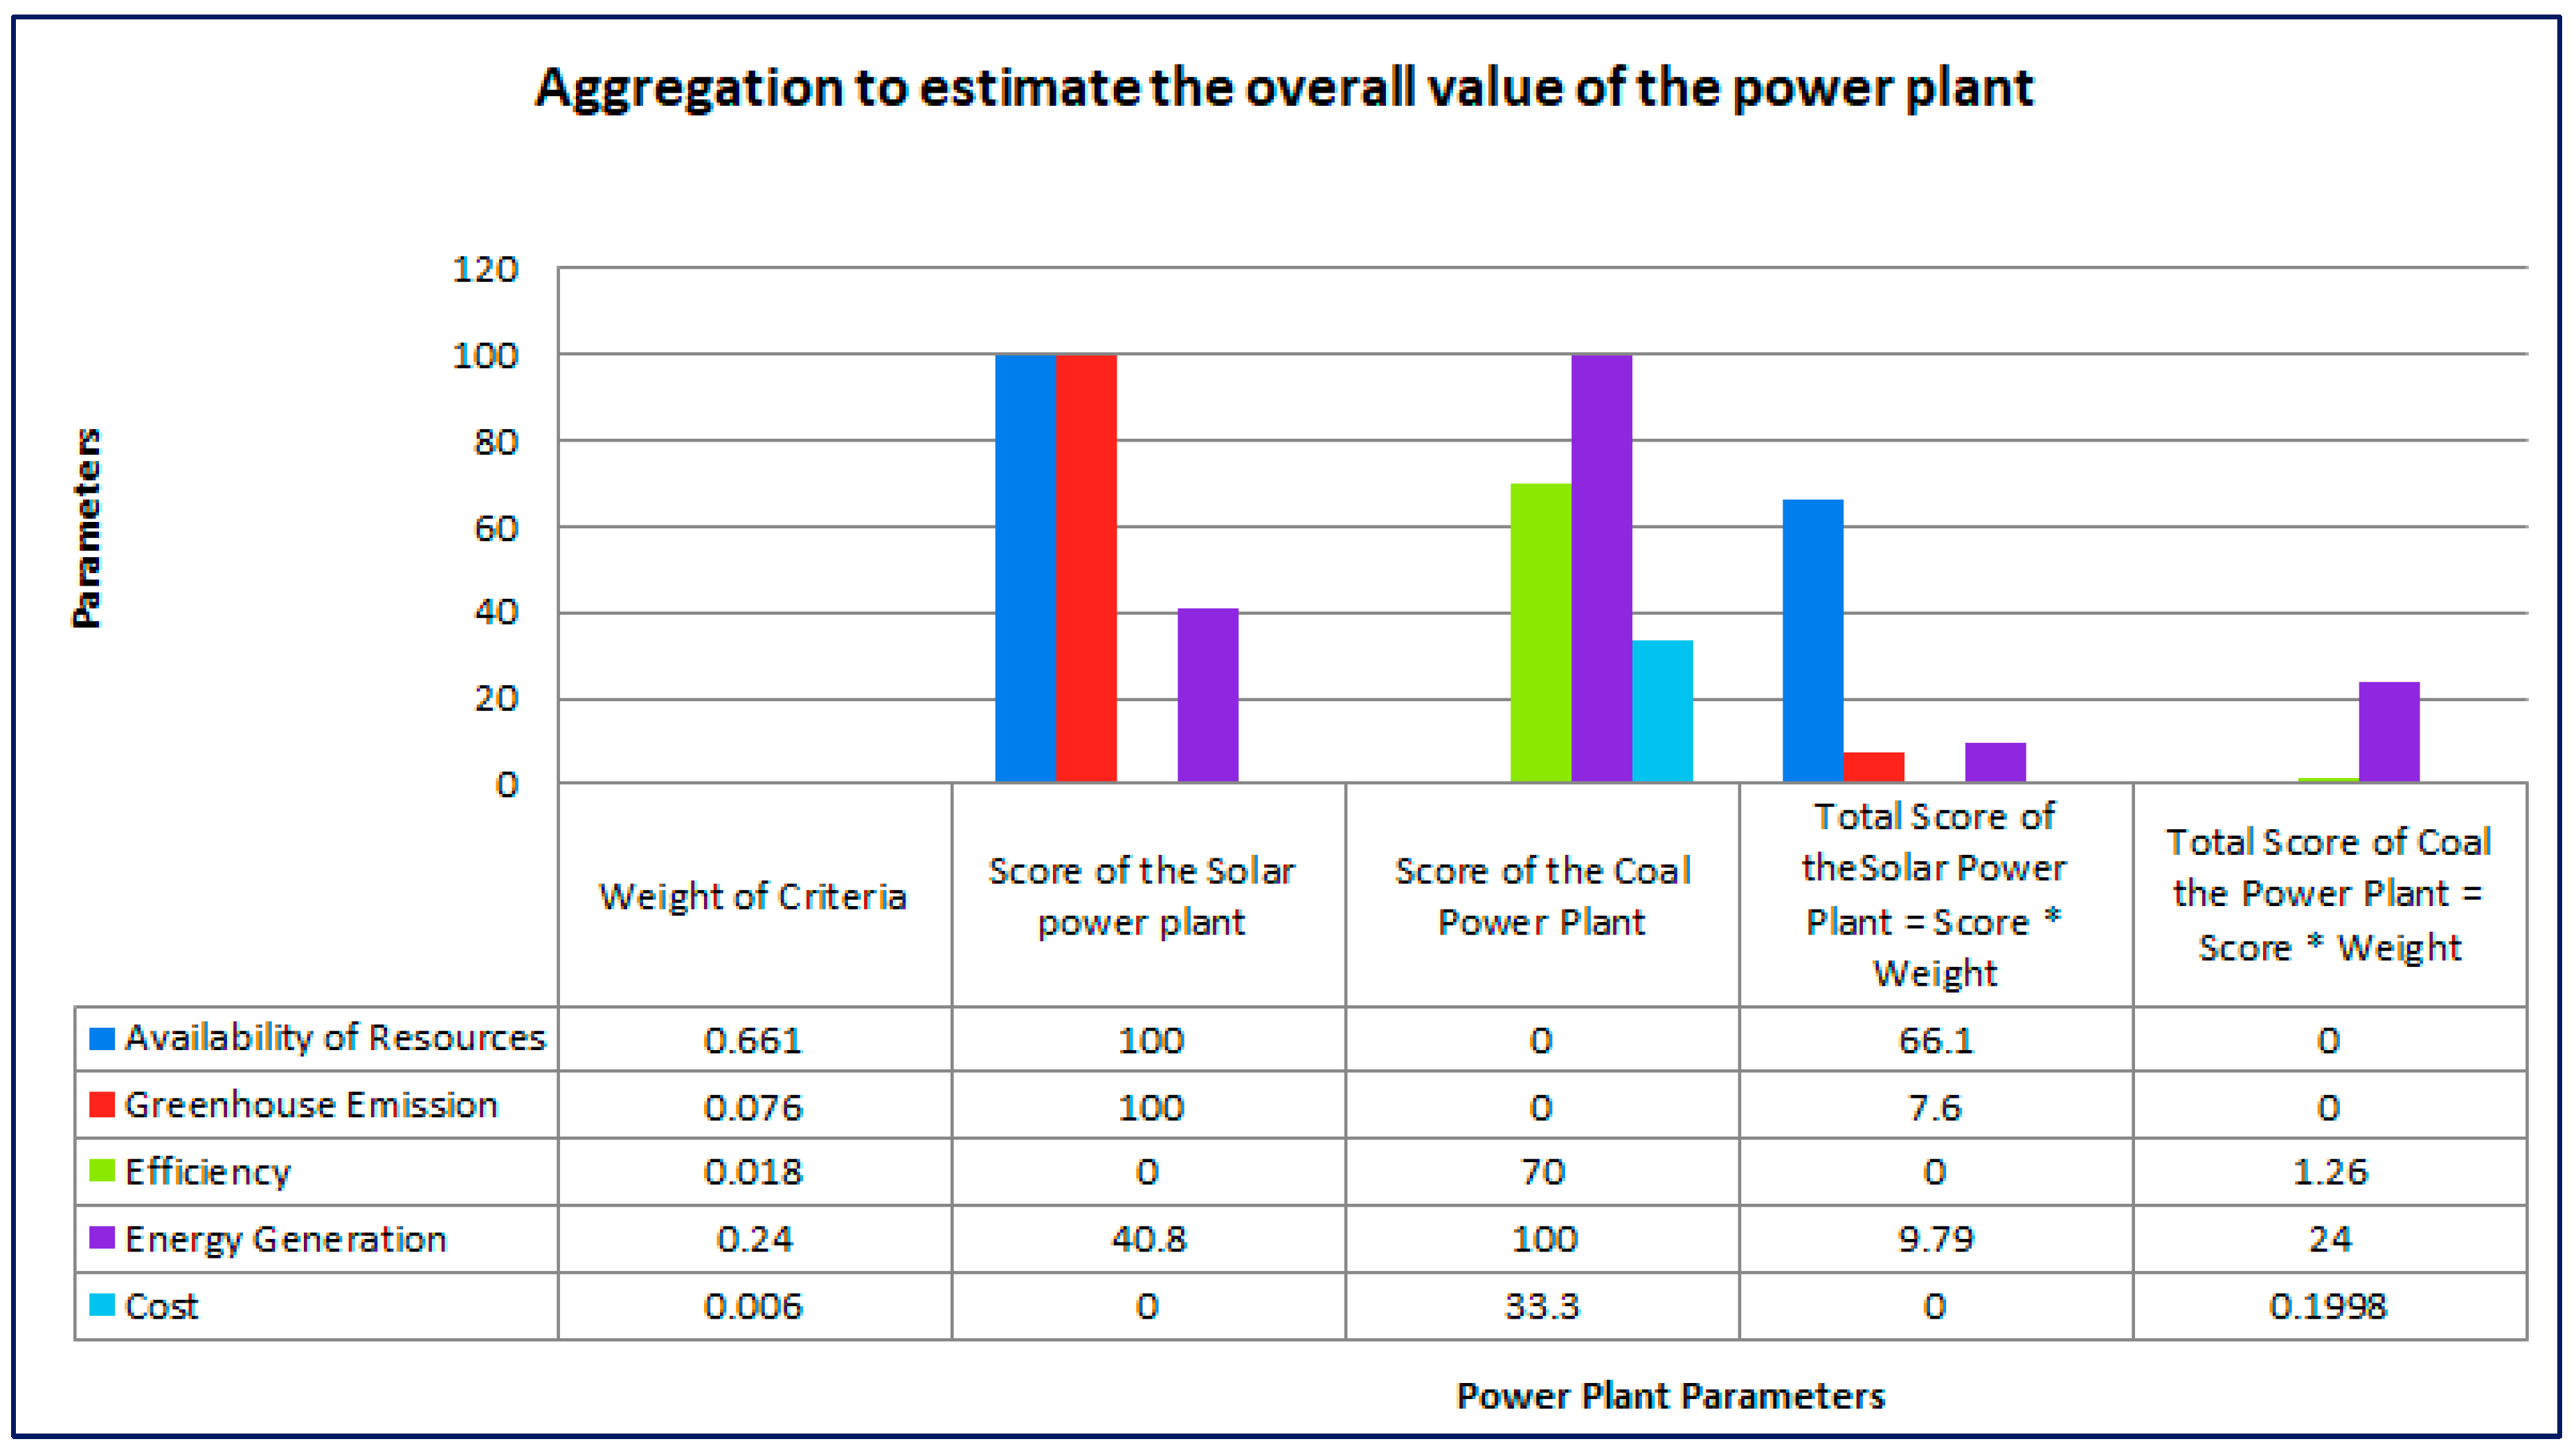
Table 6 explains the methodology of calculating the aggregation of scores for the criteria to estimate the overall value. In this table, the overall value of solar and coal are calculated. Likewise, the overall value of other power plants is calculated. The aggregation of scores across the criteria efficiently visualizes the score of each plant, as shown in
Table 7 and
Figure 8. Based on the preference values from
Table 4, the description of alternatives is necessary to find the best power plant. The 1000minds software assigns the rank to the alternatives based on the total. Also the ranking of power plant is shown in
Table 8 and Energy generation and analysis of different power plants is shown from
Figure 9,
Figure 10,
Figure 11,
Figure 12,
Figure 13,
Figure 14 and
Figure 15.
From
Table 6, it is observed that the results obtained using the MCDA state the following facts: due to the high amount of depleted resources, power plants using non-renewable resources are not considered optimal power plants even though they have high generation [
27,
28,
29,
35]. Based on the rank values, power plants using renewable energies are given the highest priorities. Hence, power plants using the renewable energy are selected as the optimal power plants and are considered an effective recommendation to meet the electricty demand in future. Also the Ranking of different power plants based on parameters obtained from
Table 6 is shown in
Figure 15.
Use of Self-Organizing Maps (SOMS) with MCDM
This study proposes the utilization of self-organizing maps (SOMs) as a tool for assessing the performance of different energy-efficient sources based on an issue-based dataset. The dataset incorporates factors such as gas emissions, installation cost, maintenance cost, power generation, and resource availability to evaluate the sustainability and viability of various renewable energy sources. SOMs, a type of artificial neural network, are employed to analyze the multidimensional dataset and provide a visual representation of the relationships and patterns within the data [
28]. The SOM analysis enables the identification of clusters or groups of similar energy-efficient sources, allowing for a comparative evaluation of their performance [
3,
30]. By visualizing the dataset on an SOM grid, patterns and similarities among the energy sources can be observed. This approach facilitates the identification of optimal energy-efficient sources that demonstrate a favorable performance across multiple criteria. The findings of the study indicate that renewable energy sources, such as solar, wind, hydro, and geothermal power, generally exhibit superior performance in terms of low emissions, favorable installation and maintenance costs, high power generation, and resource availability. These sources are identified as the most suitable options for sustainable and efficient power generation [
31]. The SOM analysis further reveals the potential for hybrid power plants, combining multiple renewable resources to maximize power generation efficiency. Overall, the utilization of SOMs as a decision support tool provides valuable insights into the performance assessment of different energy-efficient sources. By considering multiple criteria and visualizing the dataset, this approach aids in identifying the optimal energy sources for sustainable power generation. This study contributes to the field of renewable energy planning and assists in making informed decisions for achieving long-term viability and sustainability in the power sector.
This study justifies the use of self-organizing maps (SOMs) for evaluating energy-efficient sources through the collected dataset, employing multiple-criteria decision making (MCDM). By integrating factors like emissions, costs, and power generation, SOMs visually identify clusters of similar sources. The approach aids in informed decision making for sustainable power generation, emphasizing renewable sources’ superior performance.
As per the proposed study, employing MCDM with self-organizing maps (SOMs) to integrate sustainable energy systems achieves an overall top ranking (1) by identifying solar as optimal and empowers stakeholders for judicious decisions, as shown in
Table 9.
However, potential bias in subjective judgments poses a limitation. In contrast, the AHP and ANP approaches for the Unified Electric Power System (UEPS) of Russia [
1,
13] ranks third due to their sensitivity to input data changes. The MCDM for microgrid planning [
5] using AHP and MOORA ranks fourth, lacking explicit consideration of uncertainties. AHP, used for comparing power production options in Jordan [
10], and fuzzy ANP, used for power generation in Egypt [
13], rank fifth and second, respectively, highlighting limitations related to subjective judgments and uncertainties. As the objective of the research is to identify the rank, so the validation is performed with different research based on the literature.
5. Sustainable Energy Generation and Societal Benefits
The use of sustainable energy generation is indeed crucial for continuous growth and long-term viability. Power plants play a significant role in this regard, and finding the optimal power plant solution is important. In order to determine the most suitable power plant, a dataset based on various issues related to power generation is prepared. To make informed decisions, a multiple-criteria decision analysis (MCDA) is proposed as a methodology [
32]. The factors considered in the MCDA include low gas emissions, installation cost, low maintenance cost, high power generation, and high resource availability. These factors are essential for sustainable power generation and contribute to the overall efficiency and suitability of a power plant. After conducting the analysis based on the issue-based dataset, it is determined that power plants utilizing renewable resources are the optimal choice for sustainable power generation. Renewable energy sources, such as solar, wind, hydro, or geothermal power, have lower gas emissions, provide high power generation potential, and often have abundant resources available. To achieve efficient power generation, a hybrid power plant model can be employed that combines multiple renewable energy sources [
33,
34]. By integrating different renewable resources, such as solar panels, wind turbines, and hydroelectric generators, a hybrid power plant can maximize power generation while reducing reliance on a single energy source. This approach enhances sustainability and minimizes environmental impact. By adopting sustainable energy generation practices and utilizing renewable resources, society can ensure a long-term, viable, and sustainable power generation model. This not only meets the growing electricity demands but also helps to mitigate climate change and preserve the environment for future generations.
6. Conclusions and Future Scope
Addressing the imperative for sustainable energy generation is pivotal for societal advancement, where power plants play a central role. A dataset structured around key issues is formulated to ascertain the optimal power plant, utilizing a multiple-criteria decision analysis (MCDA) as the decision-making framework. Taking into account factors such as low gas emissions, installation and maintenance costs, substantial power generation, and abundant resource availability, MCDA was deployed to discern the most efficient and suitable power plant for long-term viability and sustainability. The analysis reveals that power plants harnessing renewable resources emerge as optimal, indicating their potential as hybrid power plants for future electricity demands. This approach offers benefits in terms of environmental friendliness, cost-effectiveness, and resource availability. The examination identifies solar energy as the pre-eminent MCDM criterion, securing the top position with a score of 83.4%, credited to its abundant resource availability, substantial energy generation, minimal greenhouse gas emissions, and commendable efficiency. Closely following are wind and hydroelectric power, with scores of 75.3% and 74.5%, respectively. Biomass and nuclear power plants secure the fourth and fifth positions, while tidal and geothermal alternatives rank sixth and seventh. Diesel engines, coal, and natural gas assume inferior positions due to heightened emissions and diminished efficiency, with coal registering the lowest score. The analysis underscores the supremacy of renewable energy sources, especially solar and wind, in meeting sustainability objectives, considering factors such as cost, resource availability, and environmental impact.
Future research can explore advancements in integrating emerging technologies, like artificial intelligence and machine learning, into multiple-criteria decision-making (MCDM) models for enhanced evaluation of sustainable energy systems. Additionally, investigating evolving energy storage solutions and their impact on overall sustainability would contribute to the ongoing evolution of resilient and eco-friendly power infrastructures.
Author Contributions
S.D.: conceptualization, methodology, formal analysis, validation, writing—original draft. S.C.: formal analysis, validation. N.C.G.: methodology, formal analysis, investigation, data curation, writing—review and editing. U.G.: conceptualization, resources, visualization, supervision. G.F.: supervision, investigation, writing—review and editing. All authors have read and agreed to the published version of the manuscript.
Funding
This research received no external funding.
Data Availability Statement
Data will be made available on reasonable request.
Acknowledgments
The authors gratefully acknowledge the management of GITAM Deemed to be University, Andhra Pradesh, India, for providing the facilities to carry out the research work.
Conflicts of Interest
The authors declare no conflicts of interest.
References
- Abu-Taha, R.; Daim, T. Multi-criteria applications in renewable energy analysis: A literature review. Green Energy Technol. 2013, 60, 17–30. [Google Scholar] [CrossRef]
- Wang, C.-N.; Nguyen, V.T.; Thai, H.T.N.; Duong, D.H. Multi-Criteria Decision Making (MCDM) Approaches for Solar Power Plant Location Selection in Viet Nam. Energies 2018, 11, 1504. [Google Scholar] [CrossRef]
- Sueyoshi, T.; Yuan, Y.; Goto, M. A literature study for DEA applied to energy and environment. Energy Econ. 2017, 62, 104–124. [Google Scholar] [CrossRef]
- Moravej, Z.; Afshar, H. Optimal planning of microgrid using multi criteria decision analysis. Int. J. Multidiscip. Sci. Eng. 2014, 5, 1–6. [Google Scholar]
- Voropai, N.I.; Ivanova, E.Y. Multi-criteria decision analysis techniques in electric power system expansion planning. Int. J. Electr. Power Energy Syst. 2002, 24, 71–78. [Google Scholar] [CrossRef]
- Chen, Y.; Wang, Y. Performance assessment of sustainable energy systems using an integrated MCDM approach based on entropy weight and TOPSIS. Energy Convers. Manag. 2014, 85, 120–134. [Google Scholar]
- Siksnelyte-Butkiene, I.; Zavadskas, E.K.; Streimikiene, D. Multi-Criteria Decision-Making (MCDM) for the Assessment of Renewable Energy Technologies in a Household: A Review. Energies 2020, 13, 1164. [Google Scholar] [CrossRef]
- Akash, B.A.; Mamlook, R.; Mohsen, M.S. Multi-criteria selection of electric power plants using analytical hierarchy process. Electr. Power Syst. Res. 1999, 52, 29–35. [Google Scholar] [CrossRef]
- Hefny, H.A.; Elsayed, H.M.; Aly, H.F. Fuzzy multi-criteria decision making model for different scenarios of electrical power generation in Egypt. Egypt. Inform. J. 2013, 14, 125–133. [Google Scholar] [CrossRef]
- Goel, S.; Sharma, R. Performance evaluation of standalone, grid connected and hybrid renewable energy systems for rural application: A comparative review. Renew. Sustain. Energy Rev. 2017, 78, 1378–1389. [Google Scholar] [CrossRef]
- Dobrzanski, L.A.; Wlodarczyk, A.; Adamiak, M. The structure and properties of PM composite materials based on EN AW-2124 aluminum alloy reinforced with the BN or Al2O3 ceramic particles. Mater. Process. Technol. 2005, 162–163, 27–32. [Google Scholar] [CrossRef]
- Lipošćak, M.; Afgan, N.H.; Neven, D.; Carvalho, M. Sustainability assessment of cogeneration sector development in Croatia. Energy 2006, 31, 2276–2284. [Google Scholar] [CrossRef]
- Üçtuğ, G.F.; Kabakcı, N.E.; Bekdikhan, O.B.; Akyürek, B. Multi-criteria decision making-based comparison of power source technologies for utilization in automobiles. J. Clean Energy Technol. 2015, 3, 212–219. [Google Scholar] [CrossRef]
- Jayalakshmi, S.; Balaji, V. Methodical Advances in Power Systems aimed at Best Arrangement of Distributed Generation Sources. Int. J. Appl. Eng. Res. 2016, 11, 2332–2339. [Google Scholar]
- Vashishtha, S.; Ramachandran, M. Multicriteria evaluation of demand side management (DSM) implementation strategies in the Indian power sector. Energy 2006, 31, 2210–2225. [Google Scholar] [CrossRef]
- Ho, W.; Higson, H.E.; Dey, P.K. An integrated multiple criteria decision making approach for resource allocation in higher education. Int. J. Innov. Learn. 2007, 4, 471–486. [Google Scholar] [CrossRef]
- Wang, J.J.; Jing, Y.Y.; Zhang, C.F.; Zhao, J.H. Review on multi-criteria decision analysis aid in sustainable energy decision-making. Renew. Sustain. Energy Rev. 2009, 13, 2263–2278. [Google Scholar] [CrossRef]
- Mardani, A.; Jusoh, A.; MD Nor, K.; Khalifah, Z.; Zakwan, N.; Valipour, A. Multiple criteria decision-making techniques and their applications—A review of the literature from 2000 to 2014. Econ Res.—Ekon. Istraž. 2015, 28, 516–571. [Google Scholar] [CrossRef]
- Dattam, A.; Saha, D.; Ray, A.; Das, P. Anti-islanding selection for grid-connected solar photovoltaic system applications: A MCDM based distance approach. Sol. Energy 2014, 110, 519–532. [Google Scholar] [CrossRef]
- See, K.F.; Coelli, T. An analysis of factors that influence the technical efficiency of Malaysian thermal power plants. Energy Econ. 2012, 34, 677–685. [Google Scholar] [CrossRef]
- Jin, D.; Wang, X.; Zhang, X.; Zhou, L. A comprehensive assessment method for sustainable energy systems based on fuzzy analytic hierarchy process and grey relational analysis. Energy Convers. Manag. 2016, 116, 206–216. [Google Scholar]
- Mugabe, D.; Elbakidze, L.; Zaynutdinova, G. Elasticity of substitution and technical efficiency: Evidence from the US electricity generation. Appl. Econ. 2020, 52, 1789–1805. [Google Scholar] [CrossRef]
- Ferreira, H.L.; Garde, R.; Fulli, G.; Kling, W.; Lopes, J.P. Characterisation of electrical energy storage technologies. Energy 2013, 53, 288–298. [Google Scholar] [CrossRef]
- Gangadhara, R.P.; Gopala, K.A.; Vundavalli, P.R. Parameter optimization of Al-SiC metal matrix composites produced using powder-based process. In Proceedings of the 2015 International Conference on Robotics, Automation, Control and Embedded Systems, Chennai, India, 18–20 February 2015; pp. 18–20. [Google Scholar] [CrossRef]
- Li, D.; Lin, B.; Ding, Y. Performance assessment of sustainable energy systems: A novel MCDM-based hybrid model integrating rough sets and VIKOR. Renew. Sustain. Energy Rev. 2019, 82, 3996–4012. [Google Scholar]
- Hsu, C.W.; Wu, C.W. Performance evaluation of sustainable energy development in Taiwan using the hybrid MCDM model. Energy Policy 2015, 86, 25–37. [Google Scholar]
- Zhang, X.; Zhang, L.; Wang, L.; Zhang, Y. Performance assessment of sustainable energy systems using a combined MCDM method based on improved VIKOR and AHP: A case study in China. Energy Convers. Manag. 2017, 139, 273–289. [Google Scholar]
- Kachapulula-Mudenda, P.; Makashini, L.; Malama, A.; Abanda, H. Review of Renewable Energy Technologies in Zambian Households: Capacities and Barriers Affecting Successful Deployment. Buildings 2018, 8, 77. [Google Scholar] [CrossRef]
- Moradi, S.Y.H.; Noorollahi, Y.; Rosso, D. Multi-criteria decision support system for wind farm site selection and sensitivity analysis: Case study of Alborz Province, Iran. Energy Strategy Rev. 2020, 29, 100478. [Google Scholar] [CrossRef]
- Ramezanzade, M.; Karimi, H.; Almutairi, K.; Xuan, H.A.; Saebi, J.; Mostafaeipour, A.; Techato, K. Implementing MCDM Techniques for Ranking Renewable Energy Projects under Fuzzy Environment: A Case Study. Sustainability 2021, 13, 12858. [Google Scholar] [CrossRef]
- Bohra, S.S.; Anvari-Moghaddam, A.; Blaabjerg, F.; Mohammadi, I.B. Multi-criteria planning of microgrids for rural electrification. J. Smart Environ. Green Comput. 2021, 1, 120–134. [Google Scholar] [CrossRef]
- Giri, N.C.; Das, S.; Pant, D.; Bhadoria, V.S.; Mishra, D.P.; Mahalik, G.; Mrabet, R. Access to Solar Energy for Livelihood Security in Odisha, India. Lect. Notes Electr. Eng. 2023, 1023, 235–242. [Google Scholar] [CrossRef]
- Andrades, I.S.; Castillo Aguilar, J.J.; García, J.M.V.; Carrillo, J.A.C.; Lozano, M.S. Low-Cost Road-Surface Classification System Based on Self-Organizing Maps. Sensors 2020, 20, 6009. [Google Scholar] [CrossRef] [PubMed]
- Singla, M.K.; Gupta, J.; Nijhawan, P.; Singh, P.; Giri, N.C.; Hendawi, E.; Abu El-Sebah, M.I. Parameter Estimation Techniques for Photovoltaic System Modeling. Energies 2023, 16, 6280. [Google Scholar] [CrossRef]
- Ghenai, C.; Mona, A.; Maamar, B. Sustainability indicators for renewable energy systems using multi-criteria decision-making model and extended SWARA/ARAS hybrid method. Renew. Energy 2020, 146, 580–597. [Google Scholar] [CrossRef]
| Disclaimer/Publisher’s Note: The statements, opinions and data contained in all publications are solely those of the individual author(s) and contributor(s) and not of MDPI and/or the editor(s). MDPI and/or the editor(s) disclaim responsibility for any injury to people or property resulting from any ideas, methods, instructions or products referred to in the content. |
© 2024 by the authors. Licensee MDPI, Basel, Switzerland. This article is an open access article distributed under the terms and conditions of the Creative Commons Attribution (CC BY) license (https://creativecommons.org/licenses/by/4.0/).


 ,
, 
