Article

The Holby–Morgan Model of Platinum Catalyst Degradation in PEM Fuel Cells: Range of Feasible Parameters Achieved Using Voltage Cycling

by
Victor A. Kovtunenko
1,2
1
Department of Mathematics and Scientific Computing, Karl-Franzens University of Graz, NAWI Graz, Heinrichstr. 36, 8010 Graz, Austria
2
Lavrentyev Institute of Hydrodynamics, Siberian Division of the Russian Academy of Sciences, 630090 Novosibirsk, Russia
Technologies 2023, 11(6), 184; https://doi.org/10.3390/technologies11060184
Submission received: 28 September 2023 / Revised: 1 December 2023 / Accepted: 11 December 2023 / Published: 18 December 2023
(This article belongs to the Section Environmental Technology)

Abstract

:
Loss of electrochemical surface area in proton-exchange membrane is of large practical importance, since membrane degradation largely affects the durability and life of fuel cells. In this paper, the electrokinetic model developed by Holby and Morgan is considered. The paper describes degradation mechanisms in membrane catalyst presented by platinum dissolution, platinum diffusion, and platinum oxide formation. A one-dimensional model is governed by nonlinear reaction–diffusion equations given in a cathodic catalyst layer using Butler–Volmer relationships for reaction rates. The governing system is endowed with initial conditions, mixed no-flux boundary condition at the interface with gas diffusion layer, and a perfectly absorbing condition at the membrane boundary. In cyclic voltammetry tests, a non-symmetric square waveform is applied for the electric potential difference between 0.6 and 0.9 V held for 10 and 30 s, respectively, according to the protocol of European Fuel Cell and Hydrogen Joint Undertaking. Aimed at mitigation strategies, the impact of cycling operating conditions and model parameters on the loss rate of active area is investigated. The global behavior with respect to variation of parameters is performed using the method of sensitivity analysis. Finding feasible and unfeasible values helps to determine the range of test parameters employed in the model. Comprehensive results of numerical simulation tests are presented and discussed.

1. Introduction

Conventional power is obtained from fossil fuels, such as coal, oil and natural gas. However, increasing concerns about environmental issues emphasize the development of renewable energy sources. A fuel cell (FC) converts chemical energy stored in hydrogen into electricity, which requires efficient catalysts for the hydrogen oxidation reaction (HOR) at the anode and the oxygen reduction reaction (ORR) at the cathode. FCs are a promising alternative technology for power energy that can be utilized to enhance consumption of portable and stationary storage systems, as well as emission issues of heavy automotive devices. See the compendium of hydrogen energy in [1], studies of the energy management in [2,3], and the impact of fuel cells vehicles on hydrogen consumption and carbon dioxide emission in [4]. Specifically, polymer electrolyte membrane (PEM) fuel cells have numerous benefits, such as high efficiency, power density, greenhouse gas emission, operation at low temperature, rapid start-up, noiseless, and a simple design. The thermodynamic efficiency of PEMFC is about 50–60%, compared to the 20–40% efficiency of heat engines. Its shortcomings include a relatively limited lifetime and the cost of using critical raw materials, namely platinum, as the catalyst. These questions raise the challenge of investigating degradation mechanisms in PEMFC.
Catalytic electrodes are typically based on platinum or platinum alloys, which are dispersed in the form of nanoparticles on a carbon support in order to achieve the maximum area. The supported platinum catalyst is mixed with an ion-conducting polymer called ionomer, that falls mainly under the Nafion trademark series. The active area should be preserved over a lifetime of the catalyst under operation. However, membrane degradation causes a loss of the electrochemically active surface area (ECSA) and leads to a reduction in the efficiency of the fuel cell as a whole. The degradation behavior of PEMFC depends on multiple parameters linked to operating conditions and materials of catalytic layer (CL) composed of Pt-based catalyst, carbon support and ionomer. Operating conditions include temperature, relative humidity (RH), potential of hydrogen (pH), upper and lower electric potential levels (UPL and LPL), as well as the dwell time. Material properties can be very different and only a few averaged parameters are freely available in the literature, like Pt particle size, Pt loading on carbon support, and the platinum to carbon (Pt/C) weight ratio, which I will estimate in current consideration. For this task, I apply the method of sensitivity analysis.
Figure 1 presents a sketch of principal degradation mechanisms derived from electron microscopy analyses of membrane electrode assembly (MEA), the core component of PEMFC, see [5].
Platinum nanoparticles in an ideal situation are fixed on the carbon black support. Platinum dissolution leading to the mass loss is initiated by the electrochemical oxidation and reduction of the Pt surface. Small particles have a higher surface energy and may dissolve at lower electric potentials. Platinum can diffuse in the membrane with crossover of hydrogen from the anode and oxygen from the cathode, because membranes are not perfect separators. Initially disjoined neighbor particles may come into contact with each other in the course of migration on the carbon surface due to weakening of interactions between platinum particles and support. Agglomerating into large particles causes a reduction in the active area. The dissolved platinum can redeposit on larger platinum particles, known as Ostwald ripening, which also leads to particle growth. A coarsening mechanism is called 3D if the platinum atoms diffuse along the electrolyte and 2D if the particles go through the carbon support. Dissolution of platinum is considered as the primary degradation phenomenon, which may cause secondary degradation phenomena such as platinum deposition in the ionomer or Ostwald ripening. Degradation mechanisms are strongly affected by the particle size distribution (PSD); that is, the number of Pt particles of given diameters on the support.
Fundamental theories and mathematical modeling of polymer electrolyte fuel cells, especially development of degradation mechanisms in catalytic electrodes, can be found in the collections by [6,7,8,9]. I refer to relevant electrokinetic studies of nonlinear diffusion with interfacial reactions in [10,11,12,13,14], to mechanical degradation due to fracture in [15], and degradation by humidity cycling in [16]. The literature on the subject is extensive and is directed towards both theoretical modeling and experimental research. For example, see the description of electrochemical test procedures for accelerated evaluation of fuel cell cathode catalyst degradation by cyclic voltammetry (CV) in [17,18], and technology issues of ceramic electrolyte materials for electrochemical devices in [19]. I cite only very few related studies on the modeling of durability of PEMFC electrocatalysts in [20,21], identifiability analysis of degradation model parameters under various accelerated stress test (AST) protocols in [22], lifetime prediction under automotive load cycling in [23], and long-term stability under dynamic operation in [24].
Darling and Meyers [25] constructed first a kinetic degradation model accounting for two electrochemical reactions of the platinum dissolution and platinum oxide (PtO) film formation, together with the chemical reaction of dissolution of PtO. The corresponding kinetic rates were developed based on modified Butler–Volmer equations. Holby and Morgan and co-authors [26,27] refined the model by taking into account diffusion of platinum ions (Pt 2 + ) into the ionomer membrane. They canceled the chemical dissolution reaction, which is negligible within major electrochemical mechanisms of Pt dissolution and oxidation, responsible for degradation. Moreover, particle size groups were introduced in order to represent a discrete PSD; this idea was extended further in the work by Li et al. [28]. From the electrochemical degradation model, it is possible to determine the amount of Pt mass lost from the PSD, or respective loss in the active area during PEMFC operation.
In our research, we apply the Holby–Morgan equations for modeling of platinum degradation in cyclic voltammetry (CV). In [29,30], we studied different AST industrial protocols developed by the U.S. Department of Energy, Tennessee Tech University, Nissan research center, and European fuel cell and hydrogen joint undertaking (FCH JU) for electric potential (voltage) of both square-wave (SW) and triangle-wave (TW) forms. The ECSA loss was more significant for SW compared to TW profiles; the degradation increased at high UPL and steep electric potential. In [31,32], the FCH JU non-symmetric square waveform [33] was applied for modeling of the impact of cycling operating conditions, material parameters, and fitting parameters on durability of PEMFC. From the variance-based local sensitivity analysis, we reported a linear prognosis of lifetime of the catalyst, which is in inverse proportion to the degradation rate. The predicted lifetime increases when decreasing the temperature, diffusion, Pt/C volume fraction, or increasing the Pt particle diameter, pH, and Pt particle loading.
I cite [34,35,36] for sensitivity based approach suitable for parameter estimation from mathematical and physical reasoning. In the standard approach, local sensitivity analysis is carried out using the one parameter-at-a-time (OAT) method. In the present contribution, I apply the global method of sensitivity analysis in order to investigate the behavior of operating conditions and model parameters with respect to ECSA ratio loss rate (RLR). Test parameters selected for investigation are varied within their physical values. Nevertheless, starting with physically consistent quantities, some parameters may attain maximal or minimal values such that the CL is blocked; hence, the fuel cell cannot work properly anymore. In numerical simulation tests, I have observed the following infeasible PEMFC operations:
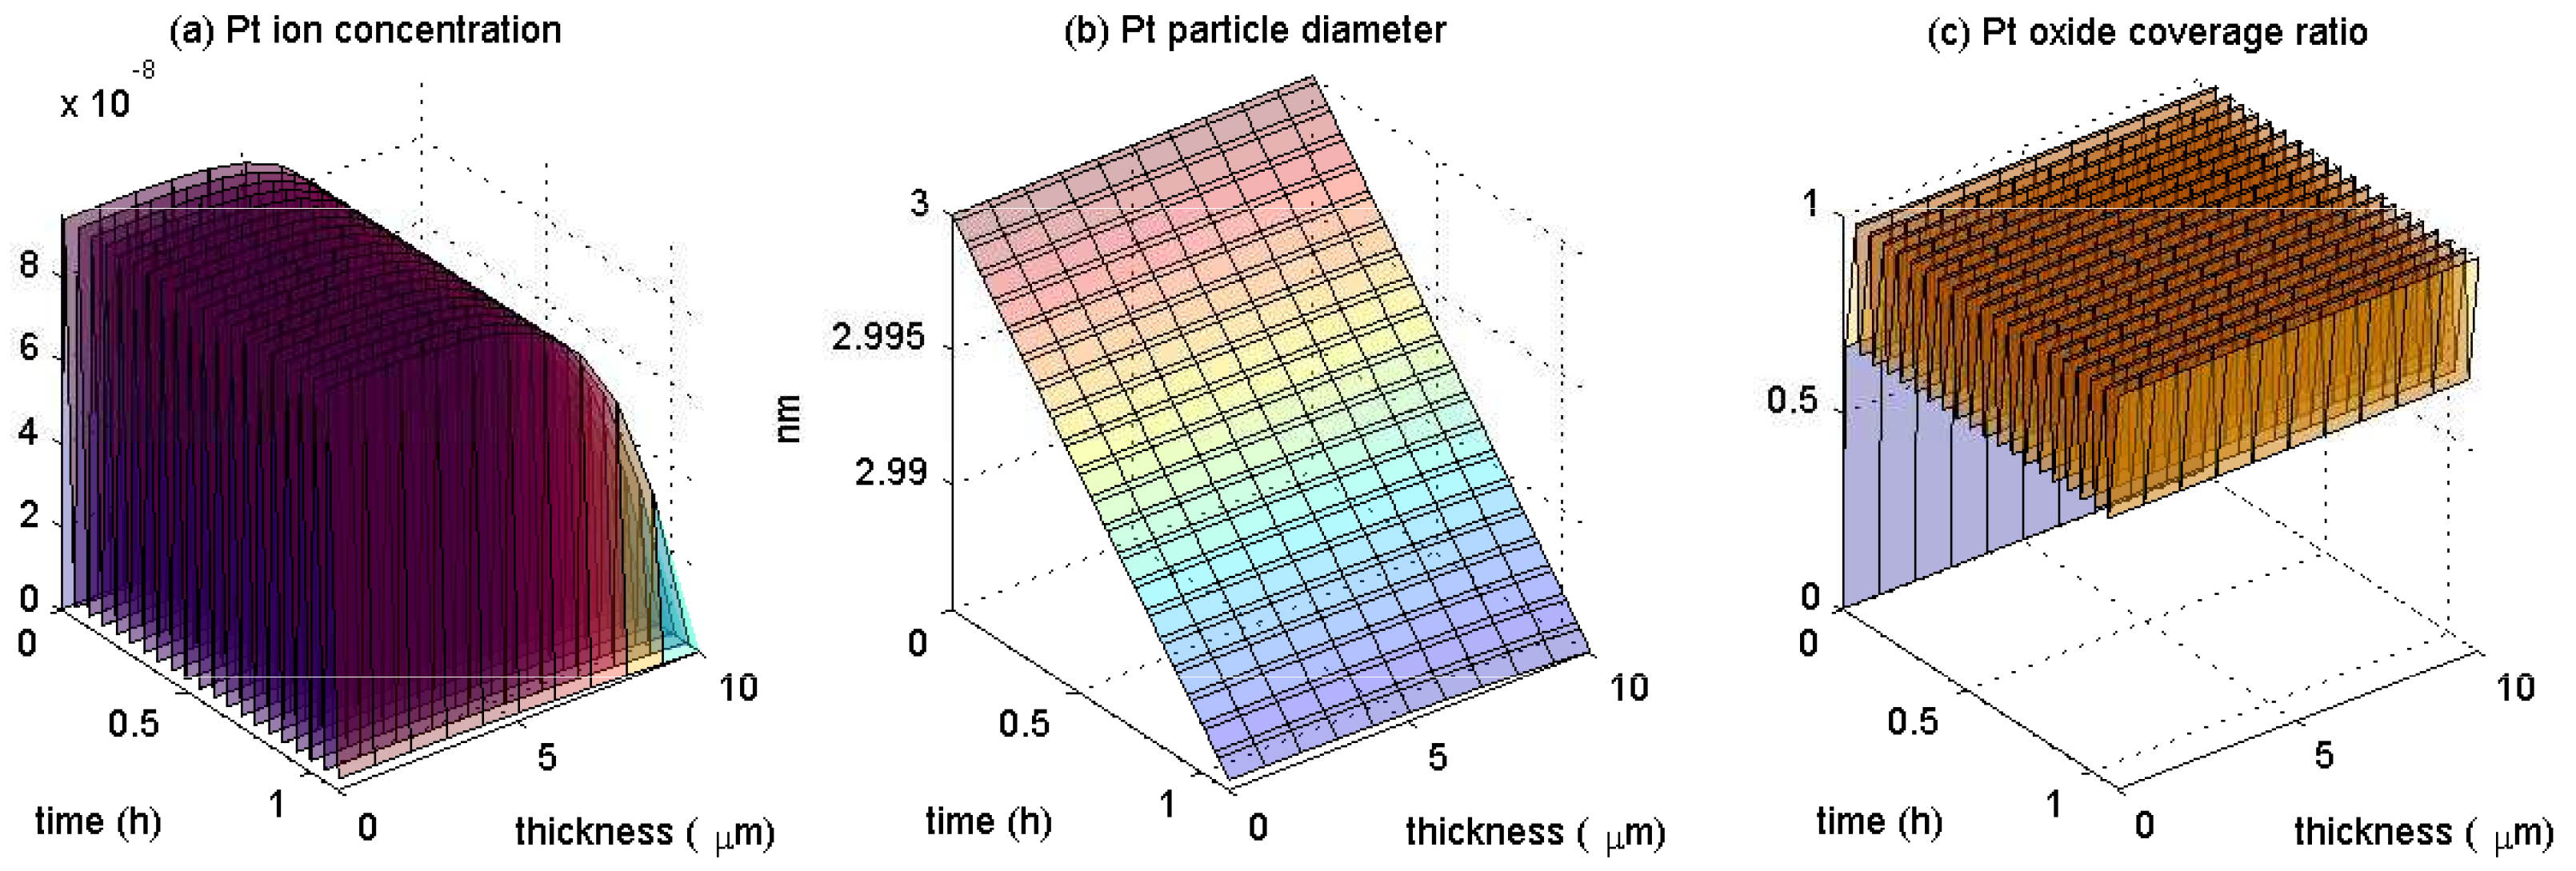
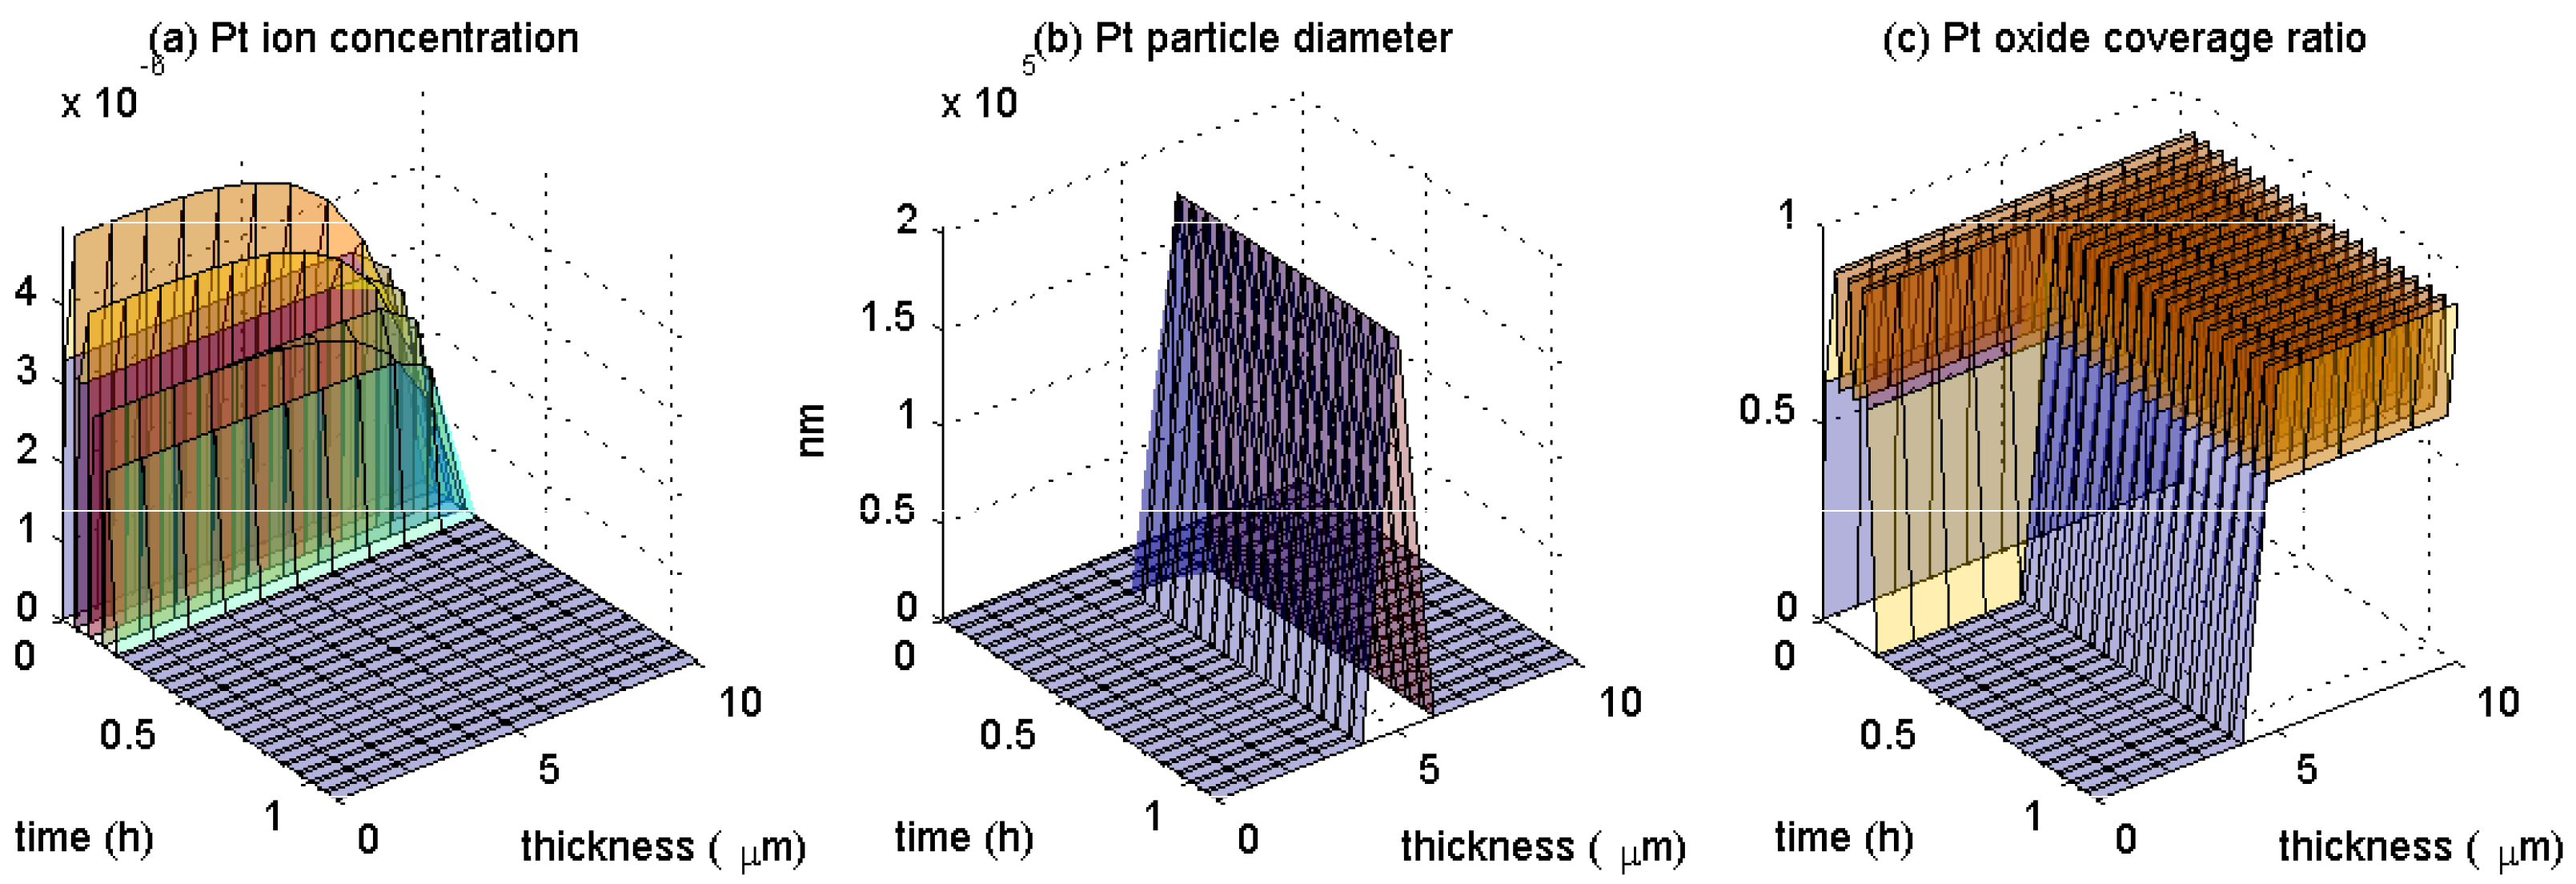
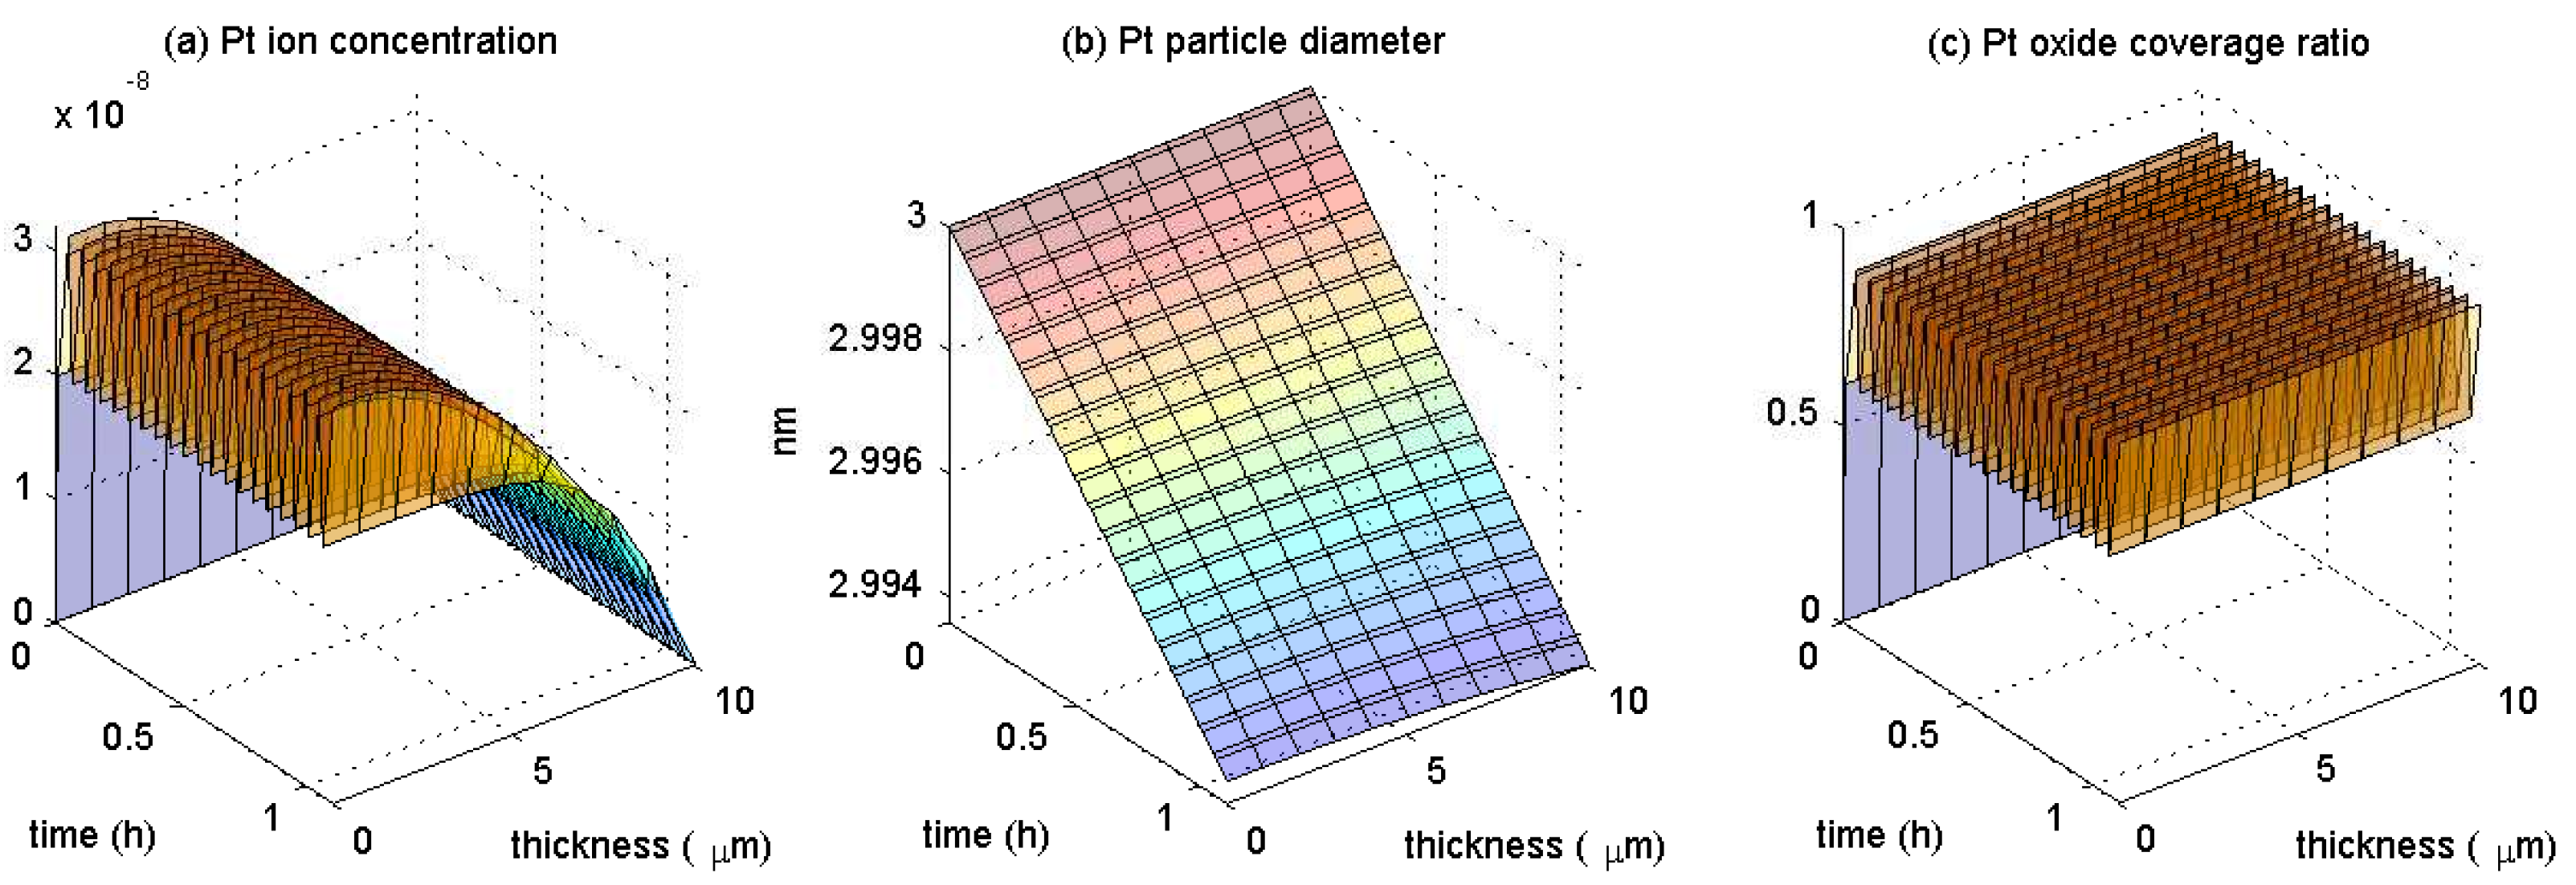
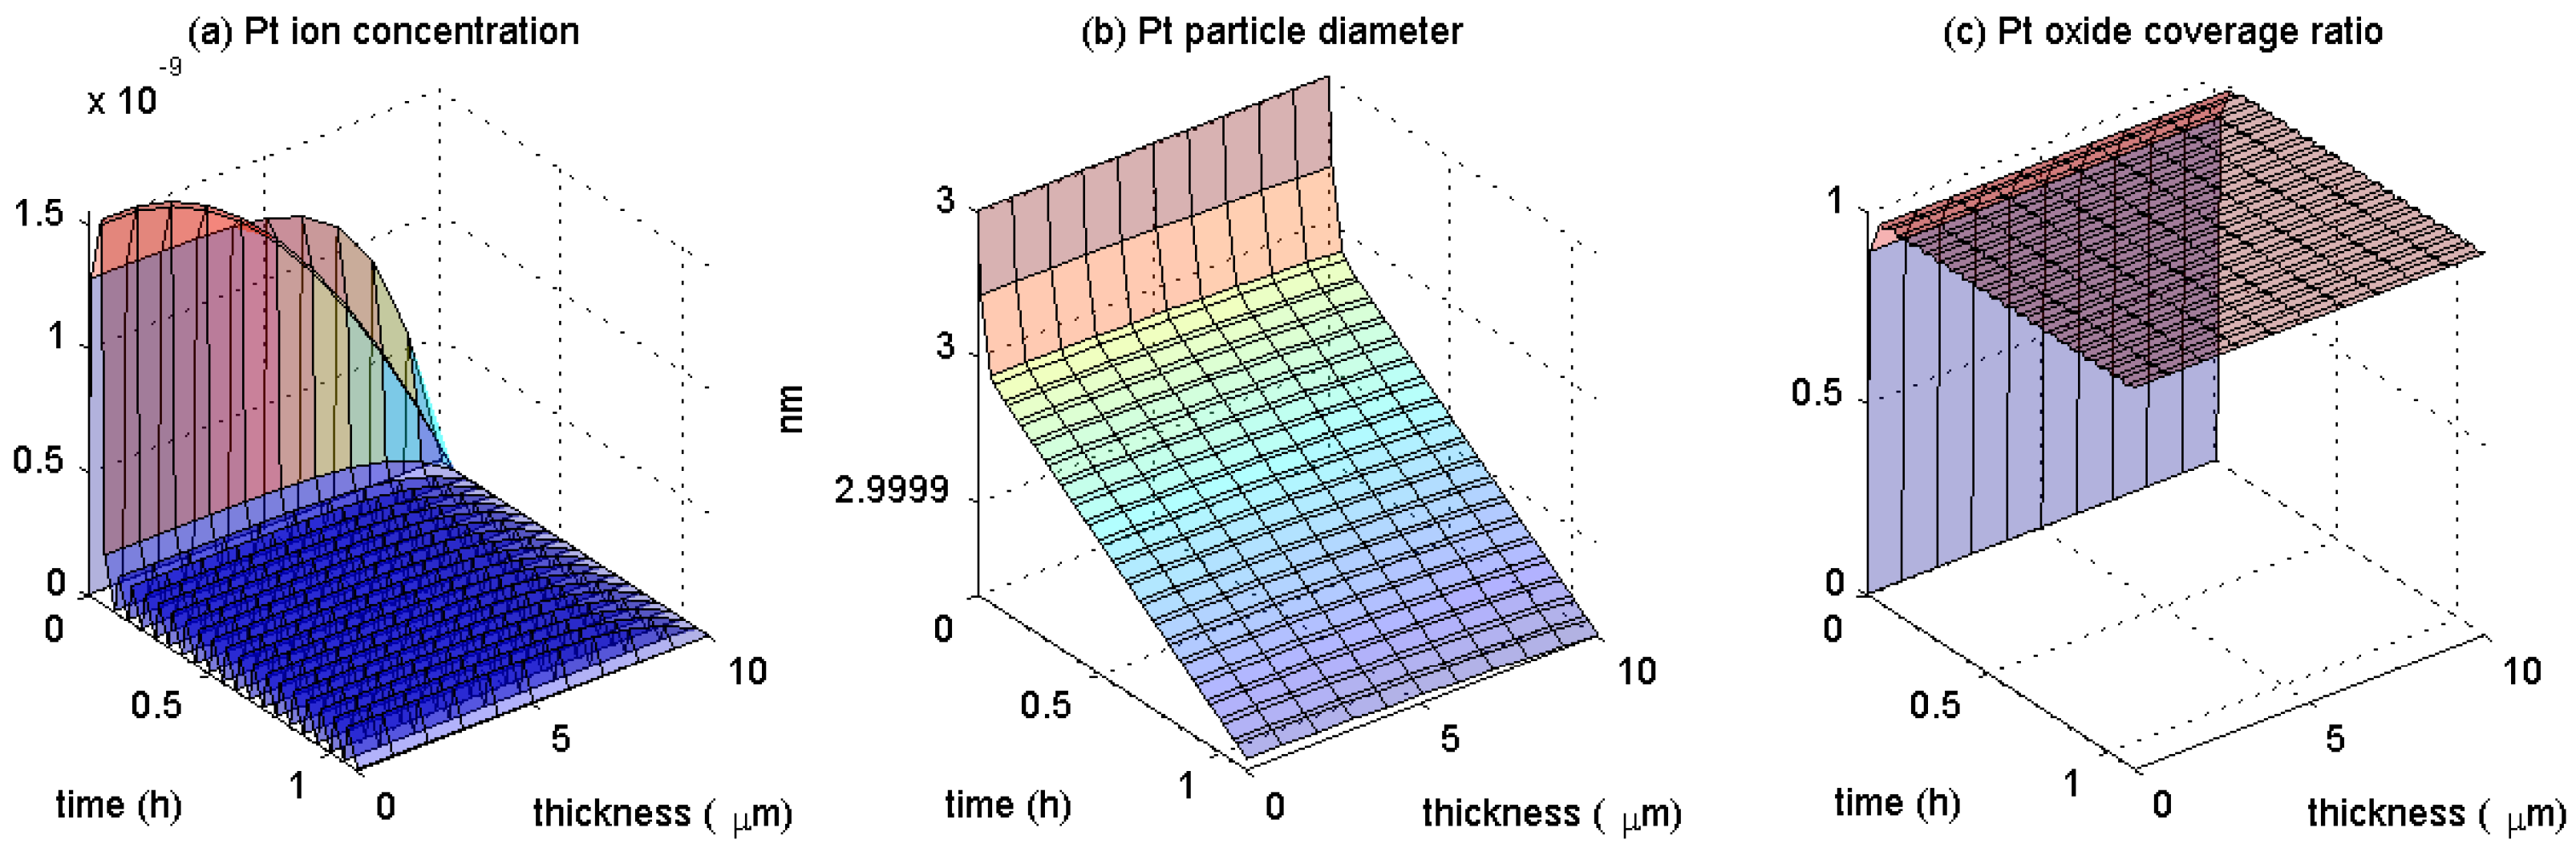
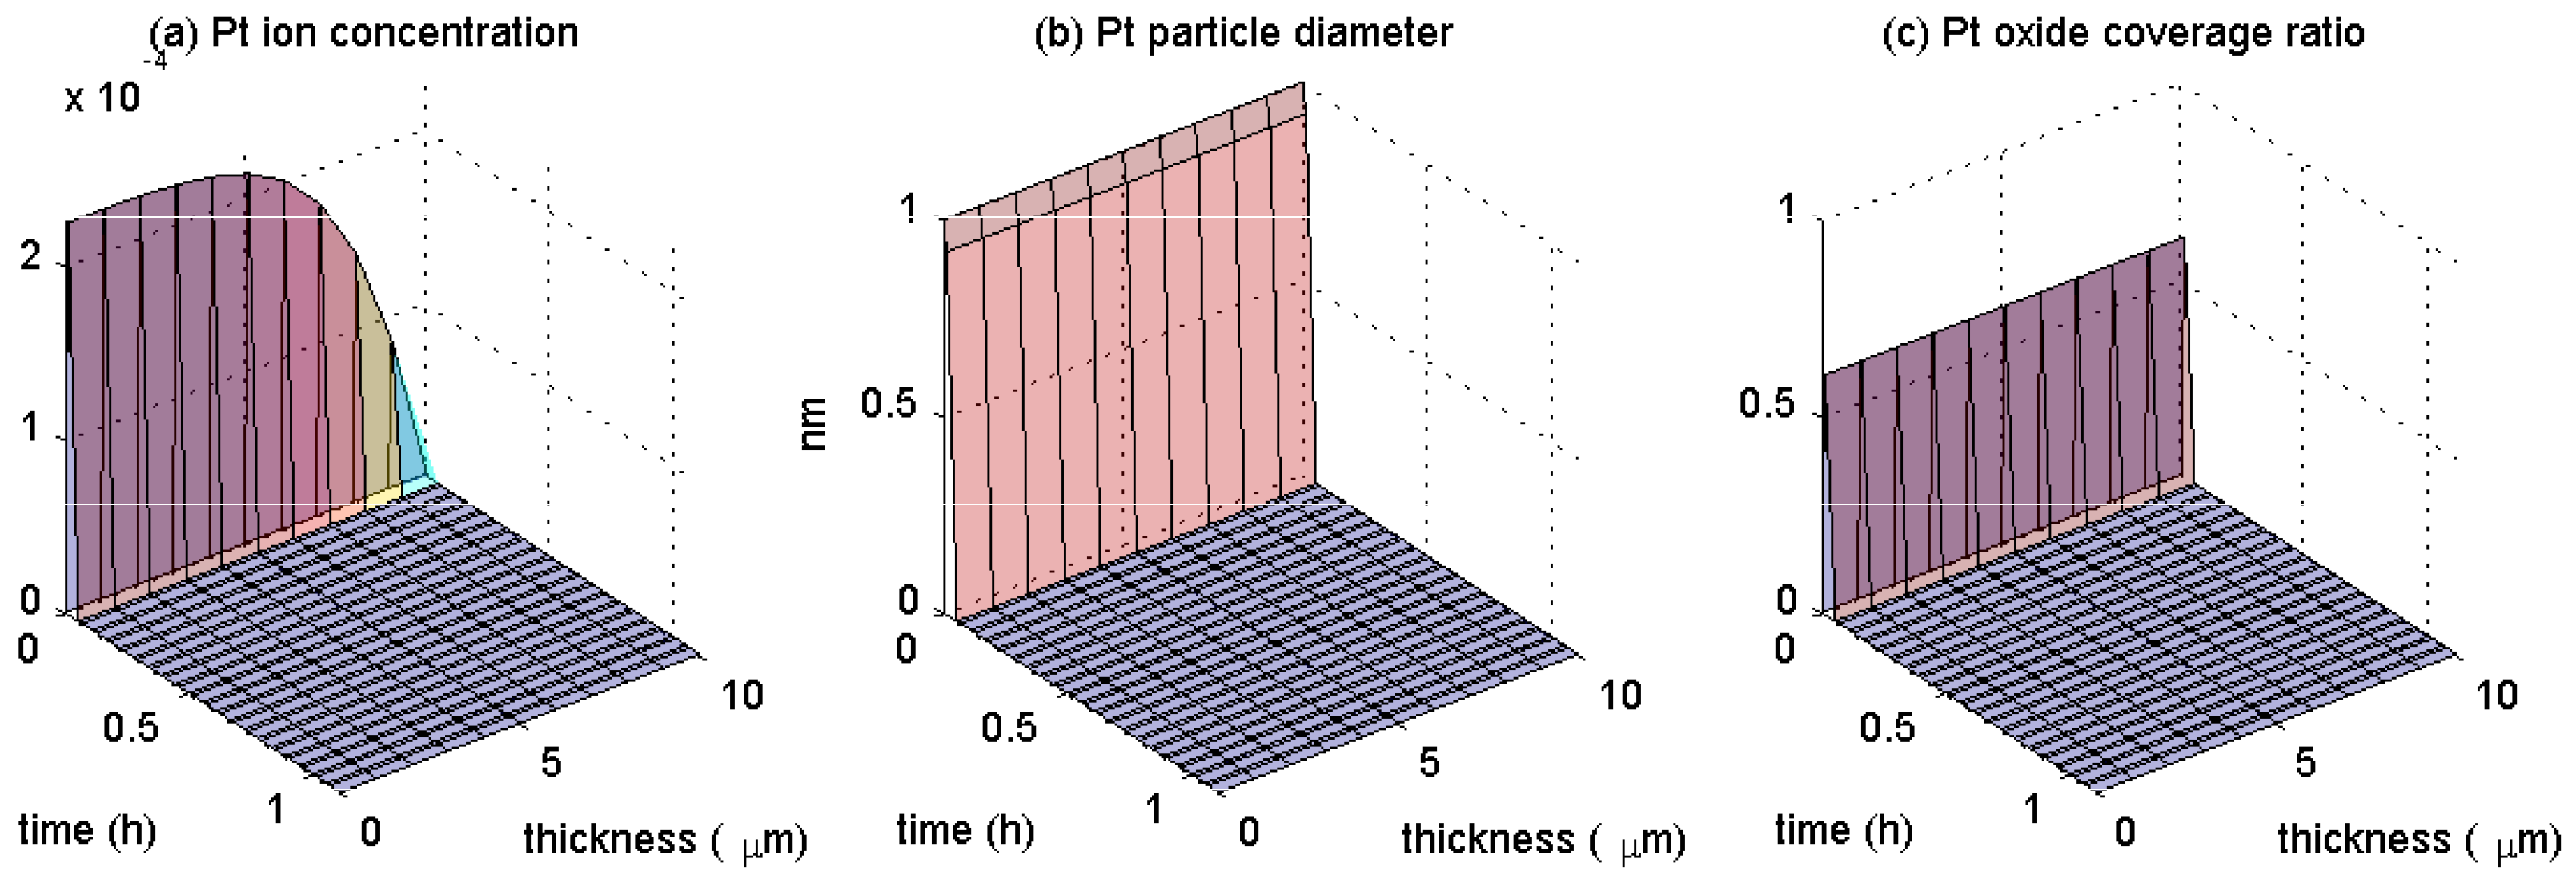
  • Platinum is fully dissolved from catalyst;
  • Platinum surface is fully covered by oxide;
  • Platinum nano-particles, which were initially uniformly distributed, agglomerate in a single band in the middle of the catalyst layer.
These critical issues determine the feasible range of parameters in the Holby– Morgan model.
Research findings contribute to the field of environmental and materials sciences; for instance, for computer modeling and simulation of electrochemical procedures that govern the operation of a fuel cell. Since fitting parameters and some model variables are unknown in practice, a theoretical model must be considered to recover appropriate parameter values and select feasible ranges for them. A number of numerical and optimization methods inspired by various heuristics for calibration of parameters in electrochemical PEMFC models were proposed in [37,38,39]. I have utilized the global method of sensitivity analysis to examine the impact of model parameters and operating conditions on the problem of loss of the electrochemically active area due to platinum catalyst degradation. This study opens up directions for future research in the optimization context that will essentially aim to find the best parameter combination so that the model would accurately describe empirically collected PEMFC data. For broader implications of the research, see [40,41], which presents an environmental impact assessment of catalyst layer degradation in proton exchange membrane fuel cells.

2. Materials

In Table 1, material and fitting parameters for platinum ion formation and diffusion, and for platinum oxide formation are assembled together. The parameters are taken from the corresponding literature [25,26,28,42] for use in the following computer simulations.
The platinum particles are assumed to be a hemisphere; its volume and number in a catalyst layer of uniform thickness L can be calculated using the formulas
V Pt = π d Pt 3 6 , N Pt = p Pt L ρ Pt .
Basic values for cathode catalyst are collected in Table 2.

3. Methods

Let the semi-infinite catalyst layer be of constant thickness L = 10 3 cm measured with the space variable x [ 0 , L ] . In time t > 0 , voltage V is prescribed according to the FCH JU protocol of accelerated stress test (AST) given by the periodic function
V ( t ) = 0.6 V for t ( ( k 1 ) τ , ( k 1 ) τ + 10 ) 0.9 V for t ( ( k 1 ) τ + 10 , k τ ) , k = 1 , 2 , , # k ,
where the period τ = 40 s and number of cycles # k determines the end of life (EoL) at t EoL : = # k τ (s). Numerical tests are realized by varying the number # k = 10 , 100 , 1000 of cycles corresponding to t EoL = 0. 1 ¯ , 1. 1 ¯ , 11. 1 ¯ operation hours of PEMFC.
Under the CV given by (1), look for platinum ion concentration c ( t , x ) [mol/cm 3 ], platinum particle diameter d ( t , x ) [cm], and dimensionless ratio of platinum oxide coverage θ ( t , x ) [1], which solve the coupled system of nonlinear reaction–diffusion equations for x ( 0 , L ) and t ( 0 , t EoL ) :
ε c t ε 3 / 2 D Pt 2 c x 2 = π N Pt 2 V Pt d 2 r dissol ( c , d , θ ) ,
d t = Ω r dissol ( c , d , θ ) ,
t ln ( θ d 2 ) = 1 Γ θ r oxide ( θ ) .
The reaction rates r dissol and r oxide [mol/(cm 2 s)] in (2)–(4) are described by the following Butler–Volmer equations. The reaction rate for the Pt ion dissolution is given by
r dissol ( c , d , θ ) = Γ ( 1 θ ) ( ν 1 exp H 1 , fit + ( 1 β 1 ) H 1 ( d , θ ) R T ν 2 c c ref exp H 1 , fit + β 1 H 1 ( d , θ ) R T )
using the Faraday and gas constants F and R, where the molar enthalpy difference for dissolution [J/mol]:
H 1 ( d , θ ) = n F ( U eq V ) 4 Ω d γ 0 ( θ ) Γ n 2 F θ V ,
and the surface tension difference [J/cm 2 ]:
γ 0 ( θ ) = γ + Γ R T θ ln ν 2 ν 1 10 2 p H + 2 n 2 F U fit + ω θ 2 R T + ln θ 2 + 2 θ θ ln 1 θ 2 .
The reaction rate for Pt oxide coverage is described by
r oxide ( θ ) = Γ ( ν 1 1 θ 2 exp H 2 , fit + λ θ + ( 1 β 2 ) H 2 ( θ ) R T ν 2 10 2 p H exp H 2 , fit λ θ + β 2 H 2 ( θ ) R T )
using the molar enthalpy difference for oxidation [J/mol]:
H 2 ( θ ) = n 2 F ( U fit V ) + ω θ .
The system of time-dependent Equations (2)–(9) is endowed with initial conditions
c ( 0 , x ) = 0 , d ( 0 , x ) = d Pt , θ ( 0 , x ) = 0 for x [ 0 , L ] .
Let the catalyst layer match gas diffusion layer at the left side as x = 0 , and meet the membrane at the right side as x = L . Mixed boundary conditions for no-flux at the interface with GDL and perfectly absorbing boundary with PEM imply that
c x ( t , 0 ) = 0 , c ( t , L ) = 0 for t ( 0 , t EoL ) .
Physical consistency requires positive values for concentration and particle diameter, minimal and maximal thresholds for the ratio, which form the feasible region
K = { c > 0 , d > 0 , 0 < θ < 1 }
in the domain of Pt ion concentration, Pt particle diameter, and PtO coverage ratio. The set K implies both unilateral and bilateral constraints imposed on admissible solutions of the governing system (2)–(11).
For computing of Equations (2)–(11), the implicit–explicit scheme (IMEX2) combined with the variable time-step Runge–Kutta–Fehlberg method (RKF45) is applied. The uniform x-spacing Δ x = 10 4 [cm], and the coarse time step Δ t = 10 2 [s] are set. For numerical stability, the step size is refined locally to 10 4 [s] inside the ( Δ t , Δ t ) -neighborhood of every point t = ( k 1 ) τ + 10 , k = 1 , 2 , , # k , where the potential in (1) has lift-off. This takes 4037 time steps and 133,221 degrees of freedom to solve within each cycle. The interested reader can find the algorithm in Refs. [29,31].
In Figure 2, the solution ( c , d , θ ) ( t , x ) is presented versus time t ( 0 , 1 . 1 ¯ ) hours during #k = 100 cycles, and versus the catalyst thickness x ( 0 , 10 ) given in micrometers ( μ m).
Here, the particle diameter is converted to nanometers (nm for short). To illustrate this, I depict only the initial t = 5 ( k 1 ) τ and the final t = 5 k τ points within every five cycles, which, together, constitute 20 time points. In the plot (a) evolution of Pt ions distribution, c can be seen, which varies periodically from 0 to around 3 × 10 8 [mol/cm 3 ] in a regular way. It is high from left at the interface with GDL, and zero when matching PEM to right according to the boundary condition (11). The plot (b) shows a monotone decrease in Pt particle diameter d in time; the degradation is faster at the PEM interface at x = L than at the boundary with the GDL at x = 0 . In plot (c), periodic oscillations for the coverage of Pt surface by platinum oxide are observed during the voltage cycling. In every cycle, the formation of PtO occurs at UPL, and the reverse reaction proceeds at LPL such that a part of platinum oxide is reduced to the platinum. As the result, about 60 to 90% of the Pt surface is permanently covered by PtO. From Figure 2, one can conclude that in this case, the solution ( c , d , θ ) K is feasible according to (12).

4. Results

The rate of electrochemical reactions of dissolution and oxidation decreases with the decrease in the electrochemical active area (ECSA). The surface area is in a quadratic relation to the particle diameter. If the platinum diameter d ( t ) decreases in time from an initial value d ( 0 ) = d Pt in (10) due to degradation, then loss of ECSA ratio in comparison with a reference active area at the beginning of life (BoL) can be evaluated using the dimensionless function
E ( t ) = d ( t ) d Pt 2 , E ( 0 ) = 1 .
In experiments, the greatest loss of ratio E takes place at the beginning of potential cycles, and its rate is close to a linear relationship. Therefore, within small final times t EoL , I will calculate the parameter of the ECSA ratio loss rate (RLR) [1/s]:
E ˙ : = 1 E ( t EoL ) t EoL
to measure the output of platinum catalyst degradation. A prognosis of PEMFC lifetime is inversely proportional to the parameter E ˙ : longer durability can be reasoned by smaller RLR, and vice versa.
In Figure 3, the parameter E ˙ of the electrochemical surface area RLR is depicted, which is scaled by 10 3 per hour, dependent on cycling operating conditions.
In the left plot of Figure 3, the temperature T converted to Celsius is varied from −40 °C to 120 °C, where the basic value of T = 353.15 K corresponds to 80 °C. For T T cr with the critical temperature T cr = 110 °C, solutions ( c , d , θ ) of Equations (2)–(11) remain within the feasible set K defined in (12). In contrary, Figure 4 presents the unfeasible solution ( c , d , θ ) ( t , x ) at T = 120 °C versus time t ( 0 , 1 . 1 ¯ ) [h] and space x ( 0 , 10 ) [ μ m].
In comparison with the feasible solution given in Figure 2, at the end of the cycles, the Pt ion concentration c ( x ) is almost zero in plot (a), and in plot (c), the Pt oxide coverage ration θ ( x ) becomes one everywhere along the catalyst layer 0 x L . The latter fact implies that the platinum surface is fully covered by oxide, and thus is completely blocked. I conclude that, at high temperatures T > T cr , the boundary of feasible set K in (12) is attained, hence the corresponding solutions ( c , d , θ ) are physically inconsistent.
In the right plot of Figure 3, the output parameter E ˙ [ 10 3 /h] expressing the loss rate of electrochemical active area ratio is depicted in dependence on the variation of pH [1] starting from the minimum 0 and ending with 1.6. For small and moderate 0 ≤ pH ≤ pH cr with the critical value pH cr = 1.4 , numerically calculated solutions ( c , d , θ ) K are feasible, in contrast to unfeasible solutions for large pH > pH cr . For illustration, in Figure 5 the unfeasible solution ( c , d , θ ) ( t , x ) is depicted at pH = 1.5 depending on time t ( 0 , 1 . 1 ¯ ) [h] and thickness x ( 0 , 10 ) [ μ m].
Again, at the end of selected cycles, observe that the platinum ion concentration is close to zero in the plot (a), and the platinum surface is fully covered by oxide in the plot (c). The performance is similar to that behavior in Figure 4 with a smaller amplitude of time oscillations of c ( t ) and θ ( t ) within cycling AST.
Figure 6 portrays the curves of E ˙ [ 10 3 /h] presenting ECSA RLR with respect to variation of three selected model parameters: Pt particle diameter d Pt [nm], Pt particle loading p Pt [mg/cm 2 ], and Pt/C volume fraction ε [1].
In the left plot, the platinum particle diameter is varied in the range between 2 nm and 10 nm. The critical value ( d Pt ) cr = 2 nm stands for the lower bound of Pt diameters such that the solution ( c , d , θ ) K is feasible. The example of an unfeasible solution ( c , d , θ ) K at d Pt = 1 nm is presented in Figure 7. Here, observe that the Pt ion concentration c ( t , x ) 0 in plot (a) and the Pt particle diameter d ( t , x ) 0 in plot (b) both become zero. When the platinum is fully dissolved from the surface, this implies that the catalyst does not work anymore. Therefore, I count this case as an unfeasible solution.
In the middle plot of Figure 6, variation in the platinum particle loading p Pt starting from the minimum 0 and up to 10 mg/cm 2 is presented. No unfeasible solutions were observed in these tests.
Finally, in the right plot of Figure 6, I present the platinum to carbon volume fraction ε varied in the range between 0.002 and the maximum 1. For ε smaller than the critical value ε cr = 0.002 , solutions ( c , d , θ ) K are unfeasible, see in Figure 8 the unfeasible solution ( c , d , θ ) ( t , x ) at ε = 0.001 depicted versus time t ( 0 , 1 . 1 ¯ ) [h] and thickness x ( 0 , 10 ) [ μ m].
In the plots (a) and (b) there is zero concentration of c ( t , x ) and Pt particle diameter d, except in the middle of CL, where formation of a single parallel band of particles can be seen.

5. Discussion

Platinum particles are originally dispersed homogeneously over the cathode catalyst layer and may dissolve during electric potential cycling or redeposit inside the membrane, as illustrated in Figure 1. In agreement with observations in aging experiments (see [43]), dissolved Pt ions can develop a thin parallel band of Pt inside the membrane, whose location is determined by operating conditions. The loss of fuel cell performance due to the formation of the Pt band is caused by a drop in the active area. A sink of platinum ions at a fixed position inside the membrane allows the Holby–Morgan model to describe the effect of Pt band formation without taking into account fluxes of hydrogen and oxygen. A multi-scale modeling for the platinum band formation was proposed in [44] by including nucleation and consequent growth of platinum particles, and extended in [45].
In automotive applications such as cars, trucks, other road, rail and marine vehicles, as well as stationary power units and hybrid systems, a fuel cell is expected to perform under a wide range of operating conditions, including the temperature range from −40 °C to 120 °C. I summarize findings in numerical tests of the Holby–Miorgan model (2)–(11) with respect to the temperature operating condition according to Figure 3a:
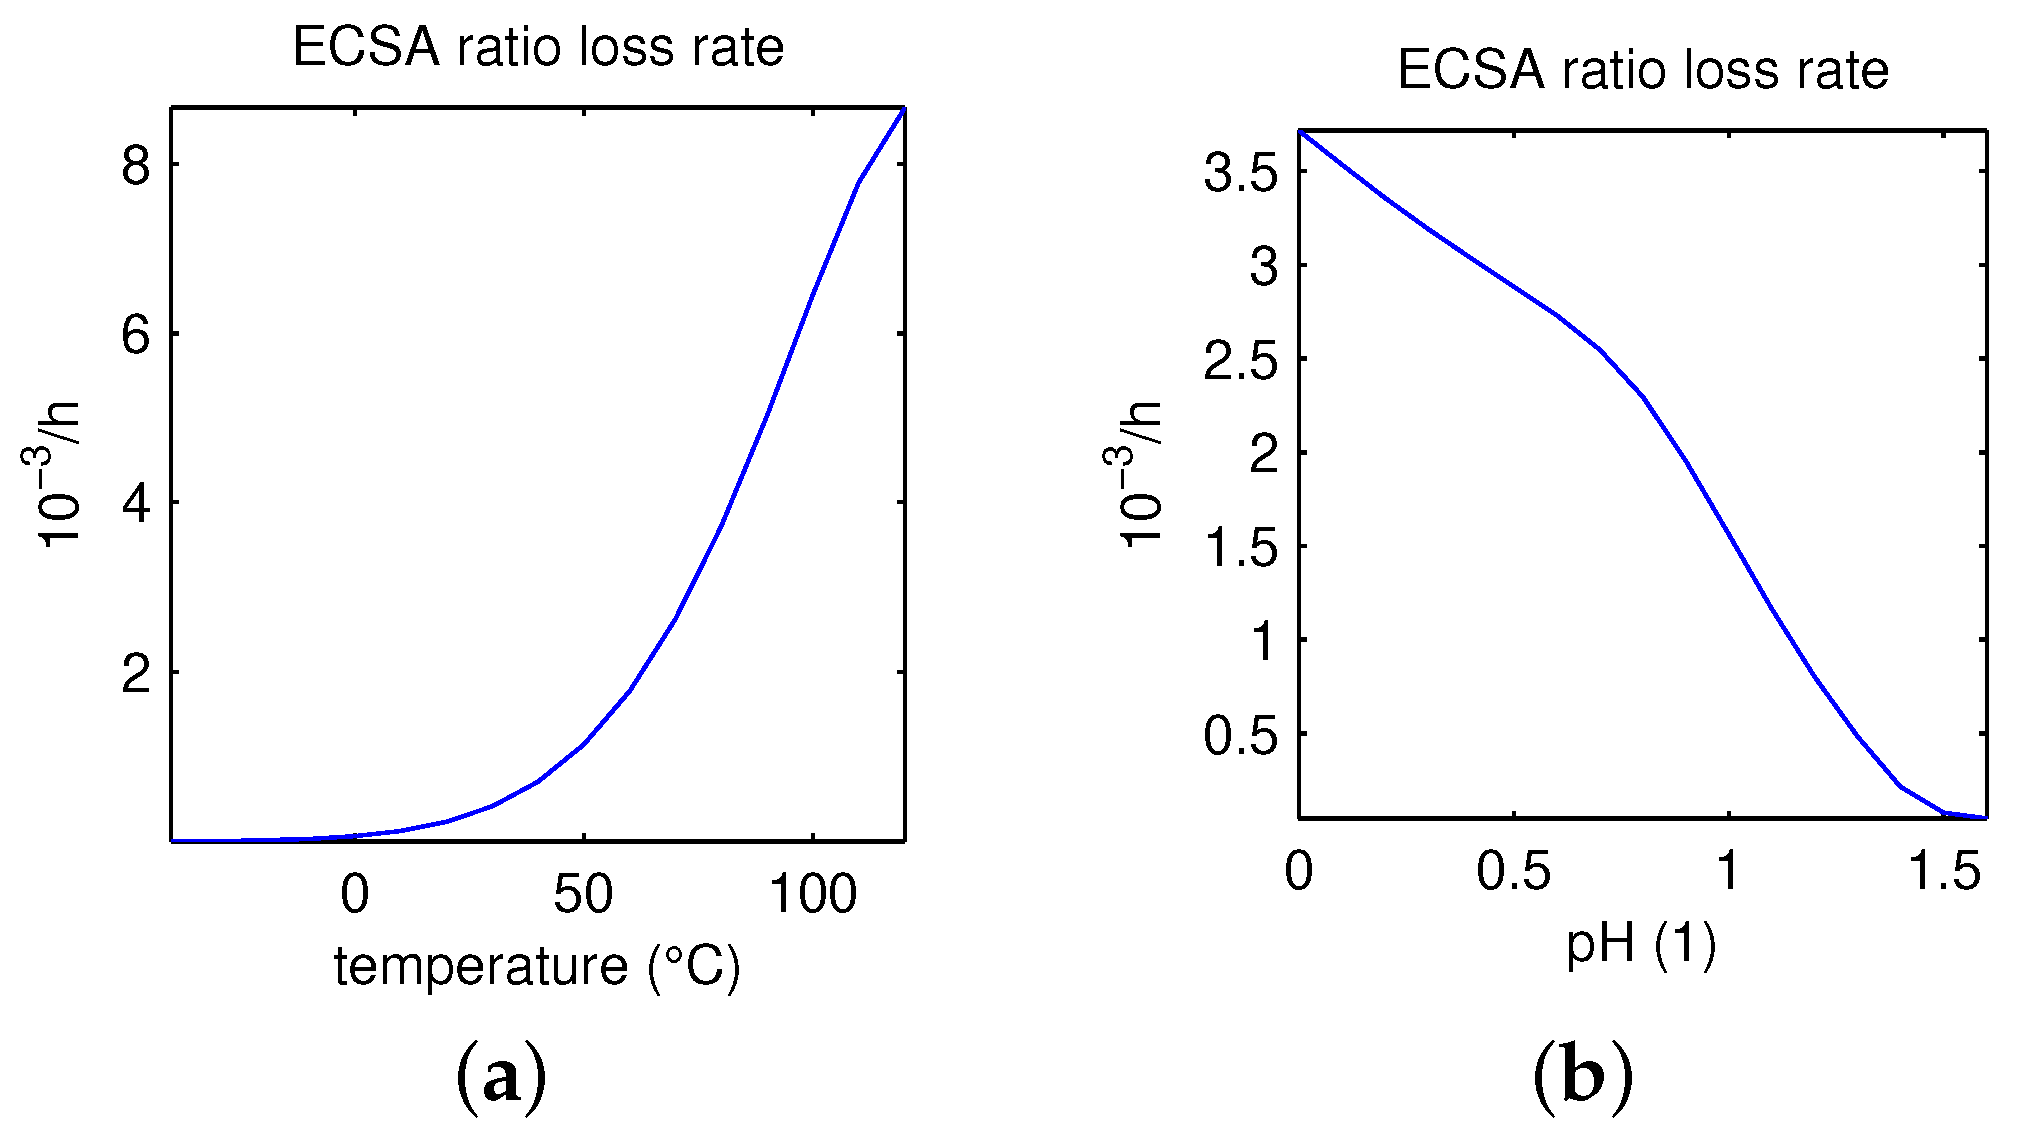
  • For basis values of the model parameters, the critical value of maximum feasible temperatures is about 110 °C.
  • ECSA ratio loss rate E ˙ in (14) increases monotonically with the increase in the temperature in the feasible range.
The potential of hydrogen (pH) operating condition measures the acid environment in the electrode, which in turn is affected by the wetting state. In PEMFC, the environment is strongly acidic, and pH values between 0 and 2 relate to practical conditions of a fuel cell [46]. Based on numerical simulations presented in Figure 3b, I describe the impact of the pH operating condition on the platinum degradation performance in PEMFC:
  • For the temperature fixed at T = 80 °C, the maximum value for feasible pH is around 1.4.
  • Active area RLR E ˙ decreases monotonically with the increase in pH within the feasible range 0–1.4.
For other cycling operating conditions, earlier in [29,30], we have established higher ECSA RLR for square-wave (SW) than triangle-wave (TW) cycle forms, at the high upper potential level (UPL), and based on the liftoff of potential difference.
To maintain optimal performance of the membrane electrode assembly (MEA) over the lifetime of the fuel cell, and minimize platinum loading for cost, currently an extensive research of influence of nano-particle size distribution (PSD) on the degradation is in progress; see, e.g., [47]. The authors of [27] proposed that the dissolution rate and solubility are accelerated by smaller initial particle sizes due to their higher specific surface energy. They claimed that the Gibbs–Thomson energy plays a crucial role in the thermodynamic stability for particle sizes below 5 nm. In particular, as the particle size decreases from 5 to 2 nm, the Gibbs–Thomson energy increases significantly.
Further, I report on the results of the sensitivity analysis carried out with respect to three model parameters related to nano-particle distribution on the catalyst layer, which are most freely accessible in the literature. According to Figure 6a, the following impact takes place by varying the parameter d Pt :
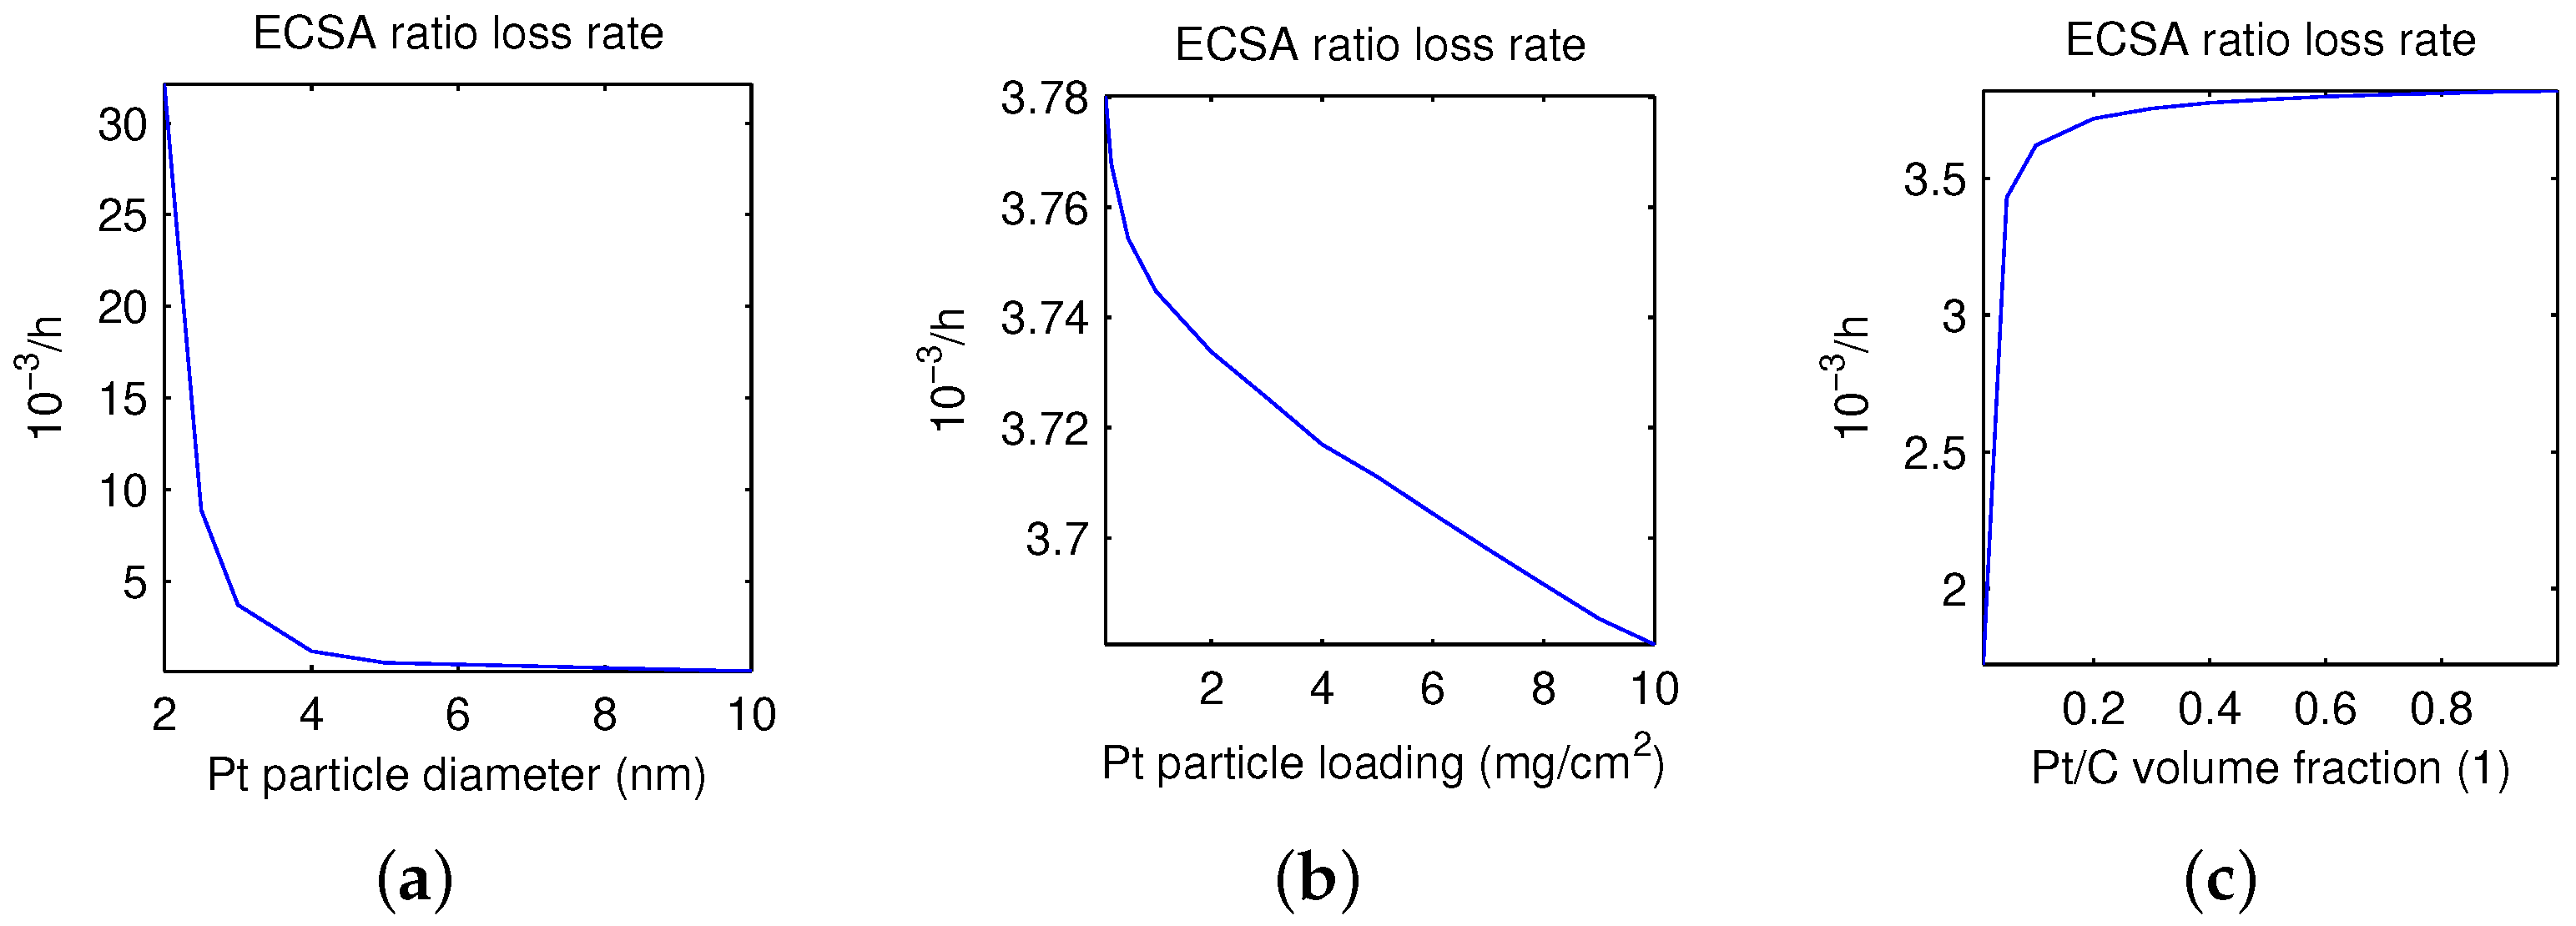
  • For pH = 0 fixed, tested diameters of platinum particles are feasible when larger than the minimum of 2 nm.
  • ECSA RLR decreases monotonically when increasing the Pt diameter in the range of 2–10 nm.
  • E ˙ drops significantly for d Pt less than 2.5 nm, and shows few changes for d Pt larger than 5 nm.
From Figure 6b, I conclude with the following influence of the model parameter p Pt :
  • For d Pt = 3 nm fixed, ECSA RLR decreases monotonically when increasing the Pt particle loading within all tested ranges of 0–10 mg/cm 2 .
  • E ˙ shows a larger drop for p Pt = 0–1 mg/cm 2 than for p Pt = 1–10 mg/cm 2 , where it is close to a linear relationship.
Finally, in Figure 6c, the following behavior can be observed with respect to the model parameter ε :
  • For p Pt = 0.4 mg/cm 2 fixed, the platinum to carbon volume fraction has the minimum of 0.002 for feasible values.
  • ECSA RLR raises monotonically with the increase in the Pt/C volume fraction within the feasible range of 0.002–1.
  • E ˙ lifts significantly for ε 0.05 , and changes very little for ε 0.4 .
Earlier, in [32], we established higher ECSA RLR for a decrease in the fitting parameters H 1 , fit , U eq , or an increase in U fit , c ref , and in the diffusion coefficient D Pt , as reported in [31].

6. Conclusions

This investigation presents new results of numerical simulation tests carried out in the Holby–Mogran electrokinetic model describing degradation of platinum-based catalyst in polymer electrolyte fuel cells. In particular, with the help of global sensitivity analysis, I determine a range of feasible model parameters, which are selected for testing under accelerated stress cycles. Specific details are discussed with regard to the operating conditions of the temperature and potential of hydrogen, and for material properties of platinum particle size, platinum loading on carbon support, and the platinum to carbon weight ratio. Highlighting the contribution of this work, critical values were observed for parameters that led to physically unfeasible solutions, namely, full coverage of the catalyst by platinum oxide, zero platinum ion concentration, and zero platinum particle diameter under formation of a particle band. Critical factors are a high temperature above 110 °C, a high pH above 1.4, a low particle diameter below 2 nm, and a low platinum to carbon volume when it drops below 0.2%. No unfeasible cases were observed by varying the particle loading. The theoretical findings presented in this work might be helpful for electrochemical engineers, since the research provides modeling hints for mitigation strategies aimed at achieving the catalyst lifetime target, as well as improving the environmental performance of PEMFC.

Funding

This research received no external funding.

Institutional Review Board Statement

Not applicable.

Informed Consent Statement

Not applicable.

Data Availability Statement

Data are contained within the article.

Acknowledgments

The author acknowledges the financial support by the University of Graz.

Conflicts of Interest

The author declares no conflict of interest.

Abbreviations

The following abbreviations are used in this manuscript:
2D/3DTwo/three dimensions
ASTAccelerated stress test
BoL/EoLBeginning/end of life
CCarbon
CLCatalyst layer
CVCyclic voltammetry
ECSAElectrochemical surface area
FCFuel cell
FCH JUFuel cell and hydrogen joint undertaking
GDLGas diffusion layer
HORHydrogen oxidation reaction
LPL/UPLLower/upper potential level
MEAMembrane electrode assembly
OATOne parameter at a time
ORROxygen reduction reaction
PEMPolymer electrolyte membrane/proton exchange membrane
PEMFCPolymer electrolyte fuel cell
pHPotential of hydrogen
PSDParticle size distribution
Pt/PtO/Pt 2 + Platinum/platinum oxide/platinum ion
Pt/CPlatinum on carbon
RLRRatio loss rate
RHRelative humidity
SW/TWSquare/triangle wave

References

  1. Basile, A.; Gupta, R.; Veziroǧlu, T.N. Compendium of Hydrogen Energy: Hydrogen Storage, Distribution and Infrastructure; Woodhead Publishing: Sawston, UK, 2016. [Google Scholar]
  2. Ferrara, A.; Jakubek, S.; Hametner, C. Energy management of heavy-duty fuel cell vehicles in real-world driving scenarios: Robust design of strategies to maximize the hydrogen economy and system lifetime. Energy Convers. Manag. 2021, 232, 113795. [Google Scholar] [CrossRef]
  3. Saravanan, R.; Sobhana, O.; Lakshmanan, M.; Arulkumar, P. Fuel cell electric vehicles equipped with energy storage system for energy management: A hybrid JS-RSA approach. J. Energy Storage 2023, 72, 108646. [Google Scholar] [CrossRef]
  4. Gallo, M.; Marinelli, M. The impact of fuel cell electric freight vehicles on fuel consumption and CO2 emissions: The case of Italy. Sustainability 2022, 14, 13455. [Google Scholar] [CrossRef]
  5. Meier, J.C.; Galeano, C.; Katsounaros, I.; Witte, J.; Bongard, H.J.; Topalov, A.A.; Baldizzone, C.; Mezzavilla, S.; Schüth, F.; Mayrhofer, K.J.J. Design criteria for stable Pt/C fuel cell catalysts. Beilstein J. Nanotechnol. 2014, 5, 44–67. [Google Scholar] [CrossRef]
  6. Eikerling, M.; Kulikovsky, A. Polymer Electrolyte Fuel Cells: Physical Principles of Materials and Operation; Elsevier: Amsterdam, The Netherlands, 2017. [Google Scholar]
  7. Hacker, V.; Mitsushima, S. (Eds.) Fuel Cells and Hydrogen: From Fundamentals to Applied Research; Elsevier: Amsterdam, The Netherlands, 2018. [Google Scholar]
  8. Kulikovsky, A. Analytical Modeling of Fuel Cells; Elsevier: Amsterdam, The Netherlands, 2019. [Google Scholar]
  9. Mench, M.; Kumbur, E.C.; Veziroǧlu, T.N. (Eds.) Polymer Electrolyte Fuel Cell Degradation; Academic Press: Amsterdam, The Netherlands, 2011. [Google Scholar]
  10. Fellner, K.; Kovtunenko, V.A. A singularly perturbed nonlinear Poisson–Boltzmann equation: Uniform and super-asymptotic expansions. Math. Meth. Appl. Sci. 2015, 38, 3575–3586. [Google Scholar] [CrossRef]
  11. Fellner, K.; Kovtunenko, V.A. A discontinuous Poisson–Boltzmann equation with interfacial transfer: Homogenisation and residual error estimate. Appl. Anal. 2016, 95, 2661–2682. [Google Scholar] [CrossRef] [PubMed]
  12. González Granada, J.R.; Kovtunenko, V.A. Entropy method for generalized Poisson–Nernst–Planck equations. Anal. Math. Phys. 2018, 8, 603–619. [Google Scholar] [CrossRef]
  13. Kovtunenko, V.A.; Zubkova, A.V. On generalized Poisson–Nernst–Planck equations with inhomogeneous boundary conditions: A-priori estimates and stability. Math. Meth. Appl. Sci. 2017, 40, 2284–2299. [Google Scholar] [CrossRef]
  14. Kovtunenko, V.A.; Zubkova, A.V. Mathematical modeling of a discontinuous solution of the generalized Poisson–Nernst–Planck problem in a two-phase medium. Kinet. Relat. Mod. 2018, 11, 119–135. [Google Scholar] [CrossRef]
  15. Khludnev, A.M.; Kovtunenko, V.A. Analysis of Cracks in Solids; WIT-Press: Southampton, UK; Boston, UK, 2000. [Google Scholar]
  16. Theiler, A.; Karpenko-Jereb, L. Modelling of the mechanical durability of constrained Nafion membrane under humidity cycling. Int. J. Hydrogen Energy 2015, 40, 9773–9782. [Google Scholar] [CrossRef]
  17. Kneer, A.; Jankovic, J.; Susac, D.; Putz, A.; Wagner, N.; Sabharwal, M.; Secanell, M. Correlation of changes in electrochemical and structural parameters due to voltage cycling induced degradation in PEM fuel cells. J. Electrochem. Soc. 2018, 165, F3241–F3250. [Google Scholar] [CrossRef]
  18. Marcu, A.; Toth, G.; Pietrasz, P.; Waldecker, J. Cathode catalysts degradation mechanism from liquid electrolyte to membrane electrode assembly. Comptes Rendus Chim. 2014, 17, 752–759. [Google Scholar] [CrossRef]
  19. Medvedev, D.A. Current drawbacks of proton-conducting ceramic materials: How to overcome them for real electrochemical purposes. Curr. Opin. Green Sustain. Chem. 2021, 32, 00549. [Google Scholar] [CrossRef]
  20. Cherevko, S.; Kulyk, N.; Mayrhofer, K.J.J. Durability of platinum-based fuel cell electrocatalysts: Dissolution of bulk and nanoscale platinum. Nano Energy 2016, 29, 275–298. [Google Scholar] [CrossRef]
  21. Nondudule, Z.; Chamier, J.; Chowdhury, M. Effect of stratification of cathode catalyst layers on durability of proton exchange membrane fuel cells. Energies 2021, 14, 2975. [Google Scholar] [CrossRef]
  22. Kravos, A.; Kregar, A.; Mayer, K.; Hacker, V.; Katrašnik, T. Identifiability analysis of degradation model parameters from transient CO2 release in low-temperature PEM fuel cell under various AST protocols. Energies 2021, 14, 4380. [Google Scholar] [CrossRef]
  23. Mayur, M.; Gerard, M.; Schott, P.; Bessler, W.G. Lifetime prediction of a polymer electrolyte membrane fuel cell under automotive load cycling using a physically-based catalyst degradation model. Energies 2018, 11, 2054. [Google Scholar] [CrossRef]
  24. Schneider, P.; Sadeler, C.; Scherzer, A.-C.; Zamel, N.; Gerteisen, D. Fast and reliable state-of-health model of a PEM cathode catalyst layer. J. Electrochem. Soc. 2019, 166, F322–F333. [Google Scholar] [CrossRef]
  25. Darling, R.M.; Meyers, J.P. Kinetic model of platinum dissolution in PEMFCs. J. Electrochem. Soc. 2003, 150, A1523–A1527. [Google Scholar] [CrossRef]
  26. Holby, E.F.; Morgan, D. Application of Pt nanoparticle dissolution and oxidation modeling to understanding degradation in PEM fuel cells. J. Electrochem. Soc. 2012, 159, B578–B591. [Google Scholar] [CrossRef]
  27. Holby, E.F.; Sheng, W.; Shao-Horn, Y.; Morgan, D. Pt nanoparticle stability in PEM fuel cells: Influence of particle size distribution and crossover hydrogen. Energy Environ. Sci. 2009, 2, 865–871. [Google Scholar] [CrossRef]
  28. Li, Y.; Moriyama, K.; Gu, W.; Arisetty, S.; Wang, C.Y. A one-dimensional Pt degradation model for polymer electrolyte fuel cells. J. Electrochem. Soc. 2015, 162, F834–F842. [Google Scholar] [CrossRef]
  29. Kovtunenko, V.A.; Karpenko-Jereb, L. Study of voltage cycling conditions on Pt oxidation and dissolution in polymer electrolyte fuel cells. J. Power Sources 2021, 493, 229693. [Google Scholar] [CrossRef]
  30. Kovtunenko, V.A.; Karpenko-Jereb, L. Lifetime of catalyst under voltage cycling in polymer electrolyte fuel cell due to platinum oxidation and dissolution. Technologies 2021, 9, 80. [Google Scholar] [CrossRef]
  31. Karpenko-Jereb, L.; Kovtunenko, V.A. Modeling of the impact of cycling operating conditions on durability of polymer electrolyte fuel cells and its sensitivity analysis. Int. J. Hydrogen Energy 2023, 48, 15646–15656. [Google Scholar] [CrossRef]
  32. Kovtunenko, V.A. Variance-based sensitivity analysis of fitting parameters to impact on cycling durability of polymer electrolyte fuel cells. Technologies 2022, 9, 111. [Google Scholar] [CrossRef]
  33. Pivac, I.; Barbir, F. Impact of shutdown procedures on recovery phenomena of proton exchange membrane fuel cells. Fuel Cells 2020, 160, 185–195. [Google Scholar] [CrossRef]
  34. Goshtasbi, A.; Chen, J.; Waldecker, J.R.; Hirano, S.; Ersal, T. Effective parameterization of PEM fuel cell models—Part I: Sensitivity analysis and parameter identifiability. J. Electrochem. Soc. 2020, 167, 044504. [Google Scholar] [CrossRef]
  35. Kravos, A.; Ritzberger, D.; Tavčar, G.; Hametner, C.; Jakubek, S.; Katrašnik, T. Thermodynamically consistent reduced dimensionality electrochemical model for proton exchange membrane fuel cell performance modelling and control. J. Power Sources 2020, 454, 227930. [Google Scholar] [CrossRef]
  36. Kregar, A.; Frühwirt, P.; Ritzberger, D.; Jakubek, S.; Katrašnik, T.; Gescheidt, G. Sensitivity based order reduction of a chemical membrane degradation model for low-temperature proton exchange membrane fuel cells. Energies 2020, 31, 5611. [Google Scholar] [CrossRef]
  37. Blanco-Cocom, L.; Botello-Rionda, S.; Ordoñez, L.C.; Ivvan Valdez, S. Design optimization and parameter estimation of a PEMFC using nature-inspired algorithms. Soft Comput. 2023, 27, 3765–3784. [Google Scholar] [CrossRef]
  38. Priya, K.; Sathishkumar, K.; Rajasekar, N. A comprehensive review on parameter estimation techniques for Proton Exchange Membrane fuel cell modelling. Renew. Sust. Energ. Rev. 2018, 93, 121–144. [Google Scholar] [CrossRef]
  39. Soomro, I.A.; Memon, F.H.; Mughal, W.; Khan, M.A.; Ali, W.; Liu, Y.; Choi, K.H.; Thebo, K.H. Influence of operating and electrochemical parameters on PEMFC performance: A simulation study. Membranes 2023, 13, 259. [Google Scholar] [CrossRef] [PubMed]
  40. Stropnik, R.; Mlakar, N.; Lotrič, A.; Sekavčnik, M.; Mori, M. The influence of degradation effects in proton exchange membrane fuel cells on life cycle assessment modelling and environmental impact indicators. Int. J. Hydrogen Energy 2022, 47, 24223–24241. [Google Scholar] [CrossRef]
  41. Tochigi, S.; Dowaki, K. Environmental impact assessment of PEM fuel cell combined heat and power generation system for residential application considering cathode catalyst layer degradation. Energies 2023, 16, 1985. [Google Scholar] [CrossRef]
  42. Pandy, A.; Yang, Z.; Gummalla, M.; Atrazhev, V.V.; Kuzminyh, N.Y.; Sultanov, V.I.; Burlatsky, S. A carbon corrosion model to evaluate the effect of steady state and transient operation of a polymer electrolyte membrane fuel cell. J. Electrochem. Soc. 2013, 160, F972–F979. [Google Scholar] [CrossRef]
  43. Burlatsky, S.F.; Gummalla, M.; Atrazhev, V.V.; Dmitriev, D.V.; Kuzminyh, N.Y.; Erikhman, N.S. The dynamics of platinum precipitation in an ion exchange membrane. J. Electrochem. Soc. 2011, 158, B322–B330. [Google Scholar] [CrossRef]
  44. Bi, W.; Gray, G.E.; Fuller, T.F. PEM fuel cell Pt/C dissolution and deposition in Nafion electrolyte. Electrochem. Solid-State Lett. 2007, 10, B101–B104. [Google Scholar] [CrossRef]
  45. Jahnke, T.; Futter, G.A.; Baricci, A.; Rabissi, C.; Casalegno, A. Physical modeling of catalyst degradation in low temperature fuel cells: Platinum oxidation, dissolution, particle growth and platinum band formation. J. Electrochem. Soc. 2020, 167, 013523. [Google Scholar] [CrossRef]
  46. Sethuraman, V.A.; Weidner, J.W.; Haug, A.T.; Motupally, S.; Protsailo, L.V. Hydrogen peroxide formation rates in a PEMFC anode and cathode: Effect of humidity and temperature. J. Electrochem. Soc. 2007, 155, B50–B57. [Google Scholar] [CrossRef]
  47. Yu, K.; Groom, D.J.; Wang, X.; Yang, Z.; Gummalla, M.; Ball, S.C.; Myers, D.J.; Ferreira, P.J. Degradation mechanisms of platinum nanoparticle catalysts in proton exchange membrane fuel cells: The role of particle size. Chem. Mater. 2014, 26, 5540–5548. [Google Scholar] [CrossRef]
Figure 1. Sketch of principal degradation mechanisms.
Technologies 11 00184 g001
Figure 2. Feasible solution: (a) Pt ion concentration c [mol/cm 3 ]. (b) Pt particle diameter d [nm]. (c) PtO coverage ratio θ [1] versus t ( 0 , 1 . 1 ¯ ) [h] and x ( 0 , 10 ) [ μ m].
Technologies 11 00184 g002
Figure 3. RLR parameter E ˙ [ 10 3 /h] dependent on: temperature [°C] (a). pH [1] (b).
Technologies 11 00184 g003
Figure 4. Unfeasible solution at T = 120 °C: (a) Pt ion concentration c [mol/cm 3 ]. (b) Pt particle diameter d [nm]. (c) PtO coverage ratio θ [1] versus t ( 0 , 1 . 1 ¯ ) [h] and x ( 0 , 10 ) [ μ m].
Technologies 11 00184 g004
Figure 5. Unfeasible solution at pH = 1.5: (a) Pt ion concentration c [mol/cm 3 ]. (b) Pt particle diameter d [nm]. (c) PtO coverage ratio θ [1] versus t ( 0 , 1 . 1 ¯ ) [h] and x ( 0 , 10 ) [ μ m].
Technologies 11 00184 g005
Figure 6. RLR parameter E ˙ [ 10 3 /h] in dependence on: Pt particle diameter d Pt [nm] (a). Pt particle loading p Pt [mg/cm 2 ] (b). Pt/C volume fraction ε [1] (c).
Technologies 11 00184 g006
Figure 7. Unfeasible solution at d Pt = 1 nm: (a) Pt ion concentration c [mol/cm 3 ]. (b) Pt particle diameter d [nm]. (c) PtO coverage ratio θ [1] versus t ( 0 , 1 . 1 ¯ ) [h] and x ( 0 , 10 ) [ μ m].
Technologies 11 00184 g007
Figure 8. Unfeasible solution at ε = 0.001 : (a) Pt ion concentration c [mol/cm 3 ]. (b) Pt particle diameter d [nm]. (c) PtO coverage ratio θ [1] versus t ( 0 , 1 . 1 ¯ ) [h] and x ( 0 , 10 ) [ μ m].
Technologies 11 00184 g008
Table 1. Parameters for Pt ion formation and diffusion, and for Pt oxide formation.
SymbolValueUnitsDescription
ν 1 1 × 10 4 HzDissolution attempt frequency
ν 2 8 × 10 5 HzBackward dissolution rate factor
β 1 0.5 Butler transfer coefficient for Pt dissolution
n2 Electrons transferred during Pt dissolution
U eq 1.118VPt dissolution bulk equilibrium voltage
Ω 9.09cm 3 /molMolar volume of Pt
γ 2.4 × 10 4 J/cm 2 Pt [1 1 1] surface tension
c ref 1mol/cm 3 Reference Pt ion concentration
H 1 , fit 4.4 × 10 4 J/molpartial molar Pt dissolution activation enthalpy
D Pt 1 × 10 6 cm 2 /sDiffusion coefficient of Pt ion in the membrane
ν 1 1 × 10 4 HzForward Pt oxide formation rate constant
ν 2 2 × 10 2 HzBackward Pt oxide formation rate constant
Γ 2.2 × 10 9 mol/cm 2 Pt surface site density
β 2 0.5 Butler transfer coefficient for PtO formation
n 2 2 Electrons transferred during Pt oxide formation
U fit 0.8VPt oxide formation bulk equilibrium voltage
λ 2 × 10 4 J/molPt oxide dependent kinetic barrier constant
ω 5 × 10 4 J/molPt oxide-oxide interaction energy
H 2 , fit 1.2 × 10 4 J/molPartial molar oxide formation activation enthalpy
Table 2. Parameters for cathode catalyst layer.
SymbolValueUnitsDescription
T353.15KTemperature
p H 0 Potential of hydrogen
d Pt 3 × 10 7 cmPt particle diameter
p Pt 4 × 10 4 g/cm 2 Pt particles loading
ε 0.02 Pt/C volume fraction
ρ Pt 21.45g/cm 3 Pt particles density
Disclaimer/Publisher’s Note: The statements, opinions and data contained in all publications are solely those of the individual author(s) and contributor(s) and not of MDPI and/or the editor(s). MDPI and/or the editor(s) disclaim responsibility for any injury to people or property resulting from any ideas, methods, instructions or products referred to in the content.

