Article

Detecting Airborne Pathogens: A Computational Approach Utilizing Surface Acoustic Wave Sensors for Microorganism Detection

by
Sharon P. Varughese
1,
S. Merlin Gilbert Raj
2,
T. Jesse Joel
1 and
Sneha Gautam
3,4,*
1
Department of Biotechnology, Karunya Institute of Technology and Sciences, Coimbatore 641114, India
2
Department of ECE, Karunya Institute of Technology and Sciences, Coimbatore 641114, India
3
Department of Civil Engineering, Karunya Institute of Technology and Sciences, Coimbatore 641114, India
4
Water Institute, A Centre of Excellence, Karunya Institute of Technology and Sciences, Coimbatore 641114, India
*
Author to whom correspondence should be addressed.
Technologies 2023, 11(5), 135; https://doi.org/10.3390/technologies11050135
Submission received: 29 August 2023 / Revised: 25 September 2023 / Accepted: 28 September 2023 / Published: 2 October 2023
(This article belongs to the Section Environmental Technology)

Abstract

:
The persistent threat posed by infectious pathogens remains a formidable challenge for humanity. Rapidly spreading infectious diseases caused by airborne microorganisms have far-reaching global consequences, imposing substantial costs on society. While various detection technologies have emerged, including biochemical, immunological, and molecular approaches, these methods still exhibit significant limitations such as time-intensive procedures, instability, and the need for specialized operators. This study presents an innovative solution that harnesses the potential of surface acoustic wave (SAW) sensors for the detection of airborne microorganisms. The research involves the establishment of a sensor model within the framework of COMSOL Multiphysics, utilizing a predefined piezoelectric multi-physics interface and employing a 2D modeling approach. Chitosan, selected as the sensing film for the model, interfaces with lithium niobate (LiNbO3), the chosen piezoelectric material responsible for detecting airborne pathogens. The analysis of microbe presence centers on solid displacement and electric potential frequencies, operating within the 850–900 MHz range. Notably, the first and second resonant frequencies are identified at 856 and 859 MHz, respectively. To enhance understanding, this study proposes a novel mathematical model grounded in Stokes’ Law and mass balance equations. This model serves to analyze microbe concentration, offering a fresh perspective on quantifying the presence of airborne pathogens. Through these endeavors, this research contributes to advancing the field of airborne microorganism detection, offering a promising avenue for addressing the challenges posed by infectious diseases.

1. Introduction

Infectious pathogens continue to pose substantial challenges to humanity, with rapidly spreading diseases caused by airborne microorganisms leading to significant global costs [1]. Recent advancements in airborne microorganism detection technology encompass biochemical, immunological, and molecular methods [2]. Despite progress, these techniques exhibit limitations such as time-intensive procedures, instability, and reduced sensitivity. Airborne microbes, capable of transmission through exhalation and prolonged viability in the air, underline the importance of monitoring and understanding their presence in the environment to effectively combat airborne diseases. However, many existing technologies are constrained to controlled laboratory settings, limiting their practicality.
Biosensors play a pivotal role in detecting specific analytes in chemical or biological reactions, generating signals proportional to analyte concentration [3]. These devices vary based on biorecognition element types and physicochemical transduction modes, including optical, electrochemical, piezoelectric, and thermal modes [4,5,6,7]. Electrochemical biosensors further encompass amperometric, conductometric, and potentiometric categories [8,9,10]. Leveraging the rapid analysis time, high sensitivity, portability, specificity, and cost-effectiveness of biosensors, diverse advancements have been introduced for bio-detection [11,12,13]. Surface acoustic wave (SAW) biosensors, particularly those based on cells or aptamers, demonstrate specialization and rapid response, though they demand specialized tools and expertise for development and maintenance.
Surface-generated acoustic wave (SGAW) technology, including Love wave (LW) devices, emerges as a promising biosensing avenue. LW devices involve thin guiding layers over substrates, alongside inter-digital transducers (IDTs), operating efficiently in gaseous and liquid environments [14,15]. SGAW devices offer advantages like shorter detection times, increased convenience, and higher flexibility for on-site air sample detection. Notably, SAW devices possess a high-quality factor (Q) in piezoelectric single crystals, enabling passive input signal storage and efficient operation in contact with liquids [16].
This article introduces several key contributions to airborne pathogen detection: (1) a novel surface acoustic wave sensing approach utilizing chitosan as a sensing film; (2) demonstrating chitosan’s capacity to immobilize and damage airborne pathogens, affecting cell membranes and metabolic processes; (3) proposing a mathematical model combining Stokes and mass balance equations for analyzing microbe presence; (4) employing finite element simulation software to investigate SAW sensing for airborne microbe detection using chitosan; and (5) studying SAW modes at 856 and 859 MHz for different microbe densities.
The demand for a swift, cost-effective detection strategy operated by non-specialized personnel underscores the significance of SAW biosensors. These sensors offer rapid and precise pathogen detection, presenting a viable alternative to intricate laboratory procedures. Improved SAW biosensors with enhanced sensing films hold the potential to detect even minute analyte quantities with heightened accuracy.

2. Materials and Methods

2.1. Airborne Pathogen Characterization

Airborne pathogens comprise microorganisms that are commonly associated with airborne particles, often combined with other constituents like dust or water due to their scarcity as isolated entities. To discern their characteristics, particle size analysis experiments were conducted, revealing that the average diameter of bacterial airborne particles exceeds 5 μm [17]. In this study, we employed an average-sized bacterium model, approximating a mass of approximately one picogram (1 pg) and assuming a simplified spherical structure. This choice was made as we were only considering a single unit cell for the simulation. To estimate the volume, we applied the formula governing the volume of a sphere, as detailed in reference [18].
Volume = (4 ÷ 3) × 3.1416 × (0.5 µm)3 ≈ 0.5236 µm3
Leveraging the derived mass and volume, we proceeded to compute the density of the microbe:
Density = Mass ÷ Volume = 1 pg ÷ 0.5236 µm3
For the sake of streamlined unit comparison, we capitalized on the equivalence between 1 µm3 and 1 picoliter (pl), alongside the correspondence between 1 picogram (pg) and 1 femtogram (fg):
Density = (1 fg) ÷ (0.5236 pl) ≈ 1.91 fg/pl
Since the mathematical model considers the flow of air to be in laminar, as the particle size is assumed to be uniform.

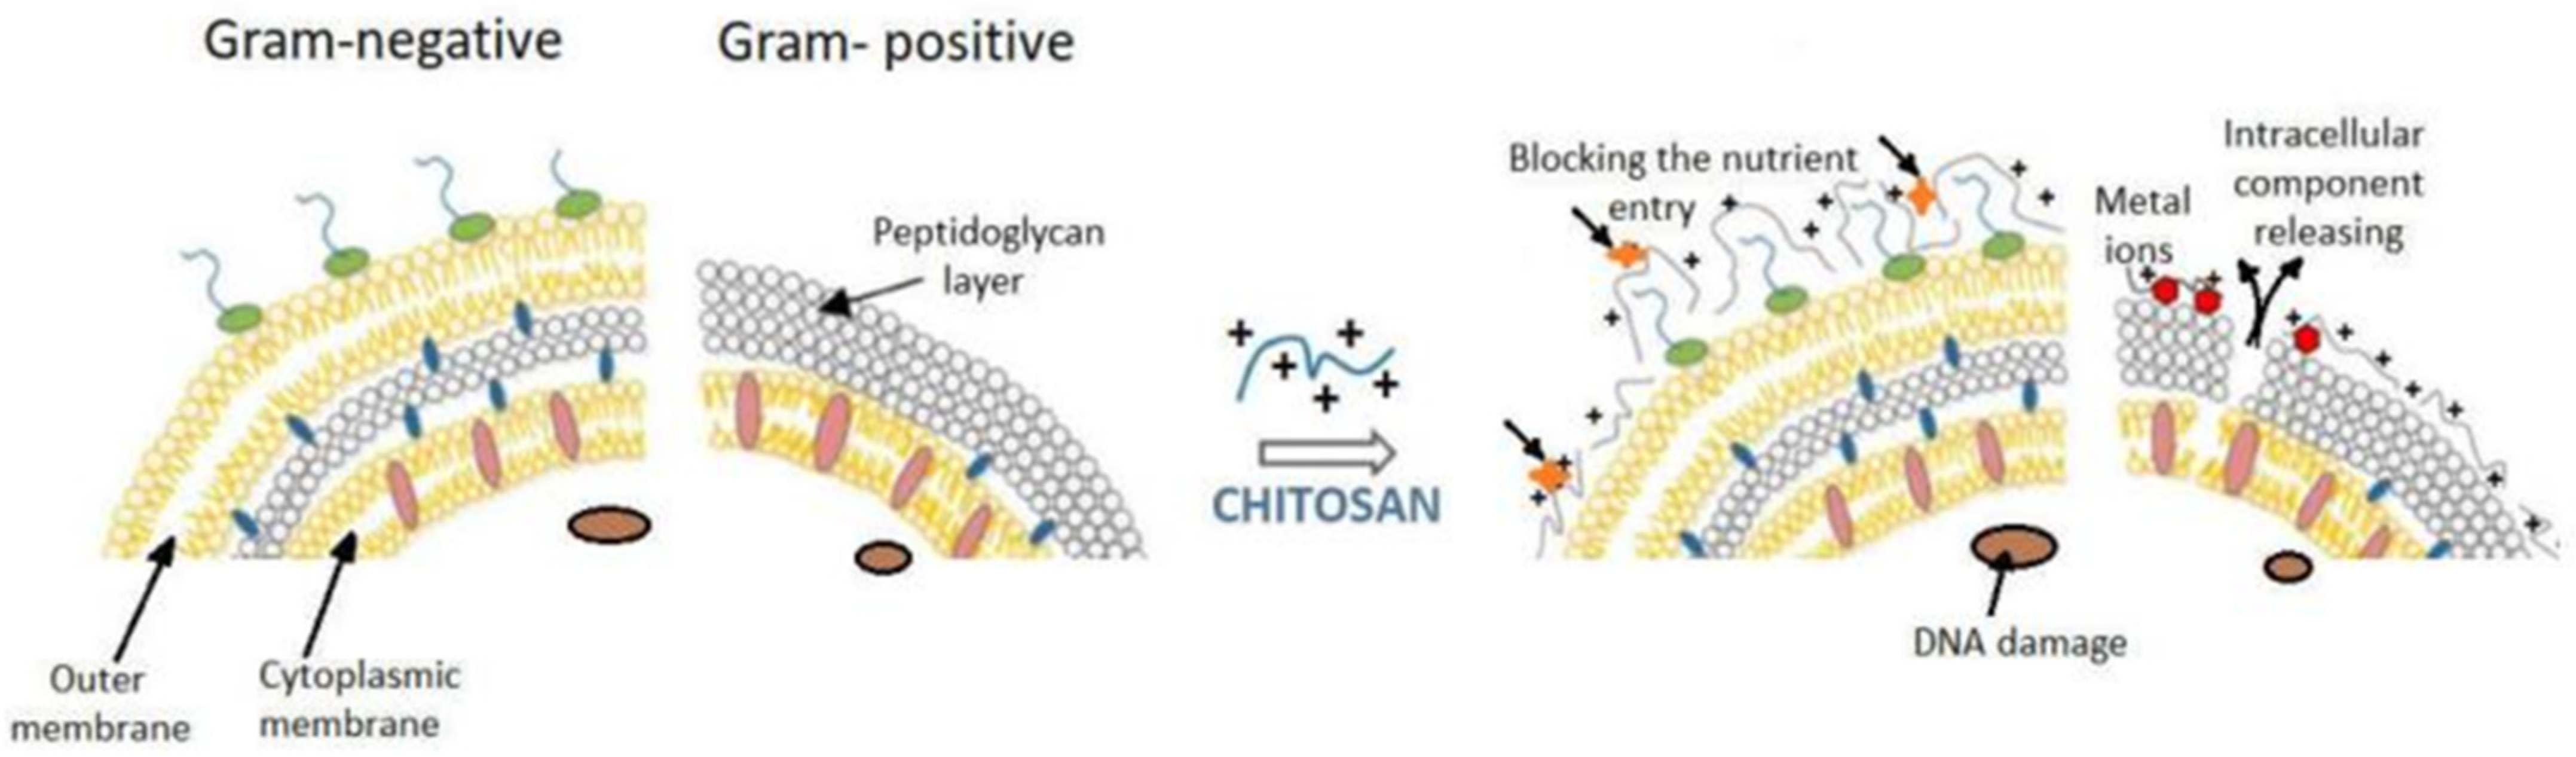
2.2. Sensing Layer Selection:

Chitosan, a versatile material, was chosen as the sensing film for the surface acoustic wave (SAW) model (Table 1). Chitosan boasts attributes that render it well suited for air microbe detection, including biocompatibility, biodegradability, and biomolecular interaction capabilities. One innovative approach involves utilizing chitosan as a sponge to immobilize airborne pathogens. The interaction between chitosan and cell membranes culminates in cell death, accentuating its antimicrobial potential. Additionally, chitosan intervenes in the metabolic processes of pathogens, augmenting its antimicrobial efficacy. Ionic and hydrophobic interactions are thought to exert a substantial influence on the disruption or rupture of cell membranes. Gram-negative bacteria, characterized by a greater hydrophilic nature, often exhibit heightened sensitivity to chitosan, although certain studies suggest that the antibacterial efficacy may be more pronounced against Gram-positive bacteria (Figure 1) [19]. Our working hypothesis suggests that when such interactions take place, they may induce deformations in surface waves. Consequently, changes in surface acoustic waves could potentially serve as a discernible indicator of the presence or absence of microbes on the chitosan surface.

2.3. Substrate Selection—Lithium Niobate (LiNbO3)

Lithium niobate (LiNbO3) stands as a pivotal piezoelectric material in surface acoustic wave (SAW) sensing due to its remarkable properties. SAW devices, rooted in the conversion of electrical signals into surface-traveling acoustic waves, demonstrate heightened sensitivity to environmental alterations, rendering them invaluable for diverse sensing applications. Lithium Niobate’s impressive attributes include robust piezoelectric properties, notably high electromechanical coupling coefficients and low insertion losses. These qualities facilitate efficient conversion of electrical signals into mechanical vibrations and vice versa. Crucially, lithium niobate exhibits exceptional SAW sensing capabilities and maintains stability at elevated temperatures, making it suitable for harsh environment applications. For our simulations, a YZ-cut LiNbO3 substrate with a Rayleigh wave velocity (vR) approximating 3488 m/s was employed, defining a lower frequency limit for the SAW at around 872 MHz [25].

2.4. Inter-Digital Transducers (IDTs)—A1 Electrodes

Inter-digital transducers (IDTs) serve as a vital component within SAW sensors. These transducers consist of comb-like arrays of metallic electrodes, applied onto the surface of a piezoelectric substrate like Lithium Niobate. Operating on the principles of the piezoelectric effect, these electrodes transform electric signals into SAWs by inducing periodic mechanical forces. This process operates in reverse as well, where IDTs convert SAWs back into electric signals, serving as output transducers. With dual functionality as both emitters and receivers of SAWs, IDTs play a crucial role. In our simulation, aluminum was chosen as the IDT material due to its attributes, including high electrical conductivity, low acoustic impedance, and elevated thermal stability [26].

2.5. Multi-Physics Simulation Using COMSOL Multiphysics

To comprehend the intricate dynamics of the system, COMSOL Multiphysics was employed. This robust software empowers users to design, simulate, and analyze intricate physical systems encompassing diverse physics phenomena. Leveraging the finite element method (FEM), a numerical technique for solving partial differential equations, COMSOL facilitates the creation of models, physics definition, geometry meshing, and simulation resolution. This tool enables researchers and engineers to gain insights into system behavior, optimize designs, and make informed decisions.

2.6. Mathematical Model for Air Microbe Detection

Building upon the insights shared by Pepper and Gerba [17] regarding aero-microbiology and particle settling using the Stokes equation, we extended this understanding to analyze the deposition of pathogens via airborne transmission. The application of the Stokes equation enabled us to investigate the interaction of pathogens with surfaces within a dispersing medium like air or water. This mathematical model enhanced our comprehension of air microbe detection dynamics.
V s = D 2 × ρ p ρ 1 × g 18 ρ
This equation represents an expression for the terminal velocity ( V s ) of a particle falling through a fluid, known as Stokes’ Law. V s represents the terminal velocity of the particle in the fluid, which is the constant velocity reached by the particle when the drag force from the fluid equals the gravitational force acting on the particle, and the net acceleration becomes zero (Figure 2). D represents the diameter of the particle. ρ p represents the density of the particle. ρ 1 represents the density of the fluid (usually air or another gas) through which the particle is falling. g represents the acceleration due to gravity, and ρ represents the fluid’s dynamic viscosity.
Stokes’ Law finds common application in elucidating the movement of diminutive particles (such as droplets, particles, or bubbles) within a fluid environment, where drag forces predominantly govern motion due to particle size and density factors [27]. Its broad utility extends to diverse realms, including fluid dynamics, particle physics, environmental science, and engineering, enabling the computation of particles’ terminal velocities and prognosis of their conduct within varying fluid settings.
However, it is vital to recognize that the applicability of Stokes’ Law is contingent upon specific conditions, notably at low Reynolds numbers (Re). In cases where fluid flow remains laminar and the particle Reynolds number remains markedly below 1, Stokes’ Law prevails [28]. For scenarios outside this scope, alternative equations or models prove more fitting for particles or fluid conditions.
Stokes’ Law fundamentally characterizes the motion of small particles in fluid, devoid of considerations for surface interactions. The introduction of a surface alters the dynamics, incorporating supplementary forces like the impact force and particle–surface interactions. Consequently, the adaptation of Stokes’ Law becomes essential to encompass these additional forces and accurately model the behavior of particles interacting with surfaces.
To include the added mass effect, the fluid density (ρ) was modified as follows:
ρ = ρ × [ 1 + ( ρ p ÷ ρ s ) ]
where ρ p represents the density of the surface onto which the particle is falling. Equation (2) modifies the fluid density ( ρ ) by incorporating the ratio of particle density ( ρ p ) to surface material density ( ρ s ) . This equation assumes that the added mass effect can be approximated by considering the particle and surface material densities. The added mass effect assumes that the particle experiences an additional force due to the acceleration of the surrounding fluid caused by the particle’s impact on the surface. This additional force acts in the opposite direction to the particle’s motion and can significantly affect the particle’s terminal velocity.
The modified equation for the terminal velocity of a particle falling onto a surface, taking into account the added mass effect, can be written as Equation (3).
V s = D 2 × ρ p ρ 1 × g 18 ρ 1 + ρ p ρ s
It is important to note that this modification is a simplification and may not accurately represent the behavior of particles falling onto different types of surfaces or under different conditions, as Stokes’ Law is valid for laminar flow. A mass balance equation can be used to find the concentration of a microbe in air with the help of velocity. The mass balance equation relates the change in the concentration rate of particles in a given volume of air to the rate of removal or addition of particles in that volume of air. Mathematically, the mass balance equation can be written as Equation (4).
d C d t = q V + G V
where dC/dt represents change in the rate of concentration of particles with respect to time (e.g., particles/m3/s). q represents the rate of particle removal (e.g., due to settling or filtration) from the volume of air under consideration (e.g., m3/s). V represents the volume of air under consideration (e.g., m3). G represents the rate of addition of particles (e.g., due to particle emission or entrainment) into the volume of air under consideration (e.g., particles/m3/s).
Assuming a steady-state condition (Stokes’ law is only valid for laminar flow) where the rate of particle removal (q) is equal to the rate of particle addition (G), the mass balance equation can be simplified to Equation (5):
C = q V
where C represents the concentration of particles in the air (e.g., particles/m3).
Therefore, to determine the rate of particle removal (q) from a volume of air, the settling velocity (Vs) of particles can be used. The settling velocity represents the rate at which particles settle due to gravity, and can be related to the rate of particle removal using the following Equation (6):
q = A × V s × C
where A represents the cross-sectional area of the volume of air under consideration (e.g., m2), and Vs represents the settling velocity of particles (e.g., m/s). Therefore, the concentration of pathogens in the air can be expressed as Equation (7).
C = q V = A × V s × C V
and solving for C gives:
C = V s × A V
where Vs represents the settling velocity of particles (e.g., m/s), A represents the cross-sectional area of the volume of air under consideration (e.g., m2), and V represents the volume of air under consideration (e.g., m3).
It is important to note that this equation assumes that the particle concentration is uniform throughout the volume of air under consideration, and that the particle size and density are constant. Additionally, other factors such as turbulence, particle aggregation, and particle re-suspension can also affect the particle concentration and should be considered when applying this equation. Furthermore, considering particle deposition in the chitosan, the concentration of the pathogens on the chitosan layer is systematically studied by applying Equation (3) in (8), and the resultant expression is given by Equation (9).
C = D 2 × ρ p ρ 1 × g 18 ρ 1 + ρ p ρ s × A V
The shift is determined by comparing the resonance frequency before and after the density of the absorbed microbe is added on the chitosan film by adding variable ‘switch’.
ρ a d s = ρ s × s w i t c h × C
where ρ a d s is adsorption of microbes in chitosan, ρ s is the density of chitosan (pure) = 1.425 gm/cm3. If switch = 1, adsorbed microbe on the chitosan film is present, if switch = 0, adsorbed microbe on the chitosan film is absent.

2.7. Proposed Surface Acoustic Sensing Method

Surface acoustic wave (SAW) sensors, integral to microelectromechanical systems (MEMS), are characterized by their ability to harness surface acoustic waves to perceive physical phenomena. Unlike electrical signals, these sensors transform an input electrical signal into a mechanical wave, rendering them more receptive to the influence of various physical factors. The device subsequently reconveys this mechanical wave back into an electrical signal, translating the detected phenomenon into a measurable output.
Surface acoustic waves (SAWs) represent guided waves traversing the top surface of a material, with their wave vectors oriented perpendicular to the normal direction of the surface. SAW sensors are intricately crafted around these waves, capitalizing on piezoelectric crystals to engender guided elasto-dynamic waves through an intricate electromechanical coupling mechanism. This coupling comes to fruition through the integration of inter-digitated electrode transducers (IDT) with the piezoelectric crystals, facilitating a spectrum of active and passive operational modes.
The SAW sensor configuration encompasses crucial components, including an inter-digitated electrode (IDT) that harnesses the piezoelectric effect to translate periodically distributed mechanical forces into electrical signals, a piezoelectric LiNbO3 substrate, and a specialized sensing film, with chitosan interacting selectively with the airborne microbe. A cross-sectional view exposes the internal design details.
SAW devices exhibit sensitivity to variations in material properties through which they propagate, including factors like density and elasticity. When air microbes make contact with the chitosan surface (the sensing element), they have the capability to modify the propagation characteristics of SAWs. The interdigitated transducer is responsible for detecting and converting the acoustic wave generated by the piezoelectric material, such as Lithium Niobate, into electrical signals. Any alterations in the wave caused by external influences are subsequently identified as changes in the received electrical signal. This received signal is then subjected to processing and analysis to discern the nature of the interaction between airborne pathogens and the chitosan layer’s surface.

2.8. FEM Simulation

Eigenfrequency analysis is a methodology employed to ascertain the resonant frequencies and corresponding mode shapes of a given structure or device. Concurrently, delving into the characteristics of electric potential distribution furnishes invaluable insights into the dynamics of an electrical system (Table 2). Scrutinizing this distribution elucidates the spatial spread of the electrical field across the system, pinpointing regions with heightened or diminished potential.
Formulating a robust model requires the integration of both structural and electrical boundary conditions (Table 2). Considering that surface waves attenuate within a few wavelengths from the surface, the lower boundary is rendered immovable, enforcing zero structural displacement. This measure minimizes the reflection of waves back into the substrate bulk, particularly when dealing with surface waves like Rayleigh waves.
The electrodes exhibit superior electrical conductivity compared to materials such as chitosan and LiNbO3. This distinction allows us to treat each electrode as isopotential. Consequently, explicit modeling of the electrode domains becomes unnecessary. Instead, appropriate boundary conditions are applied to the outer limits of each electrode, accurately reflecting their respective isopotential states. While the left terminal boundaries are anchored to electrical ground, the right terminal boundaries adopt a floating potential configuration, preventing the accumulation of surface charge. This blend of electrical boundary conditions emulates an open-circuit setup, typically conducive to sensing applications.
For the implementation of periodic boundary conditions, aligning electric potentials and displacements along both vertical boundaries is essential. Achieving this parity involves meshing the left vertical boundaries and using the Copy Edge function to replicate this identical mesh on the corresponding right vertical boundaries. Ensuring uniformity in the meshes across the unit cell’s vertical borders is paramount. Remaining boundaries retain their default conditions, encompassing free for the Solid Mechanics interface and zero charge for the Electrostatics interface [25]. Throughout the simulation, chitosan’s role was envisaged as that of a sponge, capturing and interacting with airborne microorganisms in the environment.

3. Results and Discussion

Accurately determining the density of an airborne microbe hinges on unraveling the individual microbe’s mass and its corresponding volume. However, this endeavor is notably challenging owing to the minute and variable size of these microorganisms. With bacteria spanning a size range from a few microns (μm) to several tens of microns, coupled with their mass typically resting in the realm of picograms (10−12 g) or less, a precise assessment becomes intricate.
Shifting our focus to the resonance frequency, we initiated the investigation by evaluating the resonance frequency prior to and following the introduction of absorbed microbes onto the chitosan film. This was executed by introducing the variable ‘switch’, which embarked on two distinctive states:
  • Case 1: switch = 0: no adsorbed microbes on the chitosan film
  • Case 2: switch = 1: presence of adsorbed microbes on the chitosan film
These two cases furnished the backdrop for our resonance frequency shift analysis, facilitating insights into the dynamic interplay between chitosan film and absorbed microbes.
Resonant frequencies critical for the analysis of air microbes using SAW spanned the 850–900 MHz range. Specifically, the analysis encompassed the observation of two distinct resonant frequencies: 856 MHz and 859 MHz. The visualization and exploration of the electric potential distribution across the designated system were facilitated through both 2D and 3D plots. These plots offered a comprehensive depiction of the distribution’s characteristics and furnished pivotal insights into the SAW device’s electrical attributes, as aptly illustrated in Figure 3. This distribution portrayal was pivotal as it unravelled the intricate spatial dynamics of the electrical field within the system, enabling the identification of zones marked by elevated or reduced potential.
A parallel endeavor to visualize and scrutinize the deformation and displacement exhibited by solid structures under diverse conditions was realized through the generation of 2D and 3D plots. Figure 4, Figure 5, Figure 6 and Figure 7 serves as a testament to this fact. This visualization delivers a profound comprehension of how distinct parameters—ranging from material properties and geometry to applied forces—exercise their influence over surface deformation. This visual insight arms us with the capacity to meticulously assess the intricate interplay of these factors, substantially enriching our understanding of system behavior.
Table 3 captures the shifts in resonant frequency resulting from the shifts in density due to the introduction of airborne microbes. The marginal adjustments in resonant frequencies, irrespective of the microbes’ presence, cast a spotlight on the potential limitations of relying solely on pure chitosan as the sensing material for the SAW device. For heightened efficacy, the augmentation of the material’s electrical conductivity and surface area has emerged as a strategic move. The integration of graphene or carbon nanotubes stands as a promising avenue, buoyed by their remarkable attributes: high sensitivity, low detection thresholds, and robust biocompatibility. These attributes collectively endorse their suitability for diverse sensing applications, painting a path toward elevated performance.

4. Conclusions: Advancing SAW Sensor Simulation and Future Prospects

In the course of this study, our focus revolved around the simulation of a SAW Sensor employing the versatile capabilities of COMSOL. This intricate simulation entailed the integration of a chitosan sensing layer and aluminum-based IDTs, harmoniously woven with the piezoelectric prowess of LiNbO3 to generate and intercept surface acoustic waves. These SAW devices possess the remarkable capacity to selectively interact with specific analytes—microbes in this context—yielding indispensable insights into their presence and concentration levels. To unlock this potential, we harnessed mathematical expressions like the Stokes equation and mass balance equation, skillfully adapting them to our tailored SAW sensor configuration. This intricate equation ensemble facilitated an in-depth exploration of the interplay between the chitosan sensing layer and the targeted microbes. Through COMSOL’s dynamic simulation capabilities, we observed and dissected the propagation of surface acoustic waves, the intricate dance between the chitosan layer and microbes, and the consequent shifts in resonant frequencies.
The rationale behind this exploration is rooted in the quest for an accessible, cost-effective method to detect airborne pathogens. While our initial findings indicated that the sensitivity of pure chitosan in detecting microbes requires enhancement, the door to advancement is wide open. Alterations in geometry and IDT structure hold the potential to elicit significant changes in resonating frequencies. Augmenting the chitosan film with additional materials emerges as a promising avenue. Incorporating nanoparticles like gold, silver, or graphene oxide could substantially amplify the sensitivity and selectivity of chitosan-based SAW sensors. Moreover, the fusion of carbon nanotubes or polymers such as polyvinyl alcohol into chitosan films stands poised to bolster their mechanical robustness and stability.
It is prudent to acknowledge that Stokes’ Law assumes uniform particle concentration throughout the air volume under scrutiny, alongside constant particle size and density. Factoring in turbulence, particle aggregation, and resuspension is imperative when applying this equation. Thus, its adaptation must encompass these additional influences for a comprehensive understanding.
The potential of SAW technology reaches even further when coupled with RFID (Radio Frequency Identification). In this synergy, the reader’s radio wave emissions metamorphose into surface acoustic waves on the SAW chip surface through the process of IDTs. These encoded acoustic wave pulses traverse wave reflectors and a dedicated sensing material, ultimately generating unique acoustic wave pulses. These pulses, in turn, journey back to the IDT, metamorphosing into encoded radio wave reply signals destined for the reader. A key strength of the SAW chip lies in its adept utilization of the piezoelectric phenomenon, negating the need for DC power. This inherent efficiency contributes to its economic viability compared to alternative technologies. The fabrication of a SAW sensor finds resonance in techniques such as lithography, laser micromachining, and spinning methods, each offering avenues for sensor realization.
This study presents an innovative approach that underscores the potential of surface acoustic wave (SAW) sensors for the detection of airborne microorganisms, utilizing chitosan as a key sensing layer. Nevertheless, it is essential to acknowledge certain limitations, including the use of a mathematical model under laminar conditions and the observation that pure chitosan, in isolation, did not exhibit the desired effectiveness. This research opens up avenues for further exploration, including the incorporation of the Navier–Stokes equation to create a more realistic pathogen behavior model. Additionally, integrating an antigen or antibody onto the chitosan layer (the sensing layer) could enhance the sensor’s specificity. With the introduction of the target antigen or antibody to the sensing element, it binds to its immobilized counterpart, leading to the generation of a measurable signal. These proposed directions offer exciting prospects for advancing the capabilities of SAW sensors in pathogen detection.
As this exploration continues to unfold, the synergy between simulation, innovation, and practical realization holds the promise of transformative strides in the realm of SAW sensing, rendering the detection of airborne pathogens, and beyond, an accessible and potent pursuit.

Author Contributions

Conceptualization, S.M.G.R. and S.G.; methodology, S.P.V., S.M.G.R. and S.G.; software, S.P.V.; validation, S.M.G.R. and S.G.; formal analysis, S.P.V.; investigation, S.G.; resources, T.J.J.; data curation, S.P.V. and S.M.G.R.; writing—original draft preparation, S.G. and S.M.G.R.; writing—review and editing, S.G.; visualization, T.J.J.; supervision, S.G. and S.M.G.R.; project administration, T.J.J.; funding acquisition, T.J.J. All authors have read and agreed to the published version of the manuscript.

Funding

This research received no external funding.

Institutional Review Board Statement

Not applicable.

Informed Consent Statement

Not applicable.

Data Availability Statement

Data will be shared on request.

Acknowledgments

The researchers are grateful for the support and assistance from the Karunya Institute of Technology and Sciences, TN, India, in submitting the work.

Conflicts of Interest

The authors declare that they have no known financial conflicts of interest or interpersonal ties that would affect the research presented in this study.

References

  1. Dillon, C.F.; Dillon, M.B. Multi-Scale Airborne Infectious Disease Transmission. Appl. Env. Environ. Microbiol. 2021, 87, e02314-20. [Google Scholar] [CrossRef]
  2. Ma, J.; Du, M.; Wang, C.; Xie, X.; Wang, H.; Zhang, Q. Advances in airborne microorganisms detection using biosensors: A critical review. Front. Environ. Sci. Eng. 2021, 15, 47. [Google Scholar] [CrossRef] [PubMed]
  3. Bhalla, N.; Jolly, P.; Formisano, N.; Estrela, P. Introduction to biosensors. Essays Biochem. 2016, 60, 1–8. [Google Scholar] [CrossRef] [PubMed]
  4. Singh, A.; Sharma, A.; Ahmed, A.; Sundramoorthy, A.K.; Furukawa, H.; Arya, S.; Khosla, A. Recent Advances in Electrochemical Biosensors: Applications, Challenges, and Future Scope. Biosensors 2021, 11, 336. [Google Scholar] [CrossRef] [PubMed]
  5. Sivakumar, R.; Lee, N.Y. Recent advances in airborne pathogen detection using optical and electrochemical biosensors. Anal. Chim. Acta 2022, 1234, 340297. [Google Scholar] [CrossRef] [PubMed]
  6. Banks, J.M.; Capistrano, K.; Thakkar, P.; Ranade, H.; Soni, V.; Datta, M.; Naqvi, A.R. Chapter 3-Current molecular diagnostics assays for SARS-CoV-2 and emerging variants. In Methods in Microbiology; Pavia, C.S., Gurtler, V., Eds.; Academic Press: Cambridge, MA, USA, 2022; Volume 50, pp. 83–121. ISSN 0580-9517. ISBN 9780323850612. [Google Scholar] [CrossRef]
  7. Ramanathan, K.; Rank, M.; Svitel, J.; Dzgoev, A.; Danielsson, B. The development and applications of thermal biosensors for bioprocess monitoring. Trends Biotechnol. 1999, 17, 499–505. [Google Scholar] [CrossRef] [PubMed]
  8. Pohanka, M. Overview of Piezoelectric Biosensors, Immunosensors and DNA Sensors and Their Applications. Materials 2018, 11, 448. [Google Scholar] [CrossRef] [PubMed]
  9. Sadeghi, S.J. Amperometric Biosensors. In Encyclopedia of Biophysics; Roberts, G.C.K., Ed.; Springer: Berlin/Heidelberg, Germany, 2013. [Google Scholar] [CrossRef]
  10. Yunus, S.; Jonas, A.M.; Lakard, B. Potentiometric Biosensors. In Encyclopedia of Biophysics; Roberts, G.C.K., Ed.; Springer: Berlin/Heidelberg, Germany, 2013. [Google Scholar] [CrossRef]
  11. Dzyadevych, S.; Jaffrezic-Renault, N. 6-Conductometric biosensors. In Biological Identification; Schaudies, R.P., Ed.; Woodhead Publishing: Sawston, UK, 2014; pp. 153–193. ISBN 9780857095015. [Google Scholar] [CrossRef]
  12. Naresh, V.; Lee, N. A Review on Biosensors and Recent Development of Nanostructured Materials-Enabled Biosensors. Sensors 2021, 21, 1109. [Google Scholar] [CrossRef] [PubMed]
  13. Ning, Y.; Hu, J.; Lu, F. Aptamers used for biosensors and targeted therapy. Biomed. Pharmacother. Biomed. Pharmacother. 2020, 132, 110902. [Google Scholar] [CrossRef] [PubMed]
  14. Huang, Y.; Das, P.K.; Bhethanabotla, V.R. Surface acoustic waves in biosensing applications. Sens. Actuators Rep. 2021, 3, 100041. [Google Scholar] [CrossRef]
  15. Du, J.; Harding, G.L.; Ogilvy, J.A.; Dencher, P.R.; Lake, M. A study of Love-wave acoustic sensors. Sens. Actuators A Phys. 1996, 56, 211–219. [Google Scholar] [CrossRef]
  16. Rocha-Gaso, M.I.; March-Iborra, C.; Montoya-Baides, Á.; Arnau-Vives, A. Surface Generated Acoustic Wave Biosensors for the Detection of Pathogens: A Review. Sensors 2009, 9, 5740–5769. [Google Scholar] [CrossRef] [PubMed]
  17. Pepper, I.L.; Gerba, C.P. Aeromicrobiology. In Environmental Microbiology; Academic Press: Cambridge, MA, USA, 2015; pp. 89–110. [Google Scholar] [CrossRef]
  18. Dulbecco, D.; Ginsberg, E. Bacterial Physiology: Microbiology, 2nd ed.; Harper and Row: MD, New York, USA, 1973; pp. 96–97. [Google Scholar]
  19. Ardean, C.; Davidescu, C.M.; Nemeş, N.S.; Negrea, A.; Ciopec, M.; Duteanu, N.; Negrea, P.; Duda-Seiman, D.; Musta, V. Factors Influencing the Antibacterial Activity of Chitosan and Chitosan Modified by Functionalization. Int. J. Mol. Sci. 2021, 22, 7449. [Google Scholar] [CrossRef] [PubMed]
  20. Kravanja, G.; Primožič, M.; Knez, Ž.; Leitgeb, M. Chitosan-based (Nano)materials for Novel Biomedical Applications. Molecules 2019, 24, 1960. [Google Scholar] [CrossRef] [PubMed]
  21. Mushi, N.E.; Utsel, S.; Berglund, L.A. Nanostructured biocomposite films of high toughness based on native chitin nanofibers and chitosan. Front. Chem. 2014, 2, 99. [Google Scholar] [CrossRef] [PubMed]
  22. Le, H.R.; Qu, S.; Mackay, R.E.; Rothwell, R. Fabrication and mechanical properties of chitosan composite membrane containing hydroxyapatite particles. J. Adv. Ceram. 2012, 1, 66–71. [Google Scholar] [CrossRef]
  23. Aryaei, A.; Jayatissa, A.H.; Jayasuriya, A.C. Nano and micro mechanical properties of uncross-linked and cross-linked chitosan films. J. Mech. Behav. Biomed. Mater. 2012, 5, 82–89. [Google Scholar] [CrossRef] [PubMed]
  24. Lima, C.G.A.; De Oliveira, R.S.; Figueiró, S.D.; Wehmann, C.F.; Góes, J.C.; Sombra, A.S.B. DC conductivity and dielectric permittivity of collagen–chitosan films. Mater. Chem. Phys. 2006, 99, 284–288. [Google Scholar] [CrossRef]
  25. Available online: https://www.comsol.com/model/surface-acoustic-wave-gas-sensor-2129 (accessed on 21 July 2023).
  26. Mamishev, A.V.; Sundara-Rajan, K.; Yang, F.; Du, Y.; Zahn, M. Interdigital sensors and transducers. Proc. IEEE 2004, 92, 808–845. [Google Scholar] [CrossRef]
  27. Gregersen, E. Stoke’s Law. Encyclopedia Britannica. Available online: https://www.britannica.com/science/Stokess-law (accessed on 9 April 2021).
  28. Subhasish, D.; Zeeshan, A.S.; Ellora, P. Terminal fall velocity: The legacy of Stokes from the perspective of fluvial hydraulics. Proc. R. Soc. A 2019, 475, 20190277. [Google Scholar]
Figure 1. Model that proposes chitosan’s action against Gram-positive and Gram-negative bacteria (Kravanja et al., 2019 [20]).
Technologies 11 00135 g001
Figure 2. Illustration of Terminal Velocity and Drag Force.
Technologies 11 00135 g002
Figure 3. Three-Dimensional Representation of the SAW Sensor Design.
Technologies 11 00135 g003
Figure 4. Two-Dimensional Distribution of Electric Potential Across the SAW System at Resonant Frequencies: 856 MHz and 859 MHz.
Technologies 11 00135 g004
Figure 5. Two-Dimensional Model depicting Solid Displacement and Deformation across the Surface of the SAW System at Resonant Frequencies: 856 MHz and 859 MHz.
Technologies 11 00135 g005
Figure 6. Three-Dimensional Model Illustrating Surface Solid Displacement of the SAW System at Resonant Frequencies: 856 MHz and 859 MHz.
Technologies 11 00135 g006
Figure 7. Three-Dimensional Model depicting Electric Potential Distribution and Deformation, Centered around Each Electrode, at Resonant Frequencies: 856 MHz and 859 MHz.
Technologies 11 00135 g007
Table 1. Characteristics of Chitosan.
Ref.PropertiesValues
[21]Density1.425 g/cm3
[22]Young’s Modulus (cross-linked)7.06 MPa
[23]Poisson’s Ratio1.3
[24]Relative Permittivity (1 GHz)2.71
Table 2. Design Parameters and Simulation Attributes for Finite Element Method (FEM) Simulation of the Proposed Model.
NameExpressionValueDescription
A31.4 cm20.00314 m2Cross-sectional area of volume of air
D0.1 µm1 × 10−7 mDiameter of microbe
V628 cm36.28 × 10−4 m3Volume of air
e_chsan0.007 GPa7 × 106 PaYoung’s modulus of chitosan
eps_chsan2.912.91Relative permittivity of chitosan [850 MHz]
nu_chsan1.31.3Poisson’s Ratio of chitosan
t_chsan0.5 µm5 × 10−7 mChitosan thickness
g9.81 m/s29.81 m/s2Acceleration due to gravity
ρ 1.849 × 10⁻⁵ µ3.0703 × 10⁻³² kgDynamic Viscosity of air (25 °C)
ρ 1 1.83 × 10⁻⁴ poise1.83 × 10−5 kg/(m·s)Density of air through which particle is falling
ρ p 1.91 fg/pl0.00191 kg/m3Density of microbe
ρ s 1.425 g/cm31425 kg/m3Density of chitosan
Vs D 2   ×   ρ p     ρ 1   ×   g 18 ρ 1   +   ρ p ρ s m/s3.3579 × 1016 Velocity of fall of microbes onto the chitosan layer
CVs × A/V microbes/m31.6789 × 1017Concentration of microbe in chitosan
(microbes/m3)
switch0, 11Switch for adding microbe density
ρ a d s ρ s + switch × C microbes/m31425Adsorption of microbes in chitosan
height23 µm2.3 × 10−5 mHeight of unit cell
width4 µm4 × 10−6 mWidth of unit cell
vR3488 m/s3488 m/sRayleigh wave velocity
f0vR/width8.72 × 108 1/sEstimated SAW frequency
Table 3. Alterations in SAW Modes with Respect to Air Microbe Density.
No. of Microbes/DensityEigen
Frequency (Hz)
Switch = 0,
Frequency (Hz)
Switch = 1,
Frequency (Hz)
18.565194884964089 × 1088.565194884964089 × 1088.565194884964098 × 108
8.598910950429227 × 1088.598910950429227 × 1088.598910950429237 × 108
108.565194884964098 × 1088.565194884964098 × 1088.565194884964089 × 108
8.598910950429237 × 1088.598910950429237 × 1088.598910950429227 × 108
1008.565194884964089 × 1088.565194884964089 × 1088.565194884964089 × 108
8.598910950429229 × 1088.598910950429229 × 1088.598910950429227 × 108
10008.565194884964098 × 1088.565194884964098 × 1088.565194884964089 × 108
8.598910950429237 × 1088.598910950429237 × 1088.598910950429229 × 108
10,0008.565194884964098 × 1088.565194884964098 × 1088.565194884964089 × 108
8.598910950429237 × 1088.598910950429237 × 1088.598910950429229 × 108
100,0008.565194884964089 × 1088.565194884964089 × 1088.565194884964089 × 108
8.598910950429229 × 1088.598910950429229 × 1088.598910950429229 × 108
Disclaimer/Publisher’s Note: The statements, opinions and data contained in all publications are solely those of the individual author(s) and contributor(s) and not of MDPI and/or the editor(s). MDPI and/or the editor(s) disclaim responsibility for any injury to people or property resulting from any ideas, methods, instructions or products referred to in the content.

