

Multi-Scale CNN: An Explainable AI-Integrated Unique Deep Learning Framework for Lung-Affected Disease Classification

 , , ,
, , ,  ,
,  and
and 
Abstract
:1. Introduction
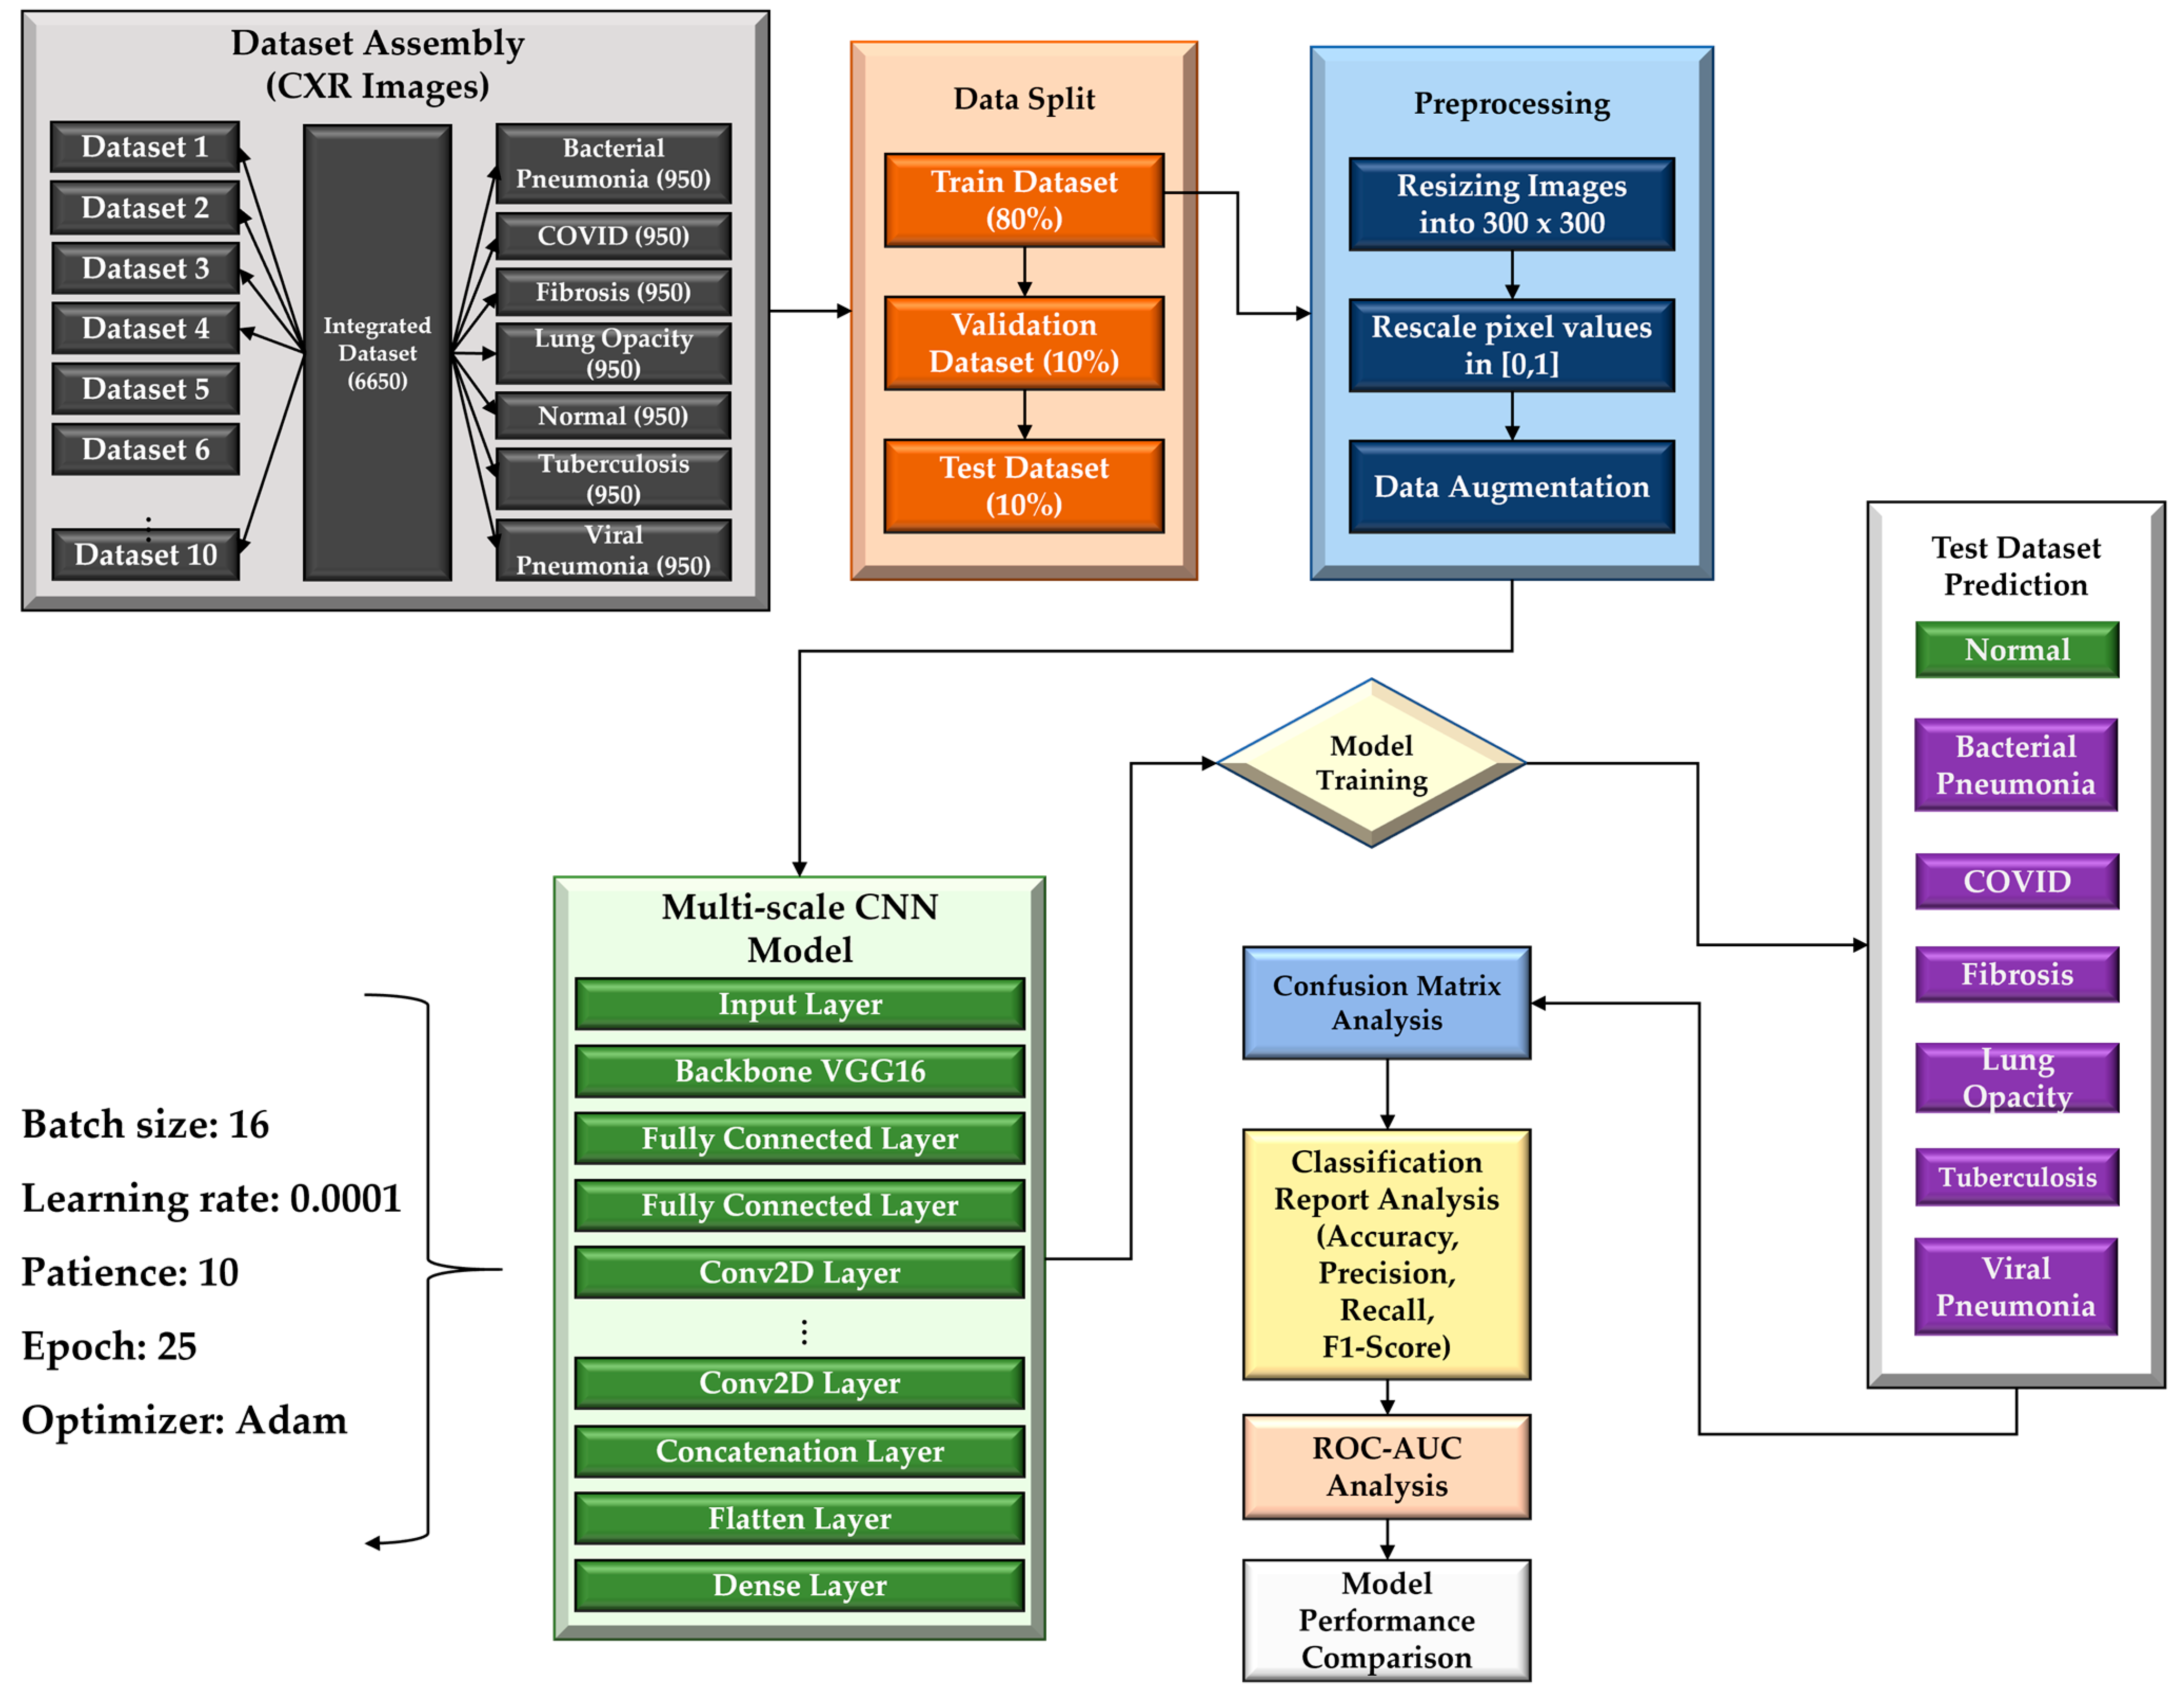
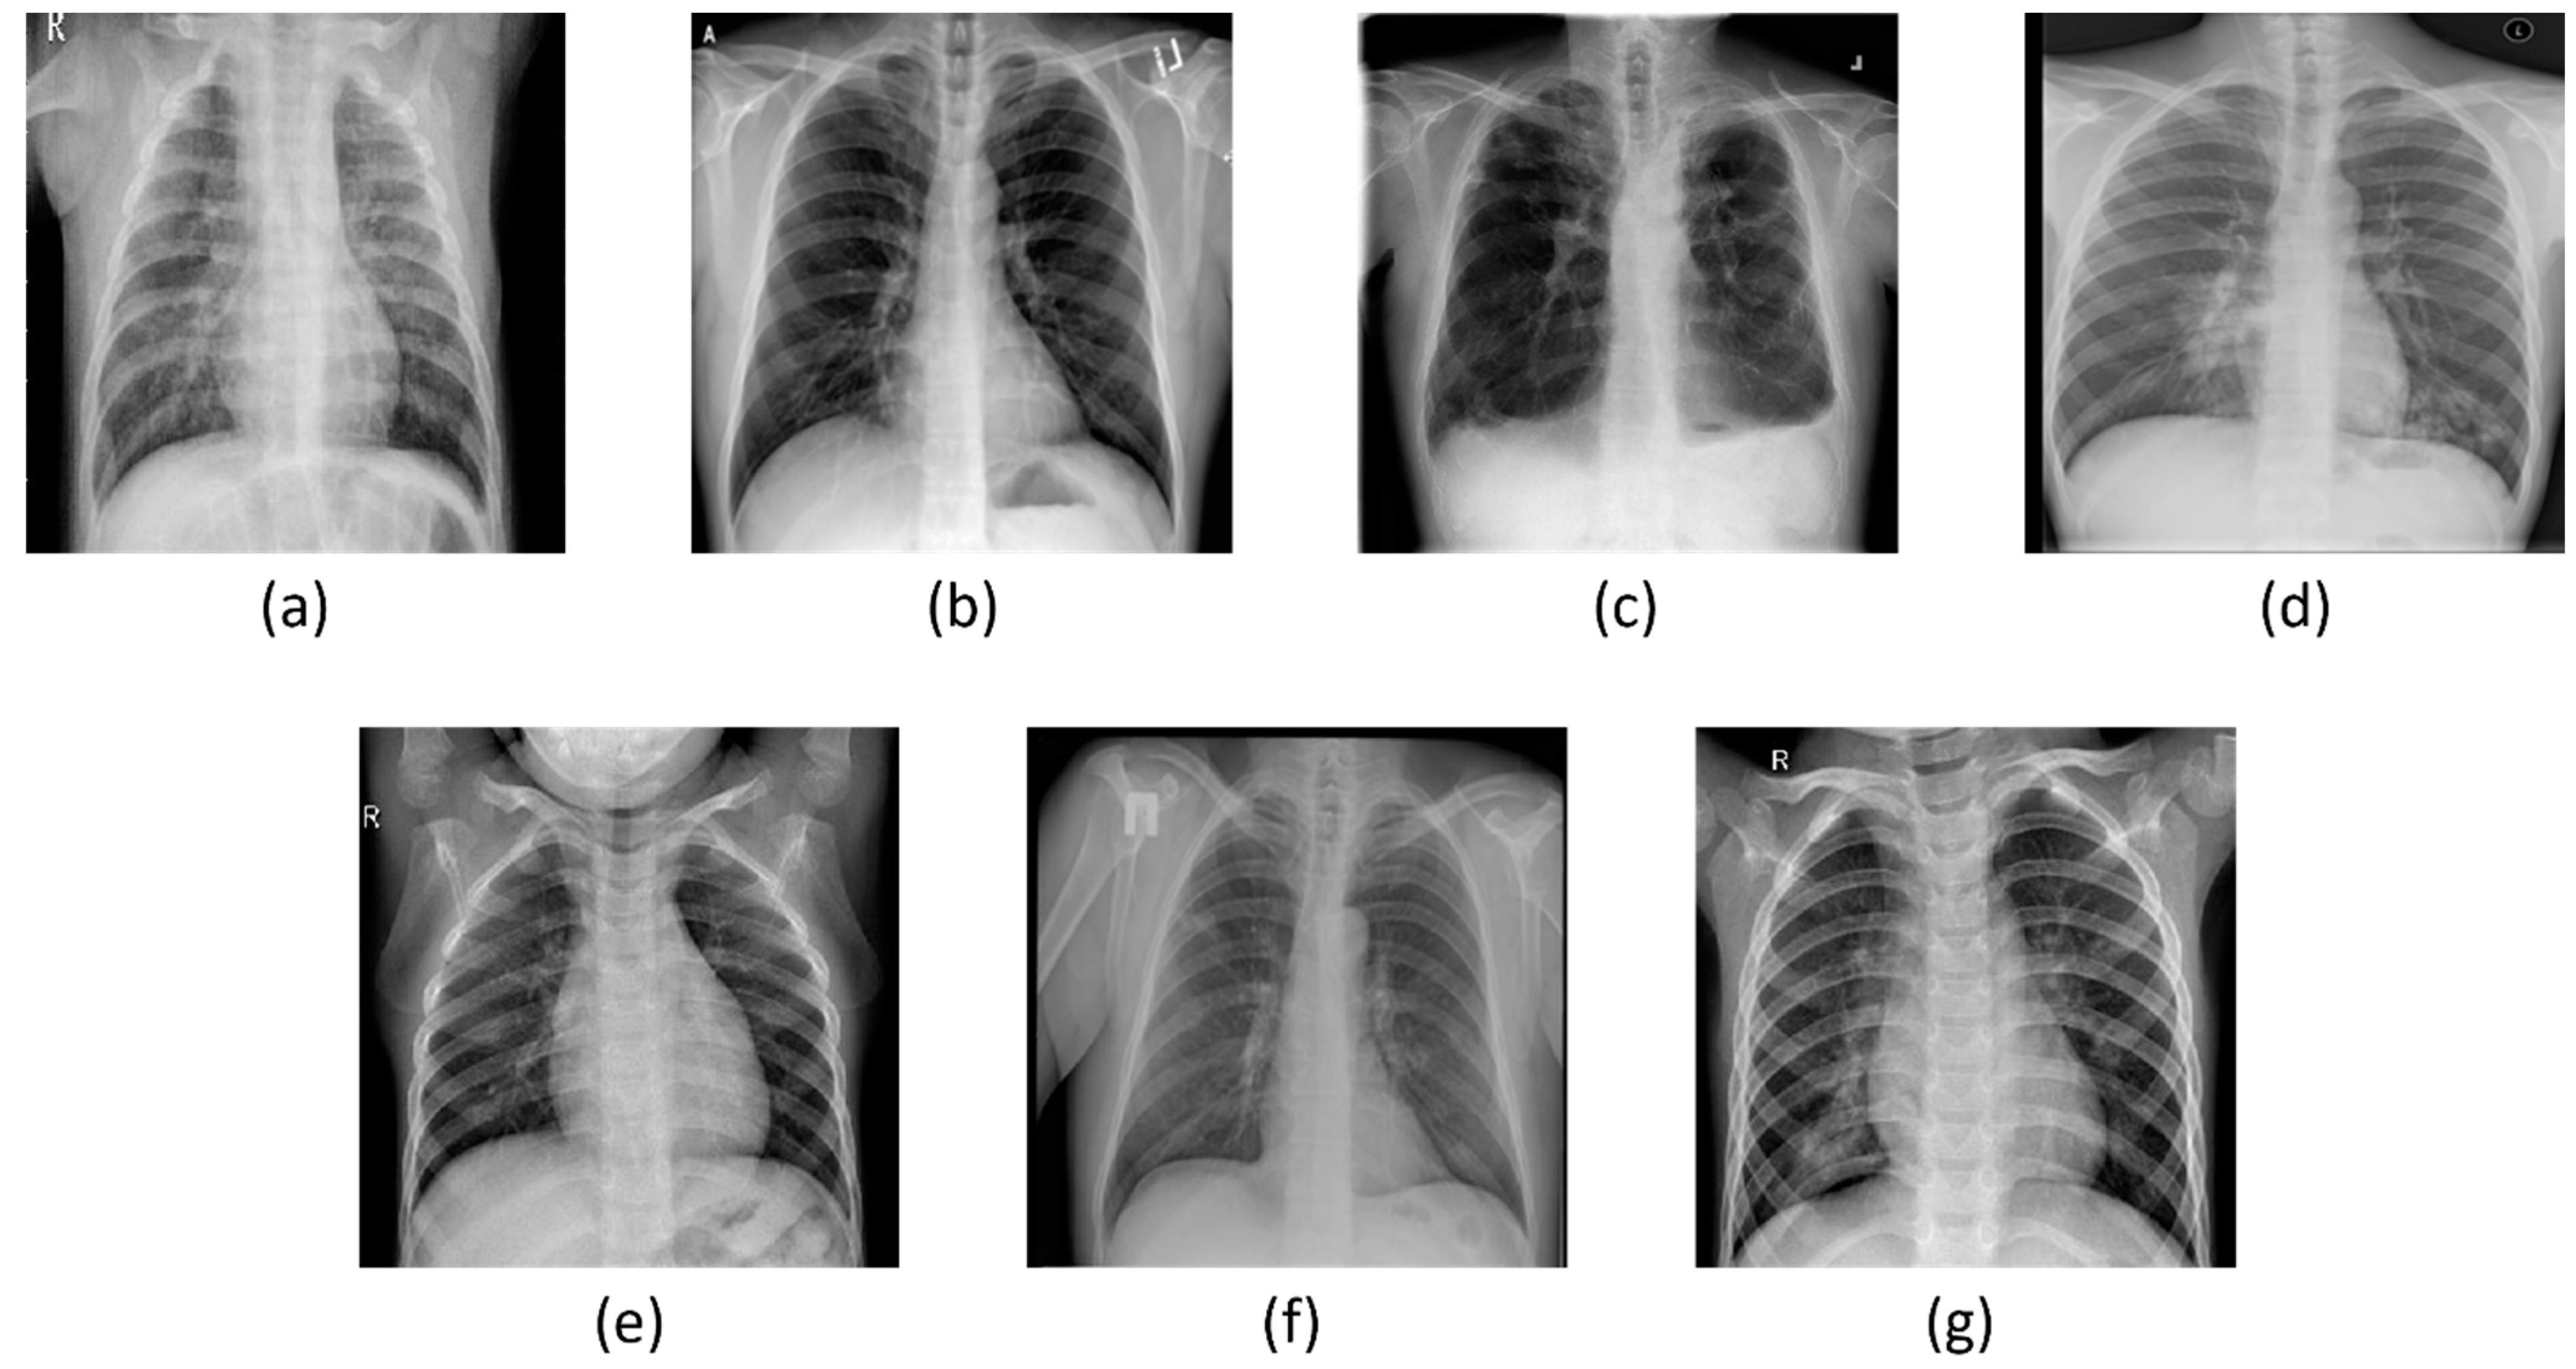
- To create a comprehensive dataset encompassing seven distinct classes (COVID-19, normal, viral pneumonia, bacterial pneumonia, fibrosis, lung opacity, and tuberculosis), four publicly available datasets were combined.
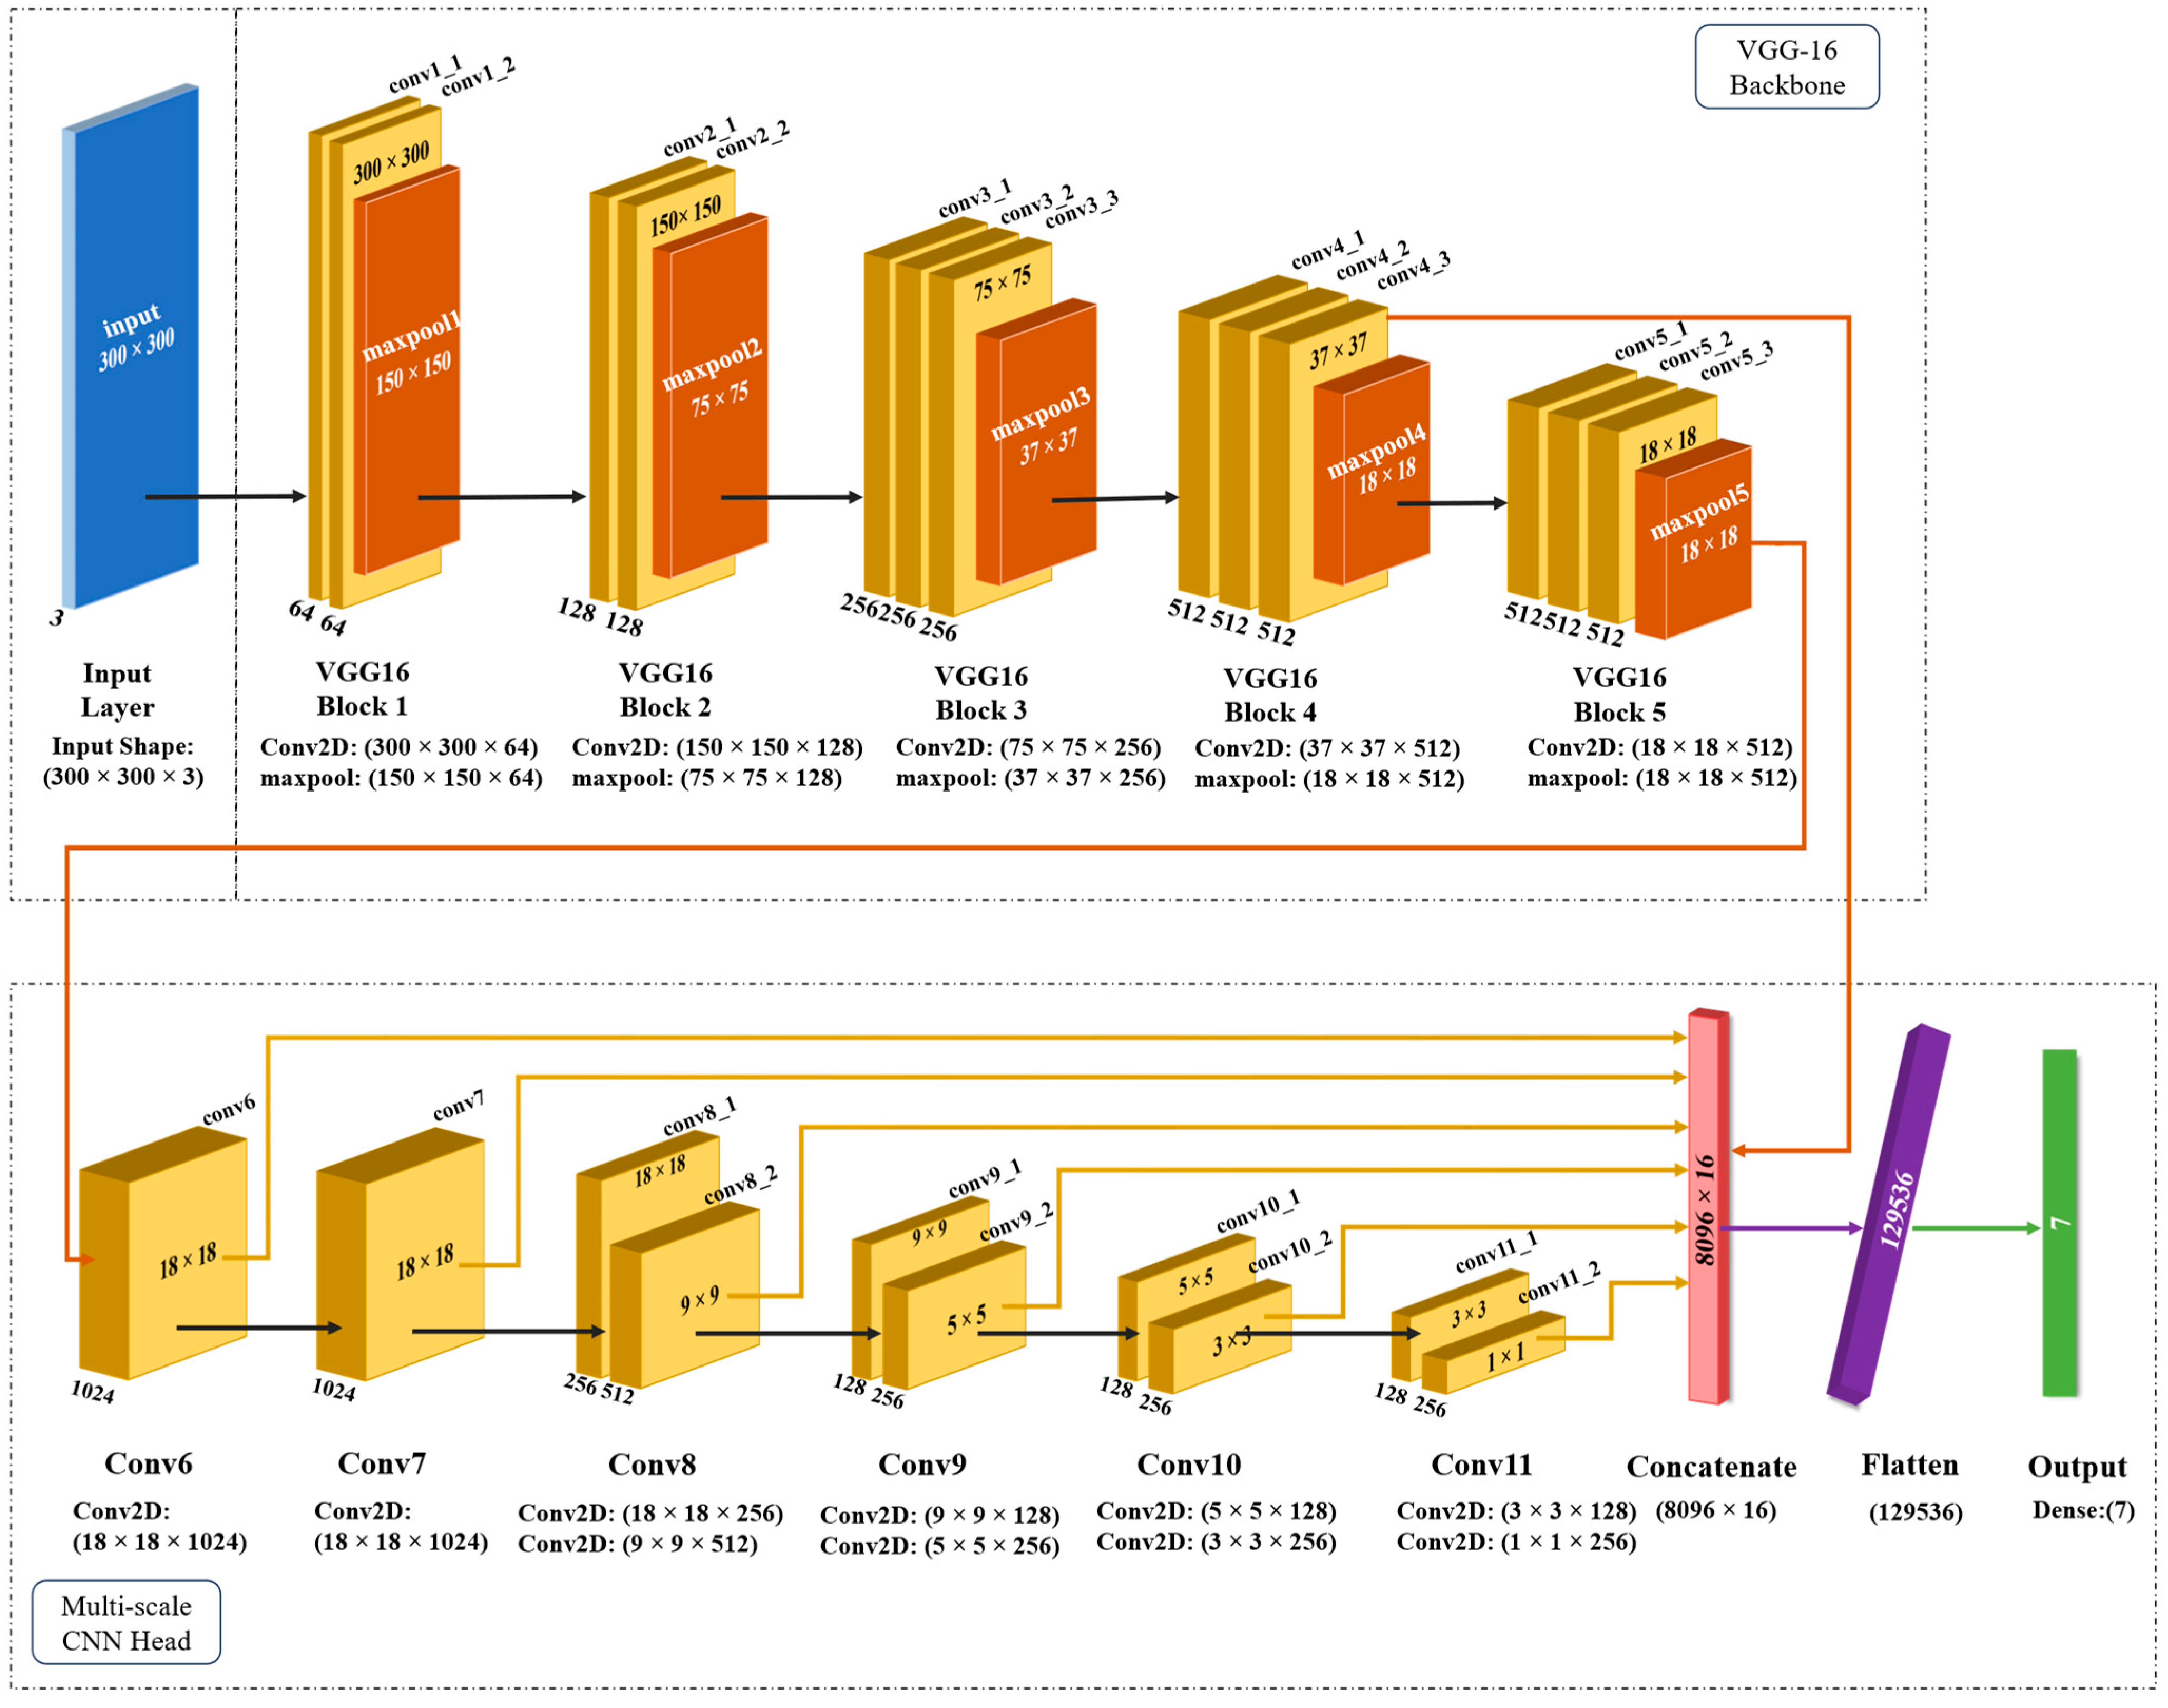
- An MS-CNN model is proposed to detect six lung-related disorders and healthy patients from the CXR images where predictions from different layers are combined, avoiding any instances of overlooking or omitting important predictions.
- Predictions from several layers are concatenated to create a variety of feature maps that operate at various resolutions in order to improve the accuracy and effectiveness of multi-class predictions.
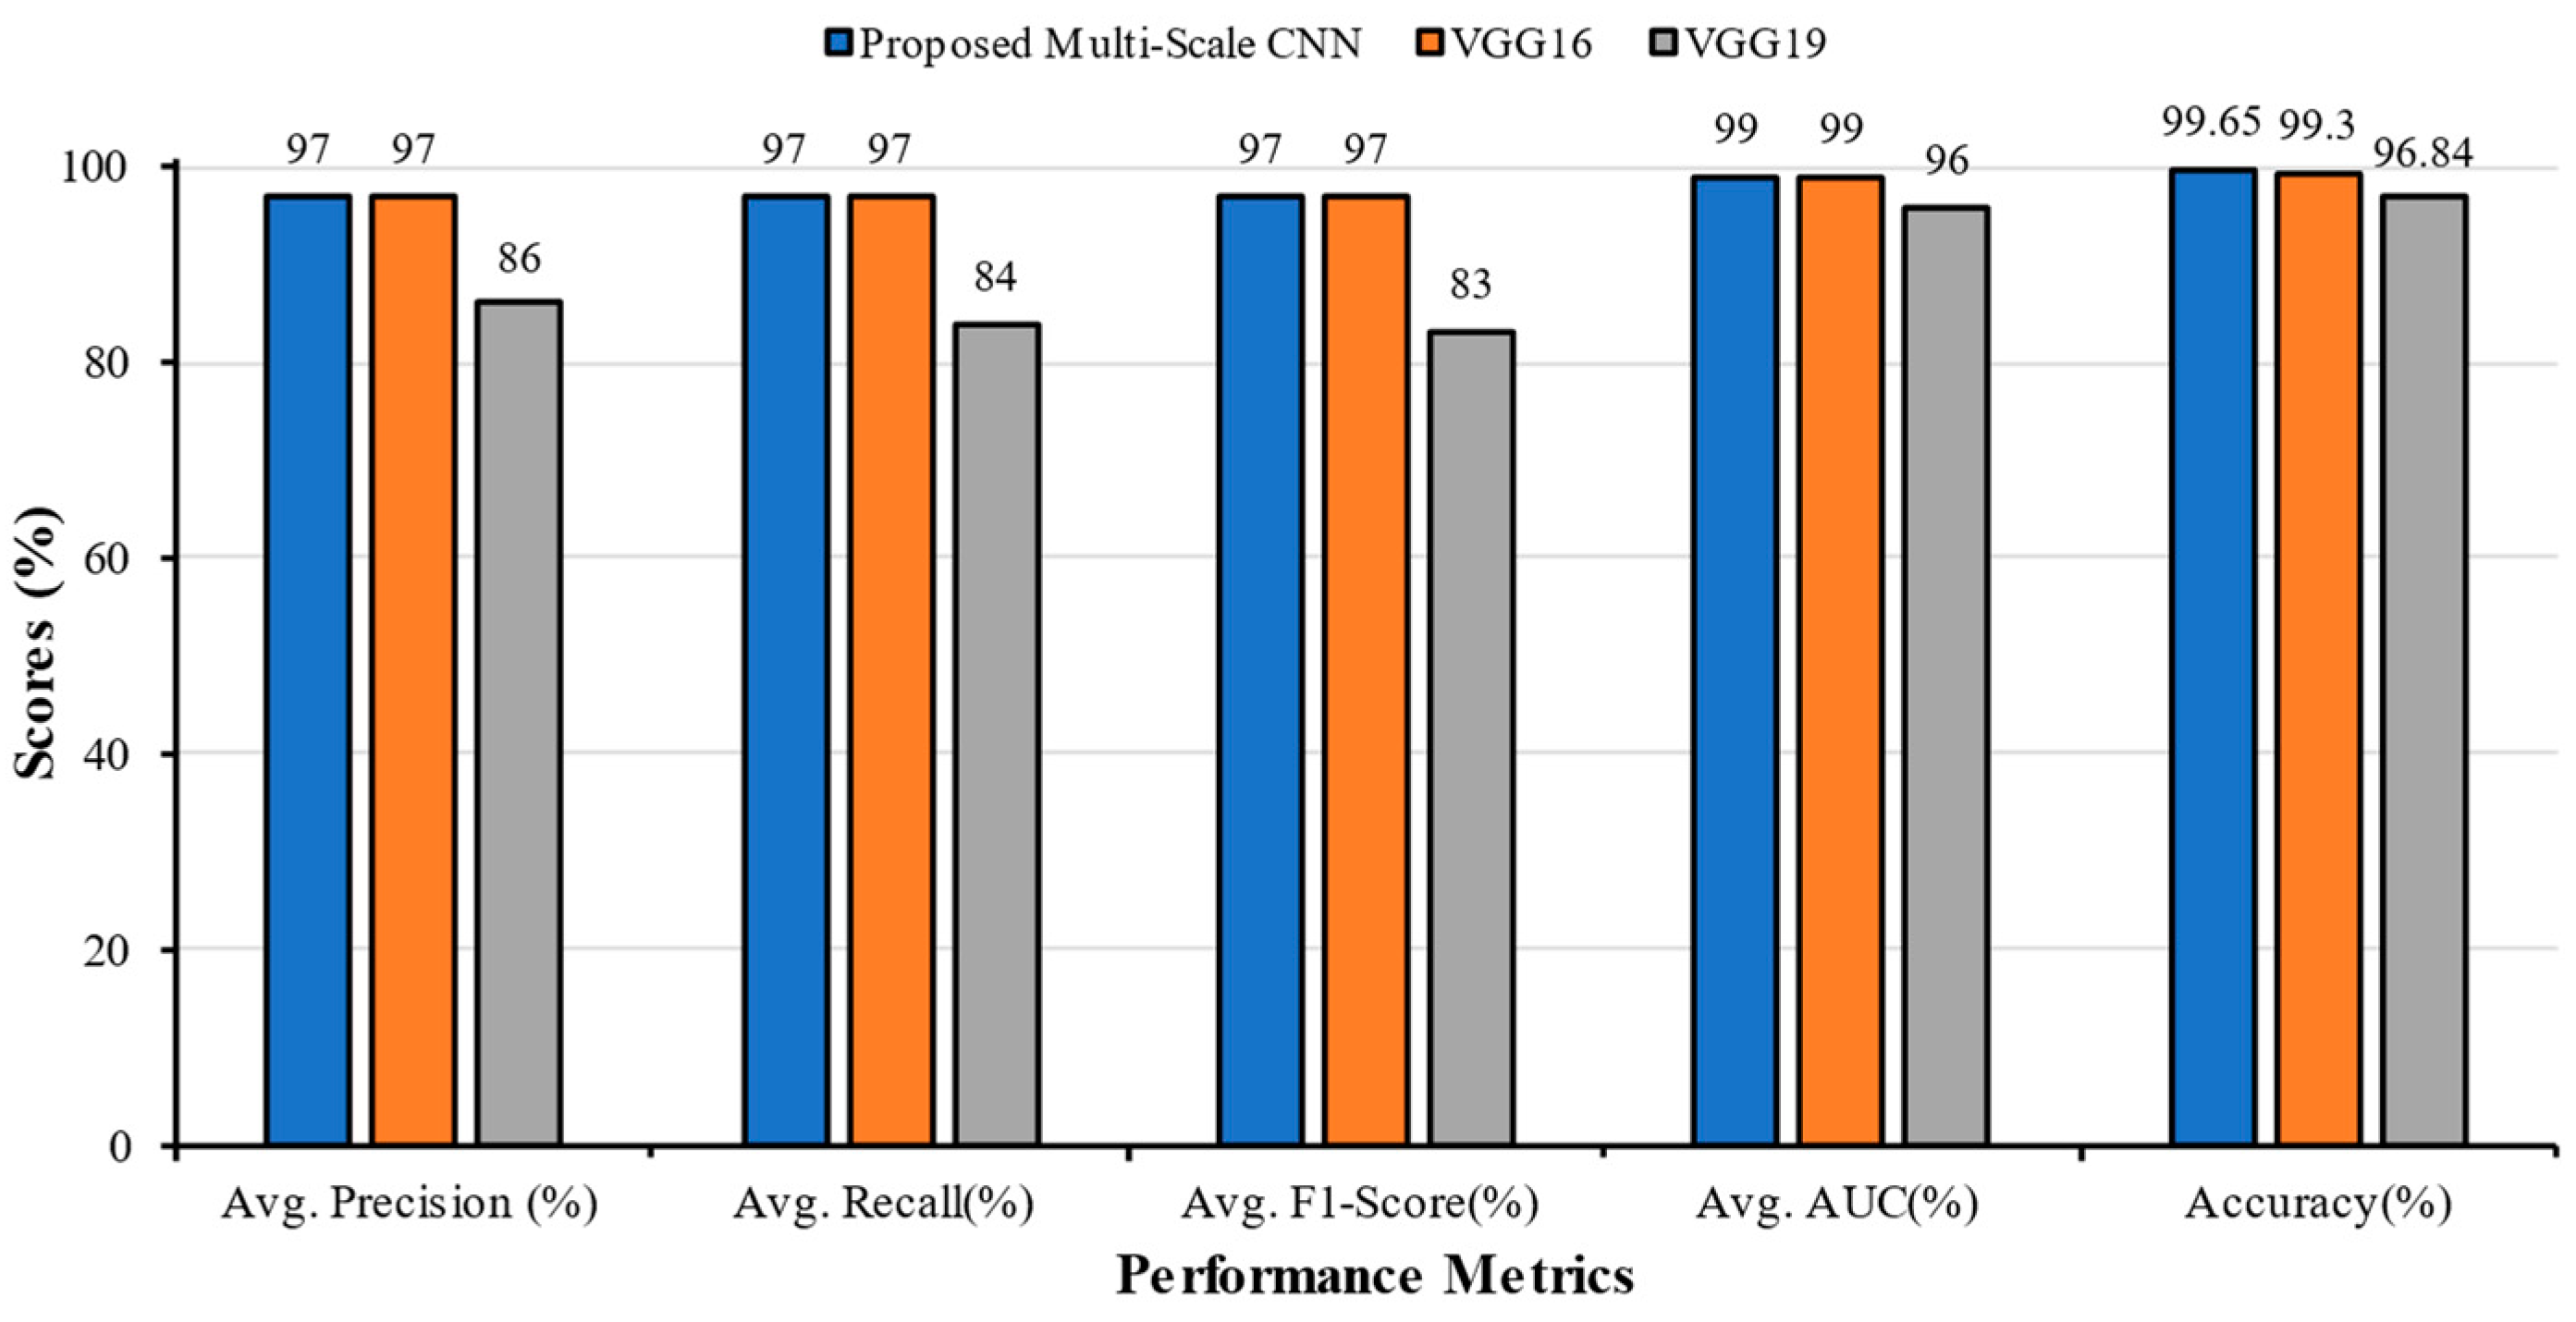
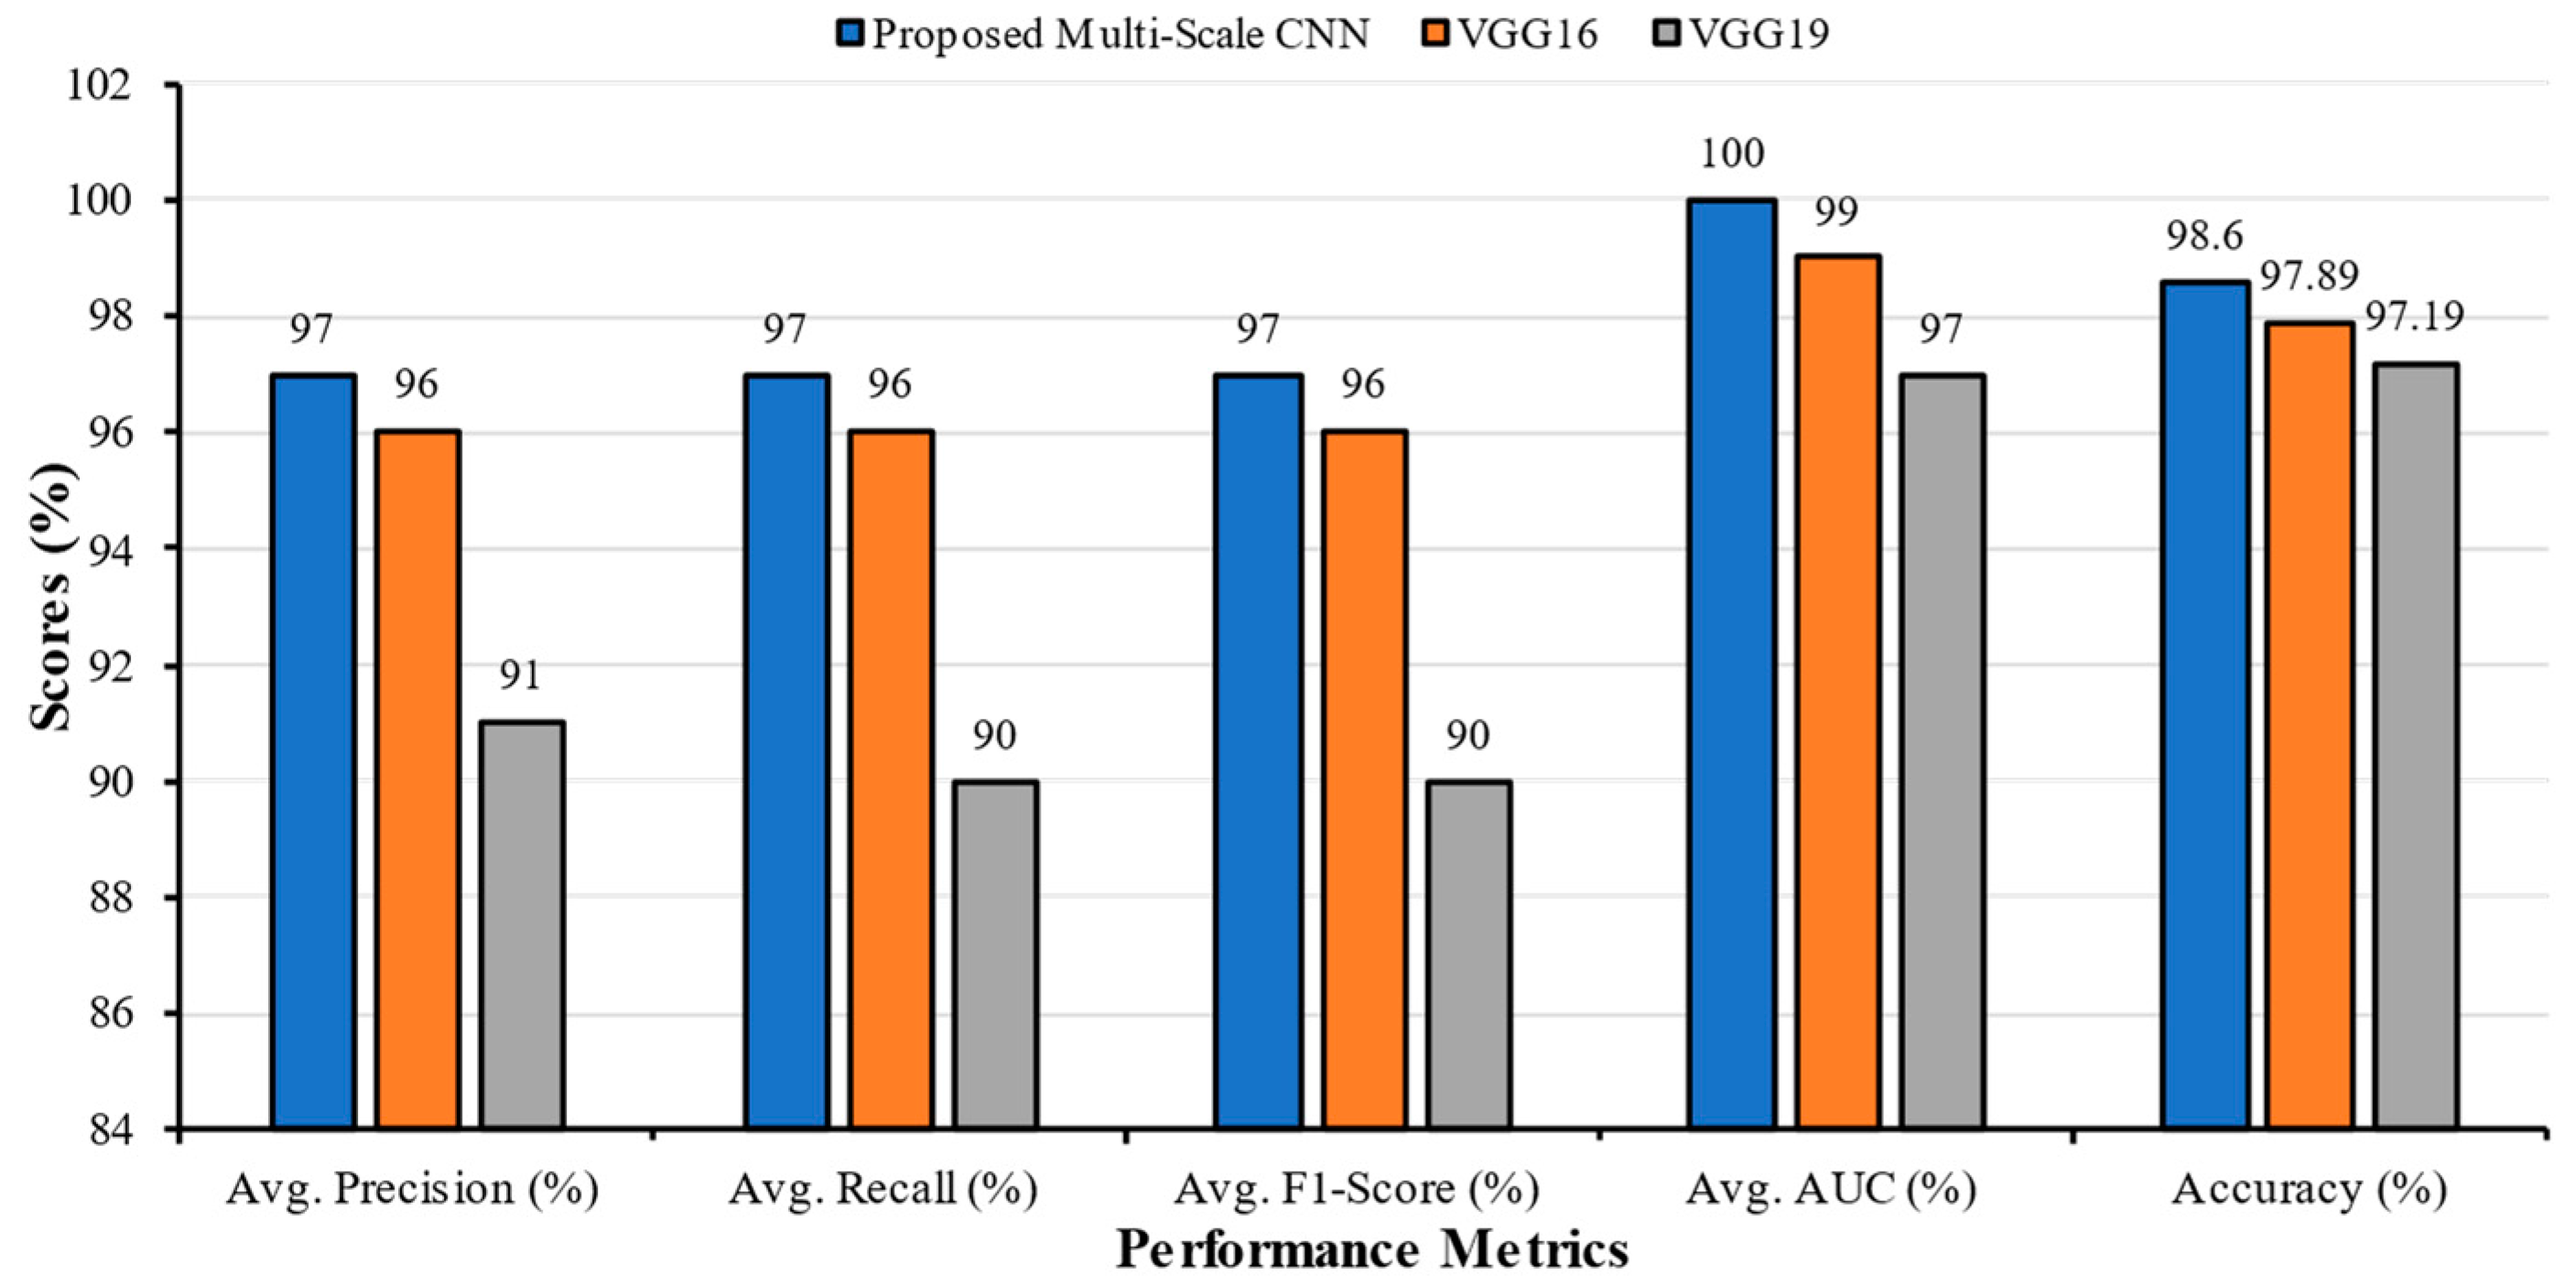
- The performance of the proposed MS-CNN model is compared with popular TL models (VGG16 and VGG19) and other SOTA models proposed in the literature.
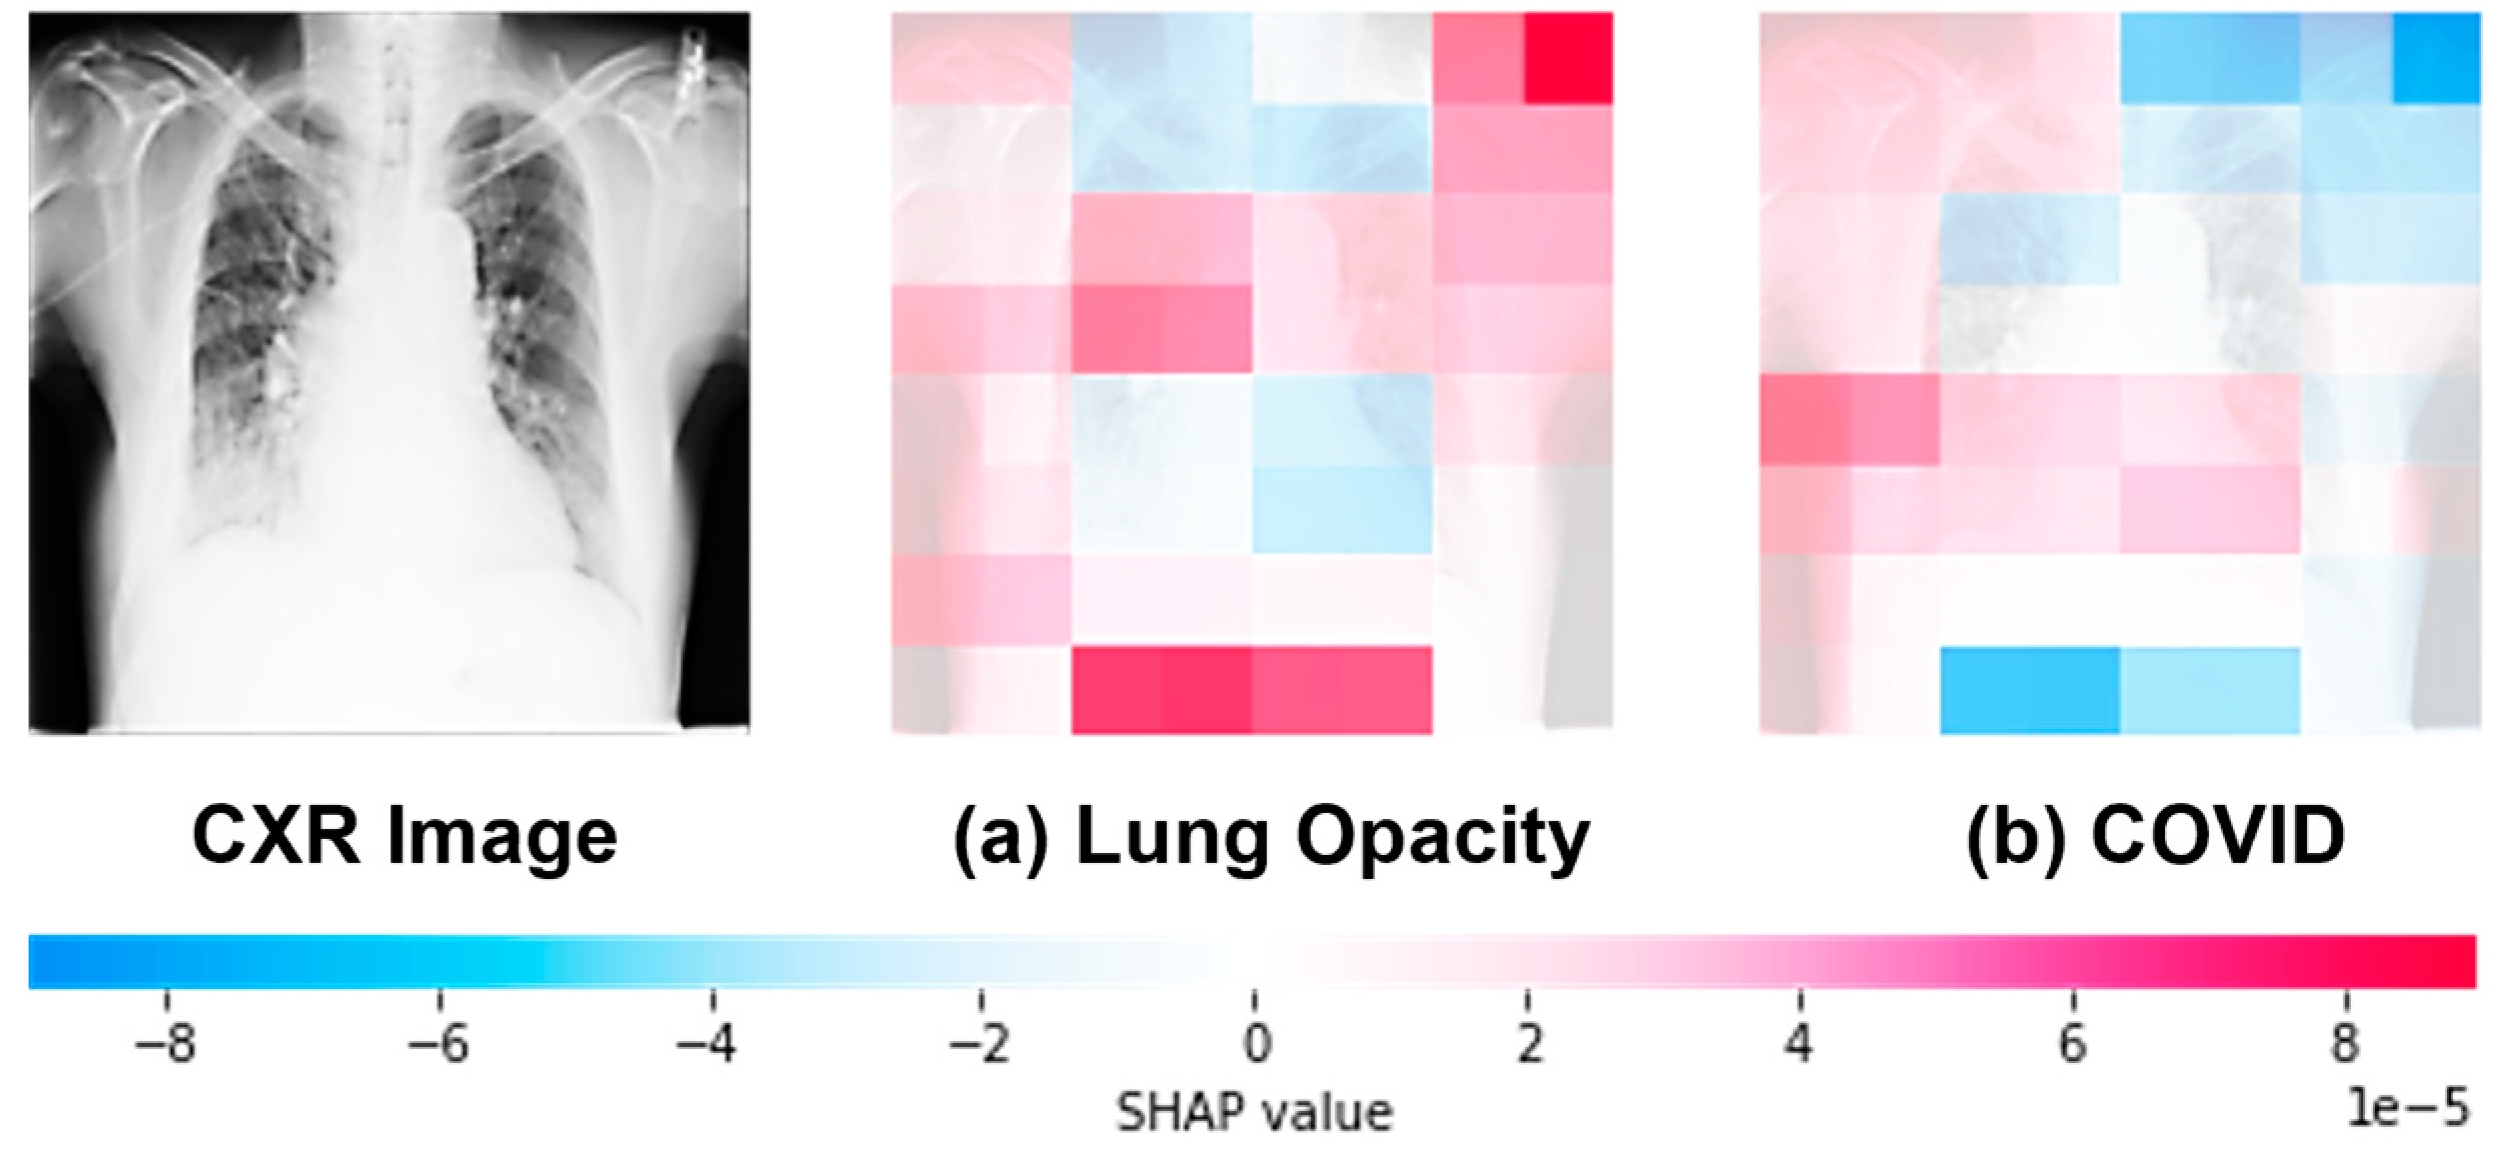
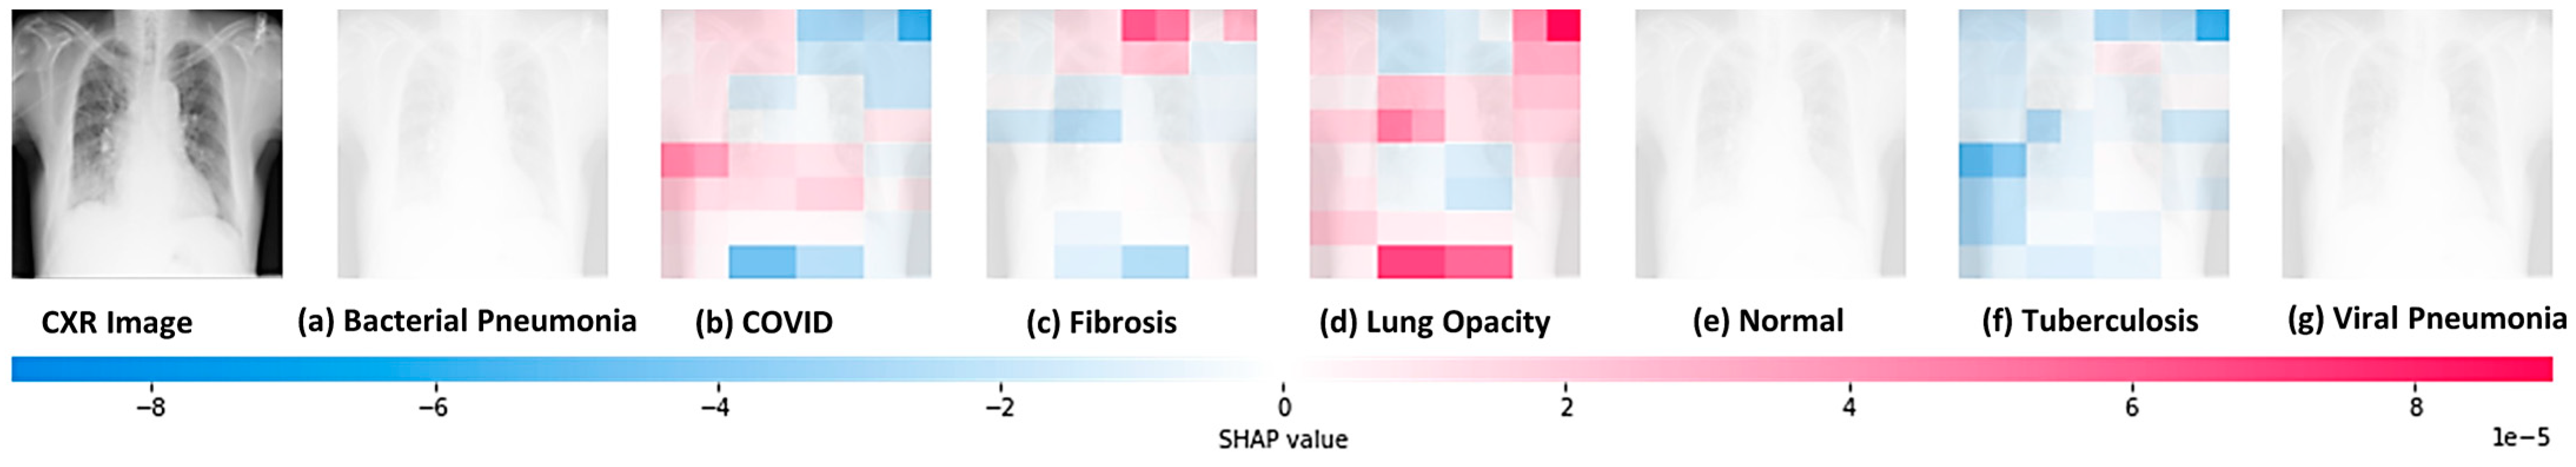
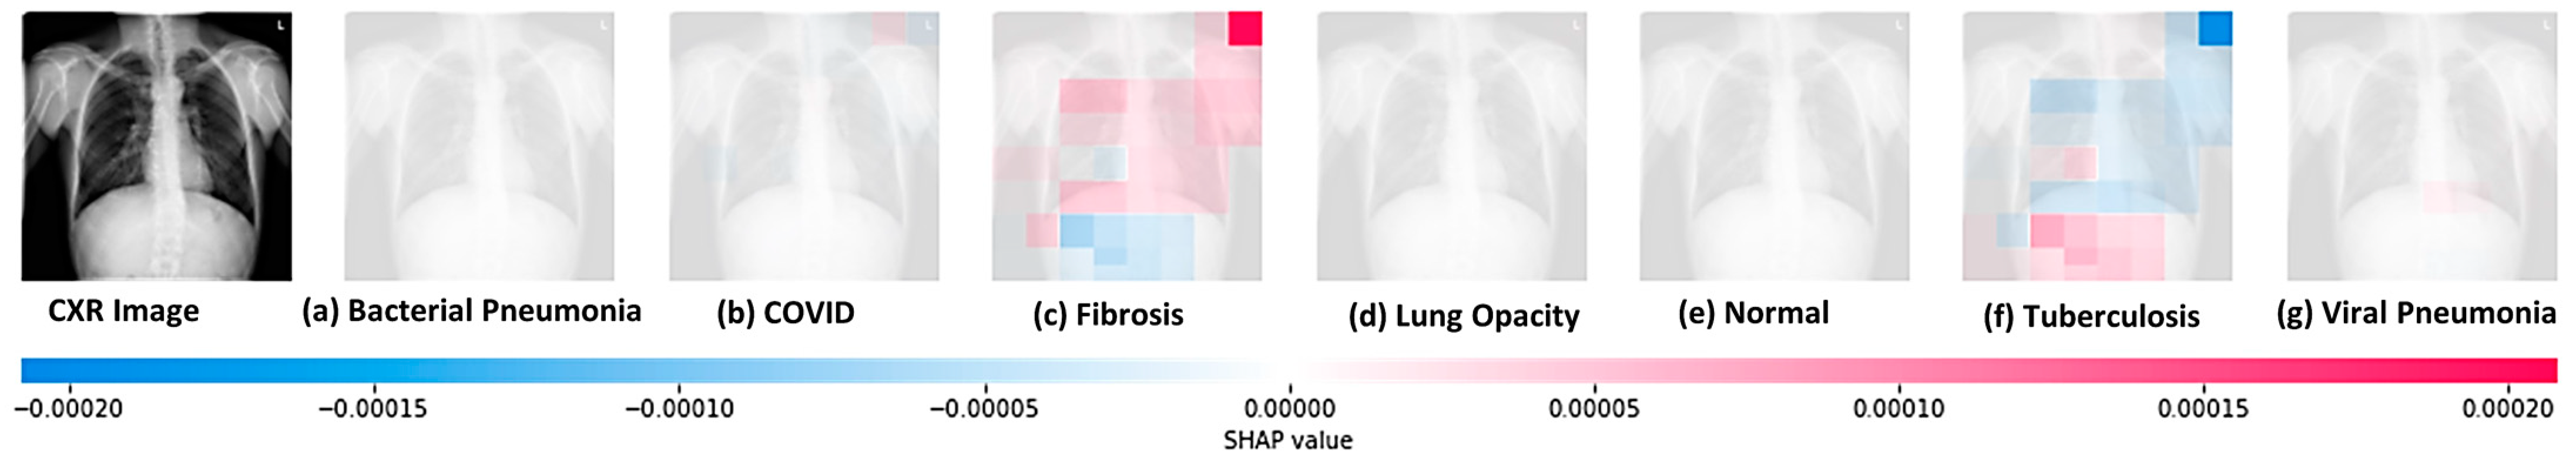
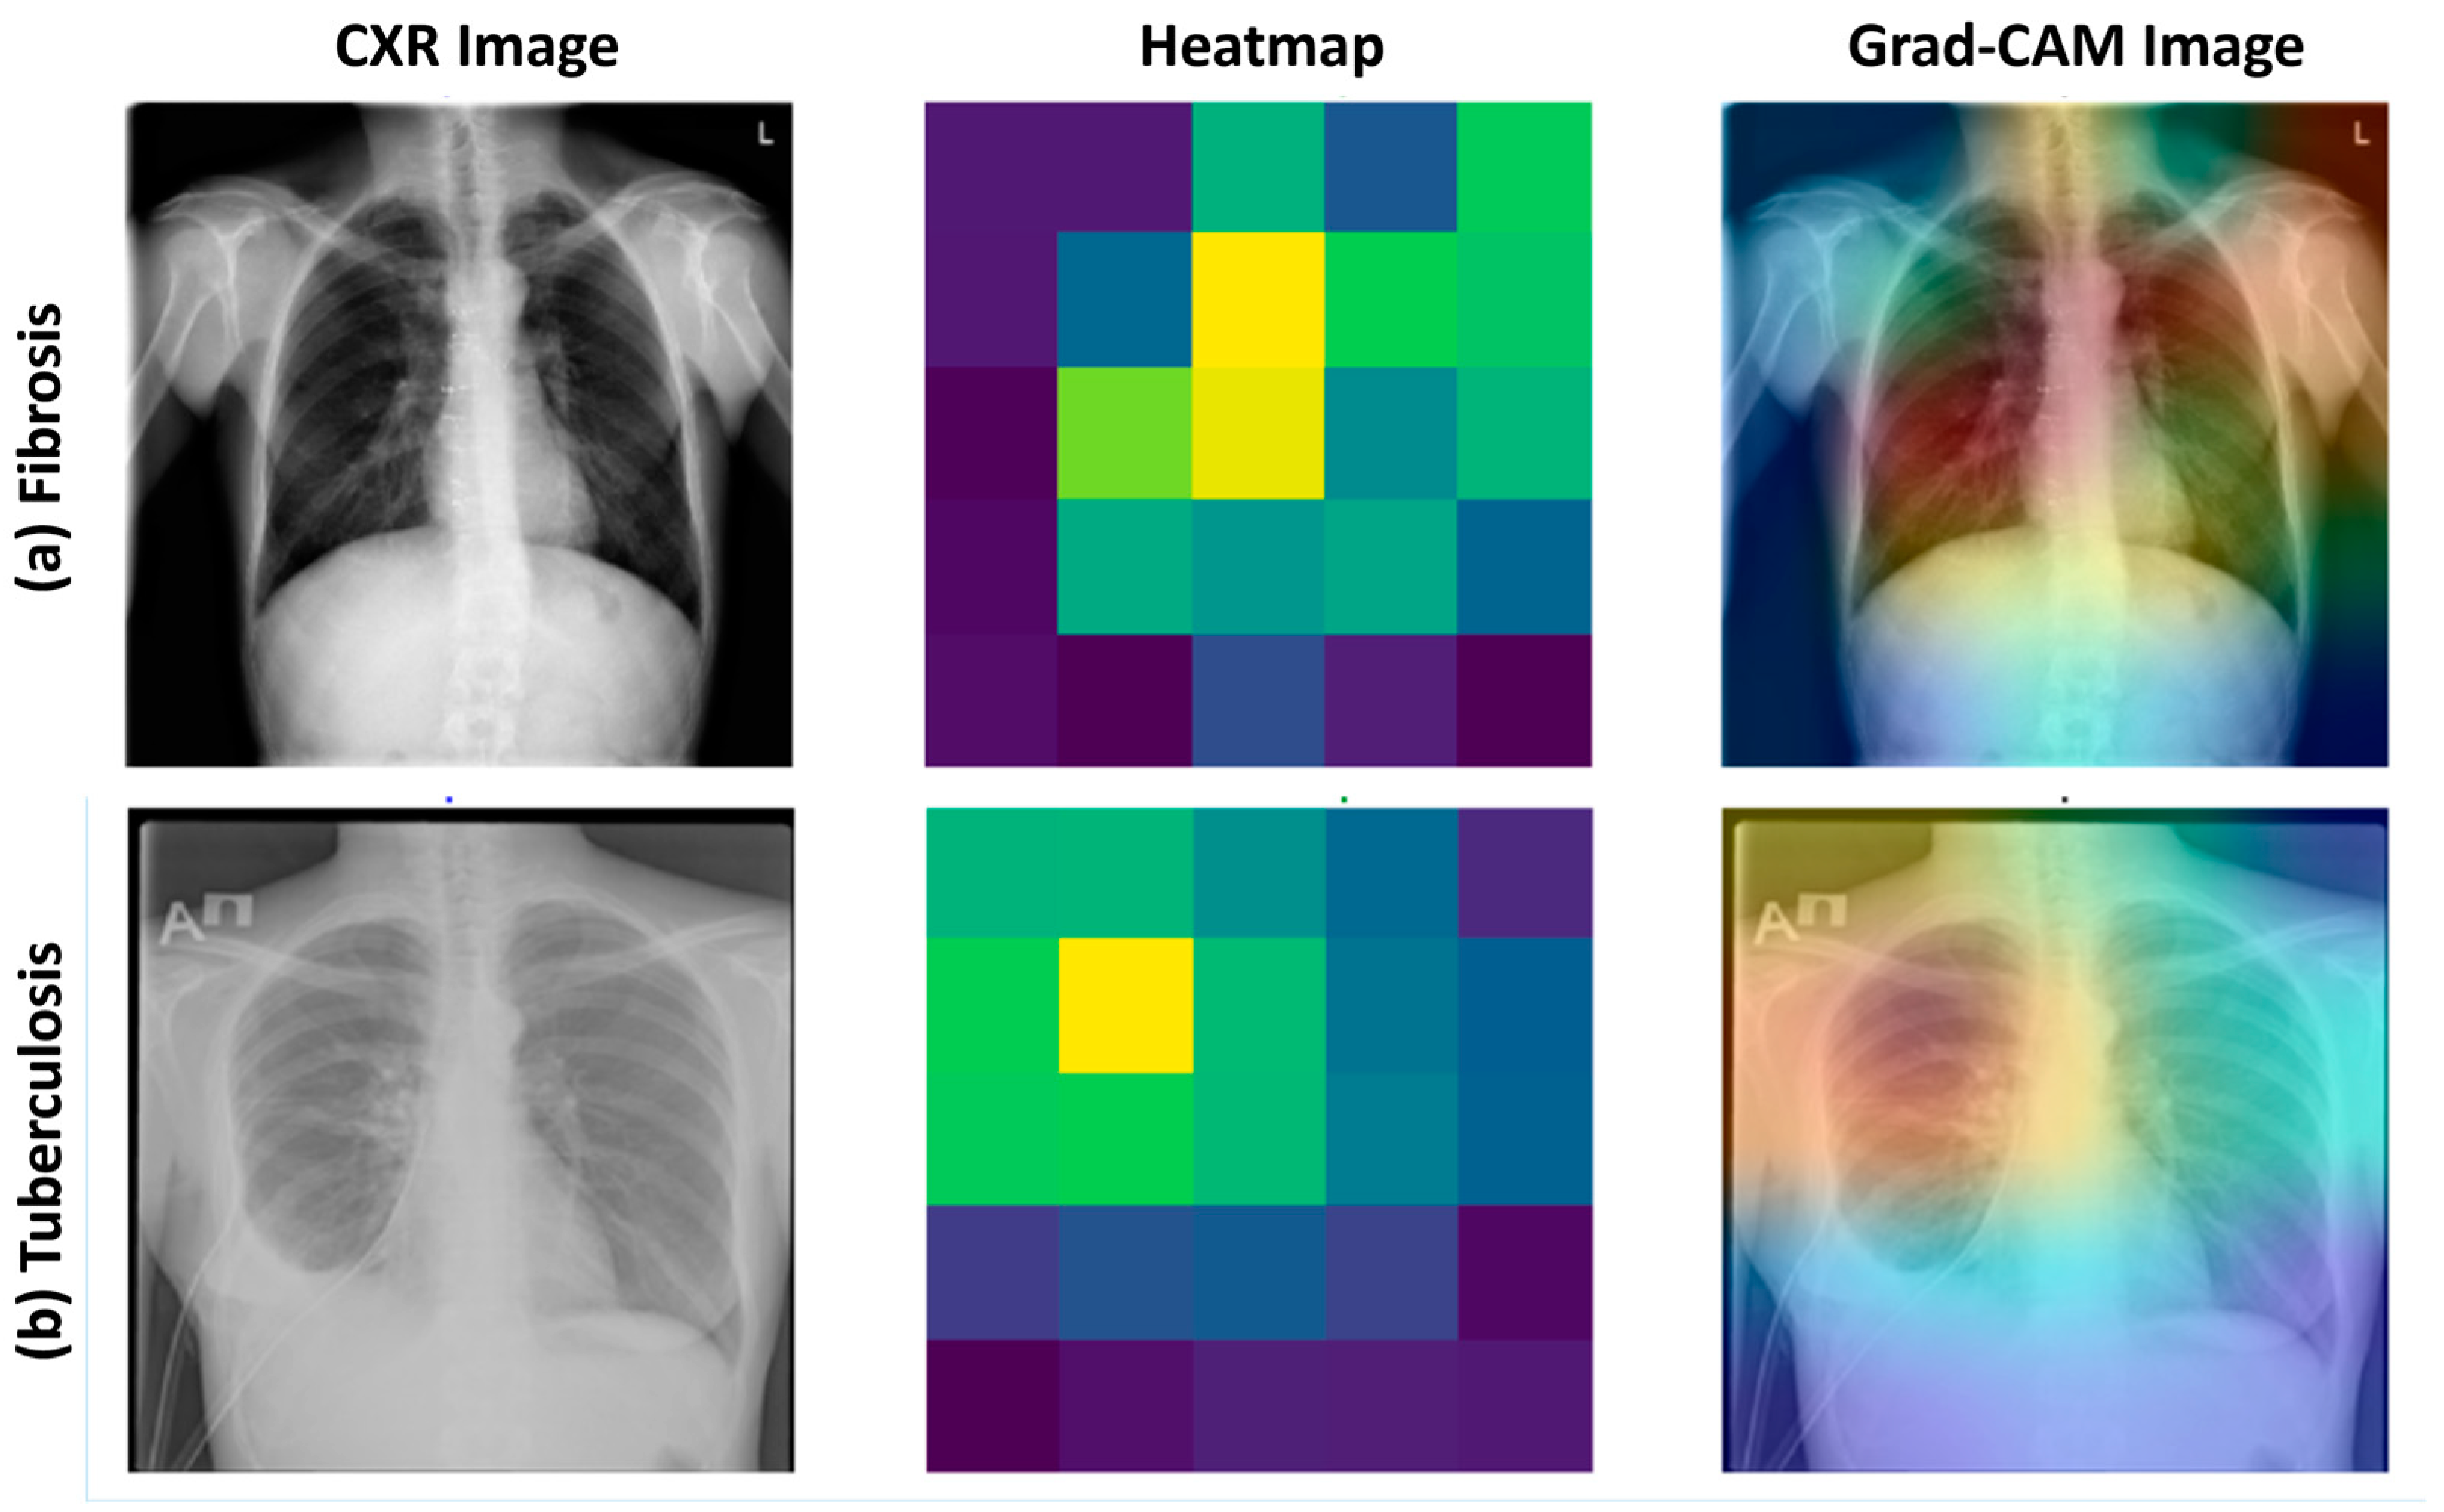
- The XAI techniques were integrated to enhance the interpretability and trustworthiness of the model by providing visual insights into how the model makes predictions and highlighting the regions of importance in the chest X-ray images for different disease classifications.
2. Literature Review
3. Methodology
3.1. Chest X-ray Databases
- COVID-19 Radiography Database [31]: this dataset (available online: https://www.kaggle.com/datasets/tawsifurrahman/covid19-radiography-database (accessed on 16 February 2023)) provided Chest X-ray images for COVID-19-positive cases, viral pneumonia cases, lung opacity cases, and normal cases.
- Curated Dataset for COVID-19 [32]: this dataset (available online: https://www.kaggle.com/datasets/francismon/curated-covid19-chest-xray-dataset (accessed on 16 February 2023)) contributed images of bacterial pneumonia.
- NIAID TB dataset [33]: this dataset (available online: https://tbportals.niaid.nih.gov/ (accessed on 12 May 2023)) supplied images of tuberculosis.
- NIH Chest X-ray Dataset [34]: this dataset (available online: https://datasets.activeloop.ai/docs/mL/datasets/nih-chest-x-ray-dataset (accessed on 9 August 2023)) provided images of fibrosis.
3.1.1. Dataset 1
3.1.2. Dataset 2
3.1.3. Dataset 3
3.1.4. Dataset 4
3.1.5. Dataset 5
3.1.6. Dataset 6
3.1.7. Dataset 7
3.1.8. Dataset 8
3.1.9. Dataset 9
3.1.10. Dataset 10
3.1.11. Dataset Splitting
3.2. Pre-Processing and Augmentation
3.2.1. Sample-Wise Centering
3.2.2. Sample-by-Sample Standard Deviation Normalization
3.2.3. Horizontal Flipping
3.2.4. Image Generator
3.3. Proposed Multi-Scale CNN Architecture
| Algorithm 1: Proposed Multi-scale CNN Algorithm |
| 1. Input: 6650 CXR images (80% training, 10% validation, 10% testing). 2. Output Labels: Normal, Bacterial Pneumonia, COVID, Fibrosis, Lung Opacity, Tuberculosis, Viral Pneumonia. 3. Begin 4. Preprocessing:
9. Performance Evaluation:
|
3.4. Experimental Setup and Hyperparameter Settings
3.5. Performance Metrics
4. Results
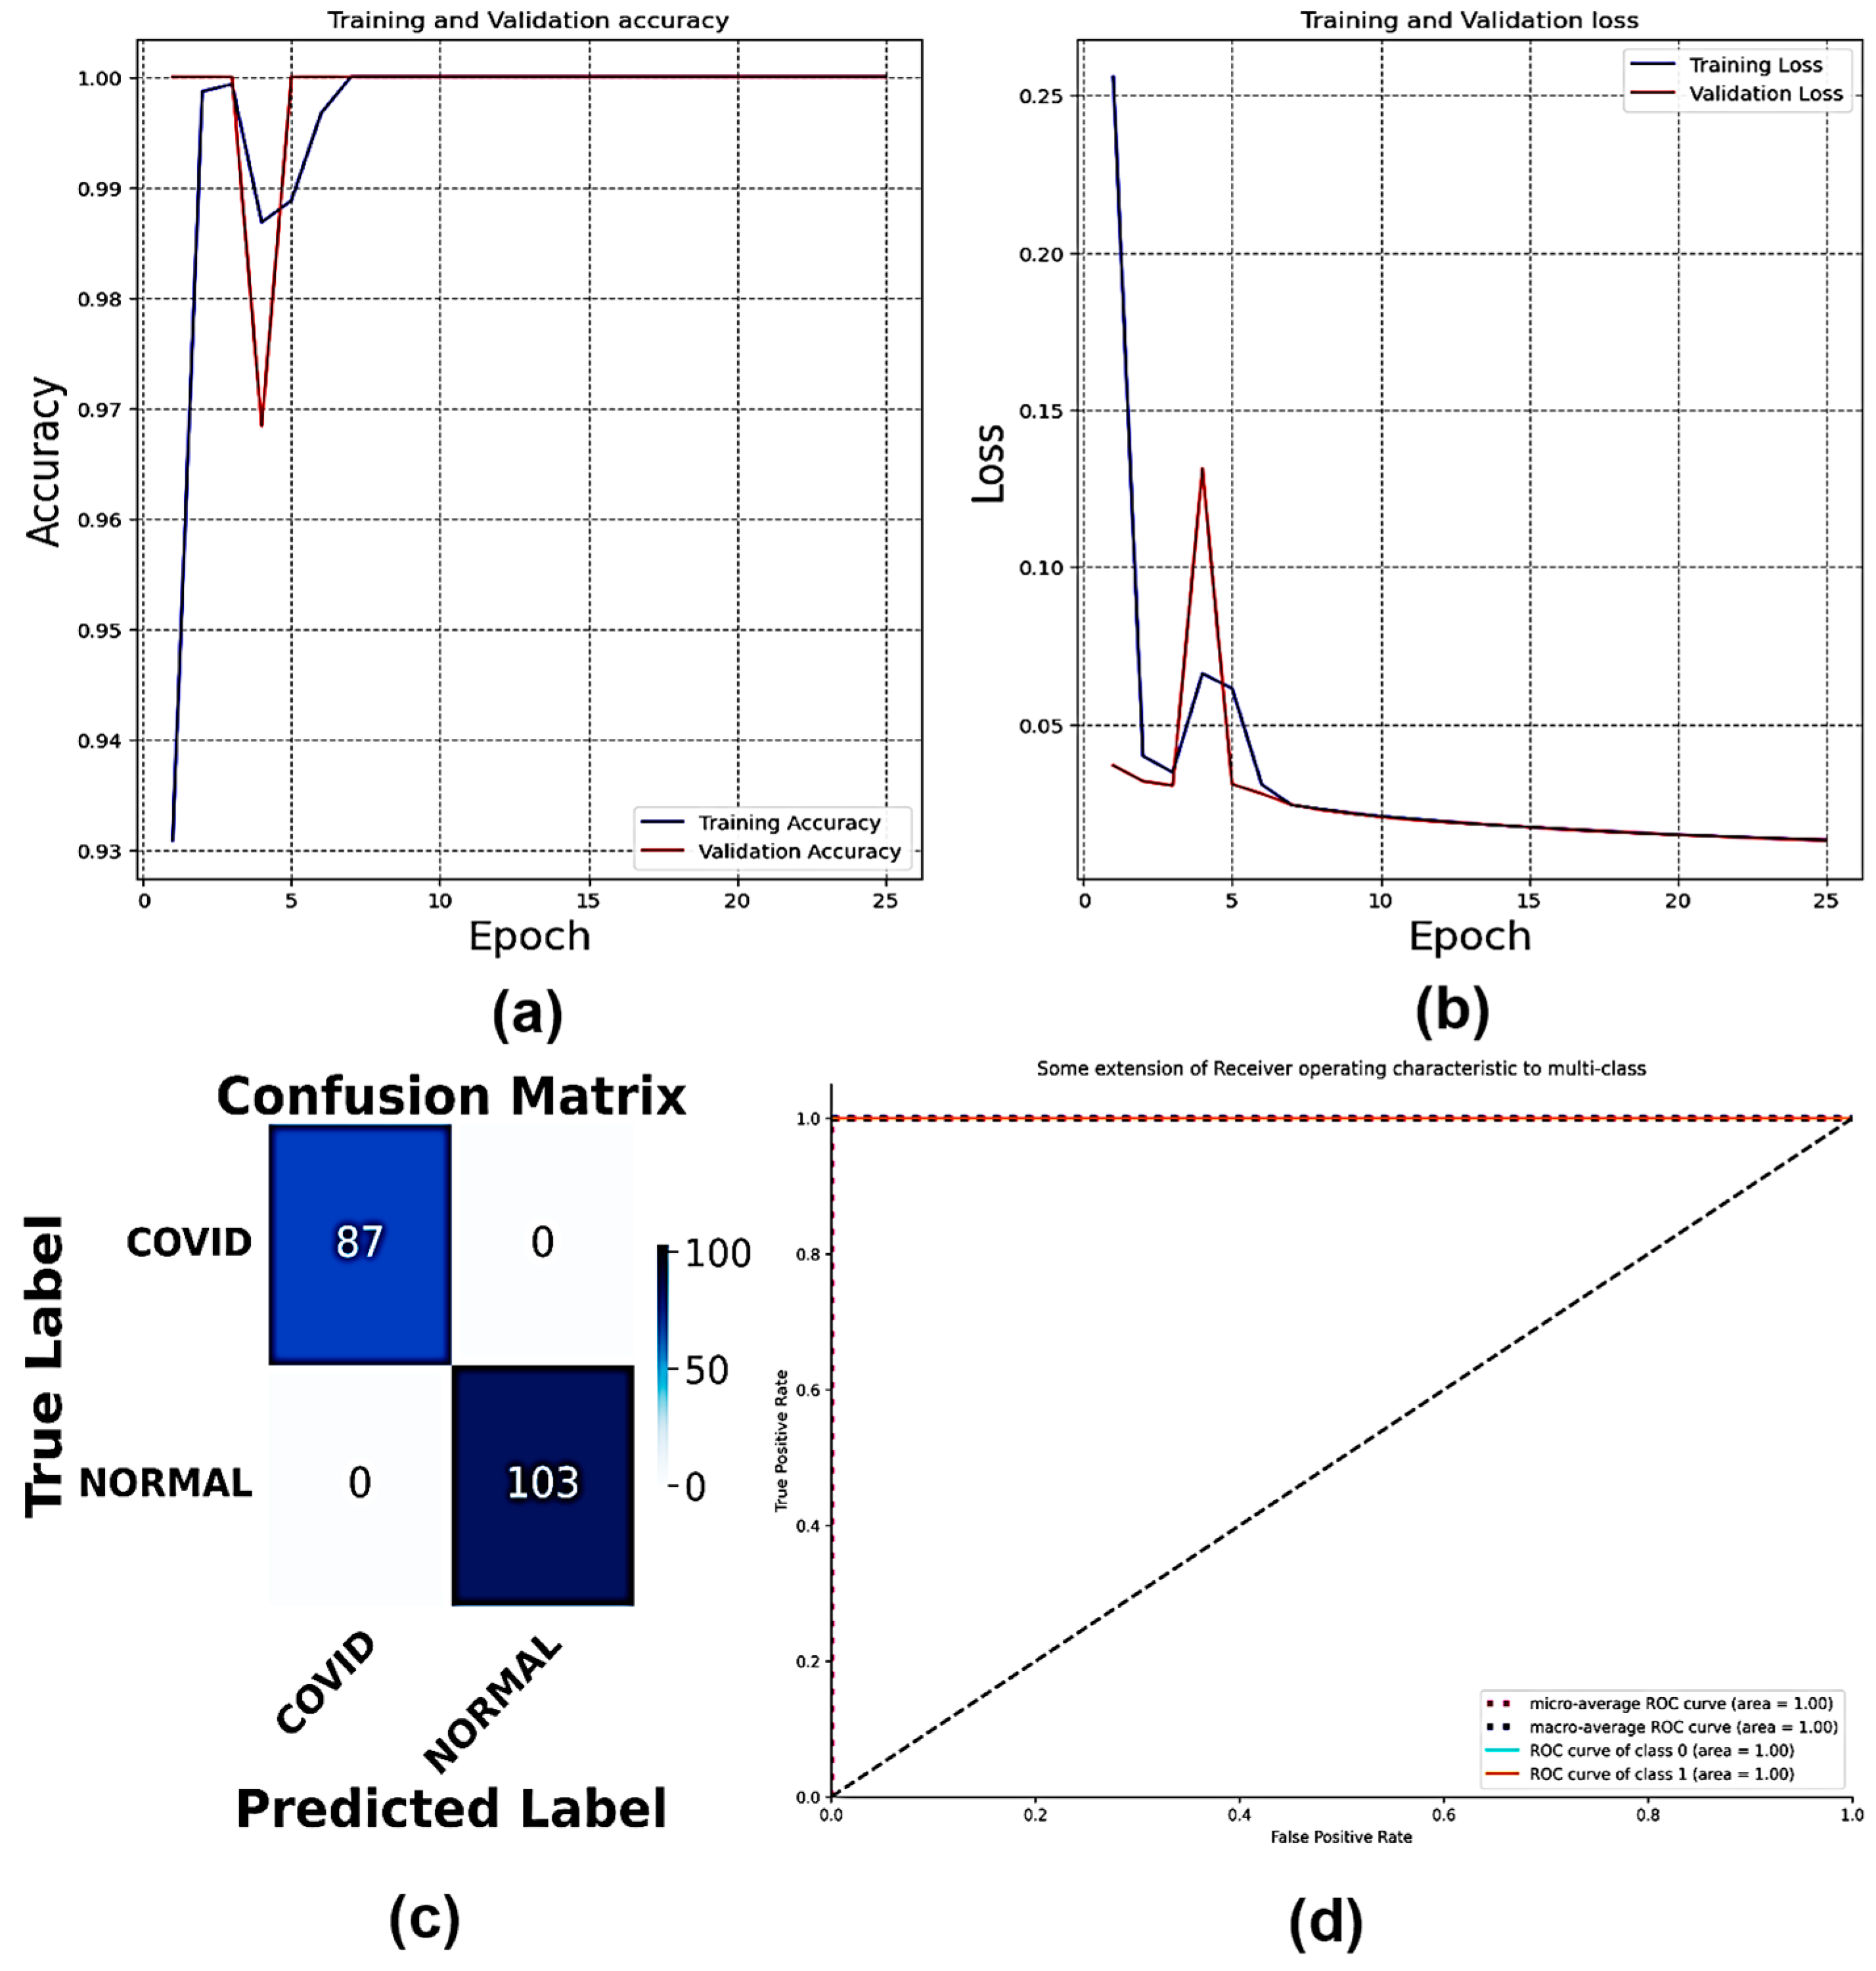
4.1. Classification of Dataset 1
4.2. Classification of Dataset 2
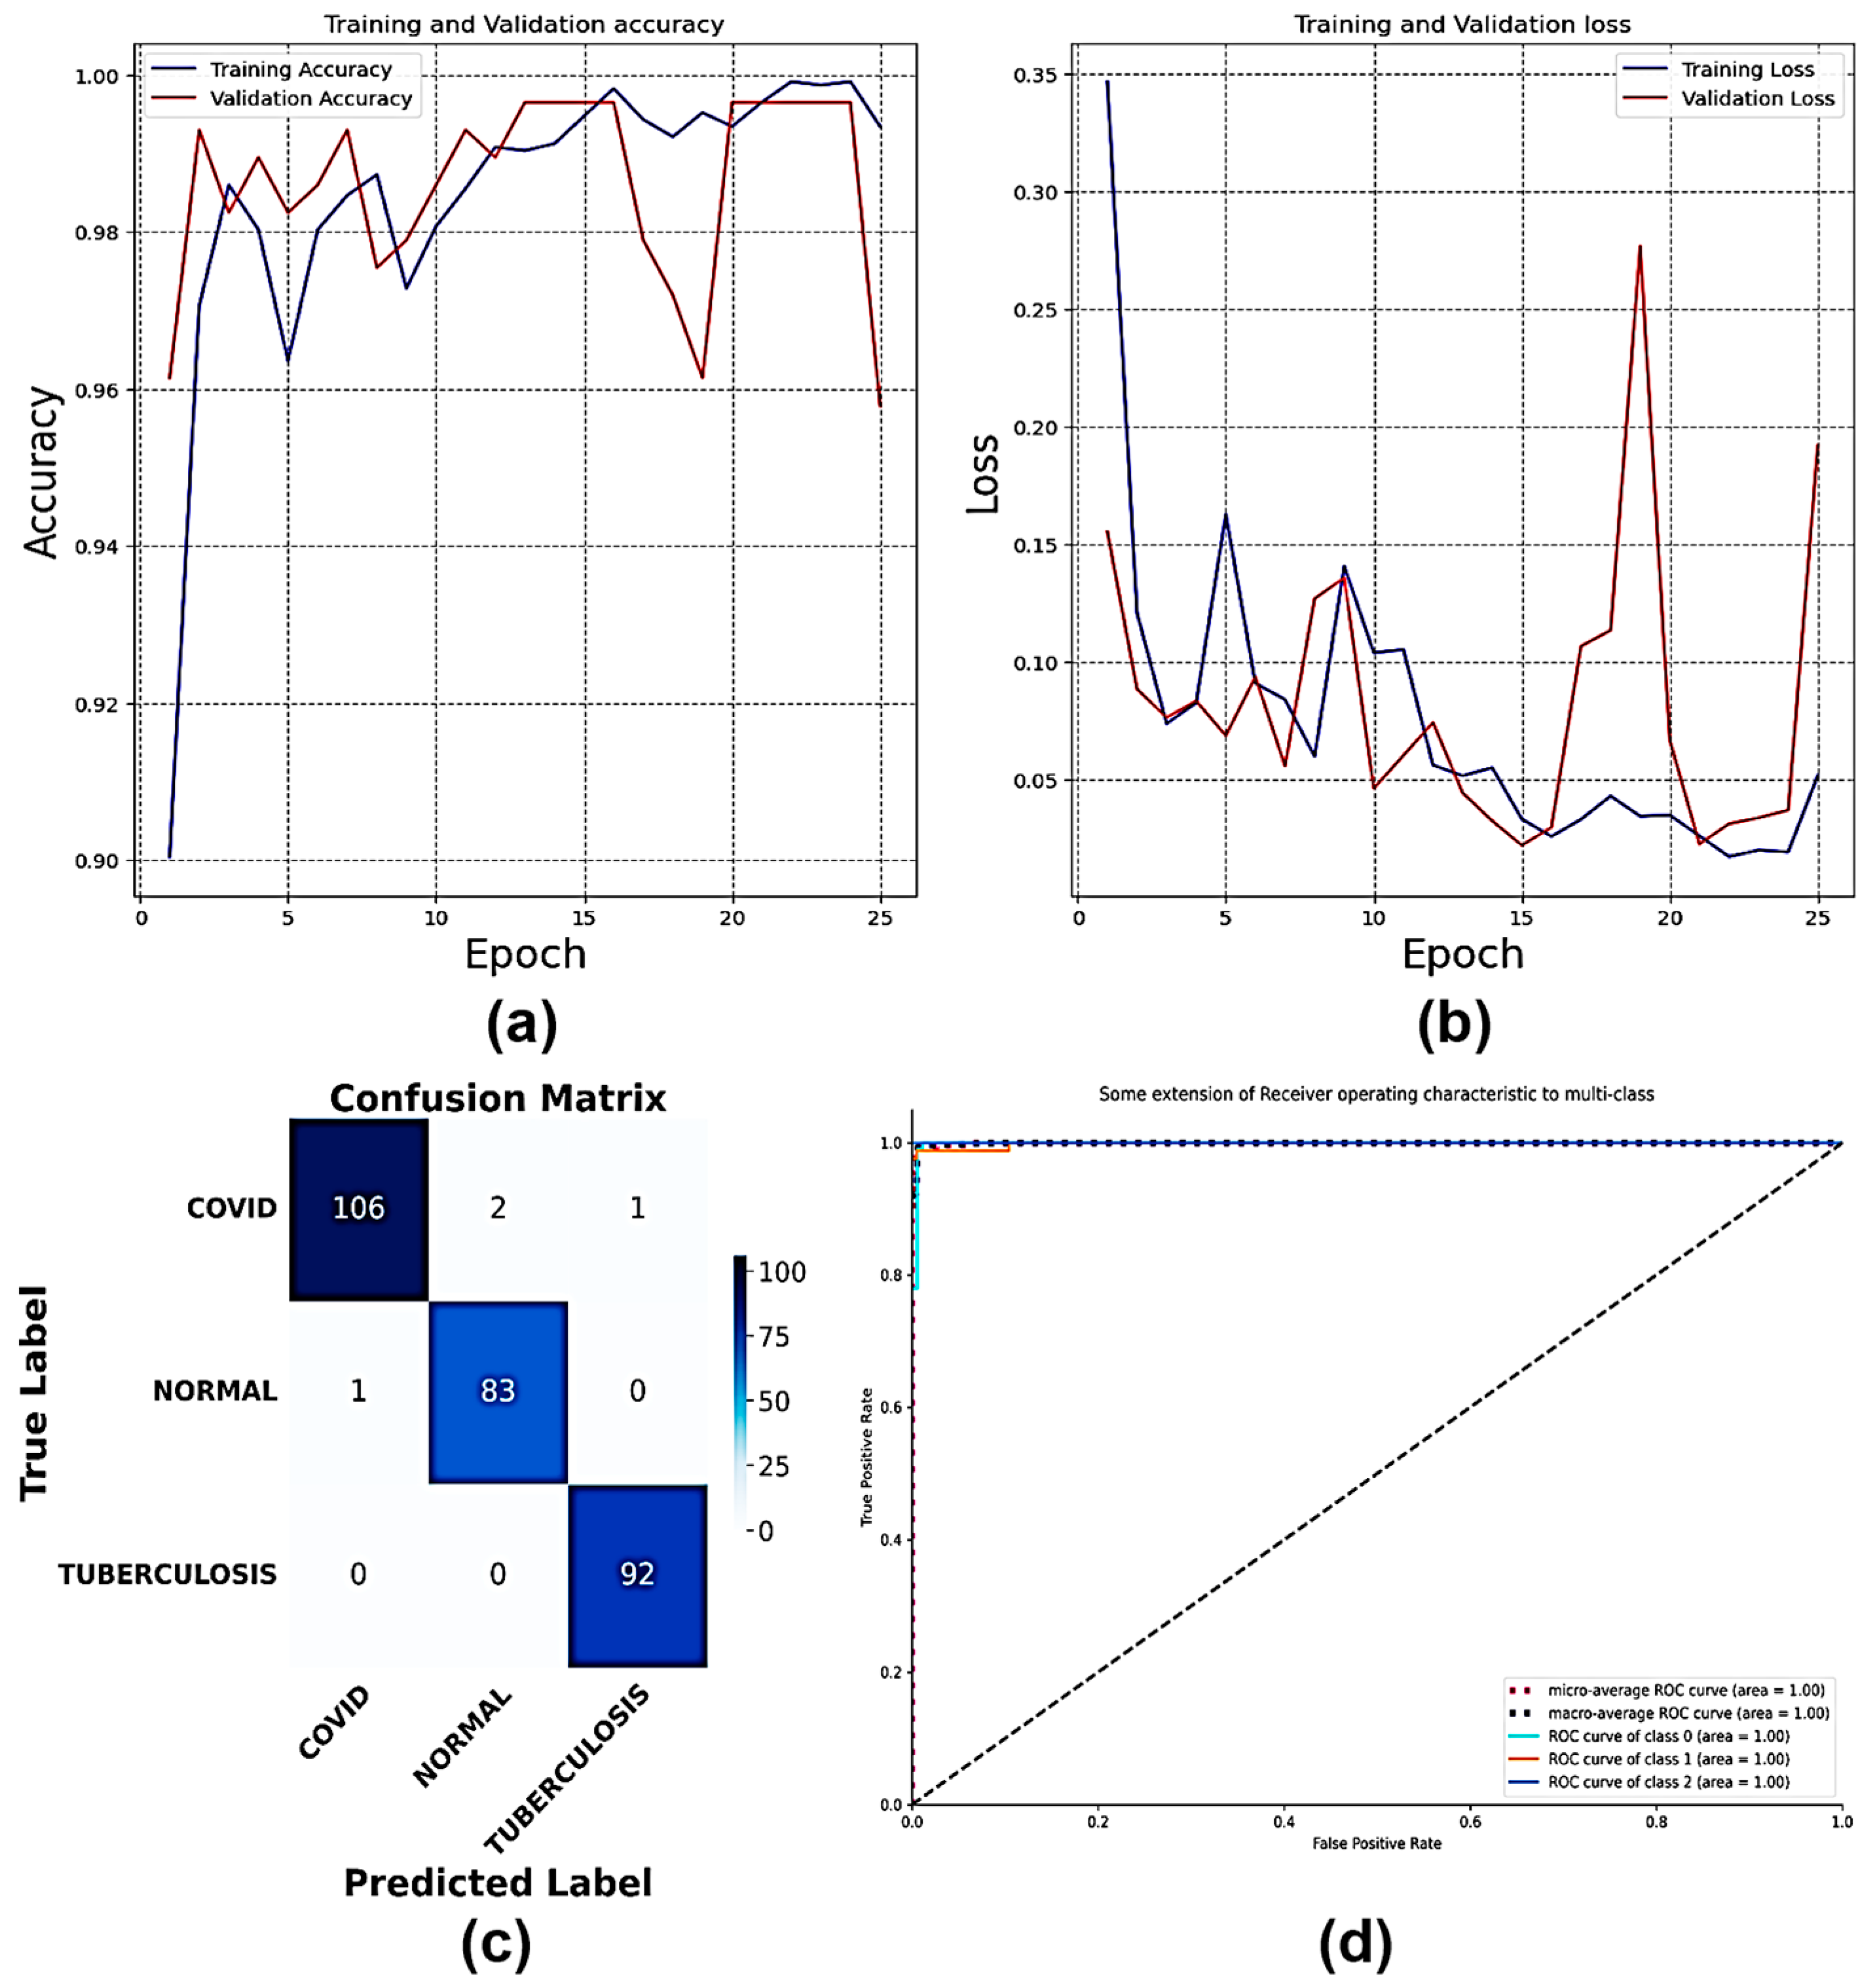
4.3. Classification of Dataset 3
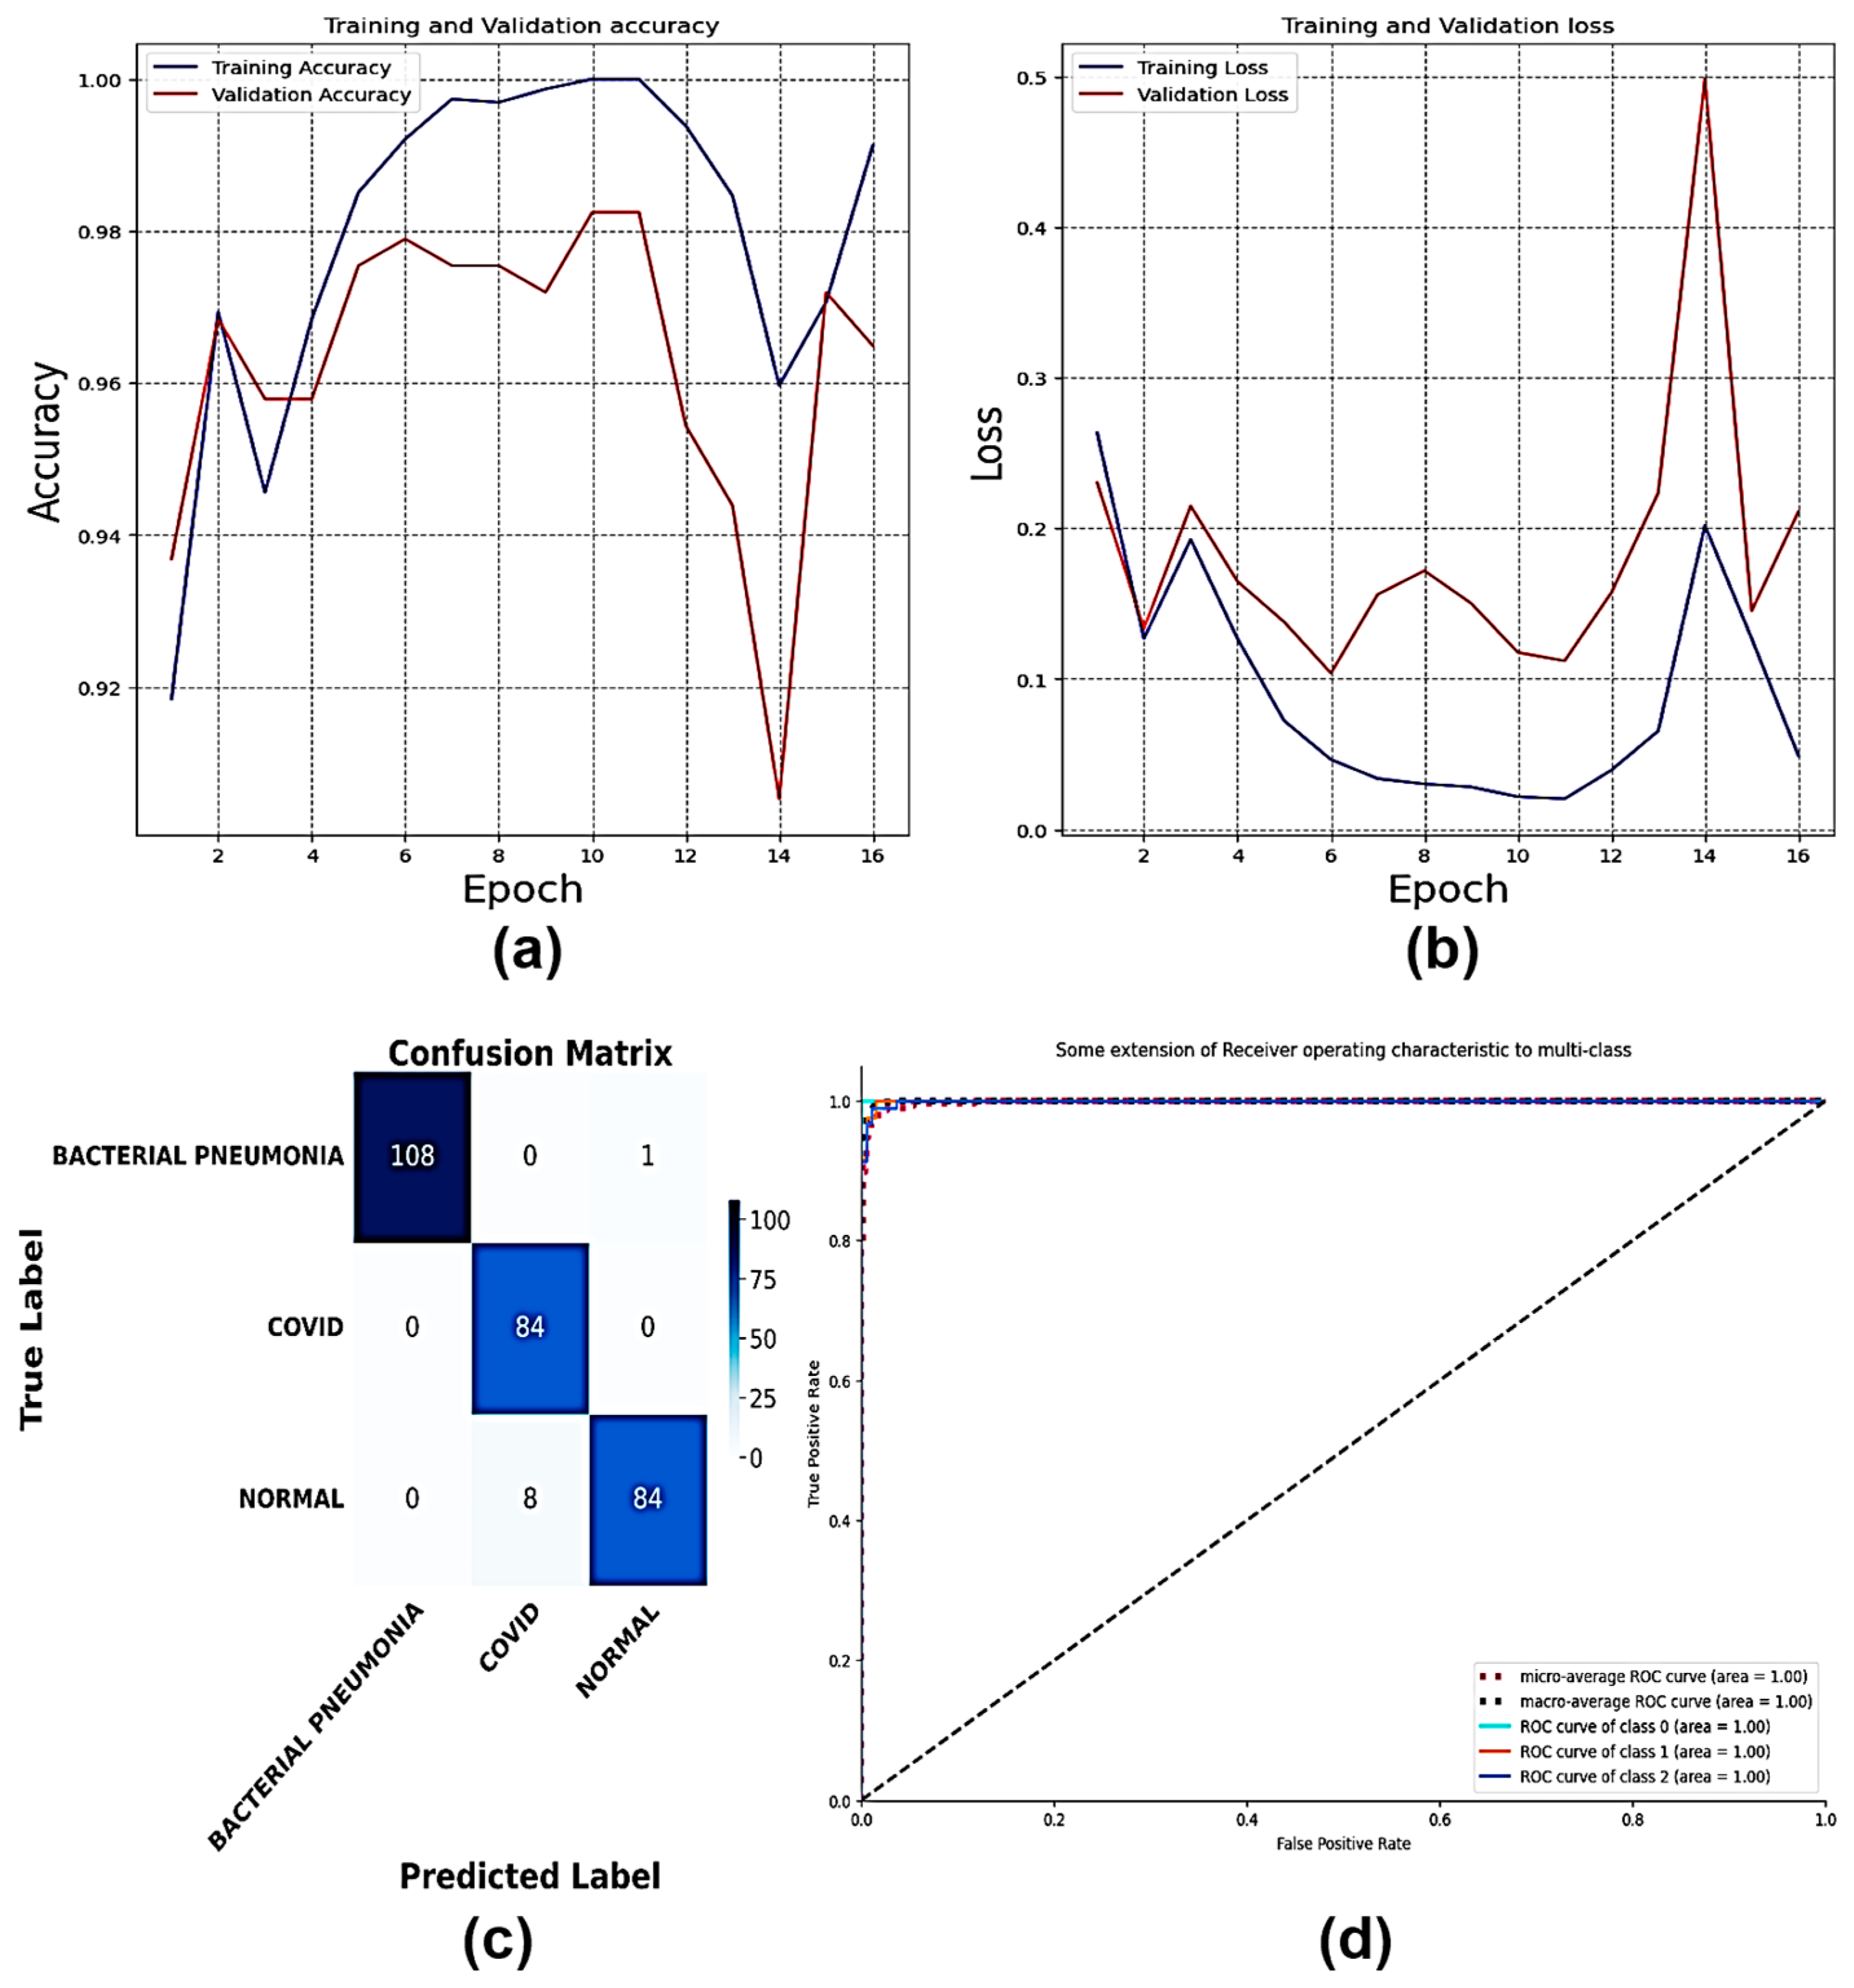
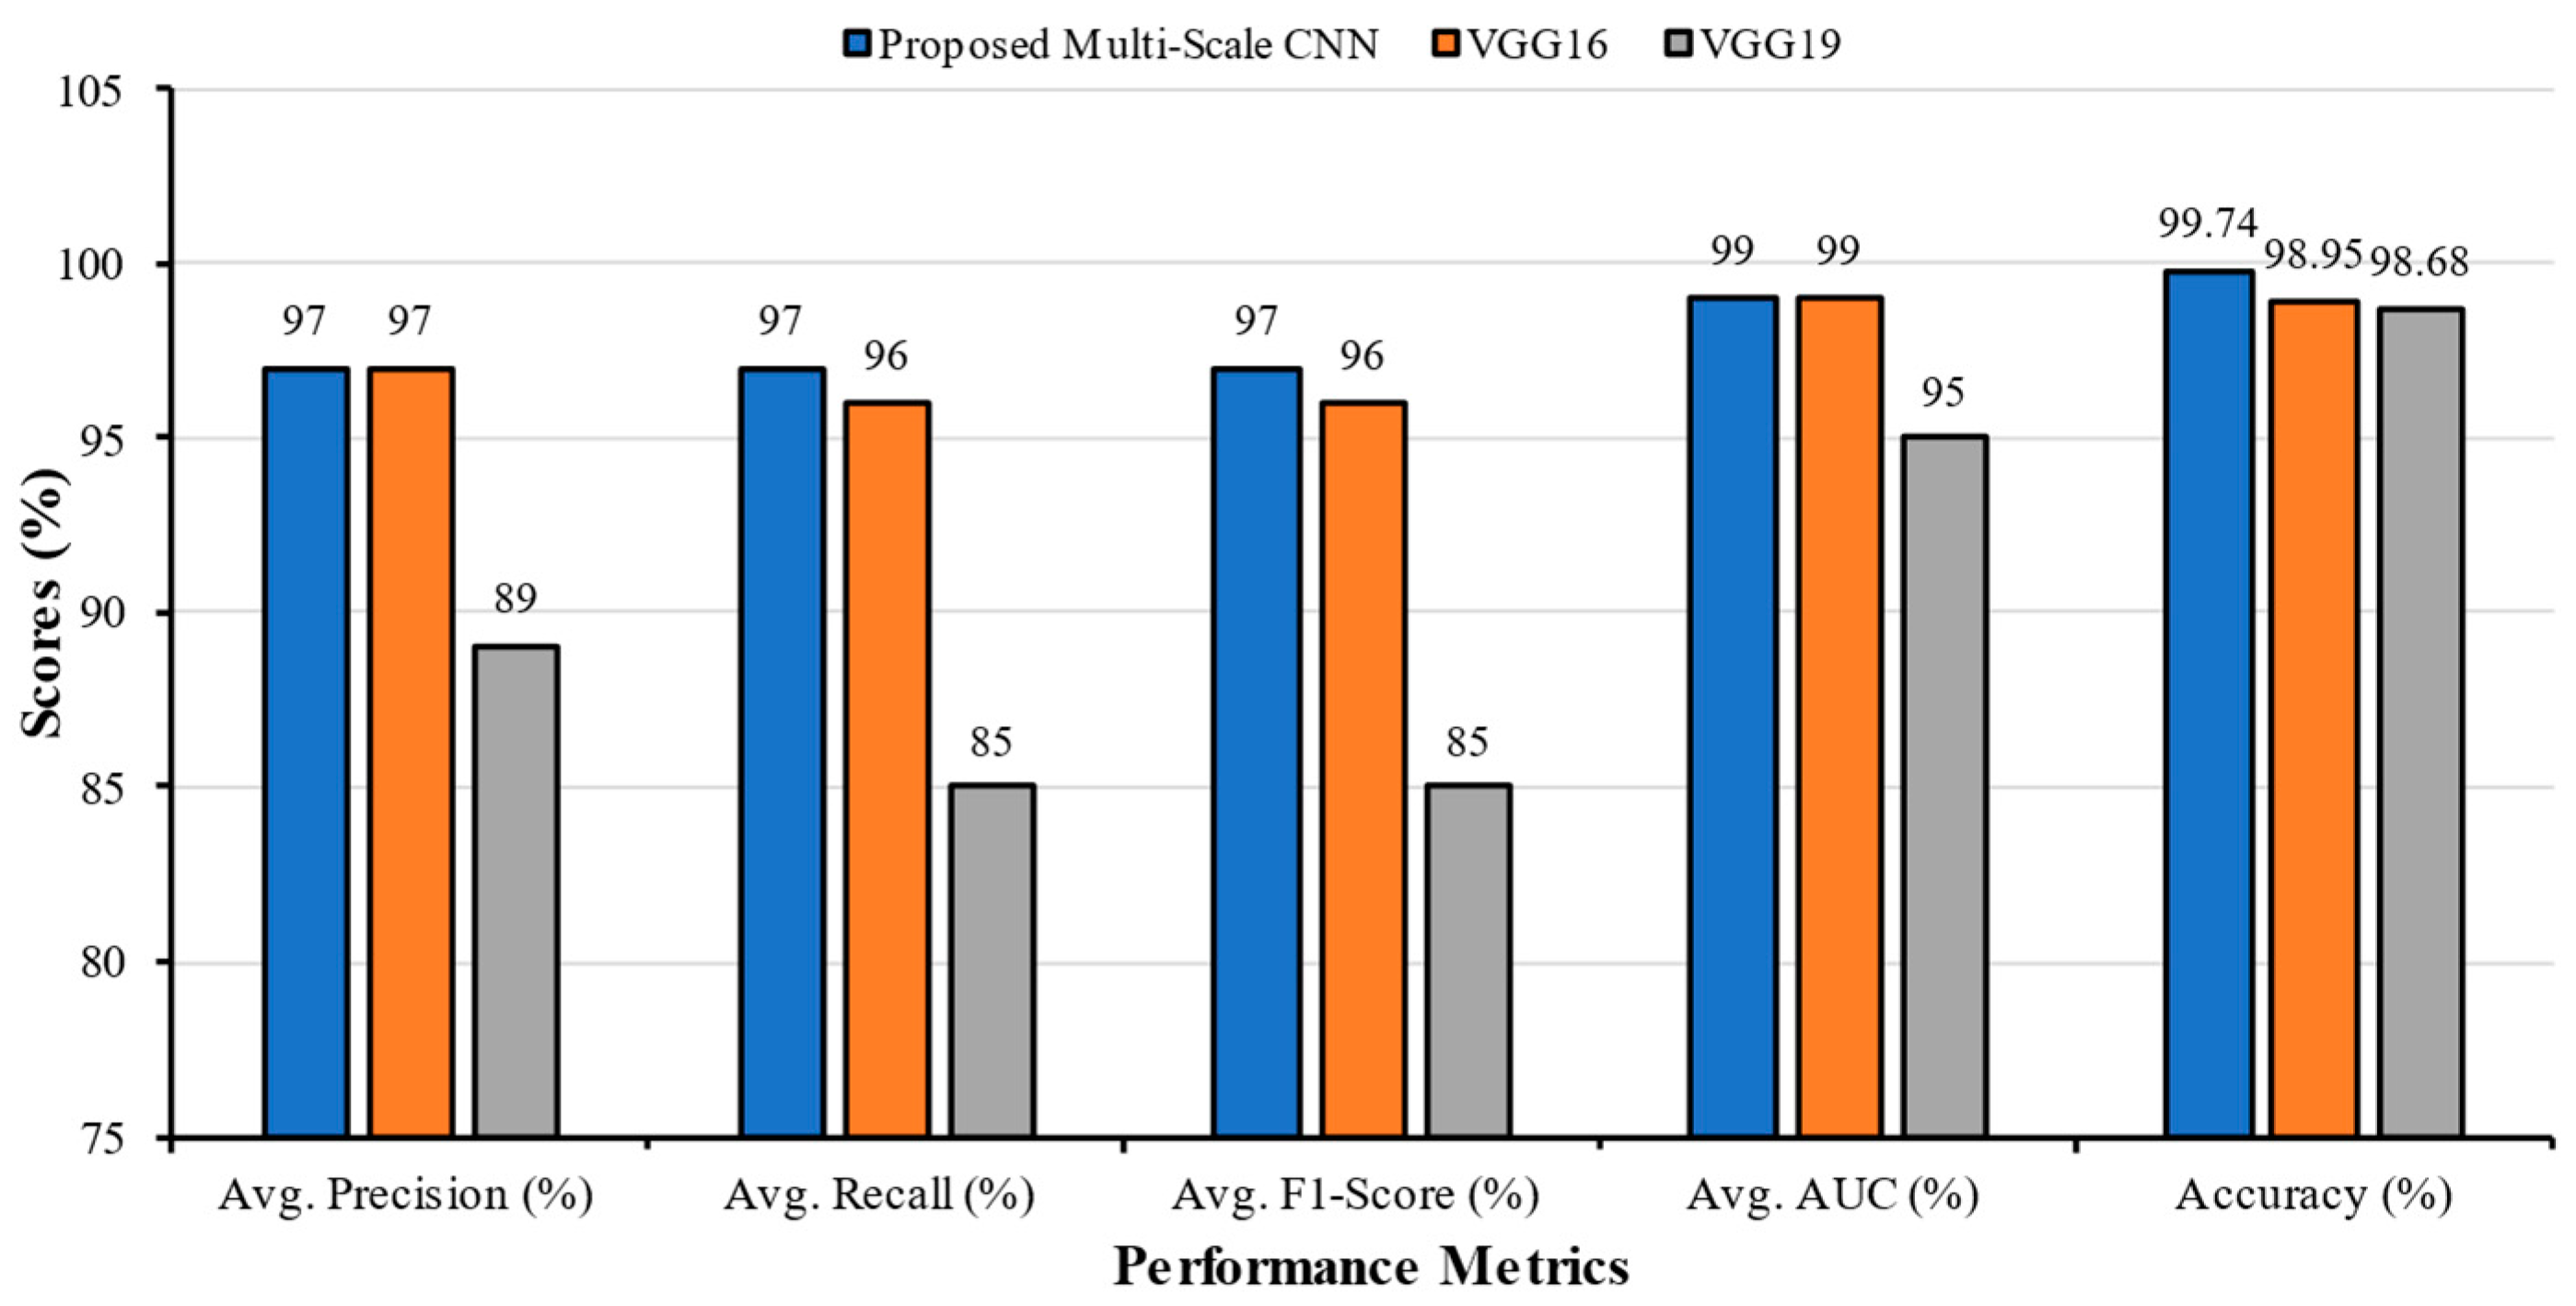
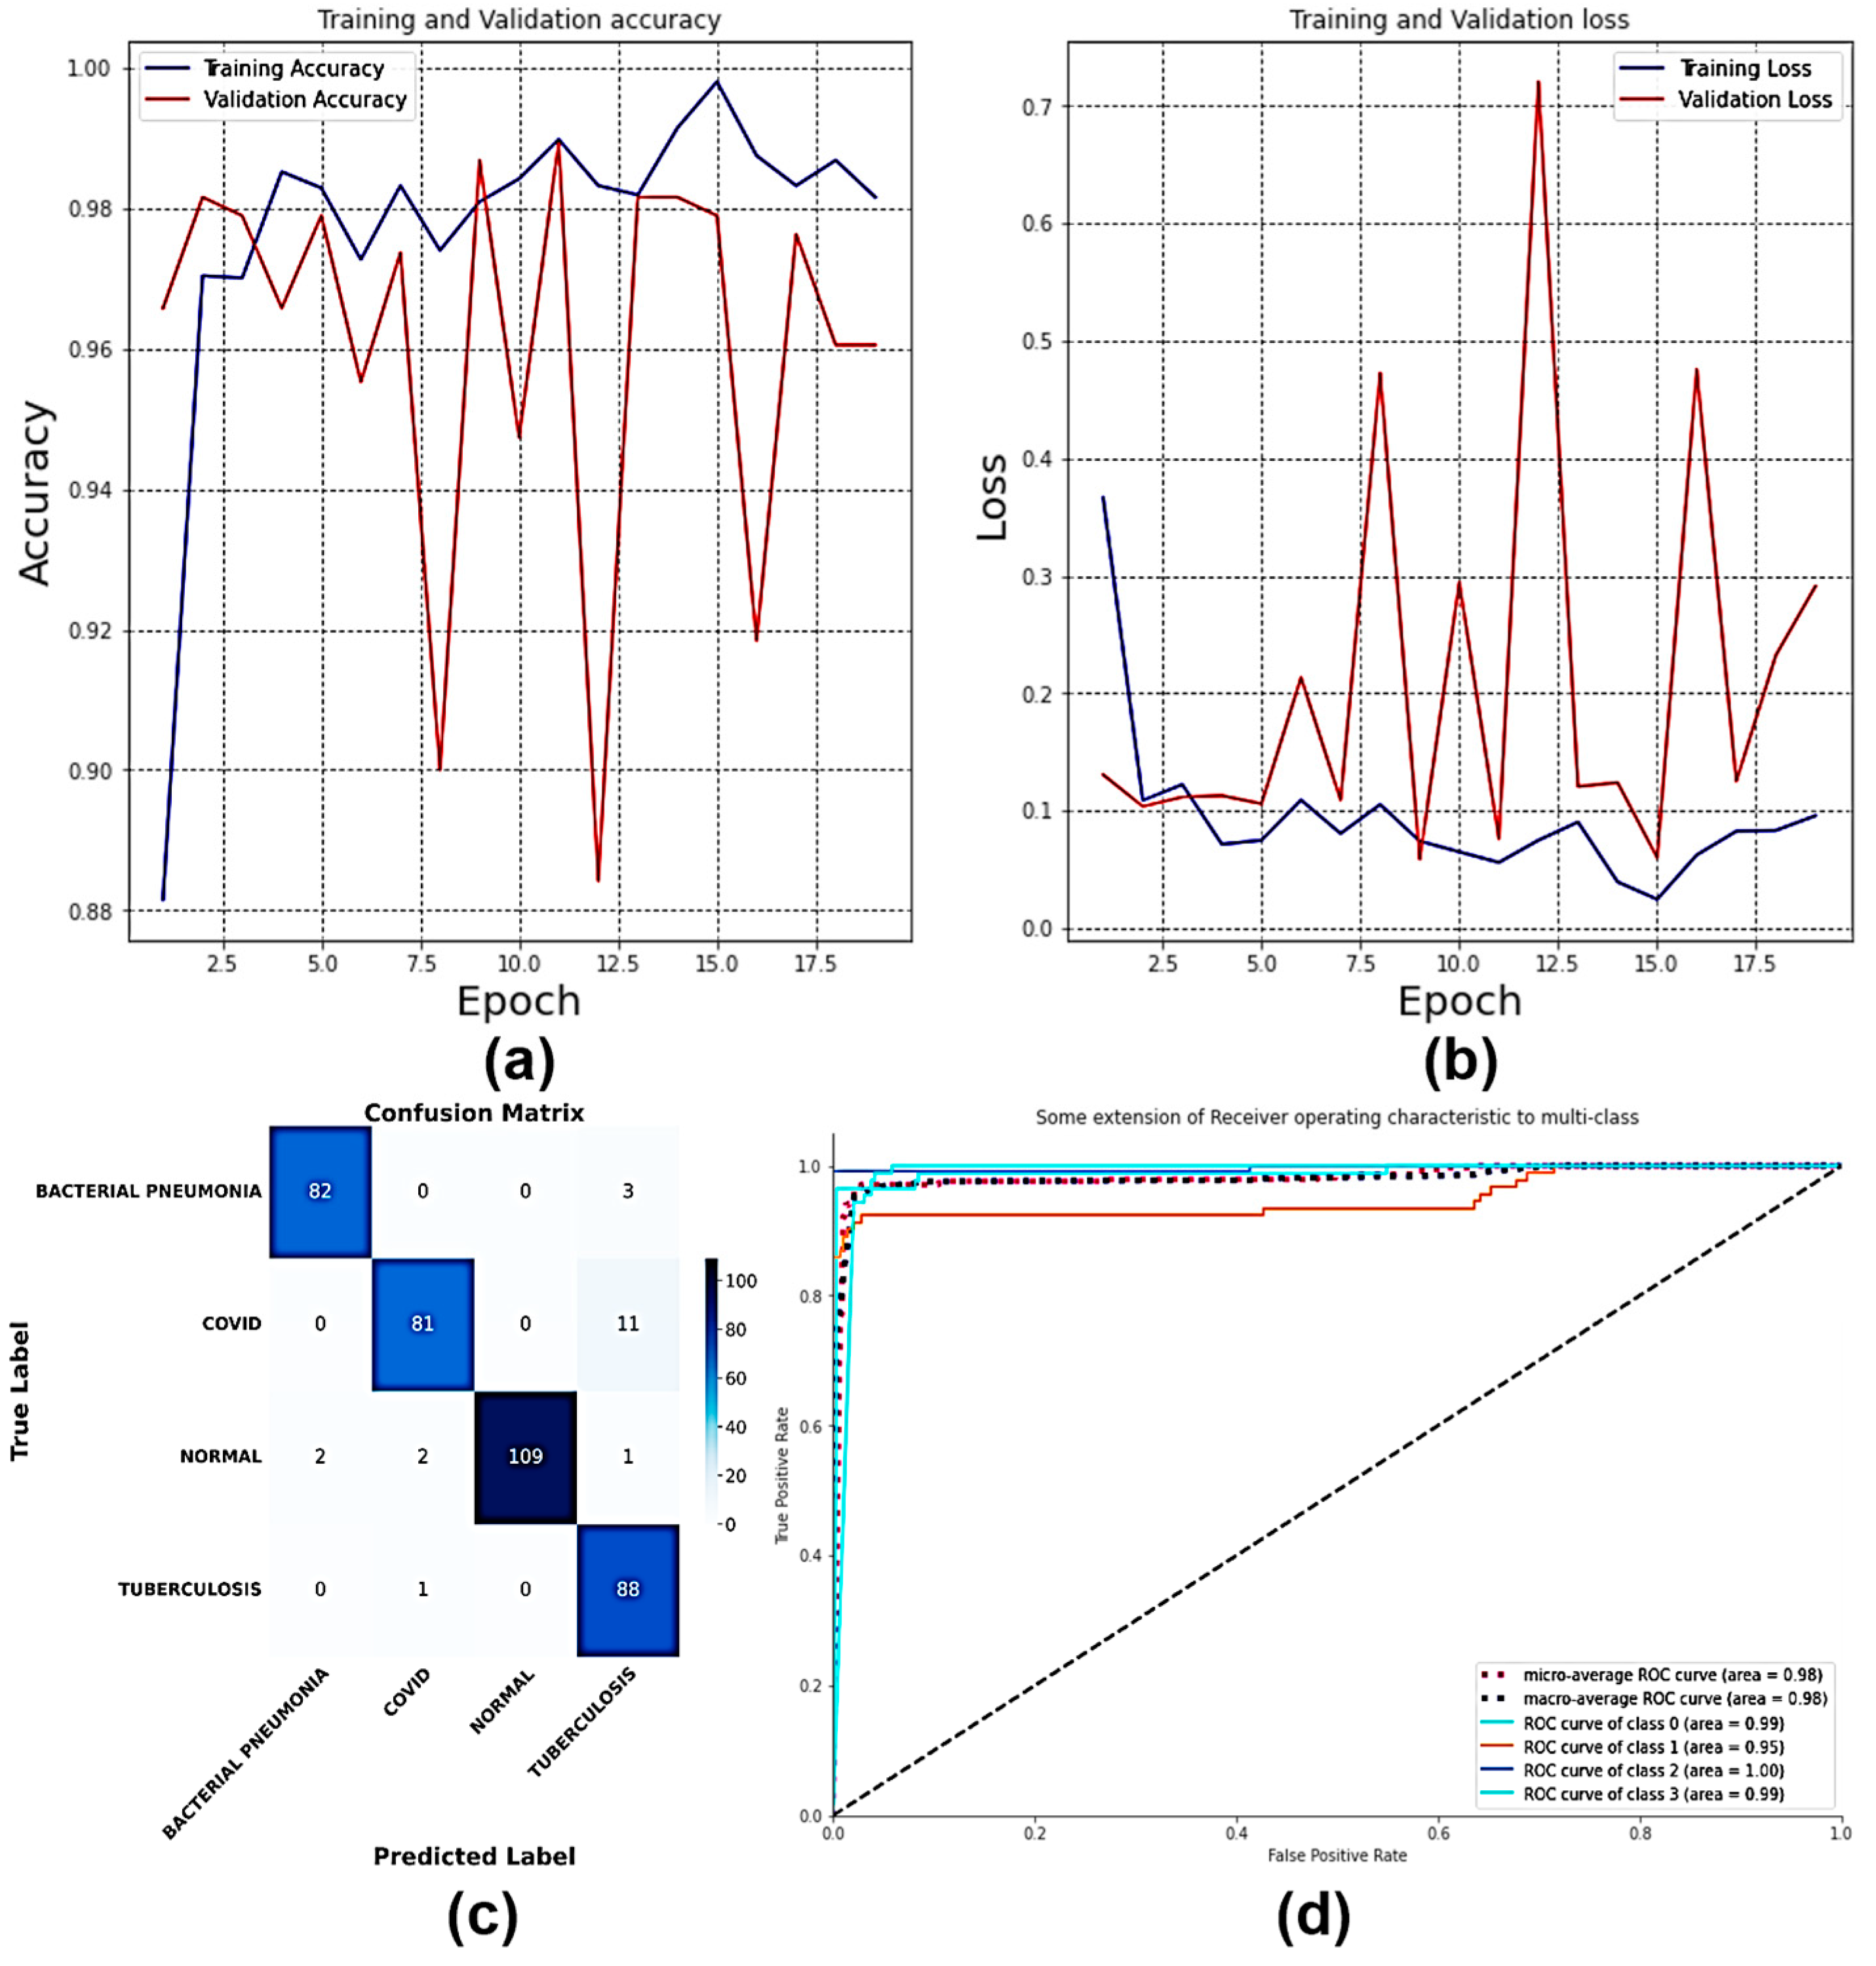
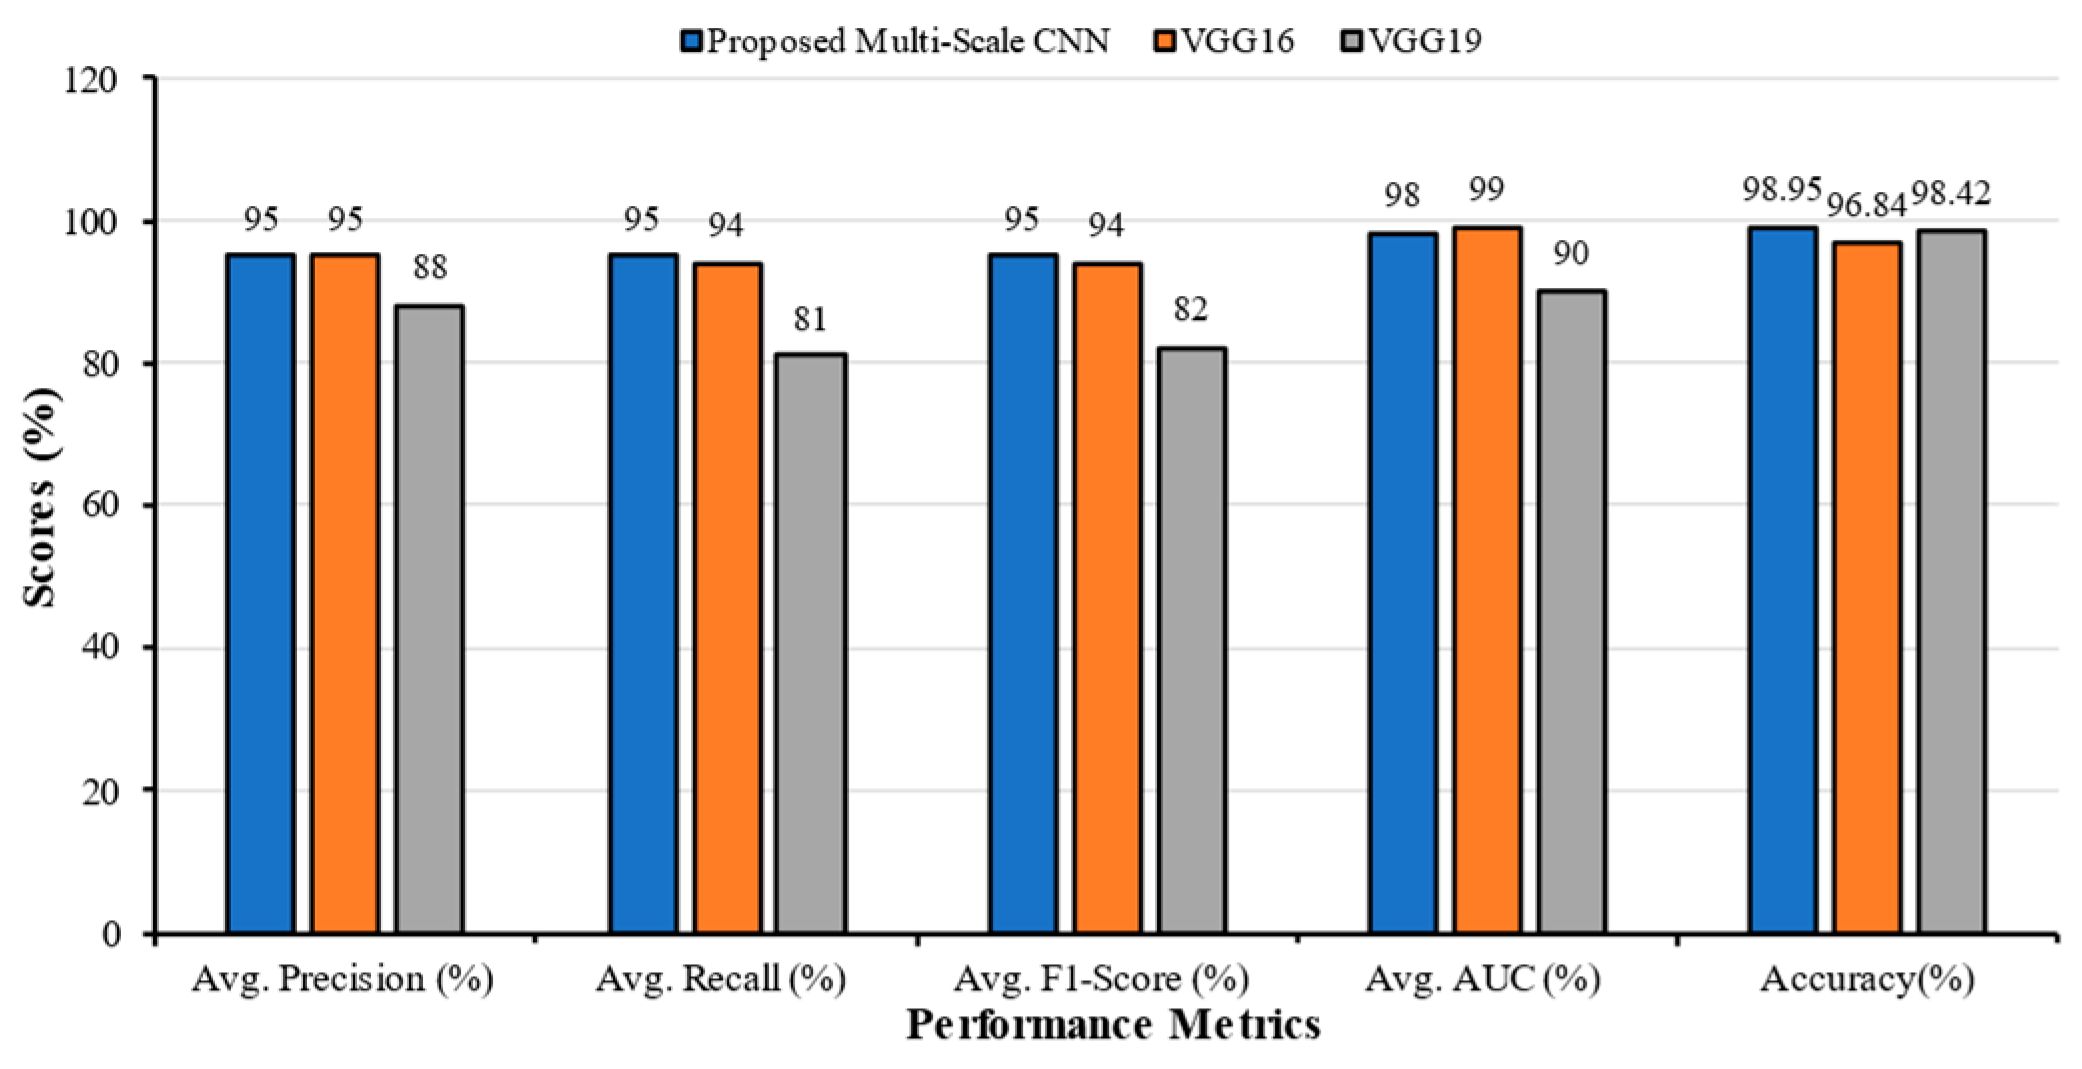
4.4. Classification of Dataset 4
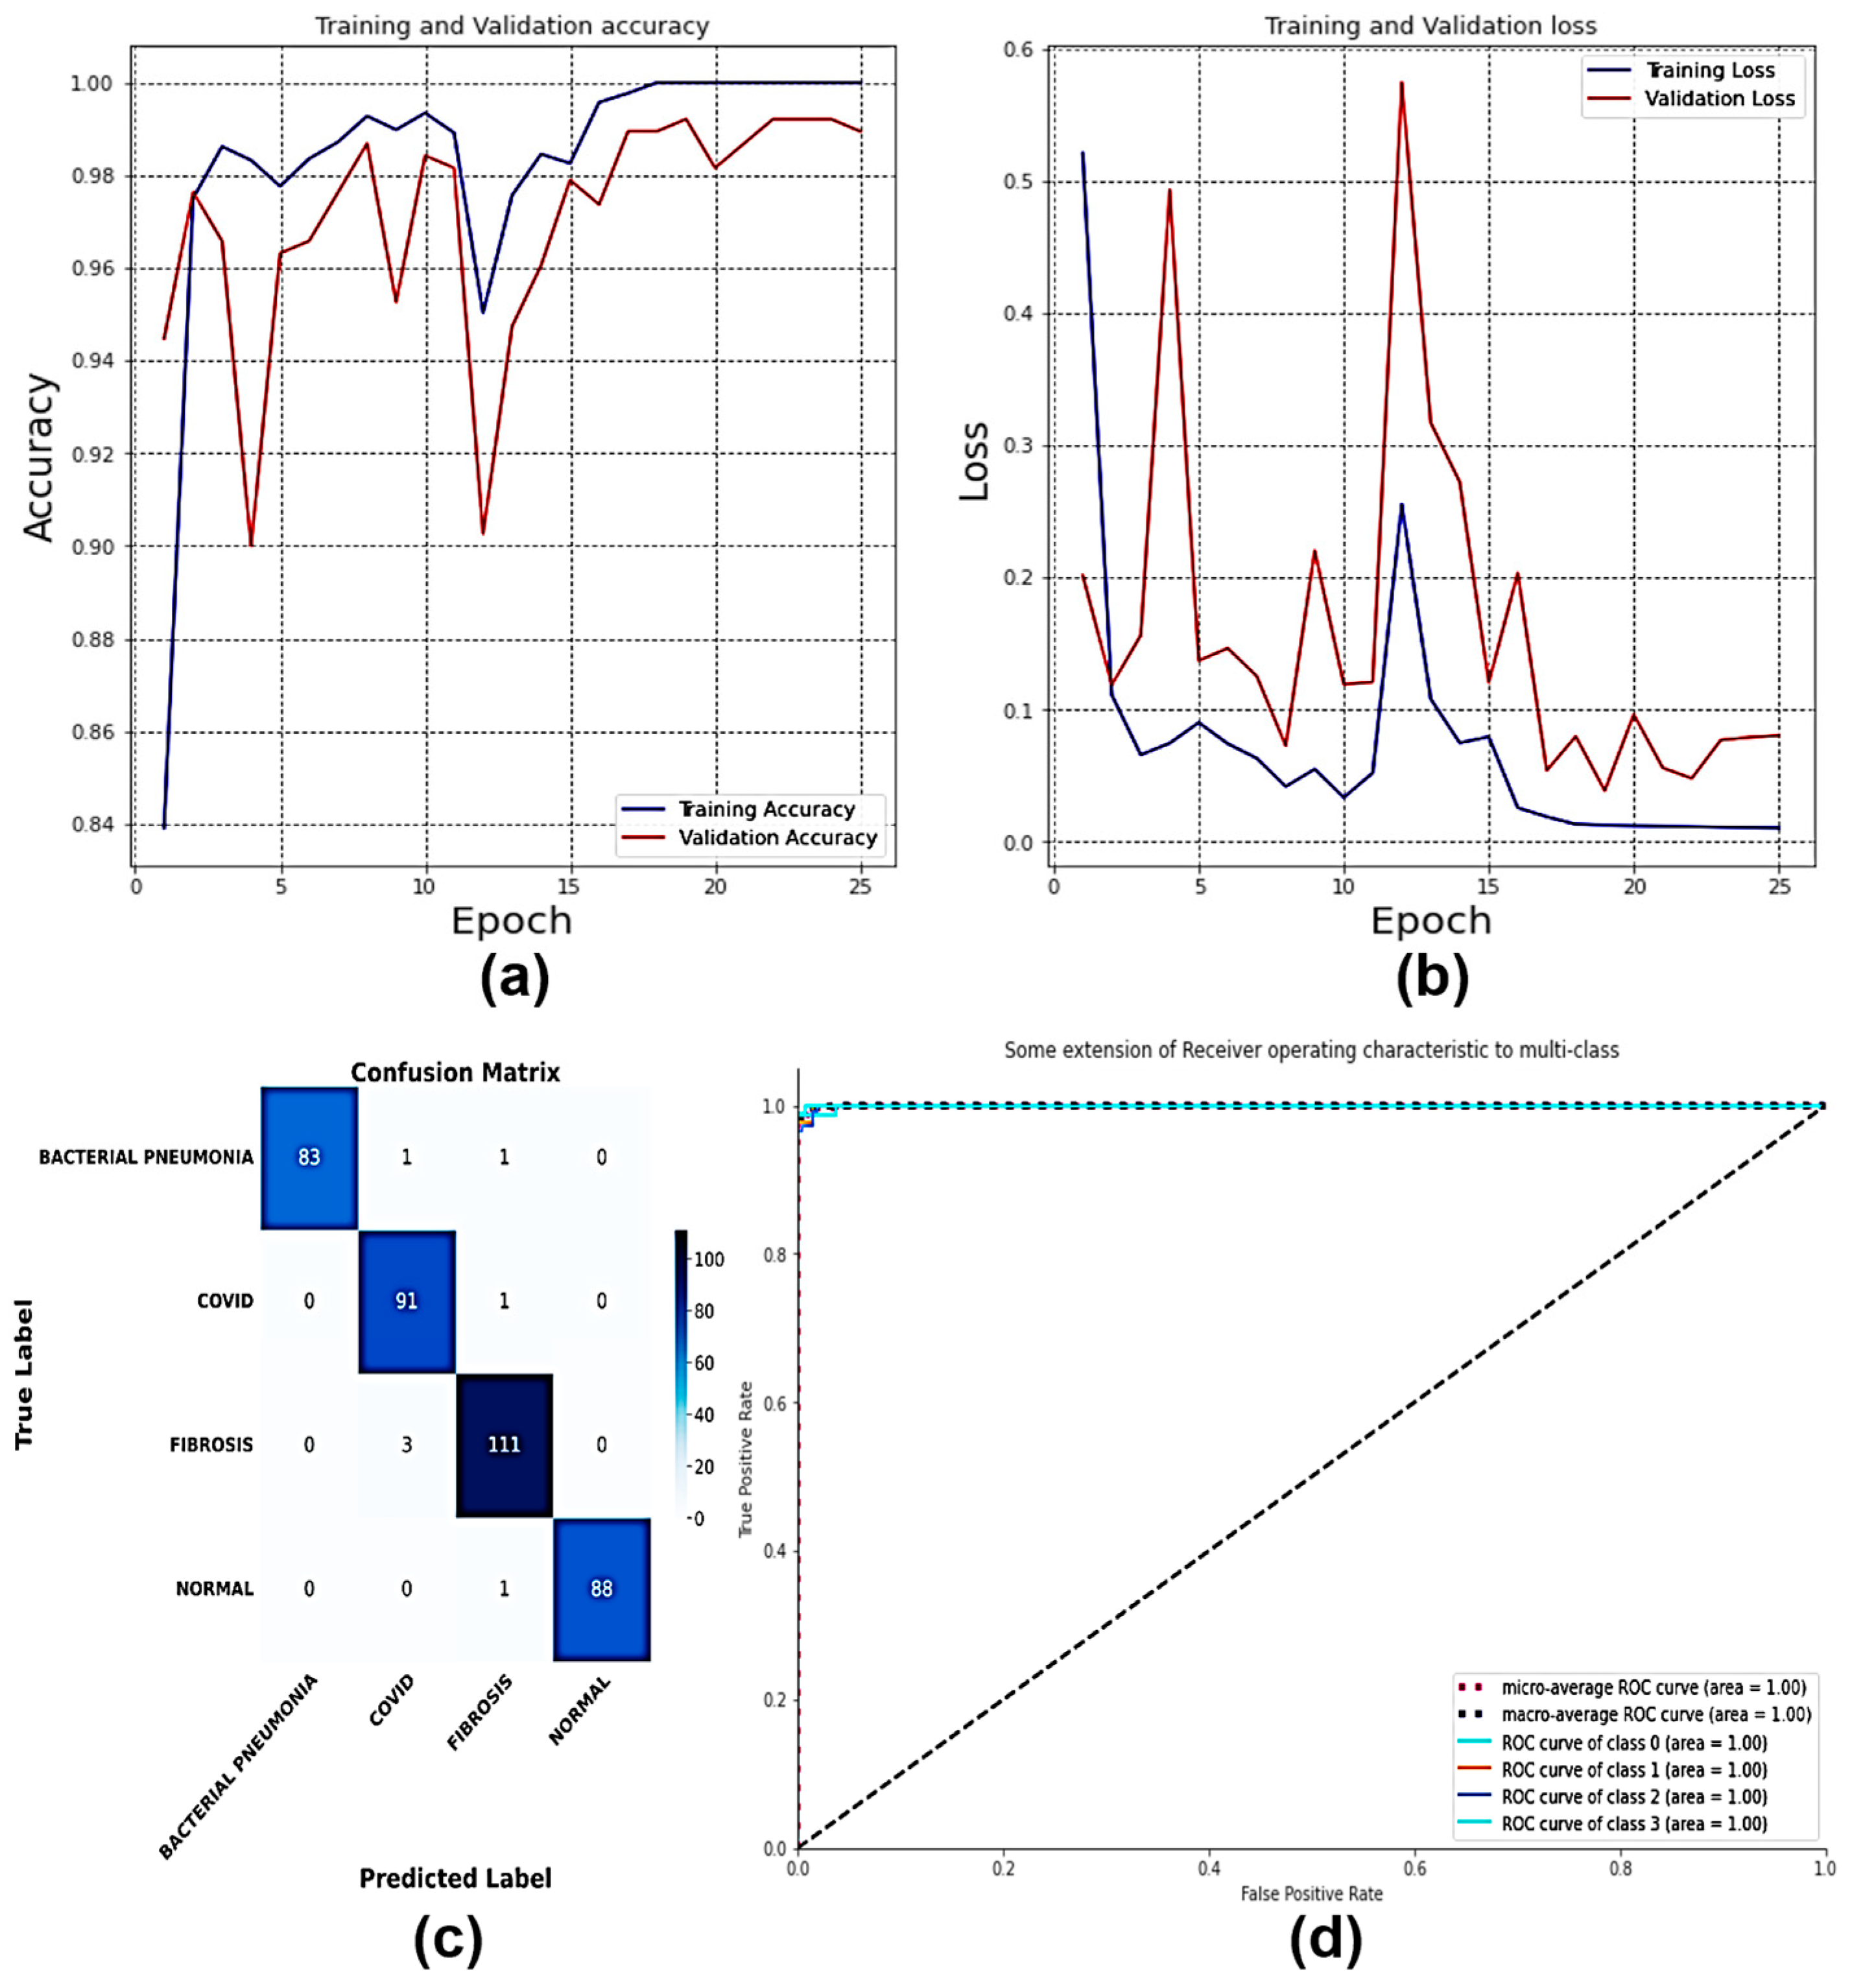
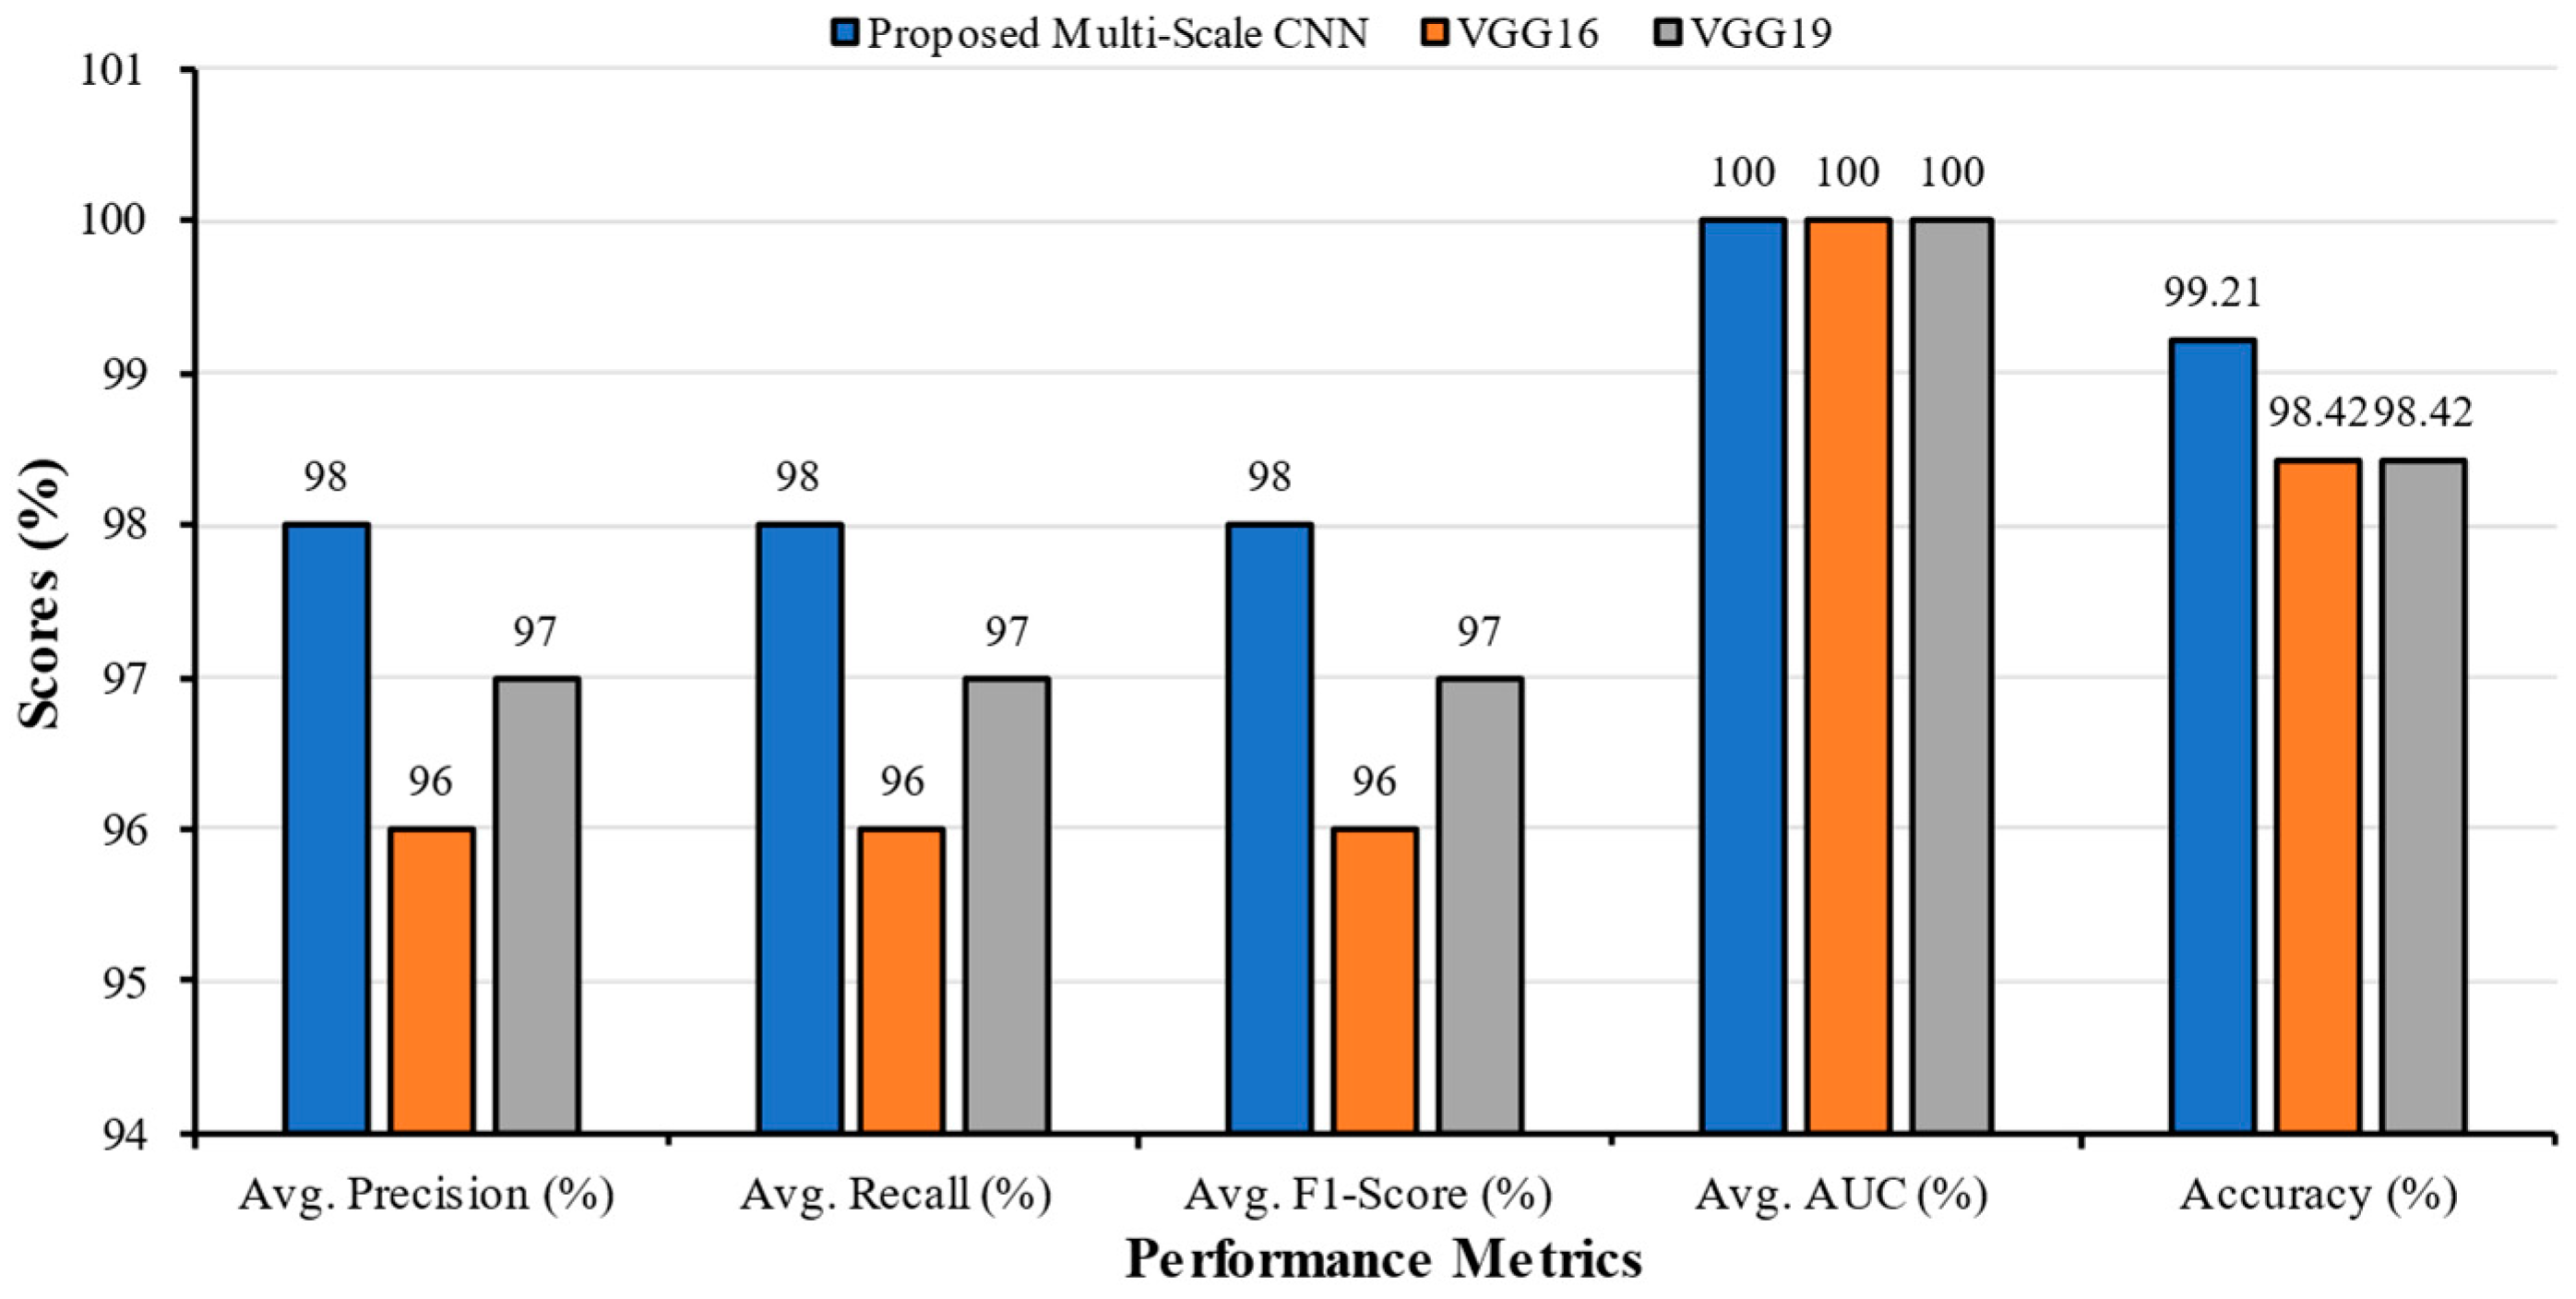
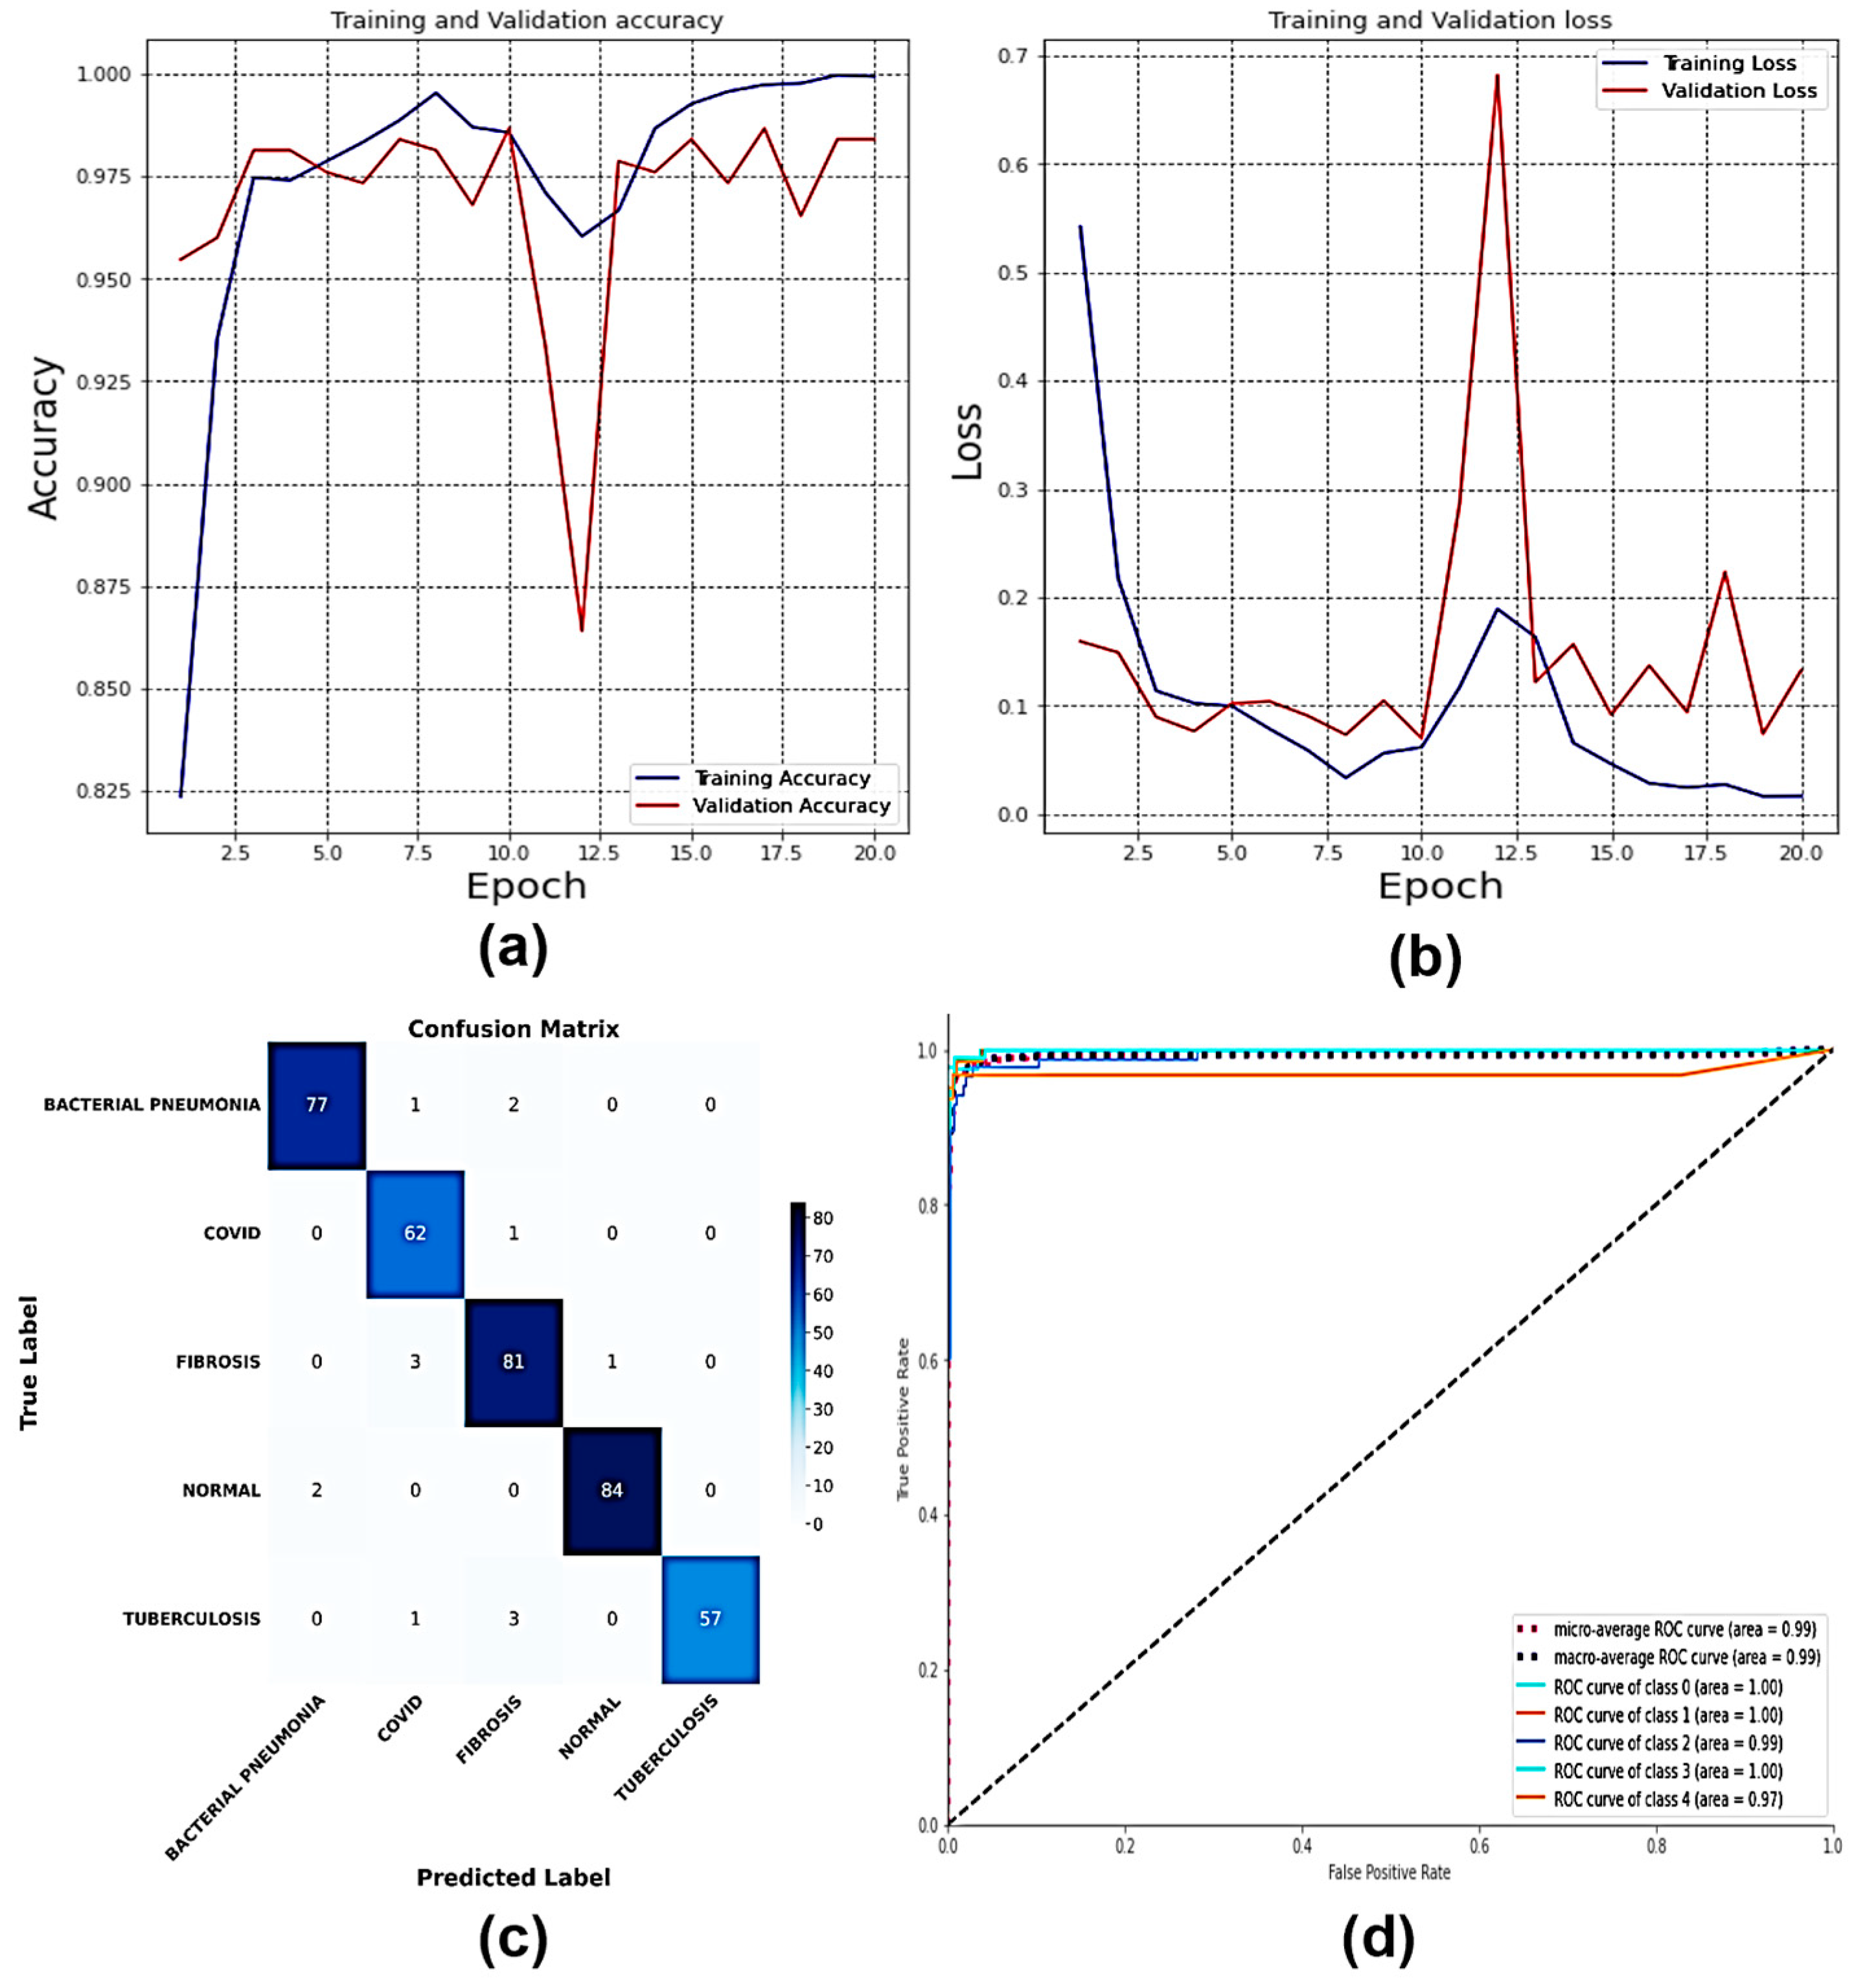
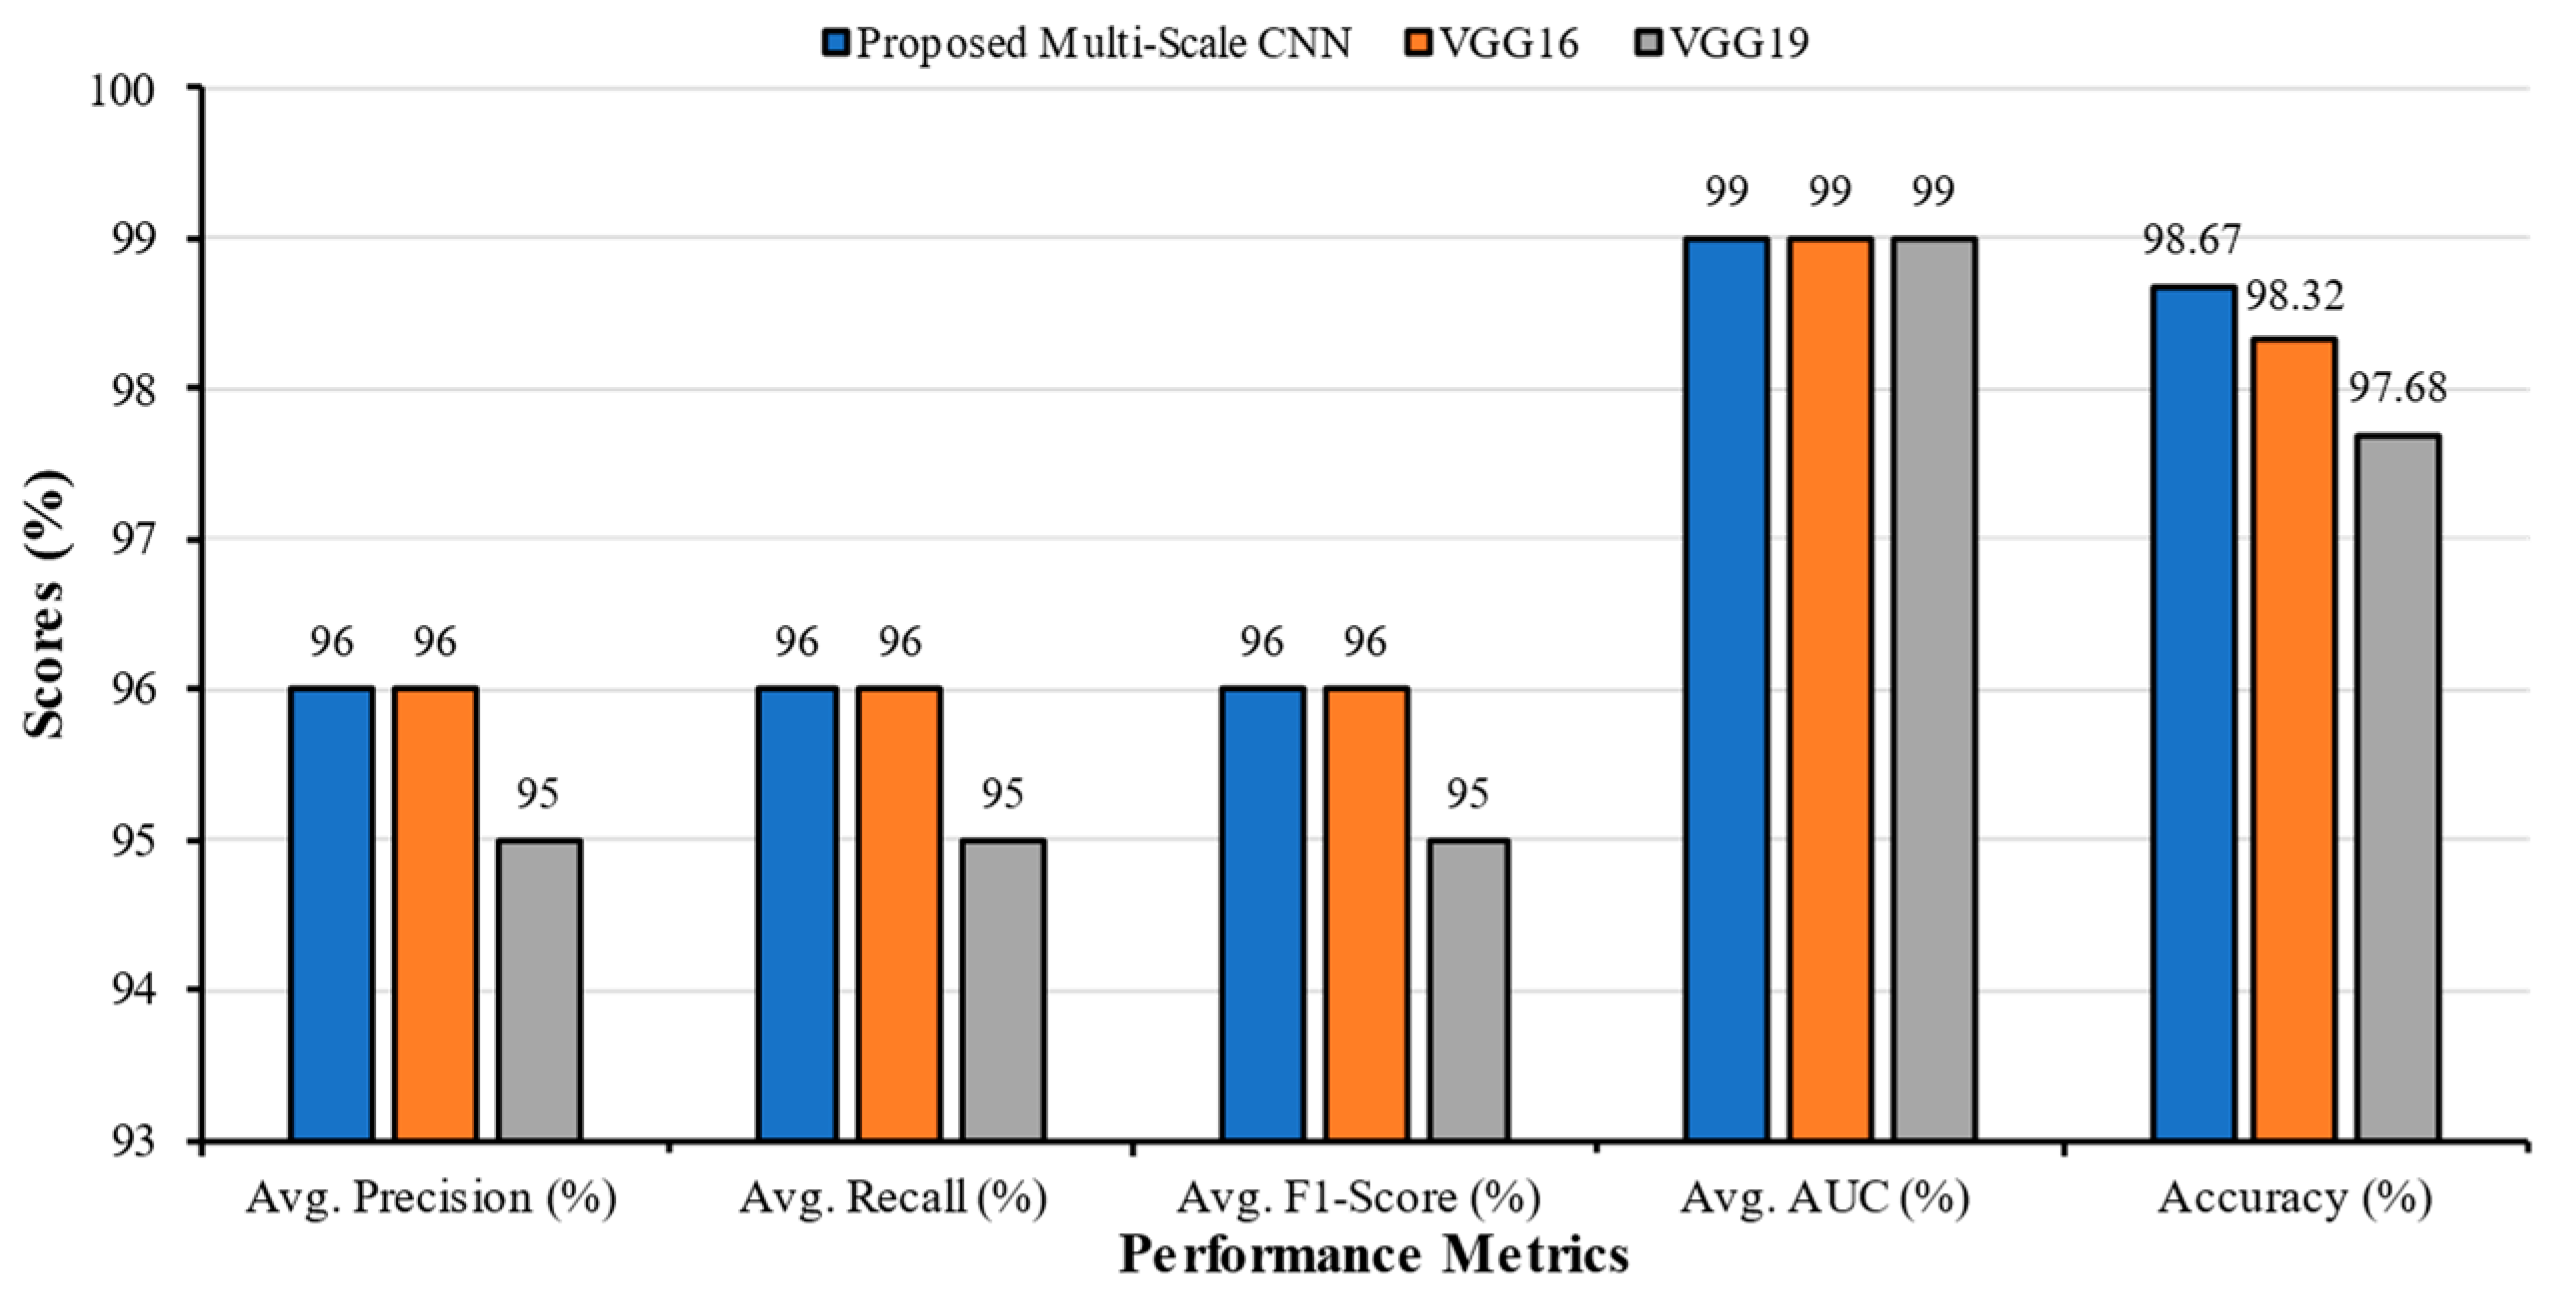
4.5. Classification of Dataset 5
4.6. Classification of Dataset 6
4.7. Classification of Dataset 7
4.8. Classification of Dataset 8
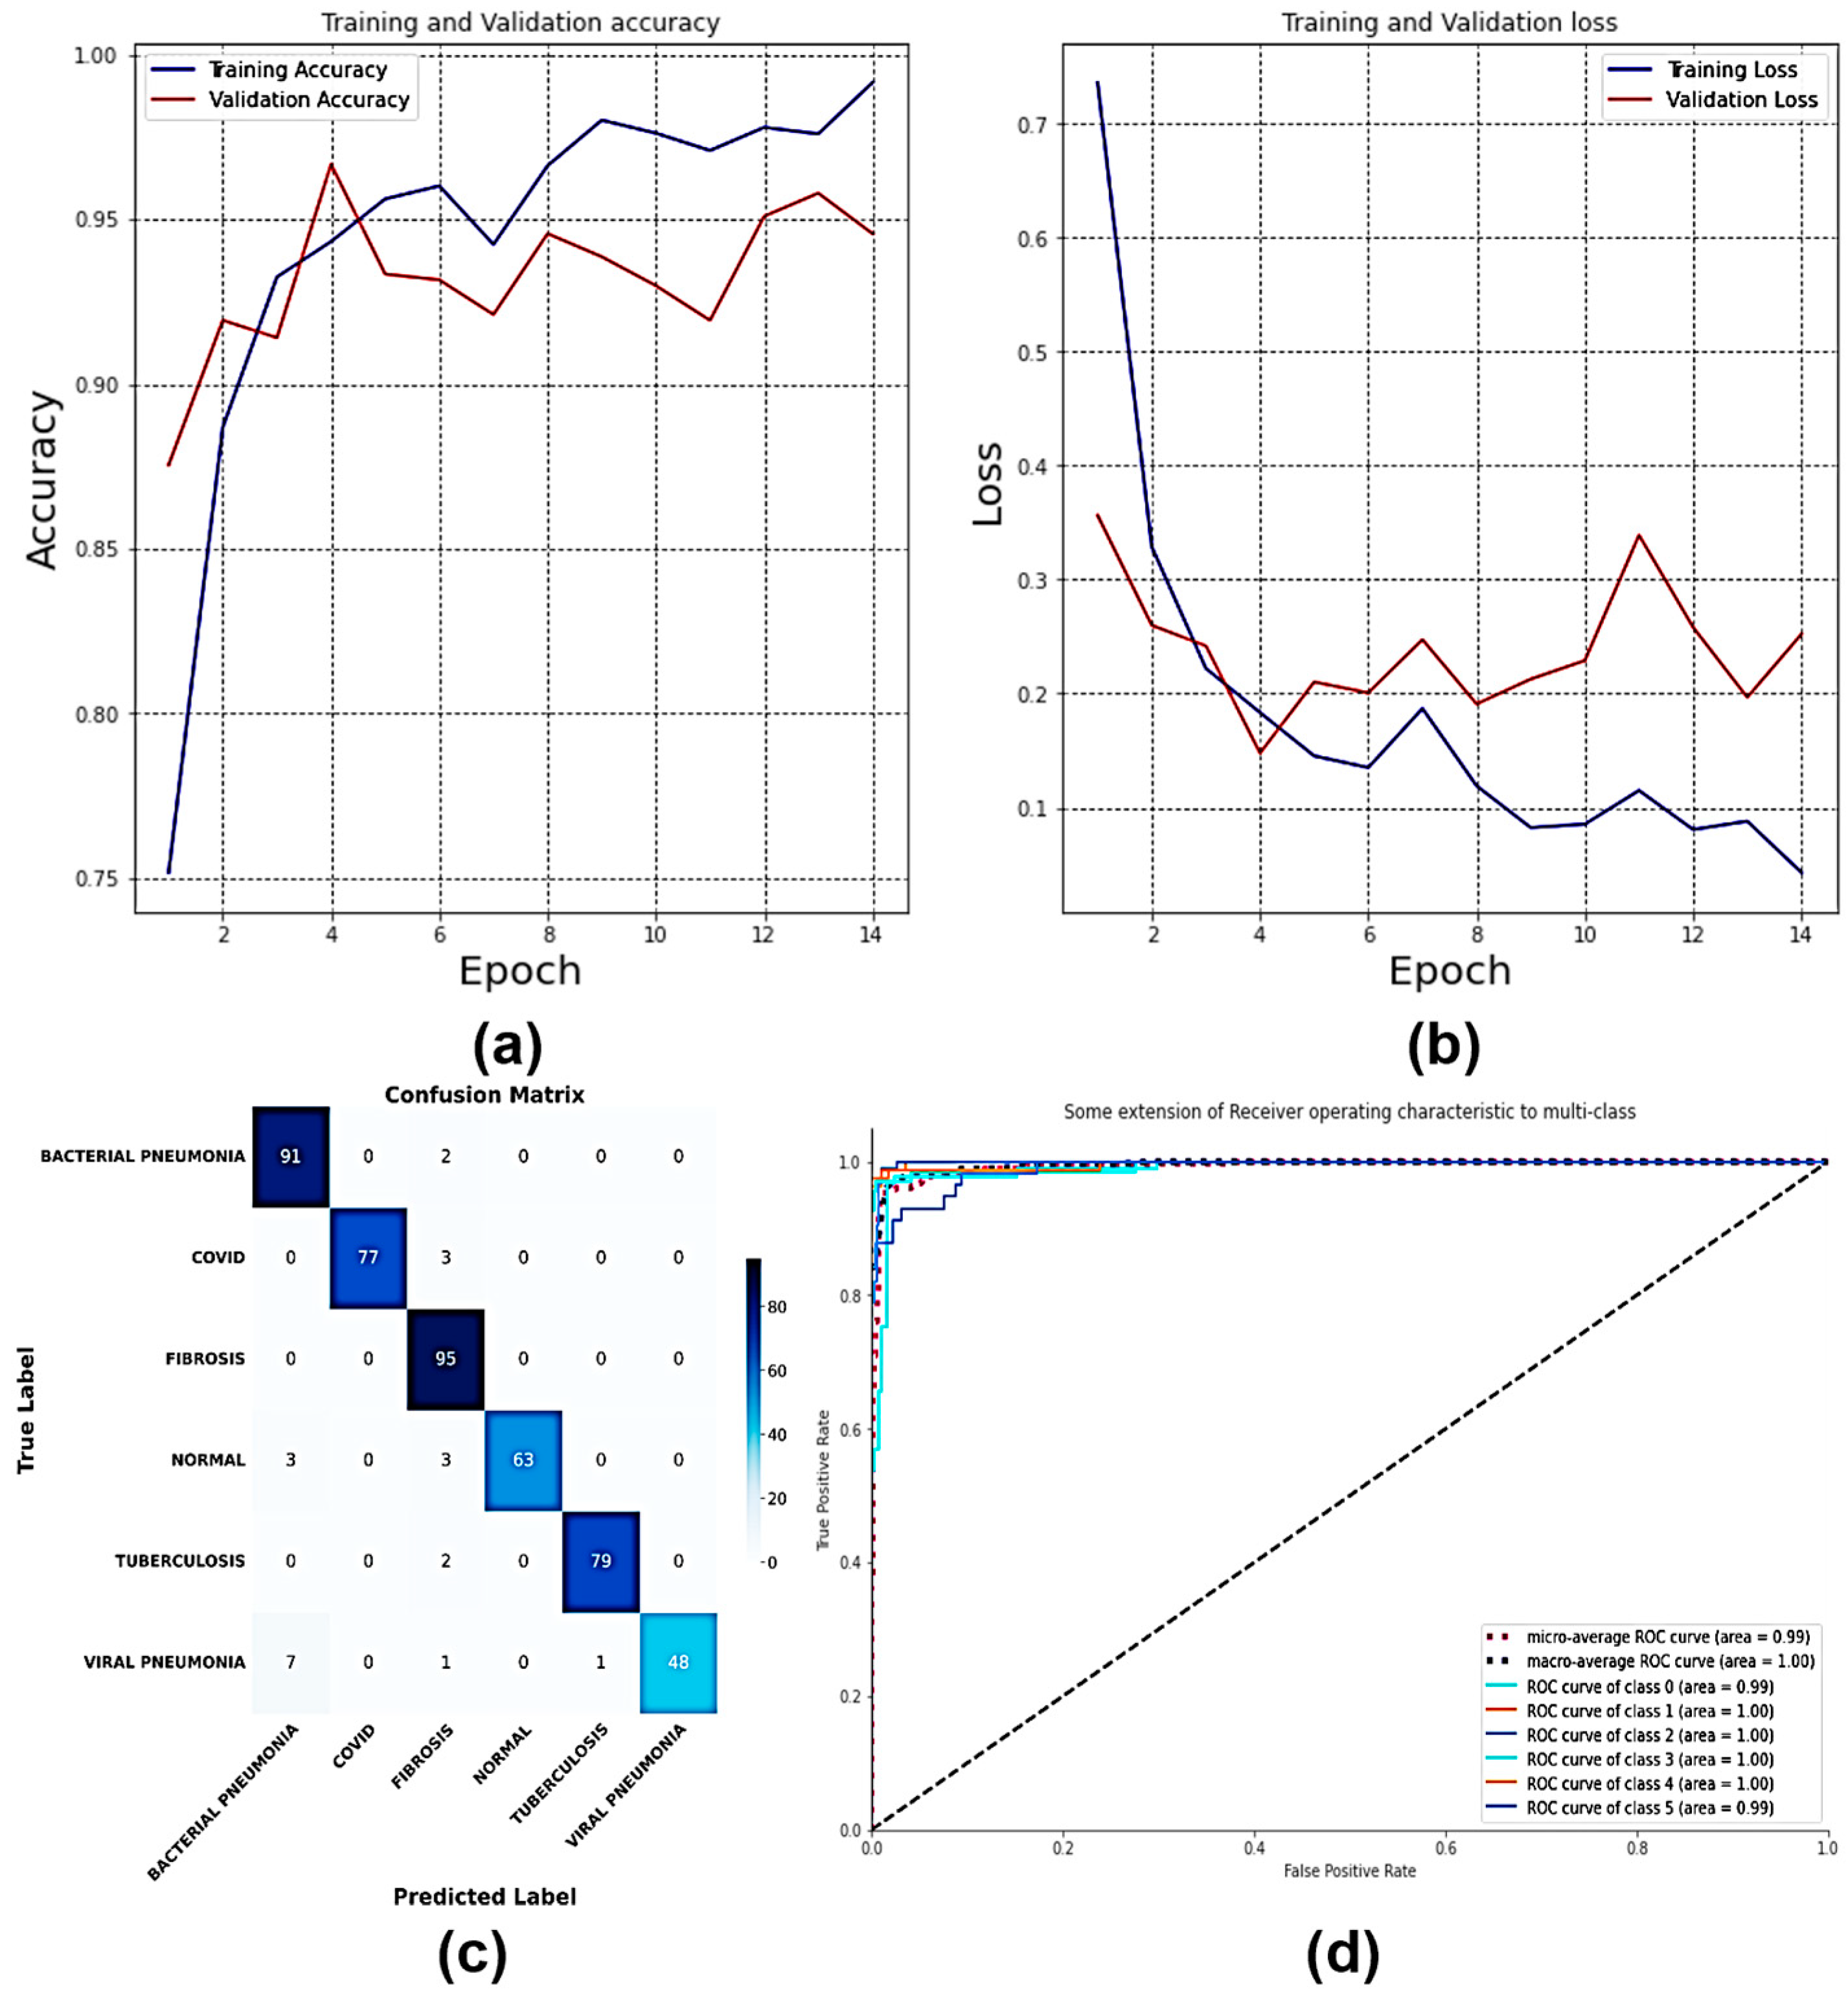
4.9. Classification of Dataset 9
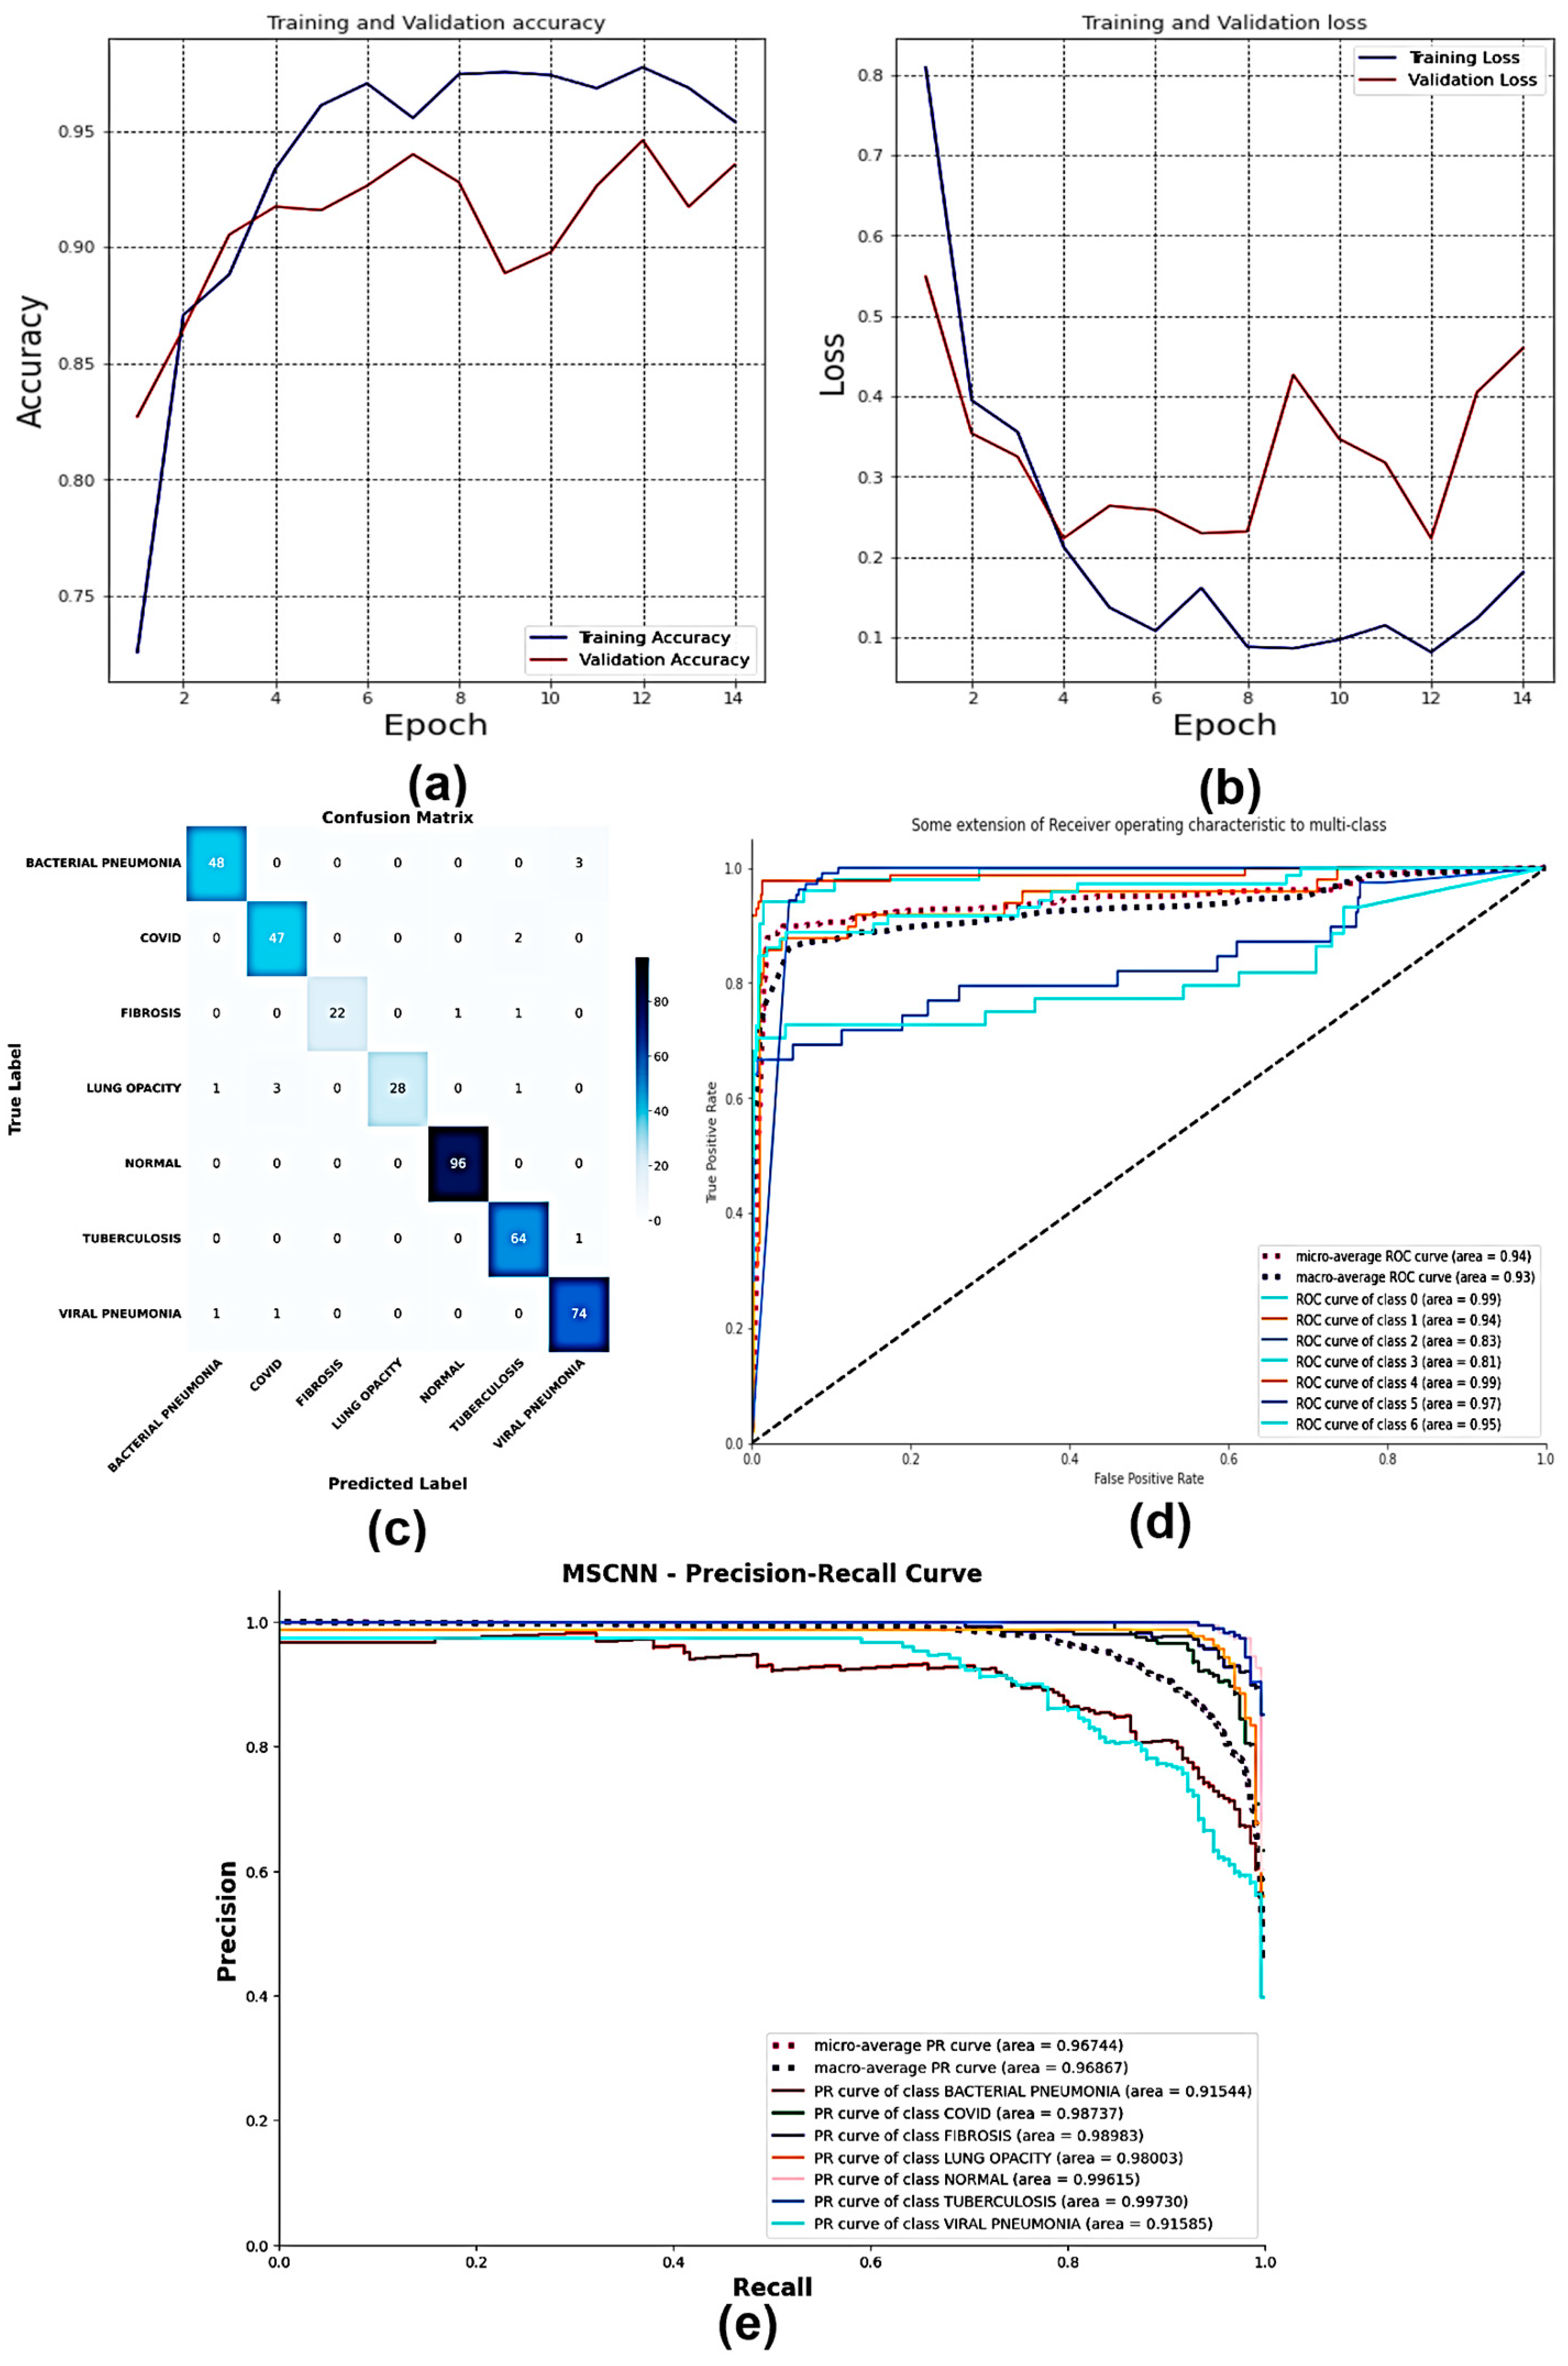
4.10. Classification of Dataset 10
4.11. Explainable AI on MS-CNN Interpretability
5. Discussion
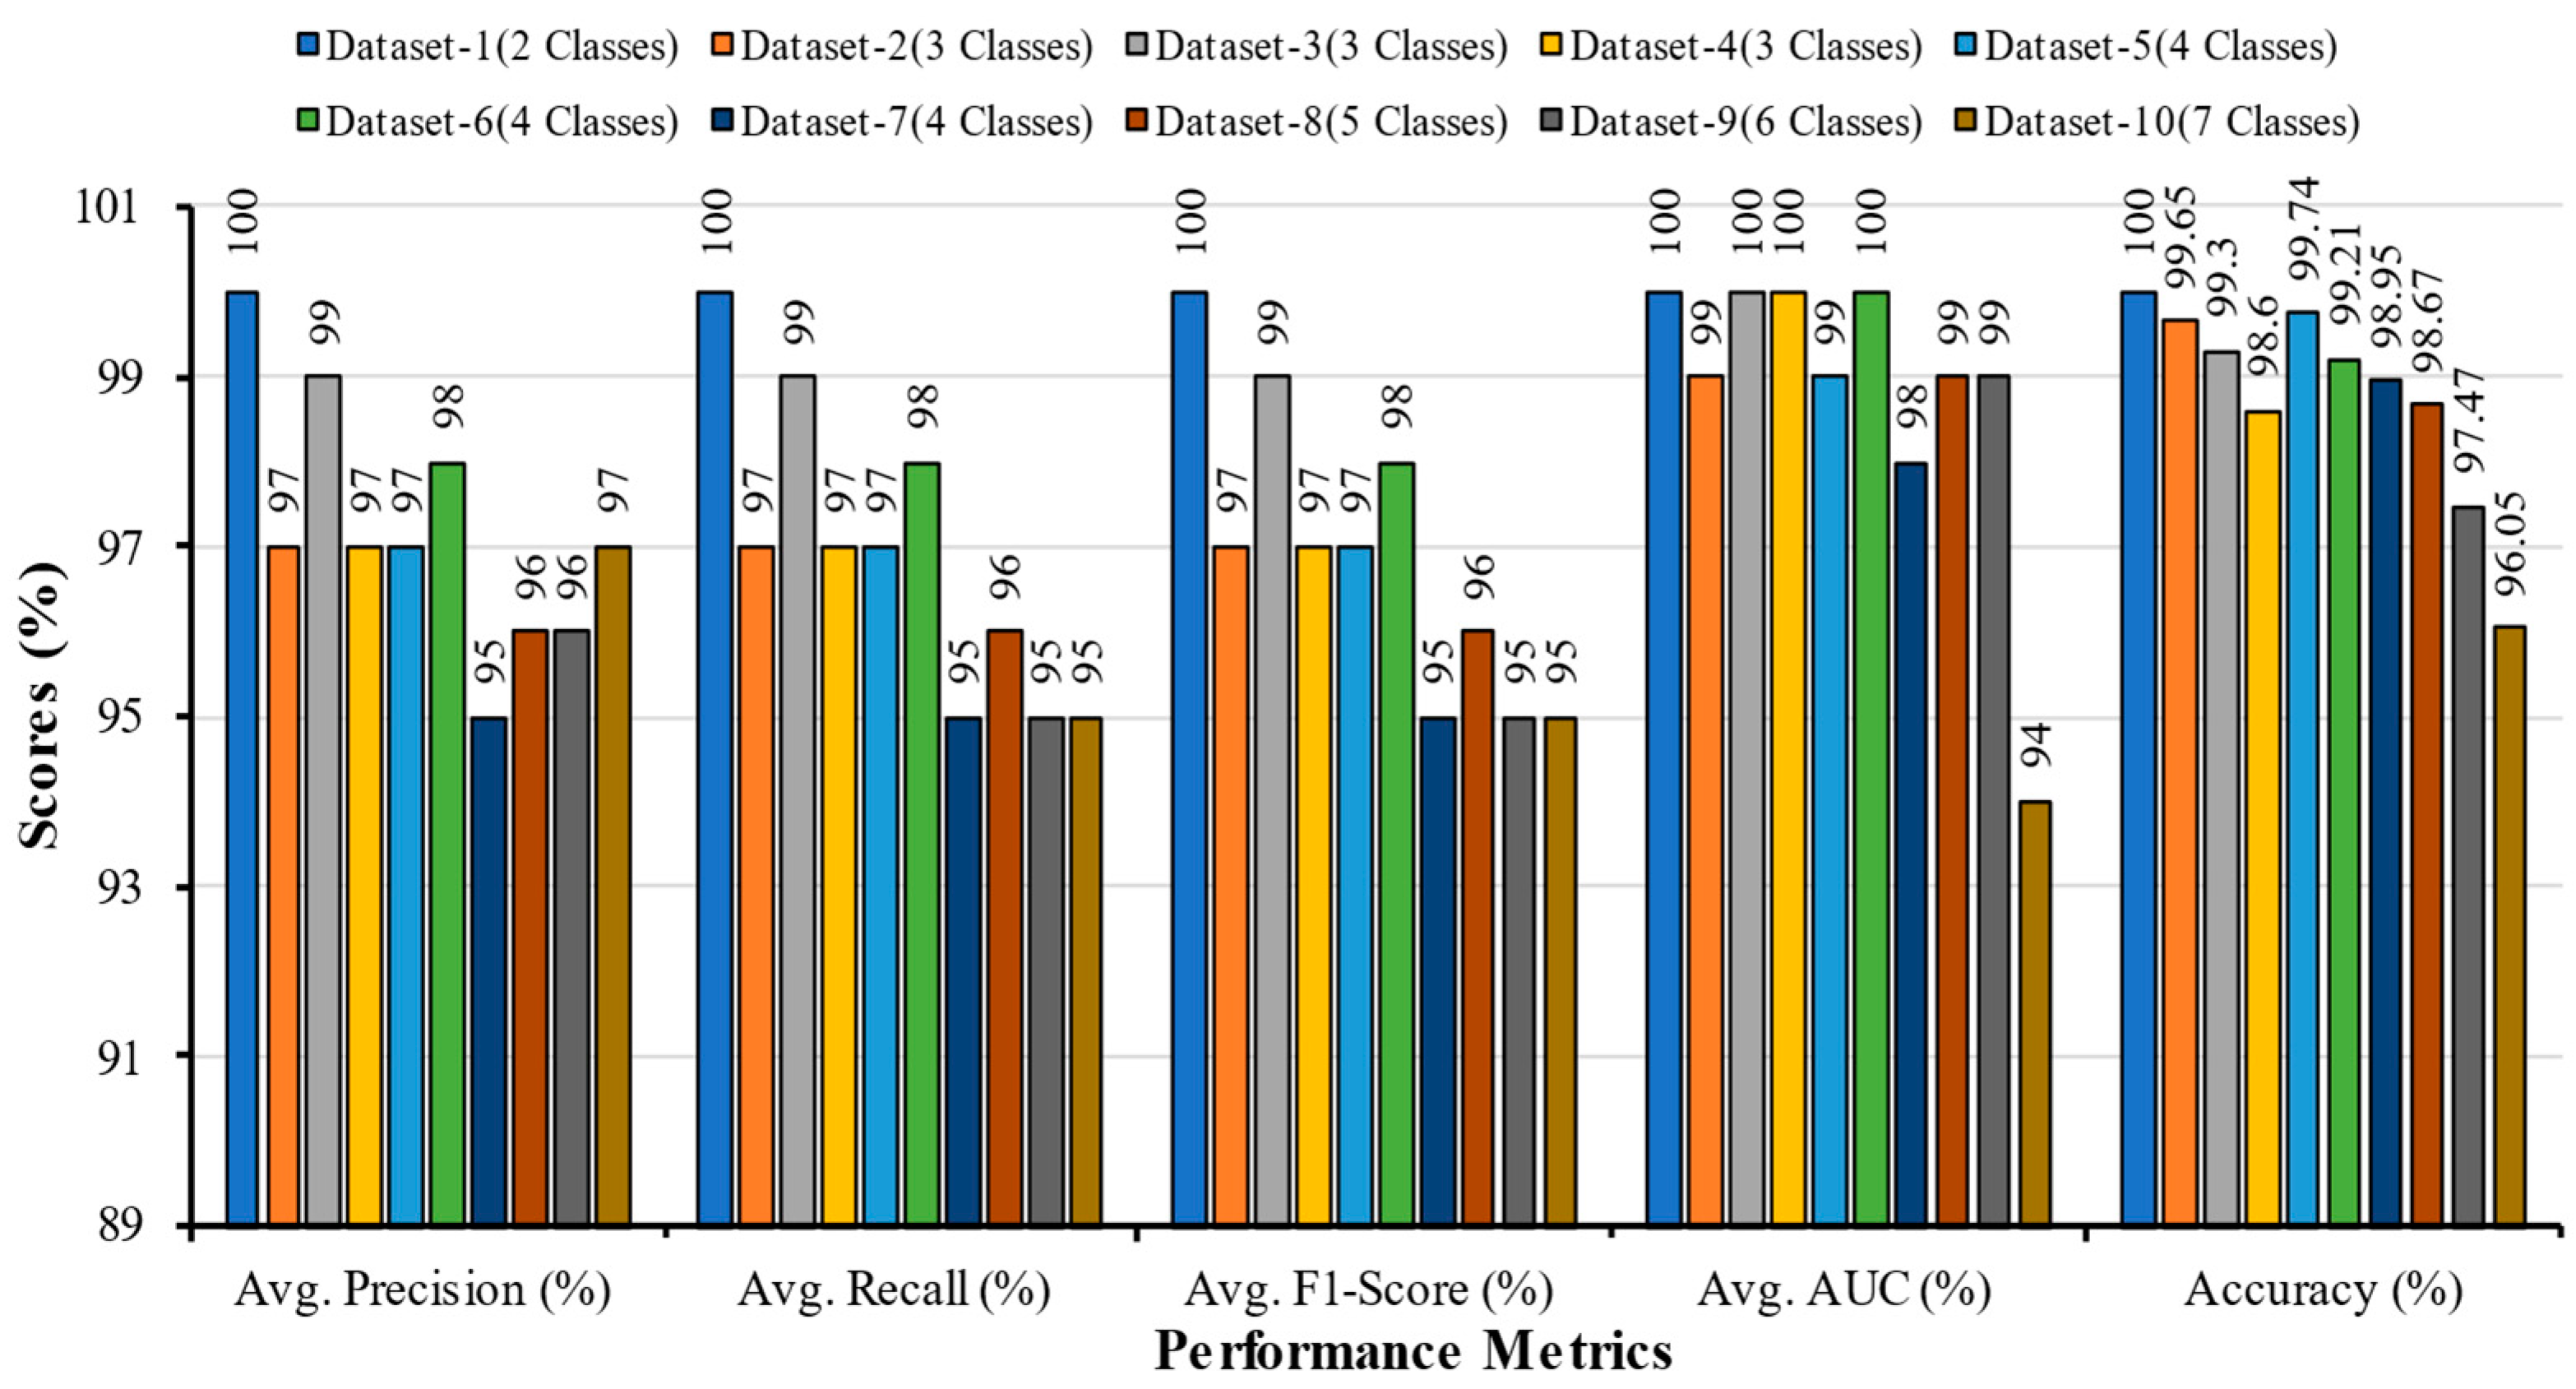
5.1. Comparative Analysis of Multi-Scale CNN with Different Datasets
5.2. Comparative Analysis of Multi-Scale CNN with other Research in the Literature
5.3. Comparison with Datasets of Other Literature
5.4. Comparison with State-of-the-Art Models on Dataset 10
5.5. Strength and Limitations
6. Conclusions
Author Contributions
Funding
Institutional Review Board Statement
Informed Consent Statement
Data Availability Statement
Conflicts of Interest
References
- Coronavirus Disease (COVID-19) Situation Reports. Available online: https://www.who.int/emergencies/diseases/novel-coronavirus-2019/situation-reports (accessed on 16 February 2023).
- Teixeira, L.O.; Pereira, R.M.; Bertolini, D.; Oliveira, L.S.; Nanni, L.; Cavalcanti, G.D.C.; Costa, Y.M.G. Impact of Lung Segmentation on the Diagnosis and Explanation of COVID-19 in Chest X-ray Images. Sensors 2021, 21, 7116. [Google Scholar] [CrossRef] [PubMed]
- Kim, S.; Rim, B.; Choi, S.; Lee, A.; Min, S.; Hong, M. Deep Learning in Multi-Class Lung Diseases’ Classification on Chest X-ray Images. Diagnostics 2022, 12, 915. [Google Scholar] [CrossRef]
- Alsharif, R.; Al-Issa, Y.; Alqudah, A.M.; Qasmieh, I.A.; Mustafa, W.A.; Alquran, H. PneumoniaNet: Automated Detection and Classification of Pediatric Pneumonia Using Chest X-ray Images and CNN Approach. Electronics 2021, 10, 2949. [Google Scholar] [CrossRef]
- Shamrat, F.M.J.M.; Azam, S.; Karim, A.; Islam, R.; Tasnim, Z.; Ghosh, P.; De Boer, F. LungNet22: A Fine-Tuned Model for Multiclass Classification and Prediction of Lung Disease Using X-ray Images. J. Pers. Med. 2022, 12, 680. [Google Scholar] [CrossRef] [PubMed]
- Antosz, K.; Machado, J.; Mazurkiewicz, D.; Antonelli, D.; Soares, F. Systems Engineering: Availability and Reliability. Appl. Sci. 2022, 12, 2504. [Google Scholar] [CrossRef]
- Martyushev, N.V.; Malozyomov, B.V.; Sorokova, S.N.; Efremenkov, E.A.; Valuev, D.V.; Qi, M. Review Models and Methods for Determining and Predicting the Reliability of Technical Systems and Transport. Mathematics 2023, 11, 3317. [Google Scholar] [CrossRef]
- Reshi, A.A.; Rustam, F.; Mehmood, A.; Alhossan, A.; Alrabiah, Z.; Ahmad, A.; Alsuwailem, H.; Choi, G.S. An Efficient CNN Model for COVID-19 Disease Detection Based on X-ray Image Classification. Complexity 2021, 2021, 6621607. [Google Scholar] [CrossRef]
- Muhammad, G.; Shamim Hossain, M. COVID-19 and Non-COVID-19 Classification using Multi-layers Fusion From Lung Ultrasound Images. Inf. Fusion 2021, 72, 80–88. [Google Scholar] [CrossRef]
- Mahajan, S.; Raina, A.; Gao, X.Z.; Pandit, A.K. COVID-19 detection using hybrid deep learning model in chest X-rays images. Concurr. Comput. Pract. Exp. 2021, 34, e6747. [Google Scholar] [CrossRef]
- Al-Waisy, A.S.; Al-Fahdawi, S.; Mohammed, M.A.; Abdulkareem, K.H.; Mostafa, S.A.; Maashi, M.S.; Arif, M.; Garcia-Zapirain, B. COVID-chexnet: Hybrid deep learning framework for identifying COVID-19 virus in chest X-rays images. Soft Comput. 2023, 27, 2657–2672. [Google Scholar] [CrossRef]
- Srivastava, G.; Chauhan, A.; Jangid, M.; Chaurasia, S. Covixnet: A novel and efficient deep learning model for detection of COVID-19 using chest X-ray images. Biomed. Signal Process Control 2022, 78, 103848. [Google Scholar] [CrossRef] [PubMed]
- Nahiduzzaman, M.; Goni, M.O.F.; Islam, M.R.; Sayeed, A.; Anower, M.S.; Ahsan, M.; Kowalski, M. Detection of various lung diseases including COVID-19 using extreme learning machine algorithm based on the features extracted from a lightweight CNN architecture. Biocybern. Biomed. Eng. 2023, 43, 528–550. [Google Scholar] [CrossRef]
- Akbulut, Y. Automated Pneumonia Based Lung Diseases Classification with Robust Technique Based on a Customized Deep Learning Approach. Diagnostics 2023, 13, 260. [Google Scholar] [CrossRef] [PubMed]
- Sultana, A.; Nahiduzzaman, M.; Bakchy, S.C.; Shahriar, S.M.; Peyal, H.I.; Chowdhury, M.E.H.; Khandakar, A.; Arselene Ayari, M.; Ahsan, M.; Haider, J. A Real Time Method for Distinguishing COVID-19 Utilizing 2D-CNN and Transfer Learning. Sensors 2023, 23, 4458. [Google Scholar] [CrossRef]
- Balan, E.; Saraniya, O. ‘Novel Neural Network Architecture Using Sharpened Cosine Similarity for Robust Classification of COVID-19, Pneumonia and Tuberculosis Diseases from X-rays’. J. Intell. Fuzzy Syst. 2023, 44, 6065–6078. [Google Scholar] [CrossRef]
- Hussain; Hasan, M.; Rahman, M.A.; Lee, I.; Tamanna, T.; Parvez, M.Z. Corodet: A deep learning based classification for COVID-19 detection using chest X-ray images. Chaos Solitons Fractals 2021, 142, 110495. [Google Scholar] [CrossRef] [PubMed]
- Al-Timemy, H.; Khushaba, R.N.; Mosa, Z.M.; Escudero, J. An efficient mixture of deep and machine learning models for COVID-19 and tuberculosis detection using X-ray images in resource limited settings. In Artificial Intelligence for COVID 19; Springer: Cham, Switzerland, 2021; pp. 77–100. [Google Scholar]
- Ghoshal, B.; Tucker, A. Estimating Uncertainty and Interpretability in Deep Learning for Coronavirus 685 (COVID-19) Detection. arXiv 2020, arXiv:2003.10769. [Google Scholar]
- Narin, A.; Kaya, C.; Pamuk, Z. Automatic Detection of Coronavirus Disease (COVID-19) Using X-ray Images 687 and Deep Convolutional Neural Networks. Pattern Anal. Appl. 2020, 24, 1207–1220. [Google Scholar] [CrossRef]
- Oh, Y.; Park, S.; Ye, J.C. Deep learning COVID-19 features on CXR using limited training data sets. IEEE Trans. Med. Imaging 2020, 39, 2688–2700. [Google Scholar] [CrossRef]
- Jain, R.; Gupta, M.; Taneja, S.; Hemanth, D.J. Deep learning based detection and analysis of COVID-19 on chest X-ray images. Appl. Intell. 2021, 51, 1690–1700. [Google Scholar] [CrossRef]
- Yoo, S.H.; Geng, H.; Chiu, T.L.; Yu, S.K.; Cho, D.C.; Heo, J.; Choi, M.S.; Choi, I.H.; Cung Van, C.; Nhung, N.V.; et al. Deep learning-based decision-tree classifier for COVID-19 diagnosis from chest X-ray imaging. Front. Med. 2020, 7, 427. [Google Scholar] [CrossRef]
- Pereira, R.M.; Bertolini, D.; Teixeira, L.O.; Silla, C.N.; Costa, Y.M.G. COVID-19 identification in chest X-ray images on flat and hierarchical classification scenarios. Comput. Methods Programs Biomed. 2020, 194, 105532. [Google Scholar] [CrossRef] [PubMed]
- Sakib, S.; Tazrin, T.; Fouda, M.M.; Fadlullah, Z.M.; Guizani, M. DL-CRC: Deep Learning-based chest radiograph classification for COVID-19 detection: A novel approach. IEEE Access 2020, 8, 171575–171589. [Google Scholar] [CrossRef] [PubMed]
- Makris, A.; Kontopoulos, I.; Tserpes, K. COVID-19 detection from chest X-ray images using deep learning and Convolutional Neural Networks. In Proceedings of the 11th Hellenic Conference on Artificial Intelligence, Athens, Greece, 2–4 September 2020. [Google Scholar]
- El Asnaoui, K.; Chawki, Y. Using X-ray images and deep learning for automated detection of coronavirus disease. J. Biomol. Struct. Dyn. 2020, 39, 3615–3626. [Google Scholar] [CrossRef]
- Saiz, F.; Barandiaran, I. COVID-19 detection in chest X-ray images using a deep learning approach. Int. J. Interact. Multimed. Artif. Intell. 2020, 6, 4. [Google Scholar] [CrossRef]
- Hemdan, E.E.-D.; Shouman, M.A.; Karar, M.E. COVIDX-Net: A Framework of Deep Learning Classifiers to Diagnose COVID-19 in X-ray Images. arXiv 2020, arXiv:2003.11055. [Google Scholar]
- Rahimzadeh, M.; Attar, A. A modified deep convolutional neural network for detecting COVID-19 and pneumonia from chest X-ray images based on the concatenation of xception and resnet50v2. Inform. Med. Unlocked 2020, 19, 100360. [Google Scholar] [CrossRef]
- Rahman, T. COVID-19 Radiography Database. Available online: https://www.kaggle.com/datasets/tawsifurrahman/covid19-radiography-database/versions/3 (accessed on 16 February 2023).
- Sait, U.; Lal KV, G.; Prakash Prajapati, S.; Bhaumik, R.; Kumar, T.; Shivakumar, S.; Bhalla, K. Curated Dataset for COVID-19 Posterior-Anterior Chest Radiography Images (X-rays). Mendeley Data 2021, 3. [Google Scholar]
- Rosenthal, A.; Gabrielian, A.; Engle, E.; Hurt, D.E.; Alexandru, S.; Crudu, V.; Sergueev, E.; Kirichenko, V.; Lapitskii, V.; Snezhko, E.; et al. The TB Portals: An open-access, web-based platform for global drug-resistant-tuberculosis data sharing and analysis. J. Clin. Microbiol. 2017, 55, 3267–3282. [Google Scholar] [CrossRef]
- NIH Chest X-ray Dataset. Available online: https://datasets.activeloop.ai/docs/ml/datasets/nih-chest-x-ray-dataset (accessed on 9 August 2023).
- VGG16. Available online: https://docs.openvino.ai/latest/omz_models_model_vgg16.html (accessed on 9 August 2023).
- Nahiduzzaman, M.; Ahamed, M.F.; Alghamdi, N.S.; Islam, S.M.R. Shap-Guided Gastrointestinal Disease Classification with Lightweight Parallel Depthwise Separable Cnn and Ridge Regression Elm. Available online: https://papers.ssrn.com/sol3/papers.cfm?abstract_id=4572243 (accessed on 31 July 2023).
- Sarkar, O.; Islam, M.R.; Hossain, T.; Syfullah, M.K.; Islam, M.T.; Moniruzzaman, M. An empirical model of classifying lung affected diseases to detect COVID-19 using chest X-ray employing convolutional neural architecture. In Proceedings of the 2022 IEEE International Conference on Artificial Intelligence in Engineering and Technology (IICAIET), Kota Kinabalu, Malaysia, 13–15 September 2022. [Google Scholar]


| Datasets | Number of Classes | Class Names | Samples for Training (80%) | Samples for Testing (10%) | Samples for Validation (10%) | Total Samples (100%) |
|---|---|---|---|---|---|---|
| Dataset 1 | 2 | COVID | 760 | 95 | 95 | 1900 |
| Normal | 760 | 95 | 95 | |||
| Dataset 2 | 3 | Fibrosis | 760 | 95 | 95 | 2850 |
| COVID | 760 | 95 | 95 | |||
| Normal | 760 | 95 | 95 | |||
| Dataset 3 | 3 | COVID | 760 | 95 | 95 | 2850 |
| Normal | 760 | 95 | 95 | |||
| Tuberculosis | 760 | 95 | 95 | |||
| Dataset 4 | 3 | Bacterial Pneumonia | 760 | 95 | 95 | 2850 |
| COVID | 760 | 95 | 95 | |||
| Normal | 760 | 95 | 95 | |||
| Dataset 5 | 4 | COVID | 760 | 95 | 95 | 3800 |
| Fibrosis | 760 | 95 | 95 | |||
| Normal | 760 | 95 | 95 | |||
| Tuberculosis | 760 | 95 | 95 | |||
| Dataset 6 | 4 | Bacterial Pneumonia | 760 | 95 | 95 | 3800 |
| COVID | 760 | 95 | 95 | |||
| Fibrosis | 760 | 95 | 95 | |||
| Normal | 760 | 95 | 95 | |||
| Dataset 7 | 4 | Bacterial Pneumonia | 760 | 95 | 95 | 3800 |
| COVID | 760 | 95 | 95 | |||
| Normal | 760 | 95 | 95 | |||
| Tuberculosis | 760 | 95 | 95 | |||
| Dataset 8 | 5 | Bacterial Pneumonia | 760 | 95 | 95 | 4750 |
| COVID | 760 | 95 | 95 | |||
| Fibrosis | 760 | 95 | 95 | |||
| Normal | 760 | 95 | 95 | |||
| Tuberculosis | 760 | 95 | 95 | |||
| Dataset 9 | 6 | Bacterial Pneumonia | 760 | 95 | 95 | 5700 |
| COVID | 760 | 95 | 95 | |||
| Fibrosis | 760 | 95 | 95 | |||
| Normal | 760 | 95 | 95 | |||
| Tuberculosis | 760 | 95 | 95 | |||
| Viral Pneumonia | 760 | 95 | 95 | |||
| Dataset 10 | 7 | Bacterial Pneumonia | 760 | 95 | 95 | 6650 |
| COVID | 760 | 95 | 95 | |||
| Fibrosis | 760 | 95 | 95 | |||
| Lung Opacity | 760 | 95 | 95 | |||
| Normal | 760 | 95 | 95 | |||
| Tuberculosis | 760 | 95 | 95 | |||
| Viral Pneumonia | 760 | 95 | 95 |
| Name | Parameters |
|---|---|
| Programming Language | Python |
| Environment | Microsoft VS Code (1.74.3) |
| Backend | Keras with TensorFlow |
| Processor | Intel(R) Core (TM) i7-10700K |
| Installed RAM | 32 GB |
| GPU | NVIDIA GeForce, RTX 2080 Ti 11 GB |
| Operating system | Windows 11 Pro |
| Input | Chest X-ray Images |
| Input Size | 300 × 300 |
| Hyperparameters | Values/Types |
|---|---|
| Epoch | 25 |
| Batch Size | 16 |
| Learning Rate | 0.0001 |
| Patience | 10 |
| Optimizer | Adam |
| Loss Function | Categorical Cross Entropy |
| Classification Models | Classes | Precision | Recall | F1-Score | AUC | Accuracy | Average Precision | Average Recall | Average F1-Score | Average AUC |
|---|---|---|---|---|---|---|---|---|---|---|
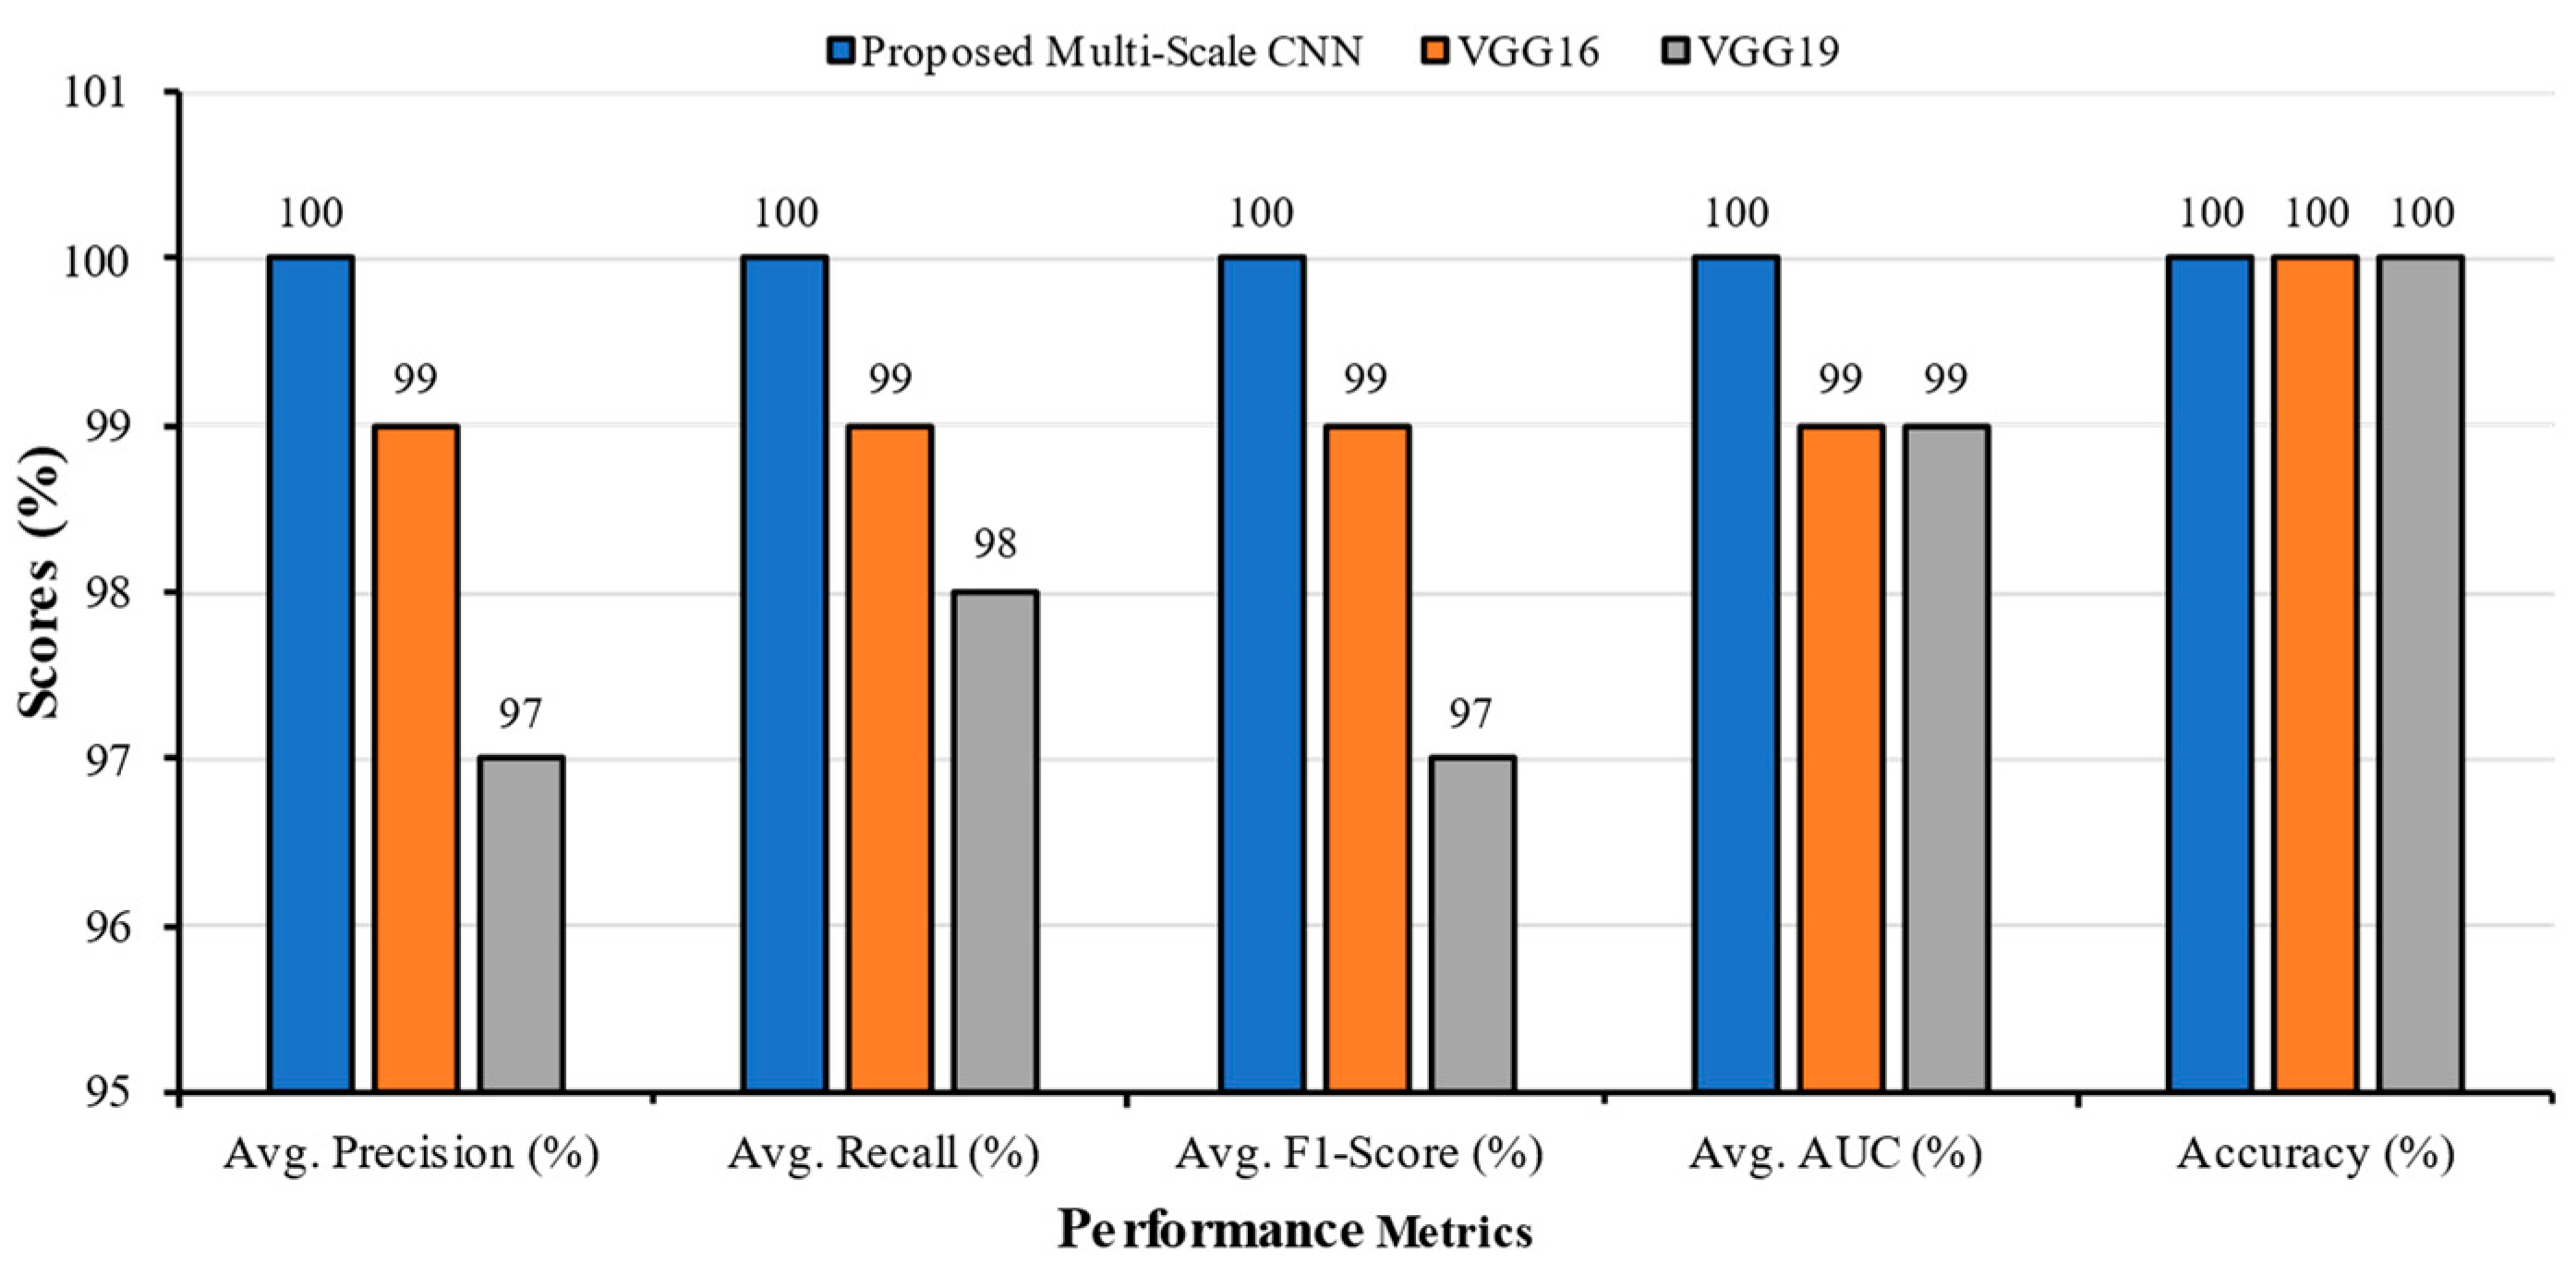
| Multi-Scale CNN | COVID | 1.00 | 1.00 | 1.00 | 1.00 | 100 | 1.00 | 1.00 | 1.00 | 1.00 |
| Normal | 1.00 | 1.00 | 1.00 | 1.00 | ||||||
| VGG16 | COVID | 1.00 | 0.99 | 0.99 | 1.00 | 100 | 0.99 | 0.99 | 0.99 | 0.99 |
| Normal | 0.99 | 1.00 | 1.00 | 0.99 | ||||||
| VGG19 | COVID | 0.95 | 1.00 | 0.97 | 0.98 | 100 | 0.97 | 0.98 | 0.97 | 0.99 |
| Normal | 1.00 | 0.95 | 0.98 | 1.00 |
| Classification Models | Classes | Precision | Recall | F1-Score | AUC | Accuracy (%) | Average Precision | Average Recall | Average F1-Score | Average AUC |
|---|---|---|---|---|---|---|---|---|---|---|
| Multi-Scale CNN | COVID | 0.98 | 0.99 | 0.99 | 1.00 | 99.65 | 0.97 | 0.97 | 0.97 | 0.99 |
| Fibrosis | 0.94 | 0.98 | 0.96 | 0.99 | ||||||
| Normal | 1.00 | 0.94 | 0.97 | 0.99 | ||||||
| VGG16 | COVID | 1.00 | 0.96 | 0.98 | 1.00 | 99.30 | 0.97 | 0.97 | 0.97 | 0.99 |
| Fibrosis | 0.92 | 1.00 | 0.96 | 0.98 | ||||||
| Normal | 1.00 | 0.95 | 0.98 | 0.99 | ||||||
| VGG19 | COVID | 0.95 | 0.67 | 0.78 | 0.98 | 96.84 | 0.86 | 0.84 | 0.83 | 0.96 |
| Fibrosis | 0.99 | 0.86 | 0.92 | 0.94 | ||||||
| Normal | 0.66 | 1.00 | 0.79 | 0.95 |
| Classification Models | Classes | Precision | Recall | F1-Score | AUC | Accuracy | Average Precision | Average Recall | Average F1-Score | Average AUC |
|---|---|---|---|---|---|---|---|---|---|---|
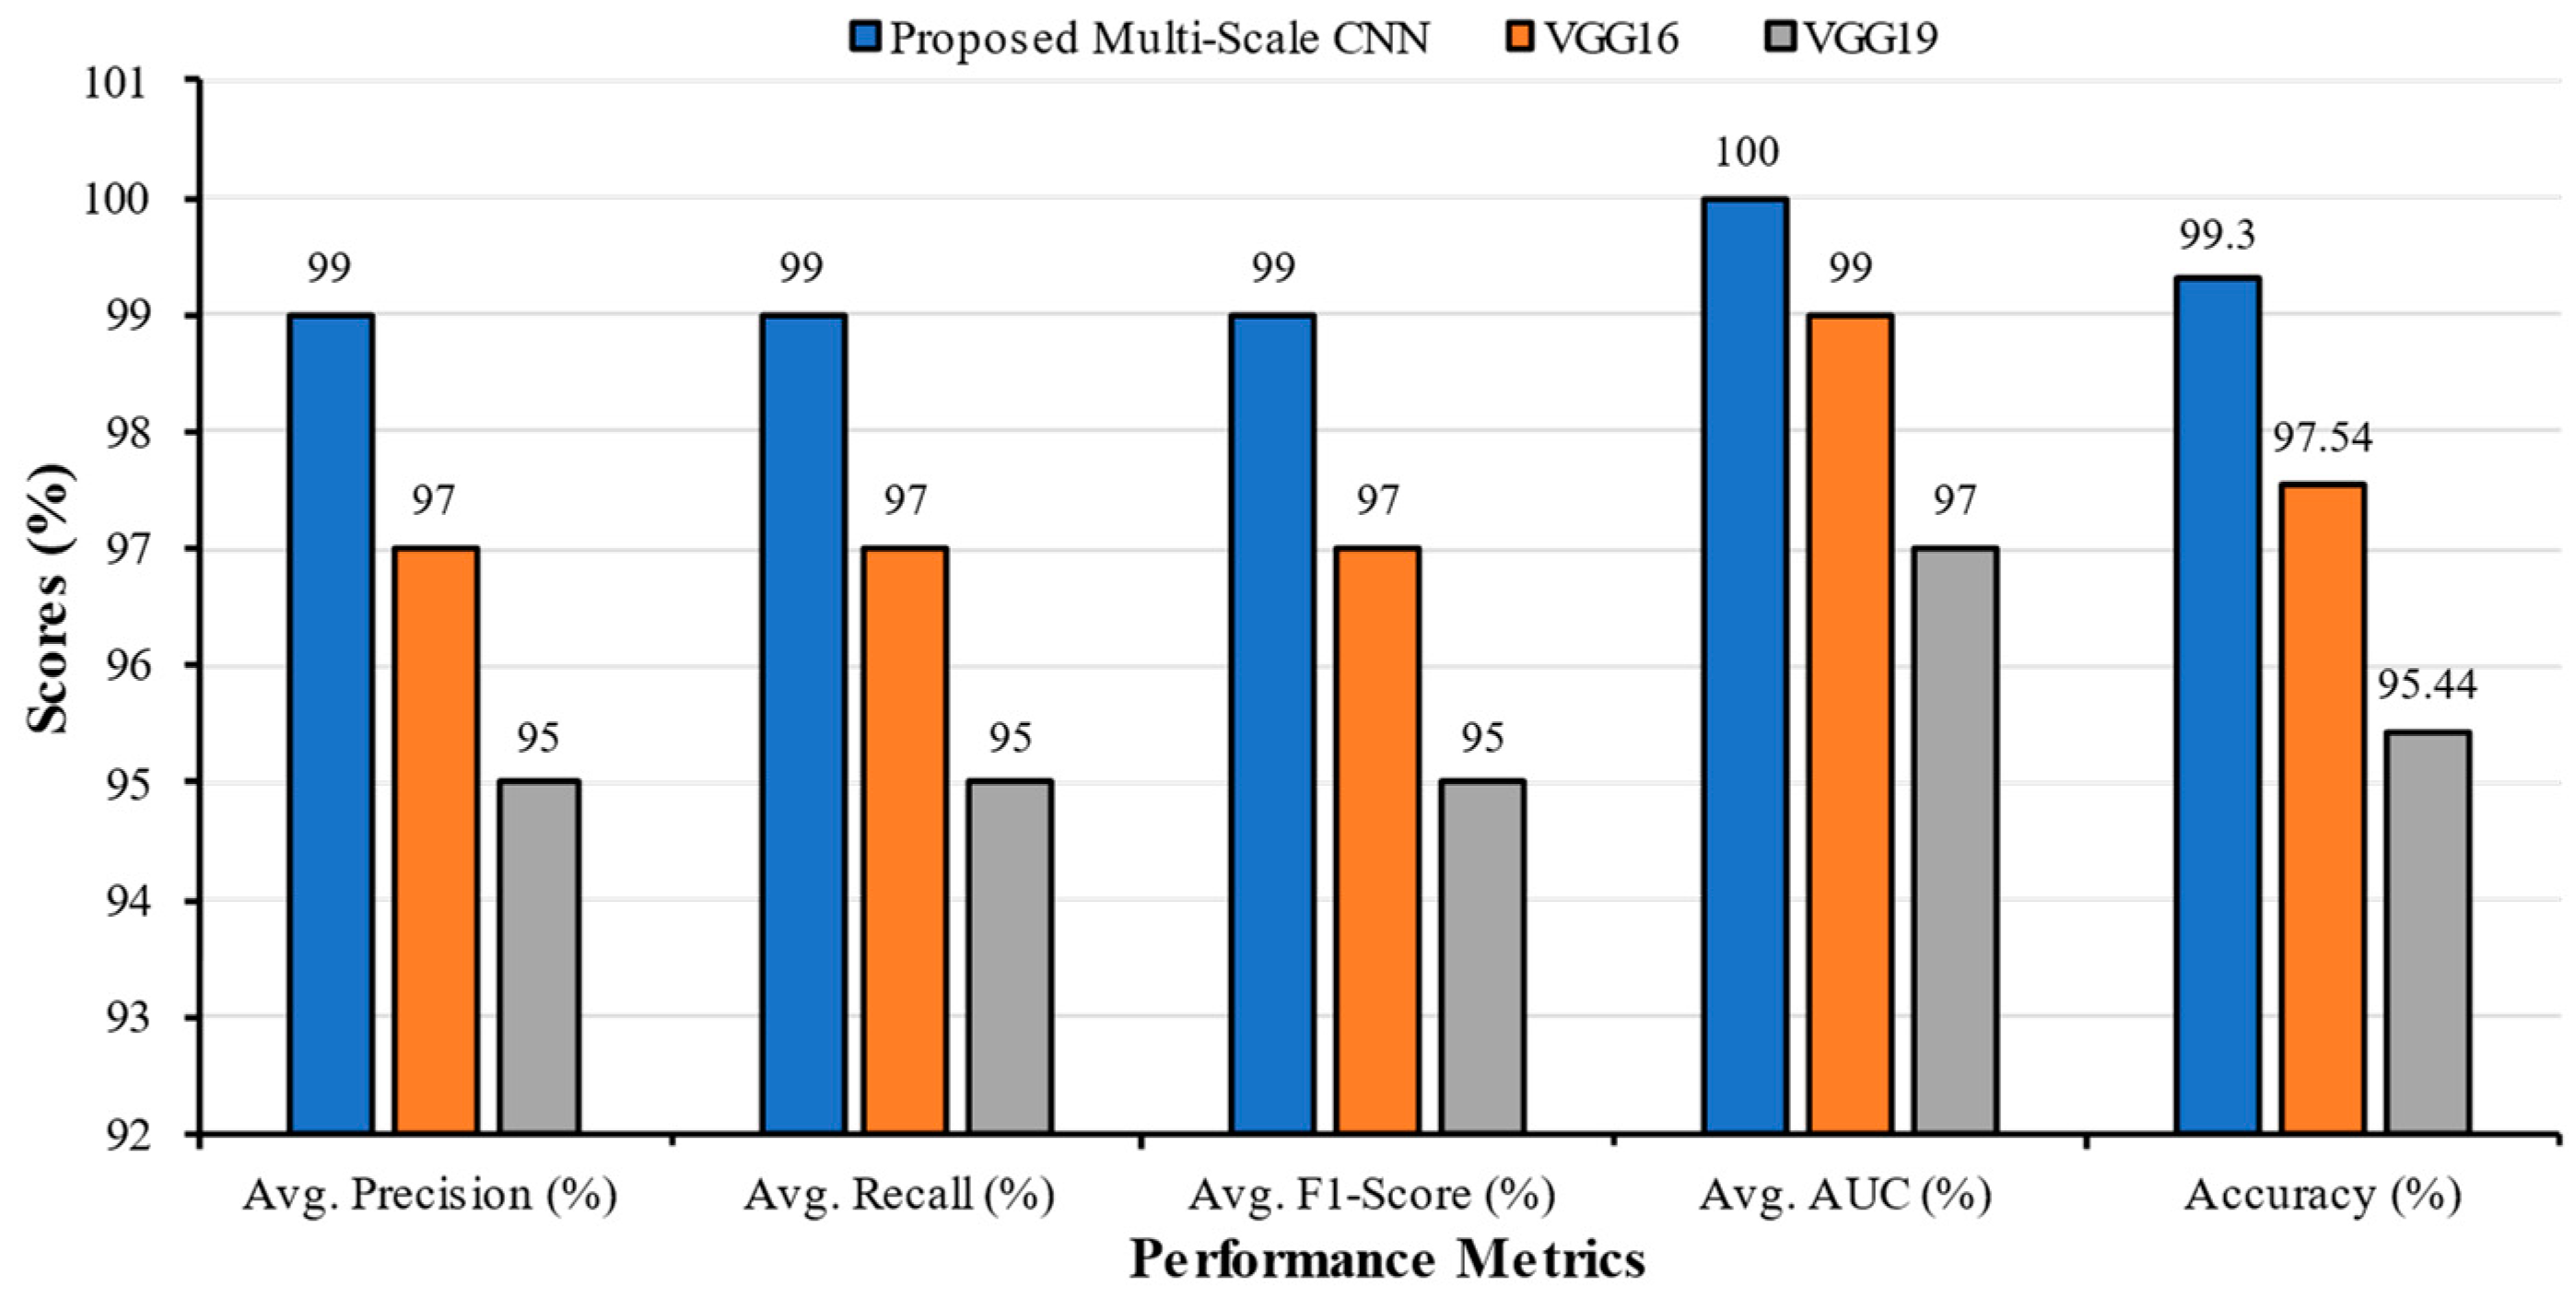
| Multi-Scale CNN | COVID | 0.99 | 0.97 | 0.98 | 1.00 | 99.30 | 0.99 | 0.99 | 0.99 | 1.00 |
| Normal | 0.98 | 0.99 | 0.98 | 1.00 | ||||||
| Tuberculosis | 0.99 | 1.00 | 0.99 | 1.00 | ||||||
| VGG16 | COVID | 0.97 | 0.94 | 0.96 | 0.98 | 97.54 | 0.97 | 0.97 | 0.97 | 0.99 |
| Normal | 0.97 | 1.00 | 0.98 | 0.99 | ||||||
| Tuberculosis | 0.96 | 0.96 | 0.96 | 0.99 | ||||||
| VGG19 | COVID | 0.96 | 0.92 | 0.94 | 0.95 | 95.44 | 0.95 | 0.95 | 0.95 | 0.97 |
| Normal | 0.97 | 0.96 | 0.96 | 0.99 | ||||||
| Tuberculosis | 0.91 | 0.98 | 0.94 | 0.97 |
| Classification Models | Classes | Precision | Recall | F1-Score | AUC | Accuracy | Average Precision | Average Recall | Average F1-Score | Average AUC |
|---|---|---|---|---|---|---|---|---|---|---|
| Multi-Scale CNN | Bacterial Pneumonia | 0.91 | 1.00 | 0.95 | 1.00 | 98.60 | 0.97 | 0.97 | 0.97 | 1.00 |
| COVID | 1.00 | 0.99 | 1.00 | 1.00 | ||||||
| Normal | 0.99 | 0.91 | 0.95 | 1.00 | ||||||
| VGG16 | Bacterial Pneumonia | 1.00 | 0.92 | 0.96 | 0.99 | 97.89 | 0.96 | 0.96 | 0.96 | 0.99 |
| COVID | 0.96 | 0.99 | 0.98 | 1.00 | ||||||
| Normal | 0.93 | 0.97 | 0.95 | 0.99 | ||||||
| VGG19 | Bacterial Pneumonia | 0.82 | 0.89 | 0.85 | 0.98 | 97.19 | 0.91 | 0.90 | 0.90 | 0.97 |
| COVID | 0.95 | 0.95 | 0.95 | 0.96 | ||||||
| Normal | 0.94 | 0.85 | 0.89 | 0.98 |
| Classification Models | Classes | Precision | Recall | F1-Score | AUC | Accuracy | Average Precision | Average Recall | Average F1-Score | Average AUC |
|---|---|---|---|---|---|---|---|---|---|---|
| Multi-Scale CNN | COVID | 0.95 | 0.98 | 0.96 | 0.99 | 99.74 | 0.97 | 0.97 | 0.97 | 0.99 |
| Fibrosis | 1.00 | 0.93 | 0.96 | 0.99 | ||||||
| Normal | 0.95 | 1.00 | 0.97 | 1.00 | ||||||
| Tuberculosis | 0.98 | 0.98 | 0.98 | 0.99 | ||||||
| VGG16 | COVID | 1.00 | 0.92 | 0.96 | 0.98 | 98.95 | 0.97 | 0.96 | 0.96 | 0.99 |
| Fibrosis | 0.97 | 0.96 | 0.96 | 0.99 | ||||||
| Normal | 0.99 | 0.98 | 0.99 | 0.99 | ||||||
| Tuberculosis | 0.91 | 1.00 | 0.95 | 0.99 | ||||||
| VGG19 | COVID | 1.00 | 0.61 | 0.76 | 0.96 | 98.68 | 0.89 | 0.85 | 0.85 | 0.95 |
| Fibrosis | 0.66 | 0.96 | 0.78 | 0.93 | ||||||
| Normal | 0.99 | 0.83 | 0.90 | 0.94 | ||||||
| Tuberculosis | 0.89 | 0.99 | 0.94 | 0.98 |
| Classification Models | Classes | Precision | Recall | F1-Score | AUC | Accuracy | Average Precision | Average Recall | Average F1-Score | Average AUC |
|---|---|---|---|---|---|---|---|---|---|---|
| Multi-Scale CNN | Bacterial Pneumonia | 1.00 | 0.98 | 0.99 | 1.00 | 99.21 | 0.98 | 0.98 | 0.98 | 1.00 |
| COVID | 0.96 | 0.99 | 0.97 | 1.00 | ||||||
| Fibrosis | 0.97 | 0.97 | 0.97 | 1.00 | ||||||
| Normal | 1.00 | 0.99 | 0.99 | 1.00 | ||||||
| VGG16 | Bacterial Pneumonia | 0.98 | 0.96 | 0.97 | 0.99 | 98.42 | 0.96 | 0.96 | 0.96 | 1.00 |
| COVID | 1.00 | 0.88 | 0.94 | 1.00 | ||||||
| Fibrosis | 0.93 | 1.00 | 0.96 | 1.00 | ||||||
| Normal | 0.96 | 0.99 | 0.97 | 1.00 | ||||||
| VGG19 | Bacterial Pneumonia | 0.96 | 0.96 | 0.96 | 1.00 | 98.42 | 0.97 | 0.97 | 0.97 | 1.00 |
| COVID | 1.00 | 0.97 | 0.98 | 1.00 | ||||||
| Fibrosis | 0.99 | 0.97 | 0.98 | 1.00 | ||||||
| Normal | 0.94 | 0.99 | 0.96 | 0.99 |
| Classification Models | Classes | Precision | Recall | F1-Score | AUC | Accuracy | Average Precision | Average Recall | Average F1-Score | Average AUC |
|---|---|---|---|---|---|---|---|---|---|---|
| Multi-Scale CNN | Bacterial Pneumonia | 0.98 | 0.96 | 0.97 | 0.99 | 98.95 | 0.95 | 0.95 | 0.95 | 0.98 |
| COVID | 0.96 | 0.88 | 0.92 | 0.95 | ||||||
| Normal | 1.00 | 0.96 | 0.98 | 1.00 | ||||||
| Tuberculosis | 0.85 | 0.99 | 0.92 | 0.99 | ||||||
| VGG16 | Bacterial Pneumonia | 0.98 | 0.95 | 0.96 | 1.00 | 96.84 | 0.95 | 0.94 | 0.94 | 0.99 |
| COVID | 0.96 | 0.85 | 0.90 | 0.97 | ||||||
| Normal | 0.98 | 1.00 | 0.99 | 1.00 | ||||||
| Tuberculosis | 0.86 | 0.97 | 0.91 | 0.98 | ||||||
| VGG19 | Bacterial Pneumonia | 0.98 | 0.68 | 0.81 | 0.86 | 98.42 | 0.88 | 0.81 | 0.82 | 0.90 |
| COVID | 0.95 | 0.62 | 0.75 | 0.85 | ||||||
| Normal | 0.99 | 0.95 | 0.97 | 0.98 | ||||||
| Tuberculosis | 0.59 | 1.00 | 0.74 | 0.90 |
| Classification Models | Classes | Precision | Recall | F1-Score | AUC | Accuracy (%) | Average Precision | Average Recall | Average F1-Score | Average AUC |
|---|---|---|---|---|---|---|---|---|---|---|
| Multi-Scale CNN | Bacterial Pneumonia | 0.97 | 0.96 | 0.97 | 1.00 | 98.67 | 0.96 | 0.96 | 0.96 | 0.99 |
| COVID | 0.93 | 0.98 | 0.95 | 1.00 | ||||||
| Fibrosis | 0.93 | 0.95 | 0.94 | 0.99 | ||||||
| Normal | 0.99 | 0.98 | 0.98 | 1.00 | ||||||
| Tuberculosis | 1.00 | 0.93 | 0.97 | 0.97 | ||||||
| VGG16 | Bacterial Pneumonia | 0.98 | 0.96 | 0.97 | 0.99 | 98.32 | 0.96 | 0.96 | 0.96 | 0.99 |
| COVI | 0.99 | 0.96 | 0.98 | 1.00 | ||||||
| Fibrosis | 0.90 | 1.00 | 0.95 | 0.99 | ||||||
| Normal | 1.00 | 0.90 | 0.95 | 0.98 | ||||||
| Tuberculosis | 0.95 | 0.99 | 0.97 | 0.99 | ||||||
| VGG19 | Bacterial Pneumonia | 0.90 | 0.98 | 0.94 | 0.99 | 97.68 | 0.95 | 0.95 | 0.95 | 0.99 |
| COVI | 0.98 | 0.96 | 0.97 | 0.99 | ||||||
| Fibrosis | 0.94 | 0.97 | 0.95 | 0.99 | ||||||
| Normal | 1.00 | 0.83 | 0.91 | 0.99 | ||||||
| Tuberculosis | 0.93 | 0.99 | 0.96 | 0.99 |
| Classification Models | Classes | Precision | Recall | F1-Score | AUC | Accuracy (%) | Average Precision | Average Recall | Average F1-Score | Average AUC |
|---|---|---|---|---|---|---|---|---|---|---|
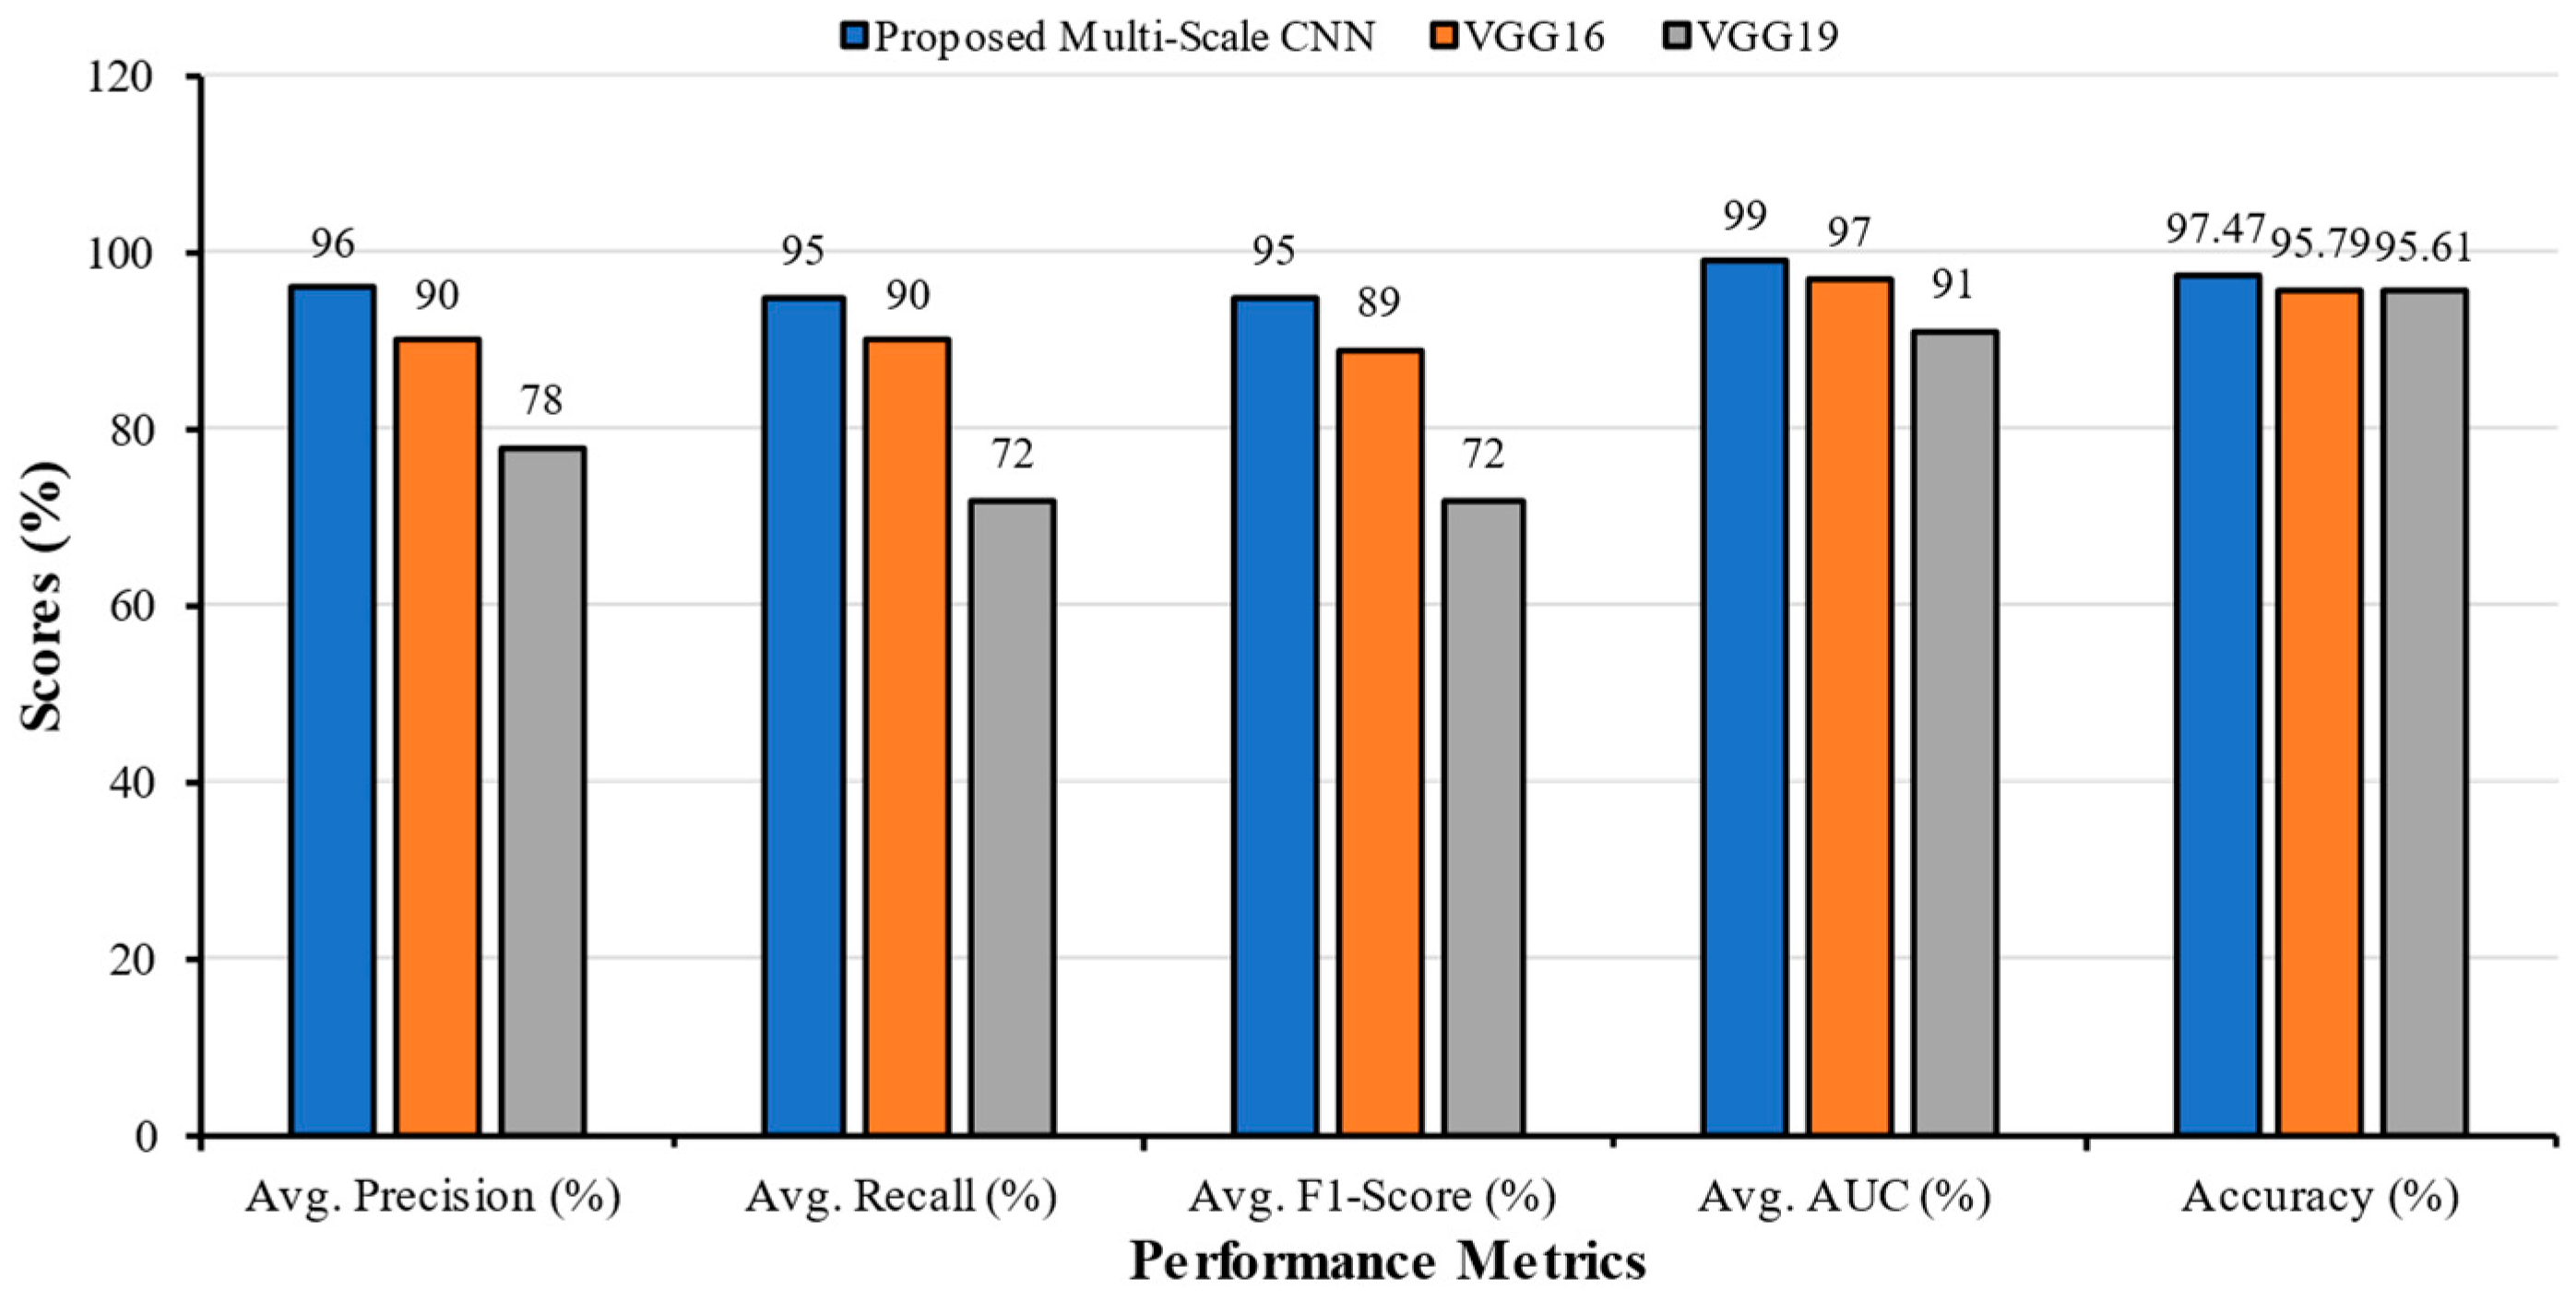
| Multi-Scale CNN | Bacterial Pneumonia | 0.90 | 0.98 | 0.94 | 0.99 | 97.47 | 0.96 | 0.95 | 0.95 | 0.99 |
| COVID | 1.00 | 0.96 | 0.98 | 1.00 | ||||||
| Fibrosis | 0.90 | 1.00 | 0.95 | 1.00 | ||||||
| Normal | 1.00 | 0.91 | 0.95 | 1.00 | ||||||
| Tuberculosis | 0.99 | 0.98 | 0.98 | 1.00 | ||||||
| Viral Pneumonia | 1.00 | 0.84 | 0.91 | 0.99 | ||||||
| VGG16 | Bacterial Pneumonia | 0.88 | 0.70 | 0.78 | 0.93 | 95.79 | 0.90 | 0.90 | 0.89 | 0.97 |
| COVID | 0.95 | 0.93 | 0.94 | 0.98 | ||||||
| Fibrosis | 0.97 | 0.97 | 0.97 | 1.00 | ||||||
| Normal | 0.99 | 0.92 | 0.95 | 0.99 | ||||||
| Tuberculosis | 0.85 | 0.98 | 0.91 | 0.98 | ||||||
| Viral Pneumonia | 0.75 | 0.88 | 0.81 | 0.96 | ||||||
| VGG19 | Bacterial Pneumonia | 0.71 | 0.72 | 0.72 | 0.91 | 95.61 | 0.78 | 0.72 | 0.72 | 0.91 |
| COVID | 0.98 | 0.58 | 0.73 | 0.87 | ||||||
| Fibrosis | 0.80 | 0.80 | 0.80 | 0.91 | ||||||
| Normal | 1.00 | 0.54 | 0.70 | 0.95 | ||||||
| Tuberculosis | 0.51 | 1.00 | 0.67 | 0.92 | ||||||
| Viral Pneumonia | 0.71 | 0.70 | 0.71 | 0.88 |
| Classification Models | Classes | Precision | Recall | F1-Score | AUC | Accuracy (%) | Average Precision | Average Recall | Average F1-Score | Average AUC |
|---|---|---|---|---|---|---|---|---|---|---|
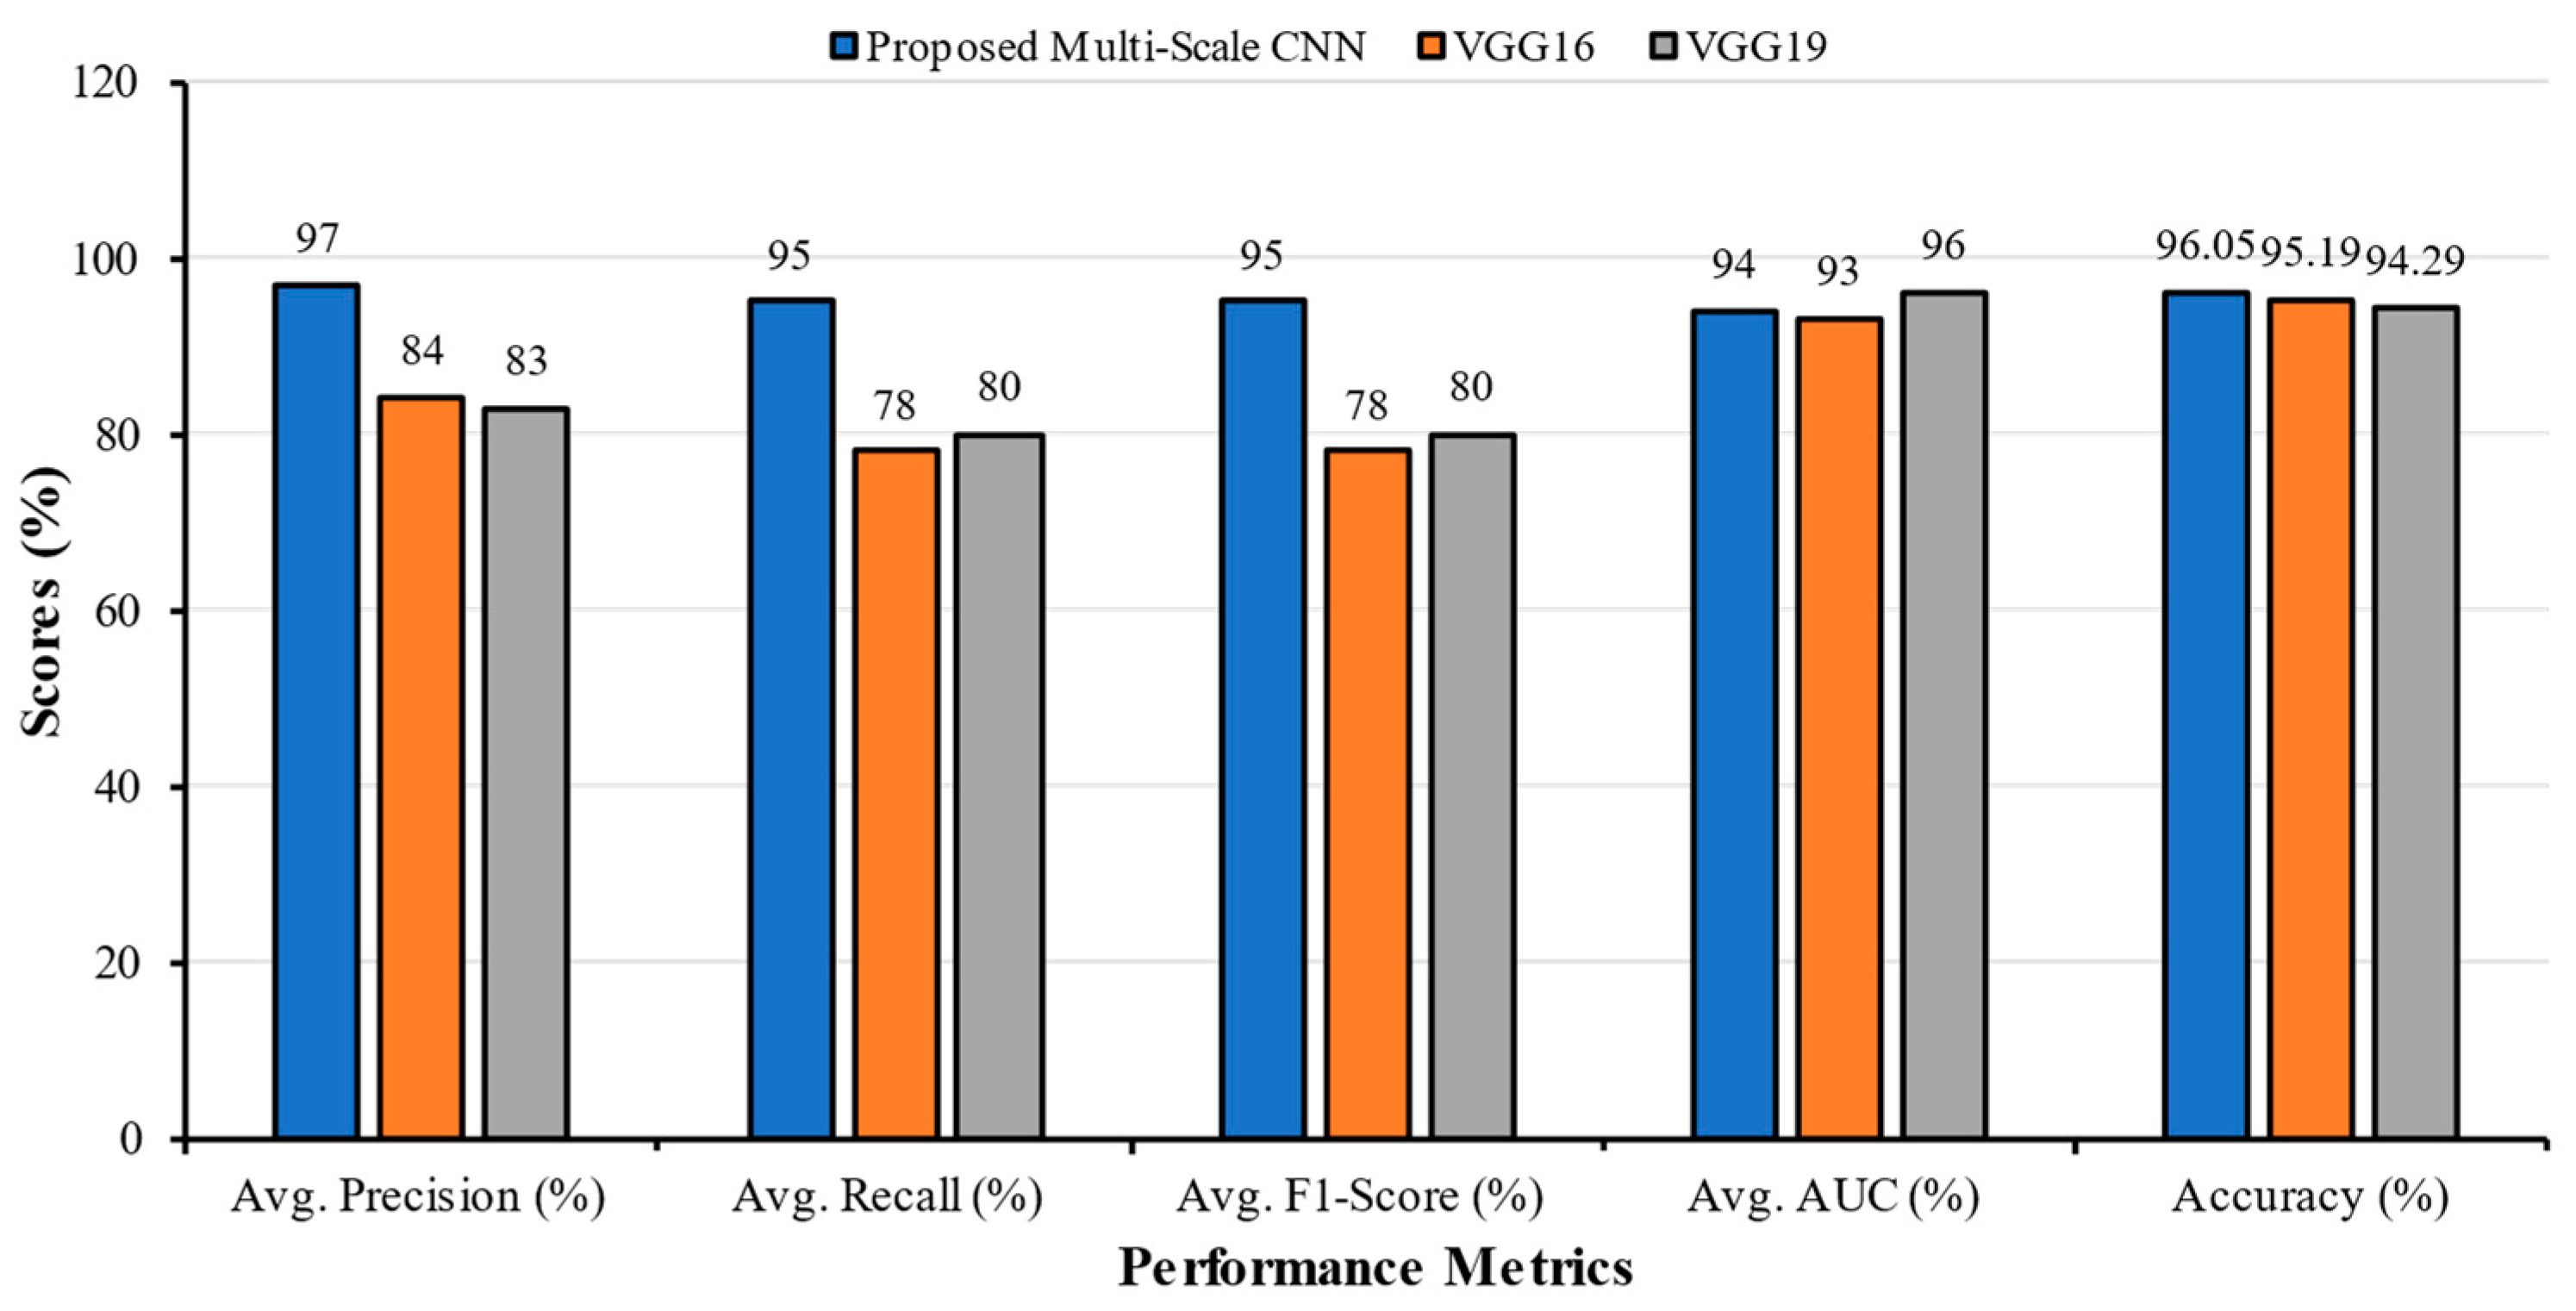
| Multi-Scale CNN | Bacterial Pneumonia | 0.96 | 0.94 | 0.95 | 0.99 | 96.05 | 0.97 | 0.95 | 0.95 | 0.94 |
| COVID | 0.92 | 0.96 | 0.94 | 0.94 | ||||||
| Fibrosis | 1.00 | 0.92 | 0.96 | 0.83 | ||||||
| Lung Opacity | 1.00 | 0.85 | 0.92 | 0.81 | ||||||
| Normal | 0.99 | 1.00 | 0.99 | 0.99 | ||||||
| Tuberculosis | 0.94 | 0.98 | 0.96 | 0.97 | ||||||
| Viral Pneumonia | 0.95 | 0.97 | 0.96 | 0.95 | ||||||
| VGG16 | Bacterial Pneumonia | 0.92 | 0.68 | 0.78 | 0.93 | 95.19 | 0.84 | 0.78 | 0.78 | 0.93 |
| COVID | 0.92 | 0.43 | 0.59 | 0.81 | ||||||
| Fibrosis | 0.74 | 0.94 | 0.82 | 0.96 | ||||||
| Lung Opacity | 0.97 | 0.59 | 0.74 | 0.93 | ||||||
| Normal | 0.91 | 0.99 | 0.95 | 0.99 | ||||||
| Tuberculosis | 0.63 | 1.00 | 0.78 | 0.95 | ||||||
| Viral Pneumonia | 0.76 | 0.84 | 0.80 | 0.95 | ||||||
| VGG19 | Bacterial Pneumonia | 0.83 | 0.48 | 0.60 | 0.93 | 94.29 | 0.83 | 0.80 | 0.80 | 0.96 |
| COVID | 0.96 | 0.60 | 0.74 | 0.96 | ||||||
| Fibrosis | 0.91 | 0.91 | 0.91 | 0.99 | ||||||
| Lung Opacity | 0.82 | 0.95 | 0.88 | 0.96 | ||||||
| Normal | 0.89 | 0.85 | 0.87 | 0.98 | ||||||
| Tuberculosis | 0.77 | 0.99 | 0.86 | 0.97 | ||||||
| Viral Pneumonia | 0.61 | 0.80 | 0.69 | 0.93 |
| Research | Number of Classes | Dataset Classes | Applied Architecture | Accuracy% |
|---|---|---|---|---|
| Al-Waisy et al. [11] | 2 | COVID, Normal | COVID–CheXNet | 99.99 |
| Proposed MS-CNN | 100.00 | |||
| Srivastava et al. [12] | 2 | COVID, Normal | CoviXNet | 99.47 |
| Proposed MS-CNN | 100.00 | |||
| Abida et al. [15] | 2 | COVID, Normal | 2D-CNN | 98.00 |
| Proposed MS-CNN | 100.00 | |||
| Nahiduzzaman et al. [13] | 3 | COVID, Normal, Pneumonia | CNN-ELM | 97.42 |
| Proposed MS-CNN | 98.60 | |||
| Yaman et al. [14] | 3 | COVID, Normal, Pneumonia | CNN (ACL Model) | 96.00 |
| Proposed MS-CNN | 98.60 | |||
| Abida et al. [15] | 3 | Bacterial Pneumonia, COVID, Normal | 2D-CNN | 97.49 |
| Proposed MS-CNN | 98.60 | |||
| Elakkiya et al. [16] | 4 | COVID, Normal, Pneumonia, Tuberculosis | SCS-Net | 94.05 |
| Proposed MS-CNN | 98.95 | |||
| Abida et al. [15] | 4 | Bacterial Pneumonia, COVID, Normal, Tuberculosis | 2D-CNN | 97.81 |
| Proposed MS-CNN | 98.95 | |||
| Hussain et al. [17] | 4 | Bacterial Pneumonia, COVID, Normal, Viral Pneumonia | CoroDet | 91.20 |
| Proposed MS-CNN | 98.33 | |||
| Abida et al. [15] | 5 | Bacterial Pneumonia, COVID, Fibrosis, Normal, Tuberculosis | 2D-CNN | 96.96 |
| Proposed MS-CNN | 98.67 | |||
| Al-Timemy et al. [18] | 5 | Bacterial Pneumonia, COVID, Normal, Tuberculosis, Viral Pneumonia | ResNet-50 with ensemble of subspace discriminant classifier | 91.60 |
| Proposed MS-CNN | 97.00 | |||
| Abida et al. [15] | 6 | Bacterial Pneumonia, COVID, Fibrosis, Normal, Tuberculosis, Viral Pneumonia | 2D-CNN | 96.75 |
| Proposed MS-CNN | 97.47 | |||
| Abida et al. [15] | 7 | Bacterial Pneumonia, COVID, Fibrosis, Lung Opacity, Normal, Tuberculosis, Viral Pneumonia | 2D-CNN | 93.15 |
| Proposed MS-CNN | 96.05 |
| Literature No. | Model | Classes | Training Accuracy (%) | Testing Accuracy (%) | Precision (%) | Recall (%) | F1-Score (%) | AUC (%) | Training Time (min) | Test Set Evaluation Time (s) |
|---|---|---|---|---|---|---|---|---|---|---|
| [11] | ResNet34 | 2 | 98.9 | 89.88 | 90.83 | 89.14 | 89.98 | 0.154 | 0.216 | 81.00 |
| HRNet | 2 | 98.9 | 90.00 | 91.31 | 88.98 | 90.13 | 0.121 | 0.136 | 88.00 | |
| MS-CNN | 2 | 100.0 | 99.38 | 99.38 | 99.38 | 99.98 | 0.0061 | 0.0779 | 100.00 | |
| [15] | 2D-CNN | 5 | 98.90 | 96.96 | 96.8 | 97.2 | 97.0 | 99.77 | 42.62 | 16.39 |
| 6 | 99.04 | 96.75 | 93.43 | 94.43 | 93.86 | 99.39 | 62.74 | 15.20 | ||
| 7 | 98.44 | 93.15 | 93.43 | 94.43 | 93.86 | 99.39 | 62.74 | 22.37 | ||
| MS-CNN | 5 | 98.80 | 98.80 | 97.99 | 97.99 | 97.99 | 99.92 | 38.16 | 5.1 | |
| 6 | 98.75 | 98.10 | 96.55 | 98.75 | 96.49 | 99.91 | 39.81 | 5.3 | ||
| 7 | 98.63 | 95.18 | 96.23 | 96.23 | 96.23 | 99.83 | 50.58 | 7.5 |
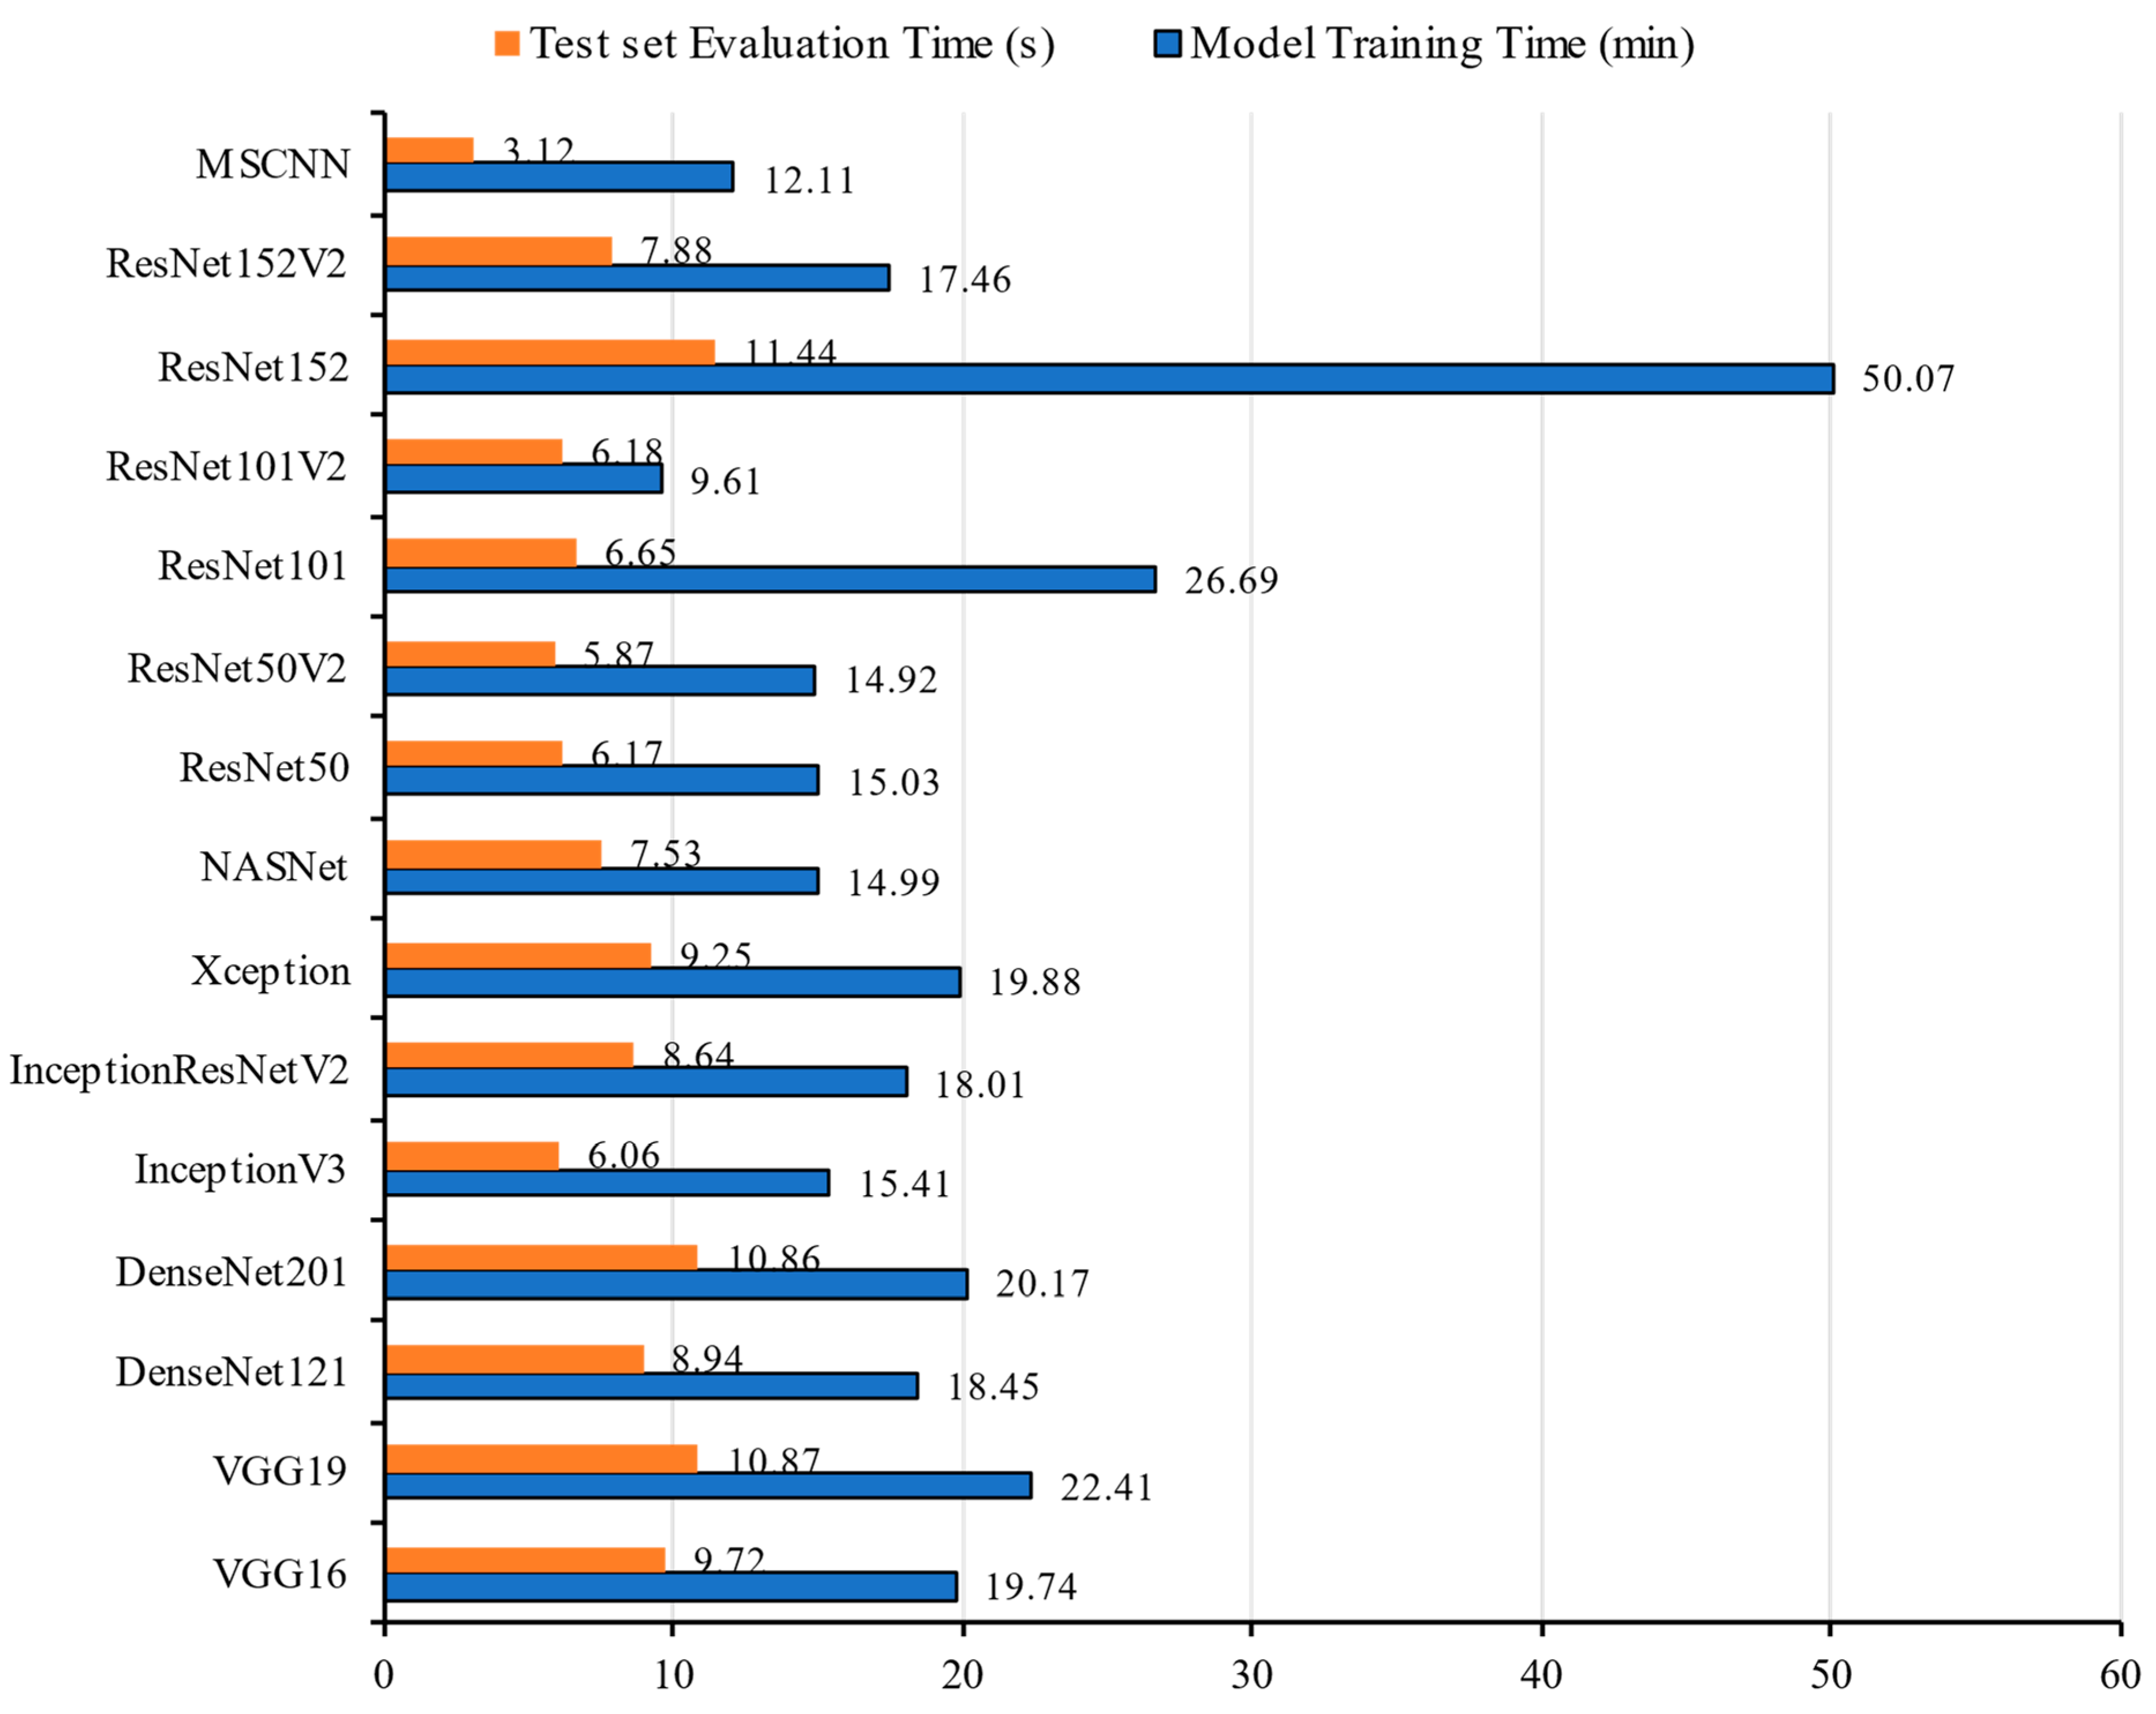
| Models | Training Accuracy (%) | Testing Accuracy (%) | Precision (%) | Recall (%) | F1-Score (%) | AUC (%) | Model Training Time (min) | Test Set Evaluation Time (s) |
|---|---|---|---|---|---|---|---|---|
| VGG16 | 98.50 | 95.19 | 84.00 | 78.00 | 78.00 | 93.00 | 19.74 | 9.72 |
| VGG19 | 97.65 | 94.29 | 83.00 | 80.00 | 80.00 | 96.00 | 22.41 | 10.87 |
| DenseNet121 | 98.38 | 94.81 | 95.29 | 94.36 | 94.82 | 99.64 | 18.45 | 8.94 |
| DenseNet201 | 97.82 | 95.86 | 96.06 | 95.41 | 95.73 | 99.79 | 20.17 | 10.86 |
| InceptionV3 | 93.46 | 83.46 | 85.79 | 81.73 | 83.71 | 98.12 | 15.41 | 6.06 |
| Inception ResNetV2 | 95.81 | 85.34 | 86.94 | 84.06 | 85.47 | 98.53 | 18.01 | 8.64 |
| Xception | 96.56 | 86.99 | 89.14 | 85.79 | 87.43 | 98.80 | 19.88 | 9.25 |
| NASNet ** | 96.71 | 84.14 | 84.89 | 82.78 | 83.82 | 97.77 | 14.99 | 7.53 |
| ResNet50 * | 77.84 | 75.86 | 78.38 | 73.61 | 75.92 | 97.75 | 15.03 | 6.17 |
| ResNet50V2 | 86.99 | 73.68 | 82.07 | 69.17 | 75.07 | 95.79 | 14.92 | 5.87 |
| ResNet101 * | 83.50 | 82.48 | 84.34 | 80.98 | 82.62 | 98.38 | 26.69 | 6.65 |
| ResNet101V2 ** | 79.62 | 65.79 | 72.12 | 63.01 | 67.26 | 95.80 | 9.61 | 6.18 |
| ResNet152 ** | 73.87 | 75.94 | 78.03 | 74.51 | 76.22 | 96.43 | 50.07 | 11.44 |
| ResNet152V2 | 91.24 | 79.55 | 84.24 | 73.53 | 78.52 | 97.42 | 17.46 | 7.88 |
| MS-CNN | 98.70 | 96.05 | 97.00 | 95.00 | 95.00 | 94.00 | 12.11 | 3.12 |
Disclaimer/Publisher’s Note: The statements, opinions and data contained in all publications are solely those of the individual author(s) and contributor(s) and not of MDPI and/or the editor(s). MDPI and/or the editor(s) disclaim responsibility for any injury to people or property resulting from any ideas, methods, instructions or products referred to in the content. |
© 2023 by the authors. Licensee MDPI, Basel, Switzerland. This article is an open access article distributed under the terms and conditions of the Creative Commons Attribution (CC BY) license (https://creativecommons.org/licenses/by/4.0/).
Share and Cite
Sarkar, O.; Islam, M.R.; Syfullah, M.K.; Islam, M.T.; Ahamed, M.F.; Ahsan, M.; Haider, J. Multi-Scale CNN: An Explainable AI-Integrated Unique Deep Learning Framework for Lung-Affected Disease Classification. Technologies 2023, 11, 134. https://doi.org/10.3390/technologies11050134
Sarkar O, Islam MR, Syfullah MK, Islam MT, Ahamed MF, Ahsan M, Haider J. Multi-Scale CNN: An Explainable AI-Integrated Unique Deep Learning Framework for Lung-Affected Disease Classification. Technologies. 2023; 11(5):134. https://doi.org/10.3390/technologies11050134
Chicago/Turabian StyleSarkar, Ovi, Md. Robiul Islam, Md. Khalid Syfullah, Md. Tohidul Islam, Md. Faysal Ahamed, Mominul Ahsan, and Julfikar Haider. 2023. "Multi-Scale CNN: An Explainable AI-Integrated Unique Deep Learning Framework for Lung-Affected Disease Classification" Technologies 11, no. 5: 134. https://doi.org/10.3390/technologies11050134
APA StyleSarkar, O., Islam, M. R., Syfullah, M. K., Islam, M. T., Ahamed, M. F., Ahsan, M., & Haider, J. (2023). Multi-Scale CNN: An Explainable AI-Integrated Unique Deep Learning Framework for Lung-Affected Disease Classification. Technologies, 11(5), 134. https://doi.org/10.3390/technologies11050134