1. Introduction
Diversity and inclusion have become increasingly relevant to corporate governance and firm valuation because investors now evaluate not only financial performance but also the quality of governance, human capital management, and sustainability-related risk oversight. In the ASEAN-5 setting, defined in this study as Indonesia, Malaysia, Singapore, Thailand, and the Philippines, diversity-related governance is shaped by a combination of stock exchange requirements, corporate governance codes, and sustainability reporting expectations. These rules do not impose one uniform regional diversity model. Instead, they generally refer to dimensions such as gender representation, board skills and professional background, equal opportunity, board diversity policy, and broader social or sustainability practices. Singapore and Malaysia have more explicit guidance on board diversity disclosure and gender representation, while Indonesia, Thailand, and the Philippines place diversity-related matters within broader sustainability, governance, and social responsibility disclosure frameworks (
OECD, 2023;
Abu Afifa et al., 2025;
Permatasari et al., 2025).
For finance research, diversity and inclusion are relevant because they may affect how investors assess governance quality, organizational resilience, and future cash-flow prospects. Firms with stronger diversity governance may be perceived as having better access to managerial resources, broader stakeholder understanding, and stronger legitimacy in increasingly ESG-oriented capital markets. However, prior studies do not provide a uniform conclusion. Some studies report that diversity and ESG-related attributes are positively valued by the market, while others show weak, insignificant, or context-dependent associations (
Aydoğmuş et al., 2022;
Almaqtari et al., 2022;
Zhou et al., 2025;
Bani-Khaled et al., 2025). These mixed findings suggest that the diversity-firm value relationship should not be examined only as a direct board-composition effect.
The ASEAN-5 context is particularly relevant because diversity and inclusion practices remain uneven across countries. Differences in regulatory maturity, capital market development, cultural norms, and disclosure practices may shape how firms adopt diversity policies and how investors respond to diversity-related performance. Compared with Europe or North America, Southeast Asian markets generally remain at an earlier stage in developing comprehensive diversity and inclusion frameworks, although some markets have progressed more rapidly than others (
Nachiappan, 2021;
Acharya, 2003;
Rüland, 2020). This heterogeneity provides a useful setting for examining whether board-level diversity governance is associated with diversity performance and whether such performance is reflected in firm value.
This study addresses three related gaps. First, prior research has often examined board diversity, diversity policy, ESG performance, or firm value separately, while fewer studies investigate diversity performance as the channel through which board-level diversity governance is connected to market valuation. Second, evidence from Southeast Asia remains limited because comparable diversity-related data are not consistently available across listed firms. Third, previous findings remain mixed regarding which diversity dimensions matter for organizational outcomes and valuation. Accordingly, this study investigates whether board gender diversity, board national diversity, board-specific skills, board affiliation, and formal diversity policy are associated with diversity performance, and whether diversity performance is associated with firm value.
The study contributes to the finance literature by linking diversity governance to firm value through an observable diversity performance measure. Rather than assuming that board diversity automatically increases valuation, the paper examines whether diversity-related board attributes and policy commitments are reflected in diversity performance, and whether this performance is associated with investors’ valuation as measured by price-to-book value. This framing is important for finance journals because it connects governance and ESG disclosure to market valuation while recognizing the limitations of short-period, small-sample, and associational evidence.
The remainder of this paper is organized as follows.
Section 2 reviews the literature relevant to board diversity, diversity policy, diversity performance, and firm value.
Section 3 describes the research design, sample, measurement, and analytical approach.
Section 4 presents the empirical results.
Section 5 discusses the findings and their implications for corporate governance and diversity-related policy in Southeast Asia.
Section 6 outlines the study limitations.
Section 7 concludes.
2. Literature Review
2.1. Board Diversity and Diversity Performance
Previous studies indicate that board diversity can influence organizational behavior by broadening the range of perspectives, experiences, and networks involved in strategic decision-making. From a resource-based view (RBV), board diversity represents a strategic governance resource because directors may bring different knowledge, professional experience, stakeholder access, and problem-solving capacity. Gender diversity may enhance attention to equity-related concerns, national diversity may improve responsiveness to cross-border stakeholders, specific skills may strengthen oversight capacity, and affiliation diversity may expand external exposure and reduce board insularity (
Byoun et al., 2016;
Buse et al., 2014;
Cox & Blake, 1991;
Kaczmarek & Nyuur, 2021;
Richard et al., 2013). From an institutional perspective, the same board characteristics may also reflect the firm’s response to external expectations regarding inclusive governance and sustainability-oriented disclosure. Empirical evidence remains mixed. Some studies document significant positive associations between board diversity and ESG or diversity performance (
Zharfpeykan & Bai, 2025;
Al-Sarraf et al., 2025), while others report negative, insignificant, or conditional findings because diversity can also create coordination challenges or become symbolic when not supported by effective governance practices (
Aureli et al., 2026;
Samara & Yousef, 2025). These mixed findings suggest that the relationship between board diversity and diversity performance requires further examination in developing-economy regions such as ASEAN.
In this study, board diversity is operationalized through four dimensions that reflect both prior literature and widely observed corporate governance practices among listed companies globally. These dimensions consist of board gender diversity, board national diversity, board specific skills, and board affiliation diversity. The use of these four dimensions allows the study to capture board diversity not only from demographic representation, but also from international exposure, professional competence, and external network characteristics. Board gender diversity is measured by the proportion of female directors on the board, capturing the extent to which gender representation is incorporated into governance and strategic oversight (
Khaw & Liao, 2018;
Lee & Thong, 2022). Board national diversity is measured by the proportion of directors with different nationalities, reflecting the board’s exposure to cross-border experience, international networks, and broader stakeholder perspectives (
Salem et al., 2025). Board-specific skills refer to the proportion of directors with identifiable professional competencies or specialized expertise relevant to corporate oversight, such as finance, accounting, legal, risk management, sustainability, industry knowledge, or executive management experience (
Khan et al., 2023). Board affiliation diversity reflects the extent of directors’ external board affiliations or professional connections, indicating the board’s access to broader networks, external knowledge, and interorganizational experience (
Omenihu & Nwafor, 2025). These dimensions are selected because they are commonly discussed in board diversity literature and are also consistent with global corporate governance practices that encourage firms to consider diversity not only in demographic terms, but also in terms of nationality, expertise, experience, and external exposure.
2.2. Diversity Policy and Diversity Performance
Formal diversity policies serve as the governance framework through which diversity commitments are operationalized within organizations. In corporate environments, these policies typically encompass opportunity and diversity policies, quantifiable diversity targets, and board diversity policies. Such mechanisms can indicate managerial commitment, enhance accountability, and foster a more inclusive organizational climate (
Ball et al., 2005;
Creek et al., 2017;
Buse et al., 2014).
The efficacy of diversity policies is contingent not only on their existence but also on their integration into organizational routines. Opportunity policies may mitigate bias and promote equal access, diversity targets may establish measurable expectations, and board diversity policies may institutionalize diversity governance at the highest decision-making level (
Strachan et al., 2004;
Dobbin & Kalev, 2013;
Onyeador et al., 2021;
Kumar & Sinha, 2023). Nonetheless, formal policies are not inherently effective; their success relies on commitment, managerial execution, and the extent to which diversity is prioritized strategically rather than as symbolic compliance (
Vafaei et al., 2015;
Van Peteghem et al., 2017). Empirical evidence on the effectiveness of diversity policies such as opportunity policies, diversity targets, and board diversity policies on diversity performance remains mixed. Some studies report significant positive effects, suggesting that formal policies enhance governance, accountability, and inclusion practices, thereby improving ESG outcomes (
Sundarasen et al., 2024;
Al-Sarraf et al., 2025). However, others find significant negative effects, arguing that poorly implemented or symbolic policies may create inefficiencies and weaken performance (
Aureli et al., 2026). In addition, several studies show insignificant or conditional relationships, indicating that policy presence alone is insufficient without effective implementation and supportive governance (
Jeyhunov et al., 2025).
In this study, diversity policy is measured through three policy components: opportunity and diversity policy, diversity targets, and board diversity policy. Opportunity and diversity policy refers to the existence of a formal corporate policy that supports equal opportunity, non-discrimination, and inclusion across the organization (
Chebbi & Ammer, 2022). Diversity targets refer to whether the company discloses measurable objectives or targets related to diversity, such as representation goals or specific diversity commitments (
Cai et al., 2024). Board diversity policy refers to whether the company has a formal policy addressing diversity considerations in board composition, nomination, or governance practices (
Mirza et al., 2020). These three components are used because they represent different levels of diversity governance. Opportunity and diversity policy captures the general organizational commitment to inclusion, diversity targets indicate whether such commitment is translated into measurable objectives, and board diversity policy reflects whether diversity is embedded at the highest governance level (
Colakoglu et al., 2020;
Al Naim & Alomair, 2024;
Isibor et al., 2025).
2.3. Diversity Performance and Firm Value
Diversity performance is potentially significant for firm value as it indicates the extent to which diversity-related commitments are effectively integrated into organizational practices. Inclusive workplaces can enhance employee well-being, collaboration, perceptions of fairness, and stakeholder confidence, all of which may contribute to organizational quality and market valuation (
Ferdman et al., 2010;
Jaiswal & Dyaram, 2019;
Hoang et al., 2022). In broader multinational contexts, effective diversity and inclusion practices have been linked to improved organizational outcomes and increased support for diversity initiatives across various groups (
Farndale et al., 2015;
Jansen et al., 2015). Consequently, diversity performance may act as a conduit through which board-level diversity governance becomes apparent to investors and other stakeholders, including through firm value as reflected in the price-to-book ratio (
Porcena et al., 2020). Existing evidence on whether diversity performance mediates the relationship between board diversity and firm value remains limited. Recent studies mainly examine the direct effect of board diversity on ESG or sustainability performance, or the effect of ESG disclosure on firm performance, while only a small number of studies test mediation pathways and these are usually confined to selected diversity attributes rather than gender, cultural, skills, and affiliation diversity collectively (
Agustia et al., 2022;
Al-Sarraf et al., 2025;
Tahat & Hassanein, 2024;
Luh & Asare, 2025). Moreover, recent evidence specifically examining whether opportunity policies, diversity targets, and board diversity policies improve firm value through diversity performance remains scarce. Accordingly, this area remains underexplored and warrants further investigation (
Alodat & Hao, 2025).
2.4. Theoretical Background and Hypothesis Development
The hypotheses in this study are developed from resource-based and institutional perspectives. The RBV explains why board diversity may be valuable: directors with different gender, national, professional, and affiliation backgrounds can provide knowledge, external networks, legitimacy, and monitoring capacity that may support stronger diversity performance (
Yang & Konrad, 2011;
Shi et al., 2017). Institutional theory explains why diversity policies matter: firms may adopt formal opportunity and diversity policies, diversity targets, and board diversity policies to respond to regulatory expectations, stock exchange guidance, investor pressure, and social norms regarding inclusive governance. These two perspectives jointly support the expectation that board characteristics and formal policy commitments are associated with diversity performance. Within this framework, diversity performance serves as the organizational channel through which board-level diversity governance may be reflected in firm value. Diversity performance is closer to market valuation than board composition alone because it represents the observable outcome of diversity-related governance practices. Accordingly, the hypotheses are structured around three relationships: the association between board diversity and diversity performance, the association between diversity policy and diversity performance, and the association between diversity performance and firm value.
In recent years, board-level diversity has attracted increasing attention for its potential to improve corporate diversity outcomes and inclusive practices. Grounded in resource-based and institutional perspectives, board diversity is proposed to shape strategic priorities and influence organizational culture, particularly concerning diversity and inclusion initiatives. This study examines four specific dimensions of board diversity: gender diversity, national diversity, board-specific skills, and board affiliation. These dimensions are examined separately because they may represent different resources and institutional signals.
Board gender diversity is frequently regarded as a significant governance attribute because women directors may contribute distinct perspectives, social sensitivity, and attention to equity-related issues in board deliberations (
Amin et al., 2021). Previous studies also suggest that gender-diverse boards may be associated with stronger governance quality and, under certain conditions, improved performance, particularly when women directors achieve sufficient influence within the board (
Siciliano, 1996;
Y.-H. Wang, 2020). In the present study, board gender diversity is anticipated to be positively associated with diversity performance because female representation may enhance board attention to inclusion-related priorities. Based on this reasoning, the following hypothesis is proposed:
H1a. Board gender diversity is positively associated with diversity performance.
Board national diversity refers to the proportion of board members with different nationalities. The term national diversity is used in this study because the Refinitiv indicator captures directors’ national background rather than broader cultural identity. National diversity may enhance cross-border awareness, improve understanding of diverse stakeholder expectations, and expand the informational foundation of board deliberations (
Fernández-Temprano & Tejerina-Gaite, 2020). In multinational or socially diverse contexts, such heterogeneity may be associated with more context-sensitive diversity governance. Although previous studies also highlight the potential for communication frictions or conflict within heterogeneous boards, the prevailing argument suggests that national diversity can support diversity-related responsiveness when managed effectively (
Kagzi & Guha, 2018;
Sarhan et al., 2018;
Scholtz & Kieviet, 2017). Based on this reasoning, the following hypothesis is proposed:
H1b. Board national diversity is positively associated with diversity performance.
Board-specific skills diversity encompasses the proportion of directors with disclosed specific competencies or professional expertise. In Refinitiv, this indicator captures whether directors are reported as having specific skills that may include finance, law, ESG or sustainability, human resources, industry expertise, strategy, technology, governance, or other professional competencies where such information is available. Boards with more disclosed expertise may be better able to evaluate complex organizational issues and incorporate diversity-related considerations into governance processes (
Che Mat & Maznah Mohd Salleh, 2025;
Karim et al., 2022). However, the indicator captures the presence of disclosed board expertise rather than the depth, quality, or diversity of each skill category. Given that such expertise can enhance the board’s ability to address multidimensional issues, board-specific skills diversity is expected to be positively associated with diversity performance (
Wellalage & Locke, 2013). Based on this reasoning, the following hypothesis is proposed:
H1c. Board-specific skills diversity is positively associated with diversity performance.
Board affiliation diversity refers to the average number of external board affiliations or directorships held by directors. This measure captures directors’ external organizational exposure and professional networks. Directors with broader affiliations may reduce groupthink, introduce external expectations into board deliberations, and provide exposure to inclusive governance practices in other organizations (
Jeyhunov et al., 2025). Previous research indicates that diverse occupational or institutional backgrounds can enhance decision-making and social performance by expanding the board’s field of vision (
Berezinets et al., 2017;
Siciliano, 1996). Based on this reasoning, the following hypothesis is proposed:
H1d. Board affiliation diversity is positively associated with diversity performance.
Diversity policy is anticipated to have a positive correlation with diversity performance, as formal policy commitments offer direction, accountability, and organizational support for practices related to inclusion. Opportunity and diversity policies may establish a foundational level of fairness and equal access, while diversity targets can transform abstract commitments into quantifiable expectations. Additionally, board diversity policies may reinforce the responsibility for inclusion at the board level (
Nadarajah et al., 2021;
Ng & Sears, 2018;
Olusanya, 2023). Previous research indicates that the effectiveness of such policies is contingent upon organizational commitment and the quality of implementation. Nonetheless, the prevailing expectation is that a robust policy infrastructure is linked to enhanced diversity outcomes (
Wentling, 2004;
Ezeugwa et al., 2024;
Kalev et al., 2006;
Windscheid et al., 2015;
Dobbin & Kalev, 2013).
In this study, the diversity policy construct encompasses the disclosed presence of opportunity and diversity policy, diversity targets, and board diversity policy. Collectively, these elements signify a formal governance signal that the firm has progressed beyond ad hoc diversity rhetoric towards a more structured approach to diversity management. Consequently, firms with more substantial diversity policy commitments are expected to demonstrate stronger diversity performance. Based on this reasoning, the following hypothesis is proposed:
H2. Diversity policy is positively associated with diversity performance.
Diversity performance is anticipated to have a positive correlation with firm value, as it signifies the extent to which a firm effectively implements diversity-related commitments into its organizational practices. Enhanced diversity performance may lead to improvements in employee experience, legitimacy, innovation capacity, and stakeholder confidence, all of which are pertinent to investor evaluations (
Porcena et al., 2020). Previous research also indicates that diversity-related organizational outcomes can influence market perceptions, although the strength of this relationship may differ across various contexts and institutional settings (
Carter et al., 2003;
K. Wang et al., 2024;
Chen & Hassan, 2021). Within the current framework, firm value is not presumed to be directly influenced by each dimension of board diversity; instead, diversity performance is considered the more immediate organizational mechanism linking board-level diversity governance to valuation outcomes. Based on this reasoning, the following hypothesis is proposed:
H3. Diversity performance is positively associated with firm value.
3. Methods
This study uses a quantitative research design to examine the associations among board diversity, diversity policy, diversity performance, and firm value in publicly listed companies in Southeast Asia. The ASEAN-5 in this study refers to Indonesia, Malaysia, Singapore, Thailand, and the Philippines. These countries are selected because they represent major Southeast Asian capital markets and have relatively better coverage of comparable diversity-related indicators in Refinitiv Eikon. The final sample consists of 77 firms: Indonesia (11), Malaysia (36), Singapore (10), Thailand (11), and the Philippines (9), observed during 2022–2023, resulting in 154 firm-year observations. The sample size is limited by the availability of complete and comparable Refinitiv Eikon data on board diversity, diversity policy, diversity performance, and firm value. Manual collection from corporate websites or annual reports was considered; however, it was not adopted as the main data source because diversity terminology, disclosure structure, and reporting detail differ substantially across firms and countries. Combining manually collected indicators with Refinitiv indicators could therefore reduce measurement comparability. The study is consequently positioned as evidence from firms with standardized and comparable recent disclosure coverage rather than as a fully generalizable representation of all listed firms in Southeast Asia.
Table 1 presents the operationalization of the variables used in this study.
Board national diversity (X1b) captures the proportion of directors with different nationalities. The label national diversity is used because the underlying Refinitiv indicator measures nationality and does not directly measure culture, ethnicity, language, or broader social identity. This terminology therefore aligns the construct label with the actual measurement used in the study.
Board-specific skills (X1c) are measured as the proportion of directors with disclosed specific competencies. The indicator supports cross-firm comparison because it captures the presence of directors with identified expertise, but it does not evaluate the quality, depth, or balance of each competency category. Therefore, X1c is interpreted as a disclosure-based measure of board expertise availability rather than a complete skills audit.
Diversity policy (X2) and diversity performance (Y) are conceptually related but are not identical. X2 is a narrow policy-adoption index based on three formal policy components: opportunity and diversity policy, diversity targets, and board diversity policy. By contrast, Y is represented by the Refinitiv DIR score, which is a broader standardized proxy for diversity and inclusion performance. Because both measures rely on disclosed information and may partially overlap, the mediation results are interpreted cautiously as evidence of association rather than proof that policy adoption causes diversity performance.
The analytical procedure combines several complementary approaches. First, descriptive statistics and ANOVA summarize the data and identify cross-country differences. Second, observed-variable SEM-path analysis is used to estimate the hypothesized channel linking board diversity, diversity policy, diversity performance, and firm value. The use of SEM-path analysis is justified because the model is specified with observed variables rather than latent constructs with multiple indicators, thereby reducing the complexity of the model. Following the common rule-of-thumb that approximately five to ten observations per observed variable may be acceptable for simpler SEM or path models (
Hair et al., 2019), the sample of 77 firms provides a basis for estimating the observed-variable path structure, although it remains at the lower bound of acceptability. Therefore, the SEM-path result is not interpreted in isolation. Model appropriateness is evaluated using goodness-of-fit statistics, and the SEM-path findings are further assessed through several robustness procedures. Third, regression-based analyses evaluate whether the SEM-path results remain stable under alternative estimation structures. The firm-year regressions use 154 observations and include country and year controls, while the two-year average regressions use 77 firm-level observations with heteroskedasticity-consistent standard errors. Fourth, sensitivity analyses use alternative PBV specifications, including winsorized PBV and log-transformed PBV, to reduce the influence of extreme valuation observations. Fifth, mediation is examined using PROCESS Model 4 with 5000 bootstrap samples. Sixth, Bayesian path analysis is estimated using the blavaan package in R with MCMC estimation, 10,000 iterations, weakly informative normal priors, and convergence assessed through Rhat values. These additional analyses are used to strengthen the empirical assessment and to reduce reliance on a single SEM-path specification. All results are interpreted as associational rather than causal because the study is based on a short observation period and non-experimental data.
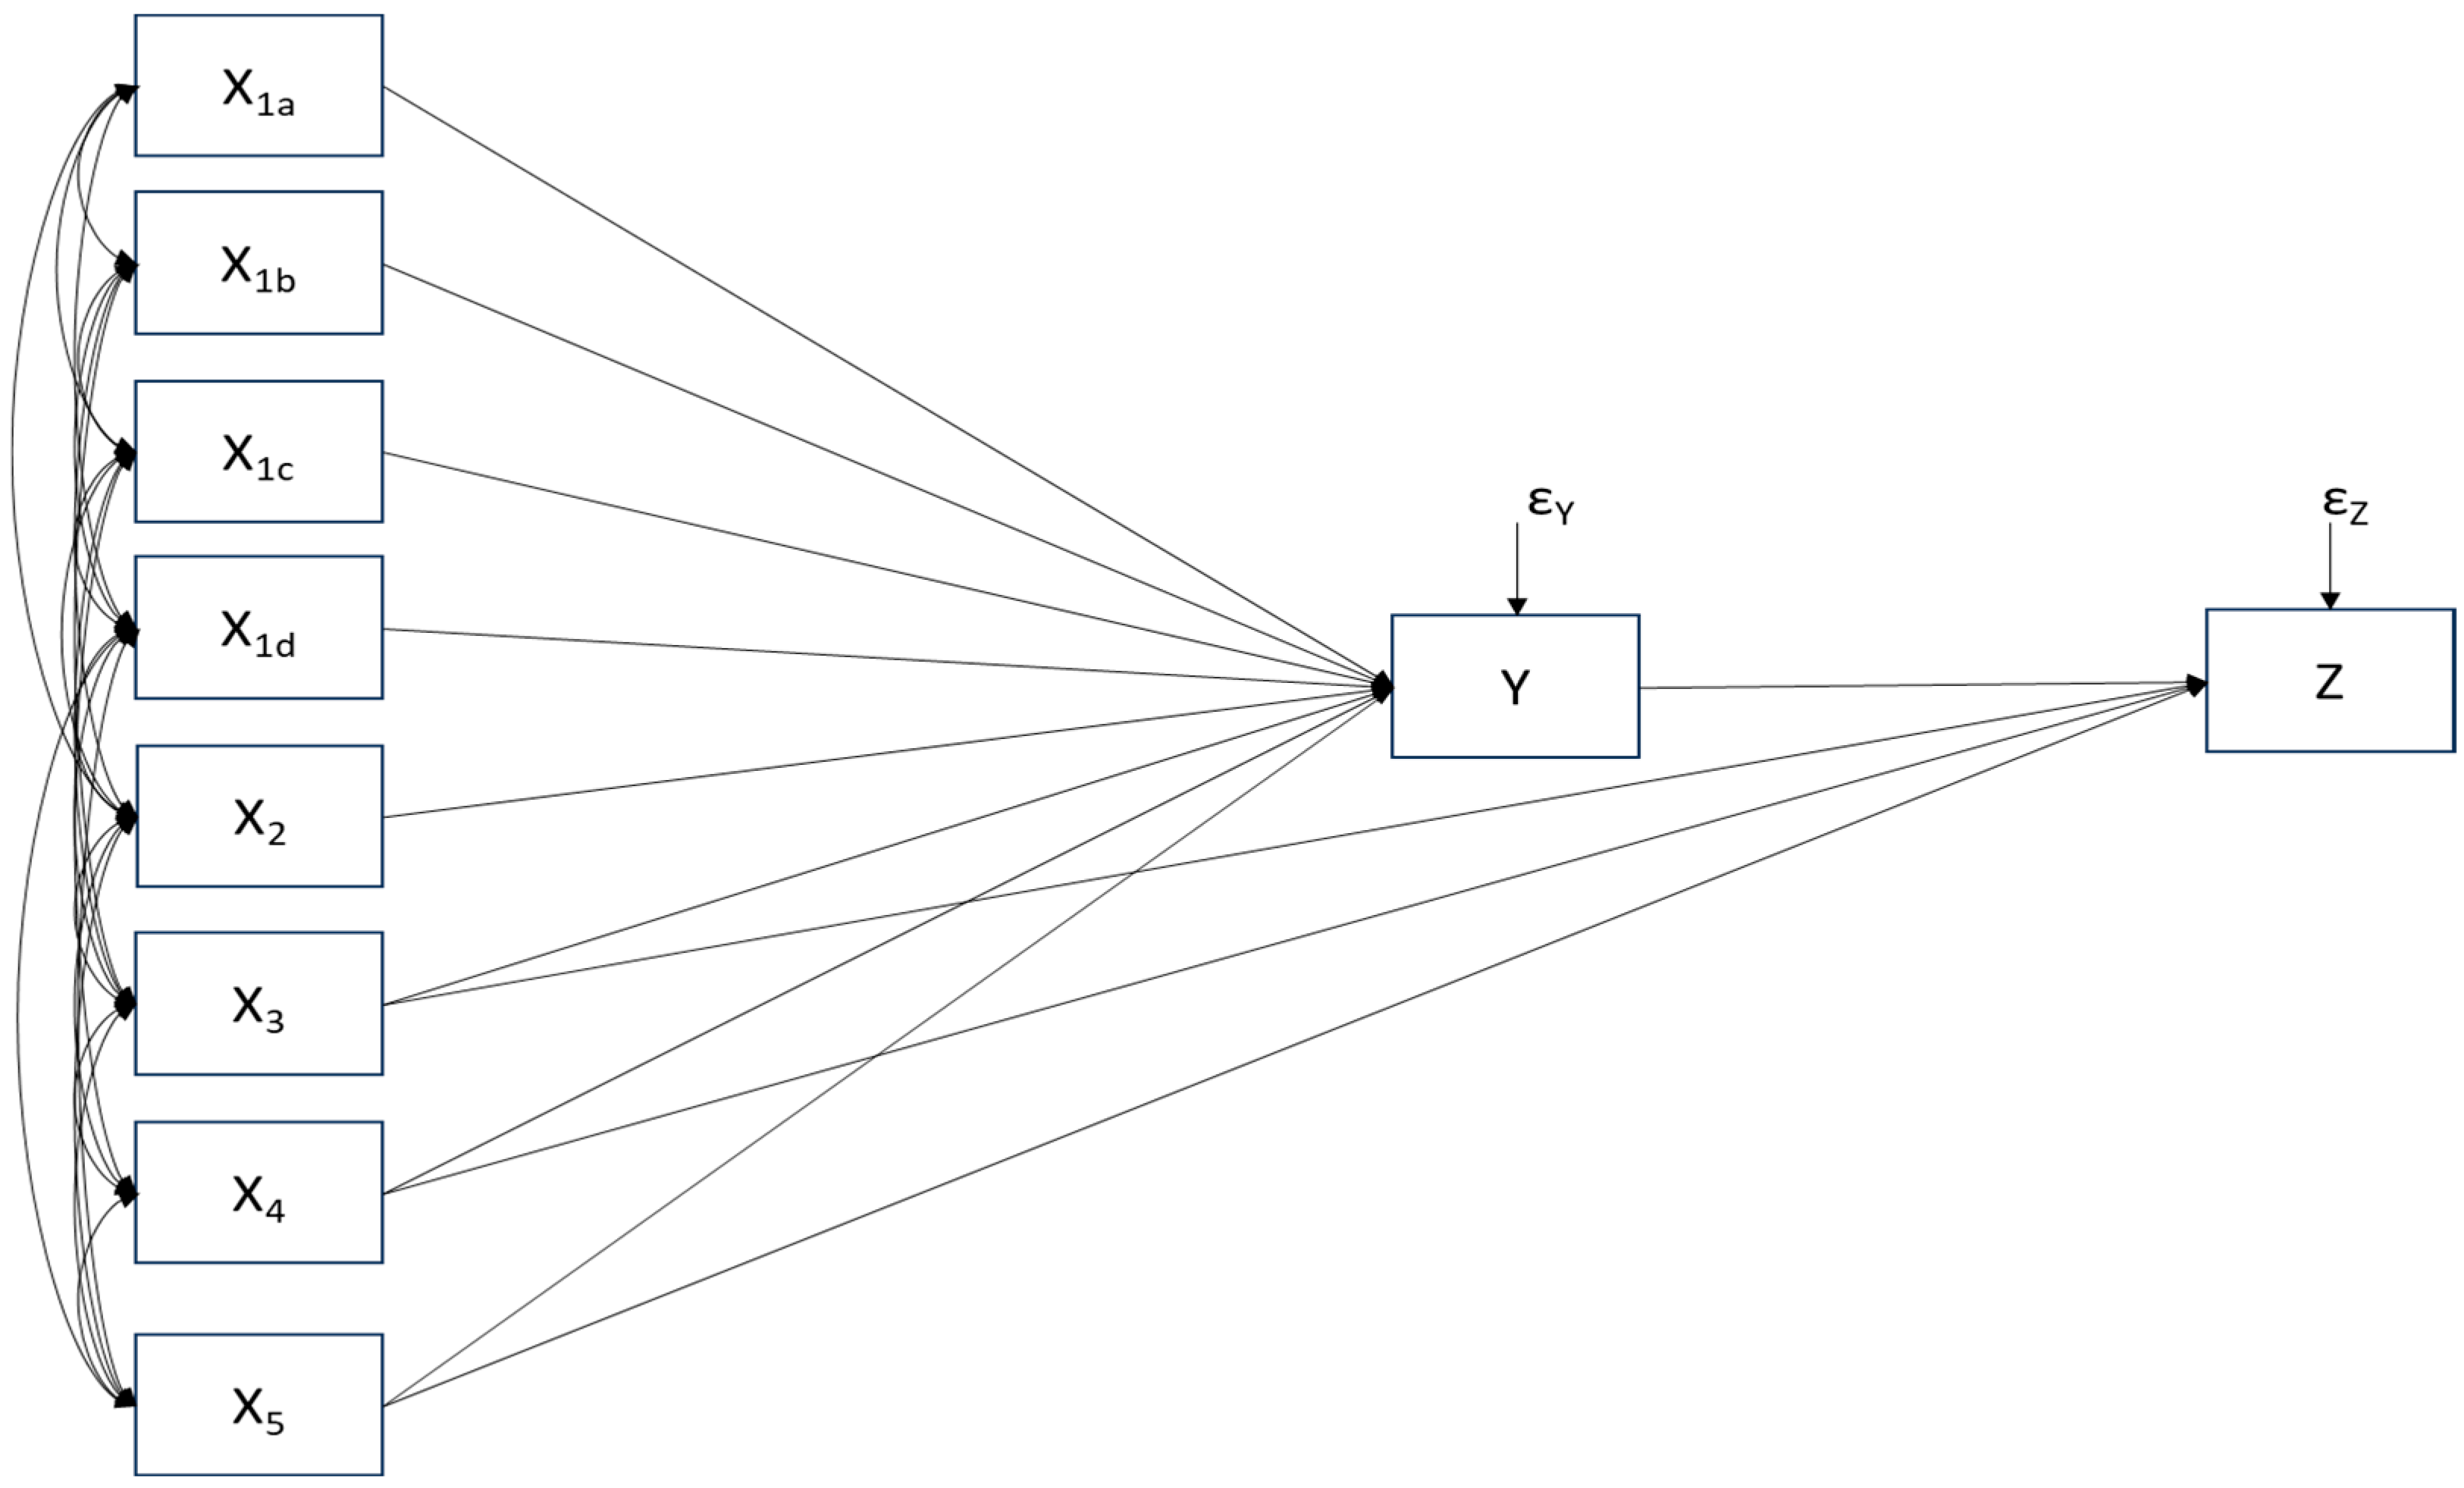
Figure 1 presents the research framework and illustrates the hypothesized relationships among board diversity, diversity policy, diversity performance, and firm value.
The structural equations are as follows:
where
ρYx1aX1a = path coefficient from X1a to Y
ρYx1bX1b = path coefficient from X1b to Y
ρYx1cX1c = path coefficient from X1c to Y
ρYx1dX1d = path coefficient from X1d to Y
ρYx2X2 = path coefficient from X2 to Y
ρYx3X3 = path coefficient from X3 to Y
ρYx4X4 = path coefficient from X4 to Y
ρYx5X5 = path coefficient from X5 to Y
ρzx3X3 = path coefficient from X3 to Z
ρzx4X4 = path coefficient from X4 to Z
ρzx5X5 = path coefficient from X5 to Z
ρzyY = path coefficient from Y to Z
εY = Error term Y
εZ = Error term Z
The SEM-path equations above specify the hypothesized relationships using path coefficients and estimate the channel structure in a simultaneous path framework. The regression equations below are used as robustness specifications and follow the same substantive logic. The Y model estimates diversity performance as a function of board diversity, diversity policy, and controls. The Z model estimates firm value as a function of diversity performance and controls. The full Z model adds board diversity and diversity policy together with diversity performance, thereby allowing the regression analysis to examine whether the direct associations between the X variables and Z remain after Y is included. In this sense, the regression framework provides a partial-mediation robustness check that complements the SEM-path model, while the SEM-path model represents the main full-channel path specification.
The regression equations are as follows:
where
Yit = diversity performance (DIR) of firm i in year t
Zit = firm value (PBV) of firm i in year t
X1ait = board gender diversity of firm i in year t
X1bit = board national diversity of firm i in year t
X1cit = board specific skills of firm i in year t
X1dit = board affiliation of firm i in year t
X2it = diversity policy of firm i in year t
X3it = firm size of firm i in year t
X4it = profitability (ROA) of firm i in year t
X5it = leverage of firm i in year t
α0, β0, γ0 = intercepts of the Y model, Z model, and full Z model
α1–α8 = regression coefficients in the Y model
β1–β4 = regression coefficients in the Z model
γ1–γ9 = regression coefficients in the full Z model
δc = country control
λt = year control
εit, μit, νit = error terms
For the two-year average robustness analysis, the same regression logic is applied at the firm level without the year-control term because each observation represents the average value for a firm across 2022–2023. For alternative firm-value specifications, Z is replaced by log-transformed PBV or winsorized PBV while the explanatory structure remains unchanged.
4. Results
4.1. Descriptive Statistics
Table 2 reports the descriptive statistics for the variables employed in this study.
Board gender diversity (X1a), measured by the proportion of women on the board of directors, has a mean of 24.93% with a standard deviation of 12.16. The minimum value of 0% indicates that some firms have no female board representation, while the maximum value of 66.67% indicates relatively high gender inclusion in other firms. Board national diversity (X1b), measured by the percentage of board members with different nationalities, shows substantial variation (M = 44.45%, SD = 30.17). This variation may reflect differences in internationalization, governance practices, and the composition of director talent pools across firms. Board-specific skills (X1c) have a mean of 49.38% (SD = 15.12), suggesting that many firms disclose some degree of professional expertise among directors. Board affiliation (X1d), measured by the average number of external board affiliations held by directors, has a mean of 0.85 and ranges from 0.00 to 3.36. This indicates that some directors bring broader exposure from other organizations, although the usefulness of such exposure depends on the relevance of the affiliations to the firm.
The presence and quality of board-level D&I governance are captured through board policy implementation (X2), which aggregates the disclosure of three elements: opportunity and diversity policies, measurable diversity targets, and a formal board diversity policy. The average score is 0.73 (SD = 0.16), with firms scoring between 0.33 and 1.00. This suggests that most firms have adopted at least two of the three key governance instruments, though a subset still lags behind in fully formalizing or disclosing their D&I commitments at the board level. The D&I performance score (Y), derived from the Refinitiv Diversity and Inclusion (DIR) metric, reflects the organization’s broader performance in D&I, including diversity objectives, board diversity disclosures, and human rights policies. The mean DIR score is 56.24 (SD = 6.80), with values ranging from 41.25 to 71.50. This distribution implies a moderately strong overall performance, although the lower-bound values indicate persistent disparities in how effectively firms translate D&I policies into practice.
Control variables demonstrate anticipated behavior. Firm size (X3), quantified as the natural logarithm of total assets, remains relatively stable across the sample (M = 22.15, SD = 1.83). Profitability (X4), represented by ROA, averages 0.05 (SD = 0.08), with some firms experiencing negative returns. Leverage (X5) exhibits a mean of 2.98 (SD = 3.24), indicating a diverse range of financial strategies among firms. The dependent variable, firm value (Z), assessed by the Price-to-Book (P/B) ratio, displays significant variation (M = 3.39, SD = 7.73), with values spanning from 0.20 to 51.33. This suggests considerable heterogeneity in investor perceptions of firms’ intrinsic and growth value, potentially influenced by variations in governance quality, D&I outcomes, and industry dynamics.
Table 3 below provides a comparative analysis of key diversity and inclusion (D&I) indicators between 2022 and 2023.
Board gender diversity (X1a) exhibited a modest yet statistically significant enhancement, with the mean percentage of women on boards increasing from 23.92% in 2022 to 25.93% in 2023 (t = 2.468, p = 0.014). This trend suggests an increasing commitment among corporations to bolster female representation at the board level. Conversely, board national diversity (X1b) experienced a slight increase from 43.55% to 45.36%, although this change was not statistically significant (t = 0.920, p = 0.358), indicating relative stability in ethnic or nationality-based diversity within board compositions over the two-year period. In contrast, board-specific skills (X1c) demonstrated a statistically significant increase, rising from 47.07% in 2022 to 51.69% in 2023 (t = 2.769, p = 0.006). This trend reflects a deliberate shift towards appointing directors with clearly defined professional competencies—such as expertise in finance, ESG, and law—which are critical for effective governance in increasingly complex regulatory and stakeholder environments. Board affiliation (X1d) remained largely unchanged, with a negligible decline from 0.86 to 0.85 (t = 0.729, p = 0.466). The lack of significant variation suggests consistency in the external exposure of board members, possibly reflecting enduring norms in director recruitment or network-based appointments.
The implementation of board-level D&I policies (X2) demonstrated a statistically significant improvement, increasing from an average score of 0.72 to 0.75 (t = 2.310, p = 0.021). This finding indicates incremental progress in formalizing and disclosing diversity-related governance frameworks, such as the adoption of diversity targets, opportunity policies, and board diversity commitments. The D&I performance score (Y), which reflects broader organizational outcomes in diversity and inclusion, improved from 55.81 in 2022 to 56.67 in 2023. Although the increase approached significance (t = 1.867, p = 0.062), it did not meet the conventional 5% significance threshold. Nonetheless, this upward trend suggests that improvements in board composition and governance policy may be contributing to enhanced organizational performance in D&I, even if the change over this one-year period is modest.
4.2. ANOVA Test
Table 4 reports the results of a one-way ANOVA analysis conducted to assess the differences in board diversity characteristics, board-level D&I policy implementation, and overall D&I performance across five Southeast Asian countries: Indonesia, Malaysia, Singapore, Thailand, and the Philippines.
Board gender diversity (X1a) exhibits significant variation across countries (F = 8.649, p = 0.000). Malaysia demonstrates the highest average female board representation at 29.91%, followed by Singapore at 24.76%. Conversely, Indonesia reports the lowest representation at 15.62%. These findings may reflect disparities in national gender equality policies and regulatory pressures. For example, Malaysia’s Corporate Governance Code actively promotes gender diversity targets, potentially driving higher adoption rates. In contrast, Indonesia lacks formal quotas or regulatory incentives, which may contribute to slower progress. Board national diversity (X1b) also varies significantly across countries (F = 5.077, p = 0.001). Indonesia (54.16%) and Malaysia (49.81%) report the highest levels of nationality diversity, while the Philippines (20.99%) has the lowest. These differences may be attributed to variations in foreign investment levels, the presence of multinational firms, and the openness of talent mobility across borders. Indonesia and Malaysia host numerous regional headquarters and attract foreign board talent, whereas more domestically oriented economies may exhibit less diverse board compositions. Board-specific skills (X1c) also differ significantly (F = 5.705, p = 0.000). The Philippines (54.86%) and Malaysia (53.49%) report the highest prevalence of skill-based board composition, suggesting a stronger emphasis on professional qualifications such as finance, ESG, and legal expertise. This may reflect corporate governance reforms and market-driven efforts to enhance board competency in these jurisdictions. Singapore, despite its reputation for governance excellence, reports a lower skill diversity score (41.49%), which may indicate a greater reliance on generalist or network-based appointments. The largest variation is observed in board affiliation (X1d), with a highly significant result (F = 18.287, p = 0.000). The Philippines (1.84) and Singapore (1.24) show higher average board affiliations per director, implying a stronger prevalence of multiple board memberships or interlocking directorates. In contrast, Thailand (0.50) and Malaysia (0.63) show more limited external exposure, possibly due to regulatory restrictions or market structure differences. High board interlocks may facilitate knowledge transfer but can also raise concerns regarding independence and accountability.
D&I policy implementation (X2) also exhibits significant cross-country differences (F = 3.071, p = 0.018). Singapore leads with an average score of 0.83, reflecting a more mature and transparent governance environment where formal D&I policies are routinely disclosed. Thailand (0.74), Malaysia (0.73), and Indonesia (0.70) follow closely, while the Philippines lags behind (0.67), suggesting variations in corporate disclosure practices and policy institutionalization. Finally, D&I performance (Y), as measured by the Refinitiv Diversity and Inclusion Score, significantly differs across countries (F = 2.908, p = 0.024). Singapore again emerges as the regional leader with an average score of 60.43, followed by the Philippines (57.35) and Thailand (56.44). Indonesia (55.81) and Malaysia (54.88) report slightly lower performance scores. These differences may be shaped by a combination of policy maturity, board composition, and organizational commitment to inclusive practices beyond compliance.
Overall, the ANOVA results confirm that national context significantly influences board diversity, policy adoption, and D&I outcomes. The differences observed across countries may be explained by a combination of regulatory environments, institutional maturity, market expectations, and sociocultural factors. The findings highlight the critical need to account for country-specific dynamics when assessing and advancing corporate diversity and inclusion strategies.
4.3. SEM-Path Test
As illustrated in
Table 5, the SEM-path model exhibits an acceptable overall fit across absolute, incremental, and parsimony categories. Given the small sample and observed-variable specification, the SEM-path model is interpreted together with regression-based robustness checks, bootstrapped mediation analysis, and Bayesian path analysis. This structure allows the empirical interpretation to rely on the consistency of results across multiple statistical approaches rather than on a single path specification.
The SEM-path results in
Table 6 show that the model explains 39% of the variance in diversity performance (Y) and 48% of the variance in firm value (Z). These values indicate moderate explanatory power for an associational model based on recent cross-country disclosure data.
In the first model, national diversity (X1b), board affiliation (X1d), and diversity policy (X2) exhibit positive and statistically significant associations with diversity performance. These findings suggest that firms with more nationally diverse boards, directors with broader external affiliations, and more formal diversity policies tend to show stronger diversity and inclusion performance. Gender diversity (X1a) and board-specific skills (X1c) are not statistically significant in the model. These results do not imply that gender representation or board expertise is unimportant; rather, they indicate that, in this sample, representation and disclosed expertise alone are not sufficient to explain variation in Refinitiv DIR scores after other variables are considered.
In the second model, diversity performance (Y) is positively and significantly associated with firm value (Z). This suggests that firms with stronger observed diversity and inclusion performance tend to have higher market valuation as reflected in the price-to-book ratio. The result is consistent with the view that investors may value observable diversity outcomes as signals of governance quality, stakeholder responsiveness, and organizational resilience. However, the finding should be interpreted as an association and not as definitive evidence that diversity performance causes higher firm value.
4.4. Robustness Check
Robustness analysis is conducted to evaluate whether the SEM-path findings remain stable under alternative statistical specifications. The first analysis re-estimates the main relationships using the firm-year dataset of 154 observations with country and year controls. The second analysis uses two-year firm-average data to reduce concerns that the results are driven by repeated firm-year observations. The third analysis applies alternative PBV specifications, including winsorized and log-transformed PBV. The fourth analysis uses PROCESS bootstrapped mediation, and the fifth analysis applies Bayesian path analysis. The robustness tests focus on the consistency of sign, statistical support, and substantive interpretation across SEM-path analysis, regression models, bootstrap mediation, and Bayesian estimation.
Table 7 shows that the firm-year regressions are broadly consistent with the SEM-path interpretation, although several board diversity paths become weaker after adding country and year controls. In the Y model, X2 remains positive and statistically significant, supporting the central role of formal diversity policy in explaining diversity performance. X1b and X1d retain positive signs, which is consistent with the SEM-path direction, but they are not statistically significant in the firm-year specification. X1a and X1c remain statistically unsupported, consistent with the SEM-path results. In the Z models, Y remains positively associated with Z both in the model without direct board diversity variables and in the full model, with significance at the 10% level. This supports the H3 interpretation that diversity performance is positively associated with firm value. The control variables also show a stable pattern: X3 is negatively associated with Z, while X4 and X5 are positively associated with Z.
Table 8 reports the robustness test using two-year average data, which is used to assess whether the main results remain consistent when the analysis is conducted at the firm-level average rather than the firm-year level.
The two-year average regressions provide stronger consistency with the SEM-path model. In the Y model, X1b, X1d, and X2 are positive and statistically significant, while X1a is positive at the 10% level and X1c remains statistically unsupported. This pattern aligns with the SEM-path evidence that diversity performance is more closely associated with national diversity, board affiliation, and formal diversity policy than with board-specific skills. In the Z model, Y is positive and statistically significant, confirming the SEM-path finding that diversity performance is associated with firm value. The direction of X3, X4, and X5 is also consistent with the firm-year regression results.
Table 9 presents the winsorized PBV robustness test. Winsorization at the 5th and 95th percentiles reduces the influence of extreme firm-value observations while retaining the same substantive model structure. The Y model remains consistent with the SEM-path results because X1b, X1d, and X2 are positively associated with Y, while X1c remains statistically unsupported. In the Z model, Y remains positive and statistically significant, indicating that the association between diversity performance and firm value is not driven solely by extreme PBV observations.
The robustness analyses show a coherent pattern across alternative tests. First, the SEM-path analysis indicates positive associations from X1b, X1d, and X2 to Y, and from Y to Z. Second, the firm-year regression confirms the positive association between X2 and Y and shows that Y remains positively associated with Z even after country and year controls are included. Third, the two-year average regression reproduces the SEM-path pattern more closely, with X1b, X1d, and X2 positively associated with Y and Y positively associated with Z. Fourth, the winsorized PBV model confirms that the Y-Z association remains positive after reducing the influence of extreme valuation observations. Additional log-PBV sensitivity tests also show a positive Y-Z association in both the firm-year and two-year average specifications, although the full firm-year model is marginally weaker. Taken together, the robustness evidence supports the central interpretation that diversity performance is positively associated with firm value, while diversity policy is the most stable antecedent of diversity performance. The evidence for X1b and X1d is generally positive but more sensitive to the estimation approach, and the evidence for X1a and X1c remains weak across models.
The mediation analysis evaluates whether Y functions as a channel linking each board diversity or policy variable with Z. PROCESS Model 4 is estimated using the two-year firm-average dataset and 5000 bootstrap samples. Each board diversity or policy variable is entered as the independent variable in a separate model, Y is entered as the mediator, and the remaining board diversity or policy variables and firm controls are entered as covariates. The indirect effect is interpreted as supported when the 95% bootstrap confidence interval does not include zero.
Table 10 presents the PROCESS bootstrapped mediation results, which are used to assess whether diversity performance serves as an indirect channel linking board diversity and diversity policy with firm value.
The PROCESS results show that the indirect effects of X1d and X2 on Z through Y are positive and statistically supported. The indirect effects of X1a, X1b, and X1c through Y are not supported because their bootstrap confidence intervals include zero. These findings are consistent with the broader empirical pattern. X2 is the most stable antecedent of Y across SEM-path and regression tests, and X1d is positive in the SEM-path and two-year average models. The mediation evidence therefore indicates that the channel from diversity governance to firm value is more evident for external board affiliation and formal diversity policy than for all board diversity attributes uniformly.
Bayesian path analysis is also used to examine the same mediation structure under an alternative estimation framework. The model estimates paths from X1a, X1b, X1c, X1d, X2, and controls to Y, and from Y, X1a, X1b, X1c, X1d, X2, and controls to Z. The model is estimated using MCMC with 10,000 iterations and weakly informative normal priors. Convergence is satisfactory, with Rhat values equal to 1.000 across reported parameters. The posterior predictive p-value is 0.206, indicating that the Bayesian model does not show severe misfit.
Table 11 reports the Bayesian path analysis results for the indirect effects, providing an alternative estimation approach to evaluate the mediation structure.
The mediation results strengthen and qualify the channel interpretation. PROCESS bootstrapping supports the indirect effects for X1d and X2, while Bayesian path analysis confirms the same positive direction and the main component paths but produces wider credible intervals for the defined indirect effects. The consistency between SEM-path analysis, regression robustness, PROCESS bootstrapping, and Bayesian path analysis is strongest for the Y-Z relationship and the X2-Y relationship. The evidence for X1d is also generally supportive, while the evidence for X1a, X1b, and X1c is weaker or more sensitive to specification. Therefore, the mediation evidence is interpreted as suggestive and associational rather than as conclusive causal evidence.
5. Discussion
This study provides theoretical insight into how board diversity, diversity policy, diversity performance, and firm value are connected in the ASEAN-5 context. The findings suggest that board diversity does not necessarily relate to firm value directly through board composition alone. Instead, diversity becomes more relevant for valuation when it is reflected in observable diversity and inclusion performance. This contributes to the finance literature by showing that investors may pay attention not only to whether firms have diverse boards or formal diversity policies, but also to whether these governance features are associated with broader organizational outcomes. In this sense, diversity performance serves as an important channel linking governance structure with market valuation, particularly in emerging-market settings where ESG disclosure quality and governance maturity remain uneven across firms and countries (
Park et al., 2021;
Putri & Pratama, 2023).
From a resource-based view, the findings refine the argument that board diversity can function as a strategic governance resource. National diversity and board affiliation appear to be more closely associated with diversity performance because they may provide firms with cross-border experience, broader stakeholder awareness, external networks, and exposure to governance practices in other organizations. These resources may support diversity and inclusion outcomes when they are embedded in board deliberation and organizational routines. However, the non-significant findings for gender diversity and board-specific skills indicate that not all diversity attributes automatically become valuable resources. Gender representation and professional expertise may require meaningful participation, influence in decision-making, and connection to diversity-related responsibilities before they can contribute to diversity performance. This interpretation is consistent with prior studies showing that the effect of board diversity depends on critical mass, inclusion in board processes, and the extent to which diverse perspectives shape strategic priorities (
Ashikali & Groeneveld, 2013;
Holgersson et al., 2016;
Y.-H. Wang, 2020;
Yang & Konrad, 2011;
Mehari et al., 2024;
Jejeniwa et al., 2024).
The findings also support an institutional interpretation of diversity governance. The strong association between diversity policy and diversity performance suggests that formal diversity policies may reflect firms’ responses to external expectations, investor pressure, regulatory development, and evolving governance norms. Opportunity and diversity policies, diversity targets, and board diversity policies may help formalize commitment, create accountability, and signal alignment with inclusive governance expectations (
Almenaba-Guerrero & Herrera-Sánchez, 2022;
Nadiv & Kuna, 2026). Nevertheless, this relationship should be interpreted cautiously because the policy index and the Diversity and Inclusion Rating score are both derived from disclosed information and may partially overlap. Accordingly, the result should not be read as evidence that policy adoption automatically leads to improved diversity performance. Rather, it indicates that firms with more formalized and visible diversity policy commitments tend to receive stronger standardized diversity and inclusion ratings. This finding therefore supports the view that formal diversity governance and broader diversity-related disclosure are closely connected, while leaving open the question of whether policy adoption translates into substantive improvements in diversity practice.
The positive association between diversity performance and firm value has important implications for finance research. It suggests that diversity may become value-relevant when it is perceived as evidence of governance quality, stakeholder responsiveness, legitimacy, and long-term organizational resilience. Diversity performance may therefore provide investors with a more visible and interpretable signal than board composition or policy disclosure alone, especially in ASEAN markets where firms differ in governance maturity, disclosure practices, and institutional expectations. At the same time, this relationship remains associational. Higher-valued firms may have greater resources to invest in diversity systems and stronger incentives to communicate diversity-related practices to the market. Because the Diversity and Inclusion Rating score remains partly disclosure-based, the observed association with firm value may reflect market responses to visible and standardized diversity profiles rather than independently verified internal diversity outcomes alone. Accordingly, the finding suggests that observable diversity and inclusion performance is relevant to market valuation, while also recognizing that firm value, organizational resources, and diversity-related disclosure may reinforce one another.
Overall, the findings indicate that the resource-based view and institutional theory are complementary in explaining the relationship among board diversity, diversity policy, diversity performance, and firm value. The resource-based view explains how board diversity may provide knowledge, networks, legitimacy, and stakeholder insight, while institutional theory explains why firms adopt and disclose diversity policies in response to external expectations and governance norms (
Shi et al., 2017;
E-Vahdati et al., 2018). This combined interpretation helps explain why prior studies often report mixed direct effects of board diversity on firm value. Diversity may not create value merely because diverse board attributes exist, but because such attributes and policies are translated into credible diversity performance. For managers, this implies the need to move beyond symbolic diversity representation and strengthen the governance mechanisms that connect board diversity, policy architecture, and organizational outcomes. For regulators and investors, diversity policy disclosure and diversity performance may serve as complementary indicators in assessing governance quality and sustainability orientation (
Putri & Pratama, 2023).
The bootstrapped and Bayesian analyses further qualify the channel interpretation. The PROCESS results suggest that diversity and inclusion performance may serve as a channel through which board affiliation and formal diversity policy are connected with firm value. The Bayesian analysis supports the positive direction of the same main relationships, but the 95% credible intervals for the indirect effects include zero. This pattern reinforces a cautious interpretation: the proposed diversity–performance–valuation pathway is plausible and empirically suggestive, but it should not be read as conclusive evidence of mediation or causality.
Table 12 is intended to synthesize the evidence across estimation approaches rather than to treat each model as a separate confirmation of the proposed relationships. It compares the main path analysis with additional robustness tests and shows that the overall empirical pattern is broadly consistent in direction, although the level of support varies across methods. The main path analysis evaluates the hypothesized channel structure, the regression models estimate partial associations under alternative data structures and controls, the bootstrapped mediation analysis focuses on indirect pathways, and the Bayesian analysis provides a more conservative assessment using credible intervals. Differences across these estimates are therefore interpreted as evidence of methodological sensitivity rather than direct contradiction.
Across
Table 12, formal diversity policy remains the most stable governance-related factor. Firms with stronger formal diversity policy commitments tend to report stronger diversity and inclusion performance across the main path analysis, firm-year regression, two-year average regression, bootstrapped mediation analysis, and Bayesian direct-path estimation. Diversity and inclusion performance is also generally positive in relation to firm value, suggesting that observable diversity profiles may be relevant to market valuation. However, the level of support is not identical across specifications. Accordingly, this evidence should be interpreted as a consistent but cautious association rather than as proof of a causal valuation effect.
The evidence for board diversity is more selective. Board national diversity and board affiliation show positive evidence in the main path analysis, but their support weakens under some alternative specifications and controls. Among the board diversity dimensions, board affiliation provides the clearest indication of a possible valuation channel, particularly when considered together with formal diversity policy. The bootstrapped mediation analysis supports selected indirect pathways, whereas the Bayesian analysis is more conservative and does not provide conclusive support for the indirect effects. Taken together,
Table 12 supports a cautious conclusion: diversity and inclusion performance appears to be a plausible channel through which formal diversity policy, and to a lesser extent board affiliation, may be reflected in firm value, but the evidence is not strong enough to claim that this channel operates uniformly across all board diversity dimensions or that the relationship is causal.
6. Limitations
This study should be interpreted in light of several limitations. First, the analysis is based on 77 ASEAN-5 firms with complete and comparable Refinitiv data for the 2022–2023 period. The use of standardized Refinitiv indicators improves cross-country comparability, but it also narrows the sample to firms with available diversity-related coverage. As a result, the findings should not be read as representing all listed companies in Southeast Asia. The two-year observation window further limits the ability to observe longer-term changes in diversity governance, diversity performance, and market valuation. The relatively small sample also limits statistical power, particularly for indirect effects and for relationships that are sensitive to model specification. These limitations do not invalidate the observed associations, but they require the conclusions to remain cautious, sample-specific, and associational.
Second, the limited sample reflects the trade-off between broader coverage and measurement comparability. Extending the panel period or expanding the sample through manual data collection was considered; however, comparable diversity-related indicators remain limited across ASEAN-5 firms. Manual data from annual reports, corporate websites, or sustainability reports could enrich the analysis, but such data may also introduce inconsistencies in terminology, language, reporting structure, disclosure depth, and coding judgment across countries. These inconsistencies could weaken the validity of cross-country comparisons, particularly when the study aims to compare diversity governance and D&I performance across different institutional settings. For this reason, the study retains standardized Refinitiv-based measures and strengthens the empirical assessment through firm-year regression, two-year average regression, alternative PBV specifications, PROCESS bootstrapped mediation, and Bayesian path analysis. Future research may extend the present study by developing a carefully coded manual dataset once more consistent diversity-related disclosures become available across ASEAN-5 markets.
Third, the reliance on Refinitiv Eikon improves cross-country comparability, but it also limits measurement to standardized disclosed indicators. The Refinitiv Diversity and Inclusion Rating score is used as a proxy for diversity performance, but it remains partly disclosure-based and may overlap with the information captured by the diversity policy measure. This overlap creates an important interpretive limitation. The observed relationships should therefore be understood as evidence that firms with more visible and formalized diversity-related disclosures tend to report stronger standardized diversity and inclusion profiles and, in some specifications, higher market valuation. They should not be interpreted as proof that diversity policy adoption necessarily produces substantive internal diversity improvements or directly increases firm value.
Fourth, the additional analyses strengthen the empirical foundation but do not remove the limits of the research design. The regression analyses, bootstrapped mediation analysis, and Bayesian path analysis provide complementary evidence on the stability of the findings; however, they remain based on a short observation period and a relatively small sample. The Bayesian results are particularly important because they support the positive direction of the main relationships while indicating that the indirect effects are not conclusive at the 95% credible-interval level. For this reason, the proposed diversity–performance–valuation pathway should be viewed as plausible and suggestive, not as a verified causal sequence. Future studies should use longer panels, larger samples, and stronger identification strategies to evaluate this channel more rigorously.
7. Conclusions
The findings indicate that different dimensions of board diversity do not contribute to diversity and inclusion performance in the same way. Among the governance attributes examined, board affiliation and formal diversity policy show the most consistent positive associations with diversity and inclusion performance, whereas gender diversity, national diversity, and board-specific skills are less stable across alternative specifications. This suggests that diversity governance may be more strongly reflected in firm value when it is translated into observable diversity and inclusion performance, rather than when it is represented only by board composition.
The additional mediation and robustness analyses provide cautious support for this interpretation. The bootstrapped mediation results suggest that board affiliation and formal diversity policy may be connected to firm value through diversity and inclusion performance. The Bayesian analysis also supports the positive direction of the main relationships, but the indirect effects remain statistically inconclusive. These findings therefore contribute to the finance and firm-value literature by showing that diversity governance may become more relevant to market valuation when it is reflected in measurable diversity and inclusion outcomes.
From a practical perspective, firms should strengthen the alignment between board composition, formal diversity policies, and measurable diversity outcomes. Diversity policies should not remain symbolic commitments; rather, they should be supported by implementation mechanisms that can be observed by stakeholders and assessed by investors. Regulators and stock exchanges may also encourage more consistent diversity and inclusion disclosure so that market participants can better distinguish substantive diversity practices from formal or symbolic commitments.
Overall, this study identifies a plausible pathway through which diversity governance may be associated with firm value through observable diversity and inclusion performance. However, the conclusion remains intentionally cautious. The small sample, short observation period, reliance on standardized Refinitiv indicators, partial overlap between policy disclosure and diversity performance measures, and non-conclusive Bayesian indirect effects prevent the findings from being interpreted as definitive evidence of mediation or causality. The results should therefore be read as triangulated associational evidence from the observed ASEAN-5 sample and as a basis for further research rather than as a final statement on the diversity–performance–valuation relationship.