Article

Dynamic Co-Movement Among Exchange Rate Volatility, Energy Commodities, and Stock Indices: A Multiple Wavelet Approach


by
Benjamin Mudiangombe Mudiangombe
and
Charles Raoul Tchuinkam-Djemo
*
School of Economics, University of Johannesburg, P.O. Box 524, Johannesburg 2006, South Africa
*
Author to whom correspondence should be addressed.
Int. J. Financ. Stud. 2026, 14(7), 175; https://doi.org/10.3390/ijfs14070175
Submission received: 4 March 2026 / Revised: 8 May 2026 / Accepted: 25 June 2026 / Published: 7 July 2026

Abstract

This study employed a different type of wavelet approach to investigate the dynamic interdependence among exchange rate volatility, stock indices, and energy commodity markets. Using daily data covering the period from 2005 to October 2025 on energy commodities, stock index, and foreign exchange rates of selected BRICS economies. We include both crude oil and Brent oil, along with natural gas, aiming to capture not only the time–frequency interconnectedness among these assets but also to gain deeper insights into cross-commodity correlations across various energy sectors, thereby clarifying whether economic shocks in these markets are localized or globalized. Assessing data volatility, it can be observed that exchange rates and stock indexes tend to be less volatile than oil markets. The coherence zone indicates that foreign currency significantly influences the interdependence between the Bovespa and Brent oil prices. While rising oil prices can generate inflationary pressures, for an oil-exporting nation like Brazil, the favorable impacts on exports and the trade balance often led to an appreciation of the Brazilian Real (BRL) against the US dollar.

1. Introduction

Financial markets have become increasingly interconnected, with foreign exchange rates serving as a primary driver of spillovers across markets, particularly in energy commodities such as oil and natural gas, as well as in stock markets. In this context, gaining insights into the interconnectedness among these asset classes remains an essential area of research for academia, despite the extensive body of literature that already addresses this topic. Numerous studies have investigated dependence and interconnectedness among stock markets and energy prices through various wavelet methodologies (Chien et al., 2021; Amoako et al., 2022). Other research has focused on the relationships among stock markets, oil markets, and exchange rates using Vine copulas, as well as on the exchange rate and crude oil prices employing a regime-switching copula approach (Badwan et al., 2025). Additionally, the implications of stock markets on portfolio management have been explored through a wavelet approach (Muneer et al., 2026).
Furthermore, the interconnectedness among crude oil, exchange rates, interest rates, and equity markets has been analyzed using a time-varying parameter vector autoregression (TPV-VAR)-based connectedness method (Singh et al., 2026). Similarly, Ertugrul et al. (2025) employed the extended TPV-VAR analysis to understand the interlinkages among precious metals, the exchange rate, and crude oil. Lastly, the relationships among exchange rates, gold prices, and stock markets have been examined using a quantile regression approach (Ali et al., 2020).
Many studies exploring the interconnectedness of stock, commodity, and foreign exchange markets employ a variety of methodologies, including wavelet analysis; vine copulas; dynamic conditional correlation and its extended model, TPV-VAR analysis; and quantile regression. Among these approaches, wavelet analysis stands out for its distinct advantages over traditional methods, particularly for analyzing complex, transient, or non-stationary phenomena. Its strength lies in its ability to emphasize local signal features while also capturing overarching trends. This technique is particularly valuable for processing and analyzing high-frequency data, which is essential for effective portfolio management of time-series data. Wavelet Transforms enable transitions between low- and high-frequency signals, making them suitable for gaining deeper insights into the dynamic interdependence among selected energy commodities, stock indices, and exchange rates.
This study employs the Wavelet approach to analyze both Brent and crude oil data, aiming to explore the relationship between price spillovers across countries and market integration, using equity indices as indicators of financial stress. By integrating both crude oil and Brent oil into our analysis, we obtain a more nuanced understanding of global economic shifts, allowing us to determine whether co-movement is localized or reflects a broader global trend. In addition to these energy commodities, we also incorporate equity markets, foreign exchange rates, and natural gas to enhance our understanding of global and regional trends, thereby providing a comprehensive view of how energy markets impact the broader economy. The Wavelet Coherence model effectively captures co-movement during downturns between financial stress and commodity hedging, facilitating a thorough assessment of systemic risk. The time–frequency dynamics, nonlinear spillovers, and multivariate interactions among oil prices, stock markets, and exchange rates in Brazil and other emerging economies have, however, not been adequately examined in the literature, despite this known relationship.
Most existing research uses bivariate frameworks or linear models, which ignore the likelihood that correlations change across market regimes, investment horizons, and volatility levels. Furthermore, there is still a dearth of empirical research examining these connections using sophisticated techniques such as Wavelet Coherence and Multiple Wavelet Coherence, which could capture the intricate, dynamic, and nonlinear structure of the stock–oil–exchange rate and the stock–gas–exchange rate nexus. However, this study’s uniqueness goes beyond just proving that such a relationship exists; it employs the stock–oil–exchange rate nexus’s time–frequency decomposition, which shows how these interactions evolve across short-, medium-, and long-term time horizons. This study offers a concurrent examination of exchange rates, stock markets, and oil prices or gas prices instead of just bilateral ties, using Partial Wavelet Coherence (PWC) and Multiple Wavelet Coherence (MWC) to separate the impact of foreign exchange volatility markets on oil-stock and gas-stock relationships. Wavelet-based methods offer deeper insights into dynamic and scale-dependent interactions. The main questions to address are as follows: How do stock markets, oil prices, and exchange rates co-move across BRICS countries over different time–frequency horizons? Does the inclusion of a third market variable alter the strength and significance of bilateral co-movement?
This study adds various unique and innovative perspectives to the literature on financial market interconnection. First, unlike previous studies that primarily use bivariate or linear frameworks, this study employs a Multiple and Partial Wavelet Coherence (MWC-PWC) approach, allowing for a more rigorous decomposition of direct and indirect spillover channels, particularly the role of exchange rate volatility in the energy–stock nexus. In the first place, it is important to note that the contribution of the current study is not limited to the application of MWC and PWC. Instead, the unique aspect of the current paper lies in its focus on a specific economic setting, its comparative analysis across several countries, and the novel results achieved through dynamic analysis of BRICS countries’ financial markets, highlighting heterogeneous transmission mechanisms. Second, this study conducts a complete multivariate and cross-market analysis by simultaneously assessing exchange-rate volatility, various energy commodities (Brent, crude oil, and natural gas), and stock indices, whereas most previous studies focus on a single commodity or bilateral correlations. Third, by including a time–frequency decomposition across investment horizons (short-, medium-, and long-term), this study’s model enables the detection of scale-dependent and regime-specific dynamics that classic time-domain models (e.g., VAR and DCC-GARCH) do not capture.
The empirical results offer several crucial insights into the dynamics that control international financial markets in both periods of relative stability and severe crises. A notable finding across all countries is that the foreign exchange rate acts as a key channel for transmitting energy price shocks to equity markets. When currency influences are excluded, the transition from Multiple Wavelet Coherence (MWC) to PWC consistently reveals reduced coherence regions, particularly in South Africa and Russia.
The remainder of this paper is organized as follows: Section 2, literature review; Section 3, the methodology; Section 4, findings and discussions; and Section 5, the conclusion.

2. Literature Review

The volatility of foreign exchange rates and its interconnectedness with other financial assets, including precious metals, equity indices, energy commodities, and AI-driven assets such as cryptocurrencies, have become increasingly concerning for practitioners, policymakers, and researchers in the realms of financial economics and international trade. Notably, the stylized features of these assets, such as volatility clustering, spillover effects, and heavy-tailed volatility, are critical to all aspects of investment. Furthermore, currency volatility has significant implications for commodity prices and overall economic stability, potentially causing fluctuations across markets, including precious metals, energy commodities, and equity indices.
These characteristics profoundly impact multi-asset portfolio allocation and macroeconomic stability, with particularly severe effects observed in oil-exporting countries and emerging economies. Consequently, analyzing foreign exchange movements and their dynamic interdependence across various financial markets is crucial for developing effective foreign exchange rate policies and risk management strategies. Given that foreign exchange rate volatility has become a primary issue for multinational firms and fund managers engaging in international portfolio diversification, there has been a growing interest among financial researchers, both practitioners and academics, in modeling exchange rate volatility and investigating interdependent relationships with energy, commodities, and equity indices, along with the behaviors of financial markets. To achieve this, researchers have employed various empirical models to deepen their understanding of the dynamic interconnections between exchange rate volatility and financial assets. For example, in their exploration of the interconnections among precious metals, the exchange rate, and crude oil, Ertugrul et al. (2025) employed a time-varying parameter vector autoregressive (TVP-VAR) analysis on a daily dataset encompassing crude oil, the exchange rate, and precious metals. Their findings indicate that palladium and silver act as both propagators and recipients of return shocks, whereas crude oil, gold, and platinum serve as the primary sources of shock transmission. Although their study provides a thorough analysis of shock transmission, it overlooks country-specific changes associated with natural gas. Jiang and Yoon (2020), concentrating on oil-importing nations, employed Wavelet Coherence to explore the relationship between stock markets and oil prices. They uncover significant co-movement in certain frequency bands during periods of crisis. Their findings provide credence to the notion that stock markets in net oil-importing economies are vulnerable to substantial impacts from fluctuations in oil prices.
Unlike oil-importing countries, Tabash et al. (2022) included macroeconomic variables. They investigated the relationships among oil prices, exchange rates, and stock indices in Pakistan during and after COVID-19 using a vector autoregressive (VAR) approach. They found no evidence of a direct relationship between the exchange rate and changes in oil prices. In contrast, Kumar et al. (2017) examined the interdependence among major currencies’ exchange rates traded on the Indian stock exchange using the Wavelet Cohesion approach. Their findings revealed a dynamic co-movement pattern among these currencies. However, the study is limited to the major currencies within the Indian stock market, thus offering a narrow perspective on their interplay and interdependence with other financial markets. To address these limitations, Razi et al. (2025) utilized Wavelet Coherence and causality analysis to examine the co-movement between energy price volatility and exchange rate fluctuations within the Association of Southeast Asian Nations (ASEAN). Their findings indicate that energy price volatility significantly impacts global economic stability.
Additionally, they highlight a marked effect of energy price volatility on exchange rates in energy-exporting nations. The application of wavelet methodology enables a more in-depth analysis of the time–frequency dynamics between assets, offering an advantage over other empirical techniques, such as vine copulas and TVP-VAR. Bhullar et al. (2024) utilized the volatility transmission approach based on the DCC-GARCH model to evaluate the interdependence between energy commodities and stock indices. Their findings reveal strong interdependence between Brent oil and stock indices, whereas natural gas shows minimal interdependence. However, their analysis, while focusing on Brent oil and natural gas as selected energy commodities, overlooks crude oil, thereby limiting the scope for understanding the global economic shift. Similarly, Chien et al. (2021) employed the wavelet-based Granger Causality test to investigate the co-movement among energy prices and stock markets, while Zeng et al. (2022) used the vine copula-based CoVaR to examine the dependence and spillover among these markets, including the exchange rate. Badwan et al. (2025) employed the regime-switching copula approach to assess the dependence structure of the US dollar and crude oil prices. Amoako et al. (2022) examined the BRICS economies and explored the influence of volatility on the interconnectedness between energy commodities and stock markets. Their findings indicate stronger positive co-movement between these markets, highlighting the long-term impact of volatility on the correlation between energy prices and stock indices. Notably, this correlation is particularly pronounced in Russia, where it appears resilient to volatility in energy commodities and stock indices. Muneer et al. (2026) focused on emerging stock markets and investigated their dynamic co-movements using the wavelet approach, with particular emphasis on the implications for portfolio managers. Their findings reveal high co-integration among the stock markets of the selected emerging markets. However, their study focuses exclusively on stock markets, neglecting the exchange rate market, whose the volatility significantly affects stock performance. Singh et al. (2026) extended their research to Asian countries, examining the dynamic volatility linkages among crude oil, exchange rates, and equity markets. Utilizing the TPV-VAR connectedness approach, they incorporated interest rates and gold as safe-haven investments. Their findings indicate that interest rates and gold are the primary sources of volatility spillovers, significantly affecting each country’s exchange rates.

3. Methodology of the Study

3.1. EGARCH Model

The EGARCH (Exponential Generalized Autoregressive Conditional Heteroskedasticity) model is an advanced volatility model that builds on the GARCH Model by accounting for the log-variance. The model imposes no restrictions on the parameters. It was proposed by Nelson (1991) and is extensively used in finance to explain the influence of negative news on market volatility. The goal of this model is to model volatility clustering and asymmetry in financial time series. The mean equation is given by the following:
y t = μ + ϕ y t 1 + ϵ t , ϵ t N ( 0 , σ t 2 )
where y t ,   μ ,   ϕ , and ϵ t represent the return or time series value, constant mean, autoregressive coefficient, and innovation (error term), respectively.
The EGARCH(1,1) model is often written as follows:
l n ( σ t 2 ) = ω + β l n ( σ t 1 2 ) + α | ϵ t 1 | σ t 1 E | Z | + γ ϵ t 1 σ t 1
where ω denotes the baseline log variance, β indicates the persistence of volatility, α shows the magnitude effect (size of shocks), and γ represents the leverage effect (sign of shocks).
The selection of wavelet analysis is driven by three empirical features of commodity and financial markets. Financial time series are non-stationary, making traditional spectral methods inappropriate (Torrence & Compo, 1998). Time-varying correlations across investment horizons are especially important for diverse investors who operate at different frequencies. Structural changes during times of crisis make connections among stock markets, oil, gas, and exchange rates regime-dependent. In this study, we make use of Wavelet Coherence techniques to capture these multi-scale interactions, particularly when it comes to energy-financial market spillovers (Vacha & Barunik, 2012; Tiwari et al., 2016). As a result, the technique is used as a suitable framework for analyzing the changing dependence structure between macro-financial variables rather than just as a trendy tool.
The BRICS countries are resource-dependent or manufacturing-heavy emerging markets; the use of Wavelet Transform Coherence (WTC), Partial Wavelet Coherence (PWC), and Multiple Wavelet Coherence (MWC) is especially justified. These economies are particularly vulnerable to the triad of volatility in the equities market, currency movements, and energy shocks.

3.2. Wavelet Method

Wavelet methodology is more effective than traditional approaches for analyzing complex, transient, or non-stationary events because it can zoom in on local aspects of a signal while maintaining a broad view of the overall trend. The wavelet is a critical method for processing and analyzing high-frequency data, effectively handling time series. It works with an actual dataset that reveals patterns, volatility clustering, and sudden shifts that occur at various points in time. The wavelet method is particularly advantageous for handling volatile variables, which can capture the frequency of occurrence at a given time within high-dimensional historical series. Wavelet Transforms convert between low- and high-frequency signals.

3.3. Continuous Wavelet

A time series can be decomposed into the time–frequency domain using the Continuous Wavelet Transform (CWT).
W x ( s , τ ) = + x t ψ t τ s d t
with the parameters s, τ , and ψ denoted, respectively, as the scale parameter, the time translation parameter, and the mother wavelet function (Torrence & Compo, 1998).
The Morlet Wavelet is very useful for identifying volatility cycles and oscillatory patterns prevalent in commodity and financial markets. It offers the best balance between temporal and frequency localization. The complex character of the Morlet wavelet, in contrast to the Haar or Daubechies wavelets, enables the signal to be broken down into amplitude and phase, which is essential for determining the phase-lead/lag connections needed for the Cross-Wavelet Transform (XWT) and Wavelet Transform Coherence (WTC) analysis.

3.4. The Cross-Wavelet Transform (XWT)

Grinsted et al. (2004) went over how to analyze correlations between two time series in time–frequency space using the XWT and Wavelet Coherence. They show how phase angle statistics can be applied to test mechanistic theories of the physical linkages between variables and to increase confidence in causal connections. The XWT, given by WXY, measures the relationship between two assets, x(t) and y(t), and is calculated as the product of the first series’ Wavelet Transform (WX) and the complex conjugate (*) of the second series’ Wavelet Transform (WY*), noted by the following:
WXY = WXWY*
In comparison to the null hypotheses that the signal is produced by a stationary process with a specific background power spectrum ( p k ), the statistical importance of wavelet power can be evaluated. A first-order autoregressive (AR1) process is an excellent model for the characteristic red noise found in many geophysical time series. For an AR1 process with lag-1 autocorrelation, α, the Fourier power spectrum can be computed from the observed time series, as shown by Allen and Smith (1996).
P k = 1 α 2 | 1 α e 2 i r k | 2
With K as the index of the Fourier frequency, the XW Power is simply the magnitude of the XWT, given by |WXY|. This power indicates the intensity of the common power (or shared high variance) of the two assets in the timescale and frequency band. The complex argument (or angle), arg(WXY), reveals the local relative phase between x(t) and y(t), showing how the two series are temporally aligned at specific scales and times.
The mathematical formula for the expected distribution of this power, assuming background noise spectra, P k X and P k Y , is provided by Torrence and Compo (1998).
D W n X ( s ) W n Y ( s ) σ X σ Y < p = Z ν ( p ) V p k X p k Y
The square root of the product of P k X and P k Y distributions, thus, defines the probability density function. Z ν ( p ) is the confidence level corresponding to the probability, p, where v is equal to two for complex wavelets and one for real wavelets.

3.5. The Wavelet Transform Coherence (WTC)

The time-varying co-movement (lead–lag association) among stocks, Brent oil, and crude oil is examined using WTC. Furthermore, a related metric, the Adjusted Wavelet Coherence (WC) coefficient, is used to formally quantify these strong relationships, with its specific mathematical expression given by Torrence and Webster (1999).
R n 2 ( s ) = | S ( S 1 w n x y s ) | 2 S ( S 1 | w n x s | 2 ) · S ( S 1 | w n y ( s ) | 2 )
where S denotes the smoothing operator. In this case, it is helpful to consider the WC as a localized correlation coefficient in the time–frequency domain, as you can see from the close resemblance between this definition and a conventional correlation coefficient. The squared Wavelet Coherence coefficient, which indicates strong correlations when the coefficient is near 1 and no correlation when it is 0, is illustrated as follows ( 0 < R n 2 s < 1 ). Monte Carlo techniques are used in this study to analyze Wavelet Coherence.
The smoothing operator, S, is expressed as
S = S s c a l e ( S t i m e w n s )
where S s c a l e and S t i m e indicate, respectively, smoothing in S s c a l e and time along the wavelet-scale axis. Naturally, the smoothing operator should be designed to have a footprint that is comparable to that of the wavelet being utilized. Torrence and Webster (1998) provide an appropriate smoothing operator for the Morlet wavelet.
S t i m e | s = ( w n s c 1 t 2 2 s 2 ) | 2
S t i m e | s = ( w n s C 2 π 0.6 s ) | n
where the rectangle function is π , and the normalisation constants are C1 and C2. Torrence and Compo (1998) reported in their empirical research that the Morlet wavelet’s scale decorrelation length is 0.6.

3.6. The Multiple Wavelet Coherence (MWC)

While the MWC is an advanced method for predicting correlations among many variables, the WC methodology assumes that two variables are bivariate-connected. The coherence of many regressor factors on the criterion variable is of interest to the MWC technique, which is particularly prone to numerous relationships (Khan et al., 2023; Ng & Chan, 2012; Iqbal et al., 2020). The MWC expression is given for this study as follows:
R M 2 s t , o , F X = R 2 s t , o + R 2 s t , F X 2 R e [ R s t , o · R ( s t , F X ) · R ( F X , o ) ] 1 R 2 ( F X , o )
In an observed time-series, the formula that calculates the Squared Wavelet outcomes indicates the intensity of the wavelet power of the stock index influenced by the two forecasters, Brent/crude oil and the foreign currency at various times and frequencies.

3.7. The Partial Wavelet Coherence (PWC)

The PWC uses a wavelet method to quantify basic time-varying correlation. This process removes the influence of the third variable in the case of this study, the foreign exchange rate, while detecting WTC between two time series, the stock index and Brent or crude oil. (Khan et al., 2023; Mudiangombe & Mwamba, 2023; Mihanović et al., 2009) state that PWC is presented as the square of partial correlation below, once the foreign exchange rate influence has been removed.
R P 2 S t , o , F x = | R s t , o , F X R ( s t , o , F X ) | 2 | 1 R s t , o , F X | 2 · | 1 R ( F X , o ) | 2
where st, o, and FX represent, respectively, the stock index, oil (Brent or crude oil), and foreign currency.
The edge effect arising from the limited length of financial time series is a significant obstacle to wavelet analysis. To overcome this, they propose a Cone of Influence (COI) that identifies the regions of the wavelet spectrum where border effects become significant and may lead to inaccurate correlations. To maintain statistical integrity, any coherence found outside the COI is ignored in our empirical findings. To reduce wrap-around effects, we also apply zero-padding to the series before the transform.
The multivariate deconstruction of the relationship using Multiple Wavelet Coherence (MWC) and Partial Wavelet Coherence (PWC) is what makes this work innovative, not the relationship itself. Our PWC approach (Equation (10)) neutralizes the FX channel, whereas typical bivariate studies (WTC) cannot determine whether oil drives the stock index directly or indirectly, for instance, through the currency (BRL).
In conclusion, the BRICS financial markets are shaped by intricate, time-varying interconnections between commodity prices, exchange rates, and equity markets, thus justifying the joint application of WTC, PWC, and MWC. To capture these multiscale and multivariate connections, wavelet-based methods offer the appropriate econometric framework, providing insights that traditional time-domain models cannot.

4. Empirical Findings and Discussions

Data

Table A1 in Appendix A displays the data employed in this study. We use daily data from Thomson Reuters streams and cover the period 8 August 2005 to 30 October 2025 of the old BRICS nations, namely Brazil, Russia, India, China, and South Africa. The analysis focuses on the daily spot price of local currency against the United States dollar (USD). To address missing-variable challenges in the sample due to time-zone lags and holiday differences on the trading desk, this study uses the last-price-carried-forward method to handle missing daily observations and noise, given its cross-regional and cross-asset analysis. Moreover, this study uses a closing price across the sample.
The analysis is divided into three different investing horizons using the applied strategy: noise-trader activity is represented by the short-term (4–32 days), swing trading and cyclical adjustments are represented by the medium-term (32–128 days), and fundamental structural changes are represented by the long-term (above 128 days). We can determine if the oil-stock spillover is a short-term panic or a long-term shift in the equities risk premium. This multi-horizon interpretation offers useful information for dynamic portfolio rebalancing that conventional textbook applications ignore.
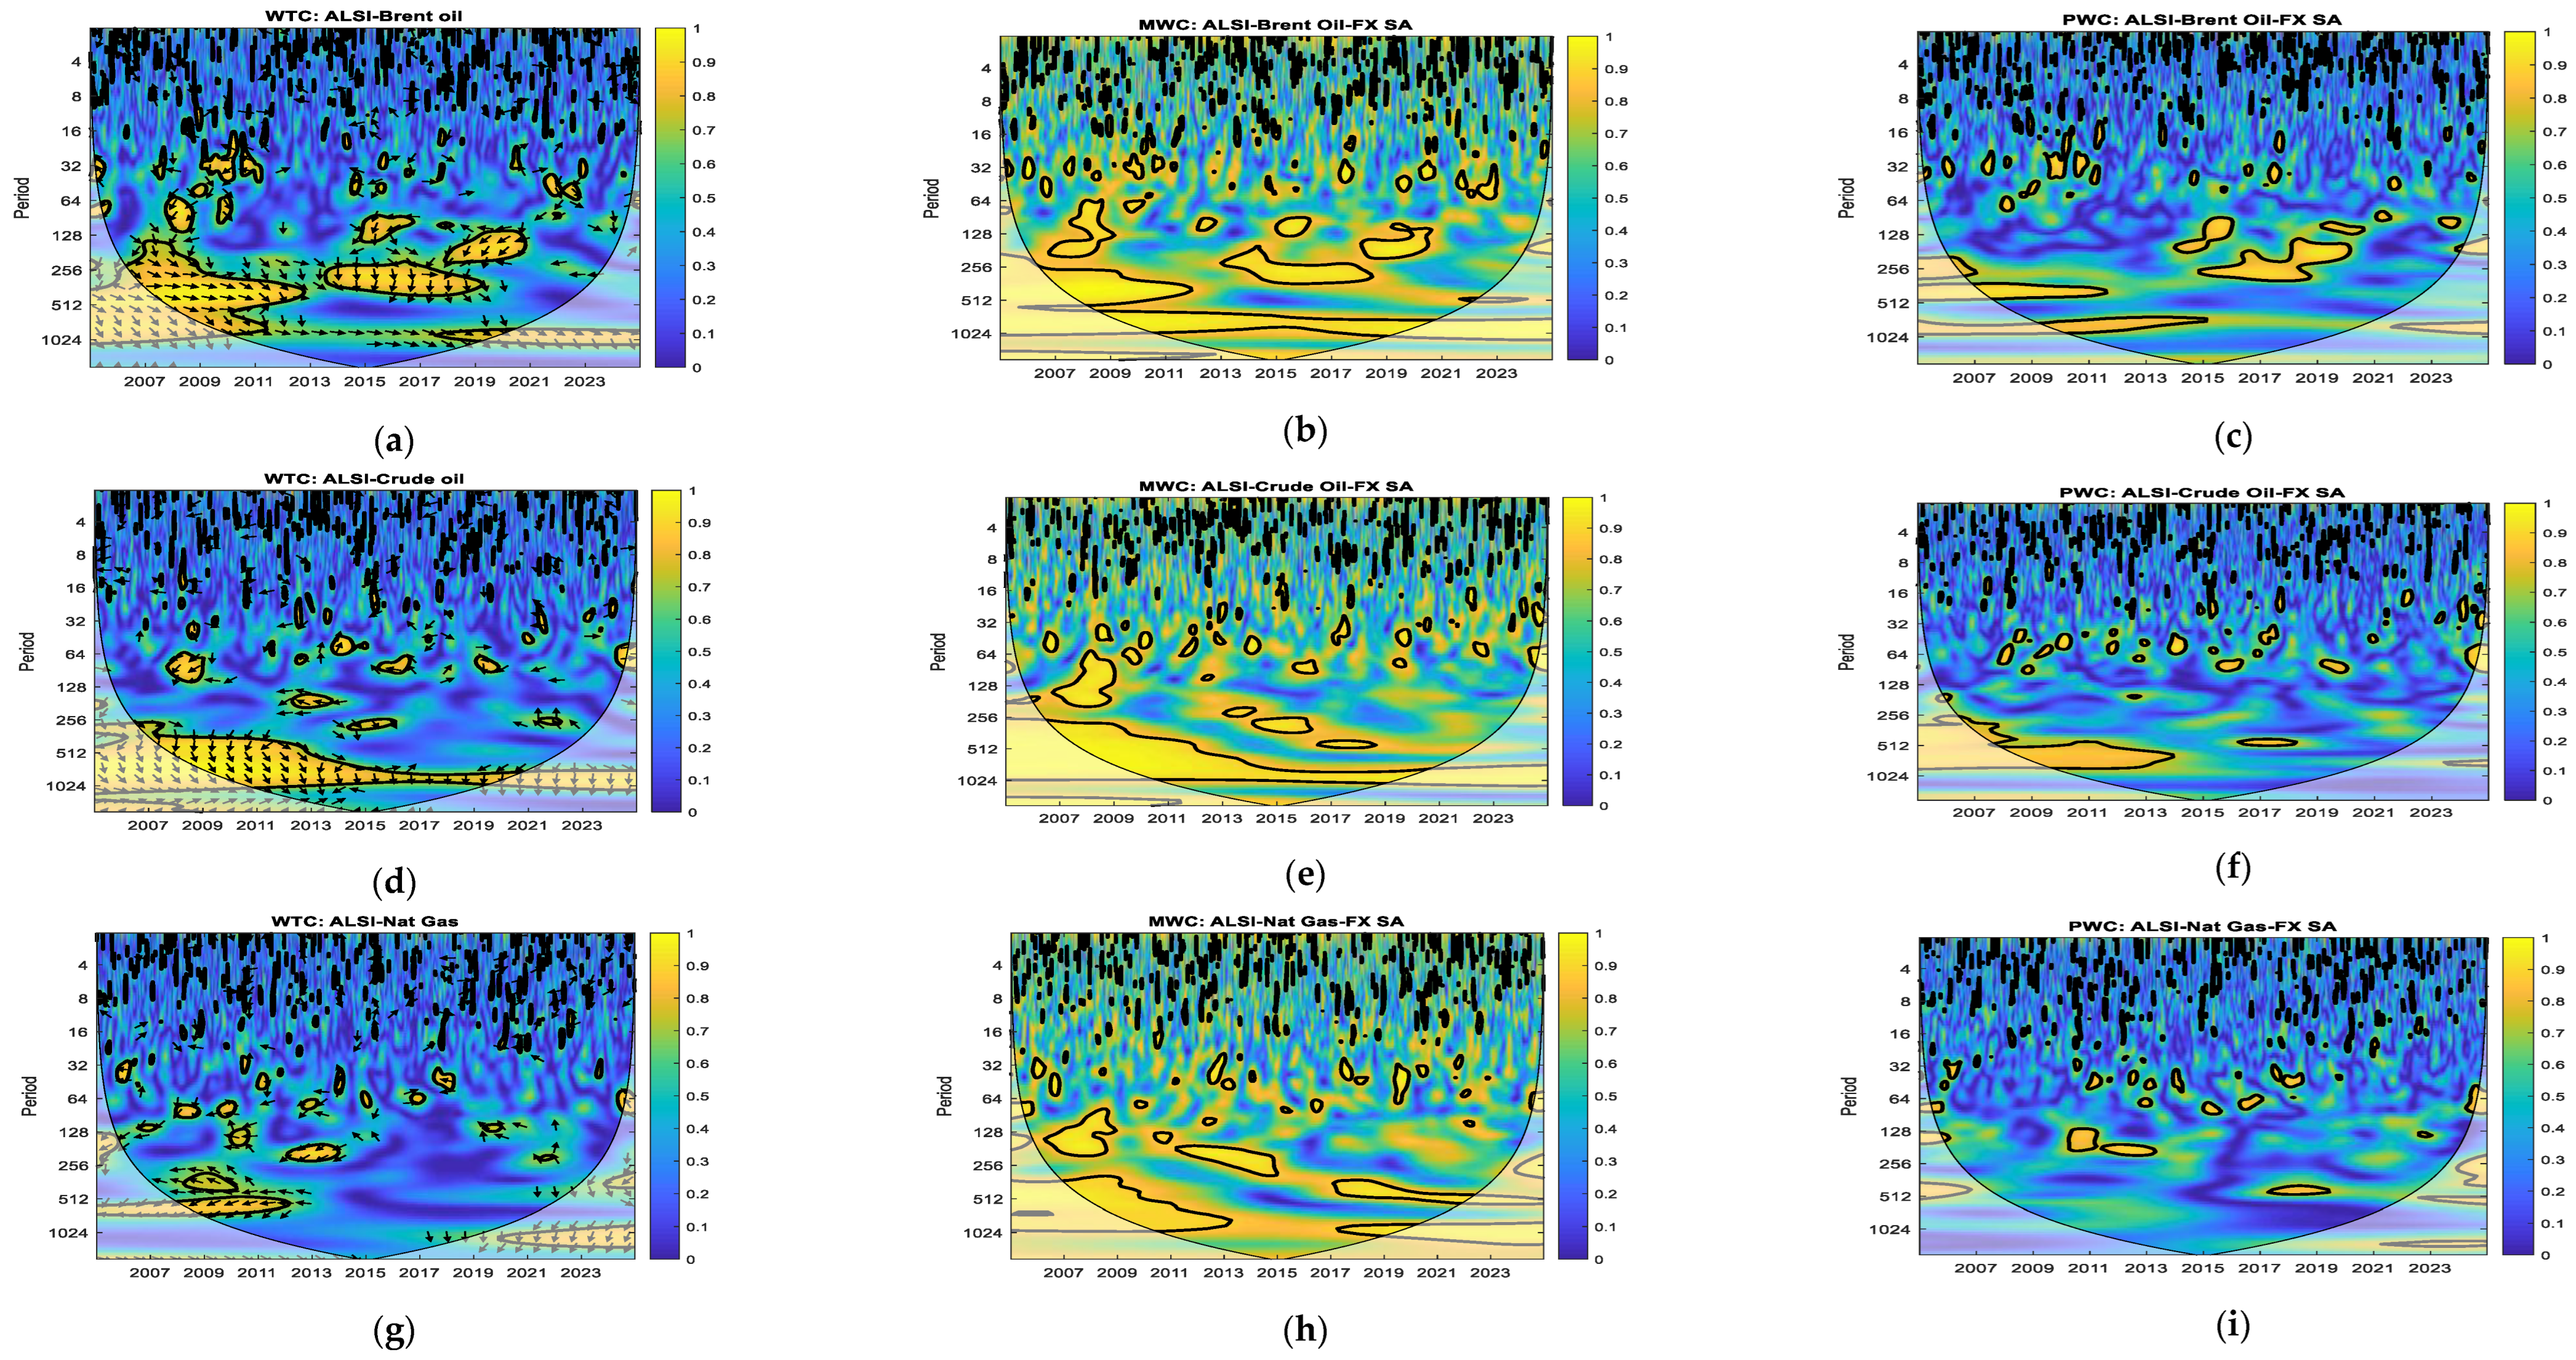
The arrows in Wavelet Transform Coherence (WTC) show lead–lag and cyclical relationships between the two assets. The arrows pointing right indicate in-phase relationship where the two assets move in the same direction. The arrows pointing left indicate anti-phase relations when the two assets move in opposite directions. The arrows pointing up-right indicate the second asset leading the first asset. Arrows pointing down-right indicate the first asset leading the second asset. Arrows pointing up-left indicate the second asset leading the first asset, and when the arrows are pointing down-left indicate the first asset leading the second asset. The interpretation of Partial Wavelet Coherence (PWC) is the same as that of MWC; however, the FX influence has been cancelled out. The initial association was erroneous and was solely influenced by the currency, as the red or yellow areas vanished compared to the MWC. Pay attention only to the color’s intensity (red or yellow indicates strong coherence). It provides the total explanatory power of several predictors.
Table 1 indicates that the average returns for each variable during the specified period were 0.0310 for Bovespa and 0.0377 for ALSI, suggesting that both stock indices experienced modest positive average returns. In contrast, natural gas and crude oil, with average returns of −0.0170 and −0.0365, respectively, reported negative means, highlighting overall losses during the same timeframe. Since these are financial returns, the series means are close to zero; this is normal, as financial return time series tend to be mean reverting, usually around zero. Volatility, or the degree to which values deviate from the mean, was evaluated. Greater variability equals higher risk, and a higher standard deviation indicates that crude oil prices are highly volatile, as evidenced by a crude oil standard deviation of 3.9283. The Chinese exchange rate is relatively stable, as indicated by FX_CHIN’s extremely low volatility of 0.1936.
In general, exchange rates and stock indexes are less volatile than oil markets. The asymmetry distribution can be quantified. A long right tail (more large positive returns) implies positive skewness. A long-left tail (more significant negative returns) is a result of negative skewness. MOEX (−1.9408) and Brent oil (−0.7170) are negatively skewed, meaning there are more significant losses than gains. FX_SA (0.9306) and NAT_GAS (0.3120) are positively biased and occasionally show significant positive returns. Negative skewness is undesirable in finance because it suggests the possibility of significant downside shocks. The tail heaviness of the distribution can be quantified. The normal distribution Kurtosis is equal to 3. Leptokurtic (fat tails implying more severe motions) kurtosis > 3. Every kurtosis value, from ~7.6 to 60.8, is extremely high. This suggests severe volatility, thick tails, and occasional large shocks, which are common in financial returns. The use of skewness and kurtosis to determine if a series is normally distributed. Null hypothesis (H0): The distribution of the series is normally distributed. The series is not normally distributed (H1). The null hypothesis is rejected when all Prob = 0.0000. Therefore, none of these series is normally distributed.
Financial returns frequently exhibit this non-normality (fat tails and asymmetry), which supports volatility clustering and the occurrence of extreme events. This indicates that the returns are appropriate for additional modeling (e.g., Wavelet Coherence analysis). The Augmented Dickey–Fuller (ADF) test indicates that all variables are stationary, as the p-values are less than 0.05 for the energy commodity, stock, and currency markets.
Table 2 and Table A2 in Appendix A exhibit the results of the EGARCH for BRICS countries. The EGARCH findings consistently indicate high persistence and strong volatility clustering, as evidenced by the proximity of the β coefficients to unity (≈0.98–0.996). The result reflects the longevity of volatility shocks, which confirms that uncertainty and persistence characterize financial (stock and forex), as well as energy, markets.
The leverage effect is present across all five countries, as the asymmetry parameter, γ, is significant for almost all assets, reflecting greater sensitivity to negative shocks (bad news). It means that BRICS markets are rather fragile in the face of adverse events in global and domestic environments, especially in the forex and crude oil markets.
The ARCH effects are significant across all examined markets, reflecting a rapid response in volatility to information incorporation. On the other hand, ARCH-LM tests remain insignificant, indicating an effective model fit for conditional heteroskedasticity. This result evidenced the use of the Wavelet approach.
Concerning the shock spillover (θ), heterogeneous yet organized patterns emerge in the presence of positive spillovers in stock markets, indicating shock amplification. Negative spillovers in forex and energy markets indicate shock dampening, and spillovers are stronger between FX and commodities and within energy markets, showing interdependence generated by global commodity cycles.
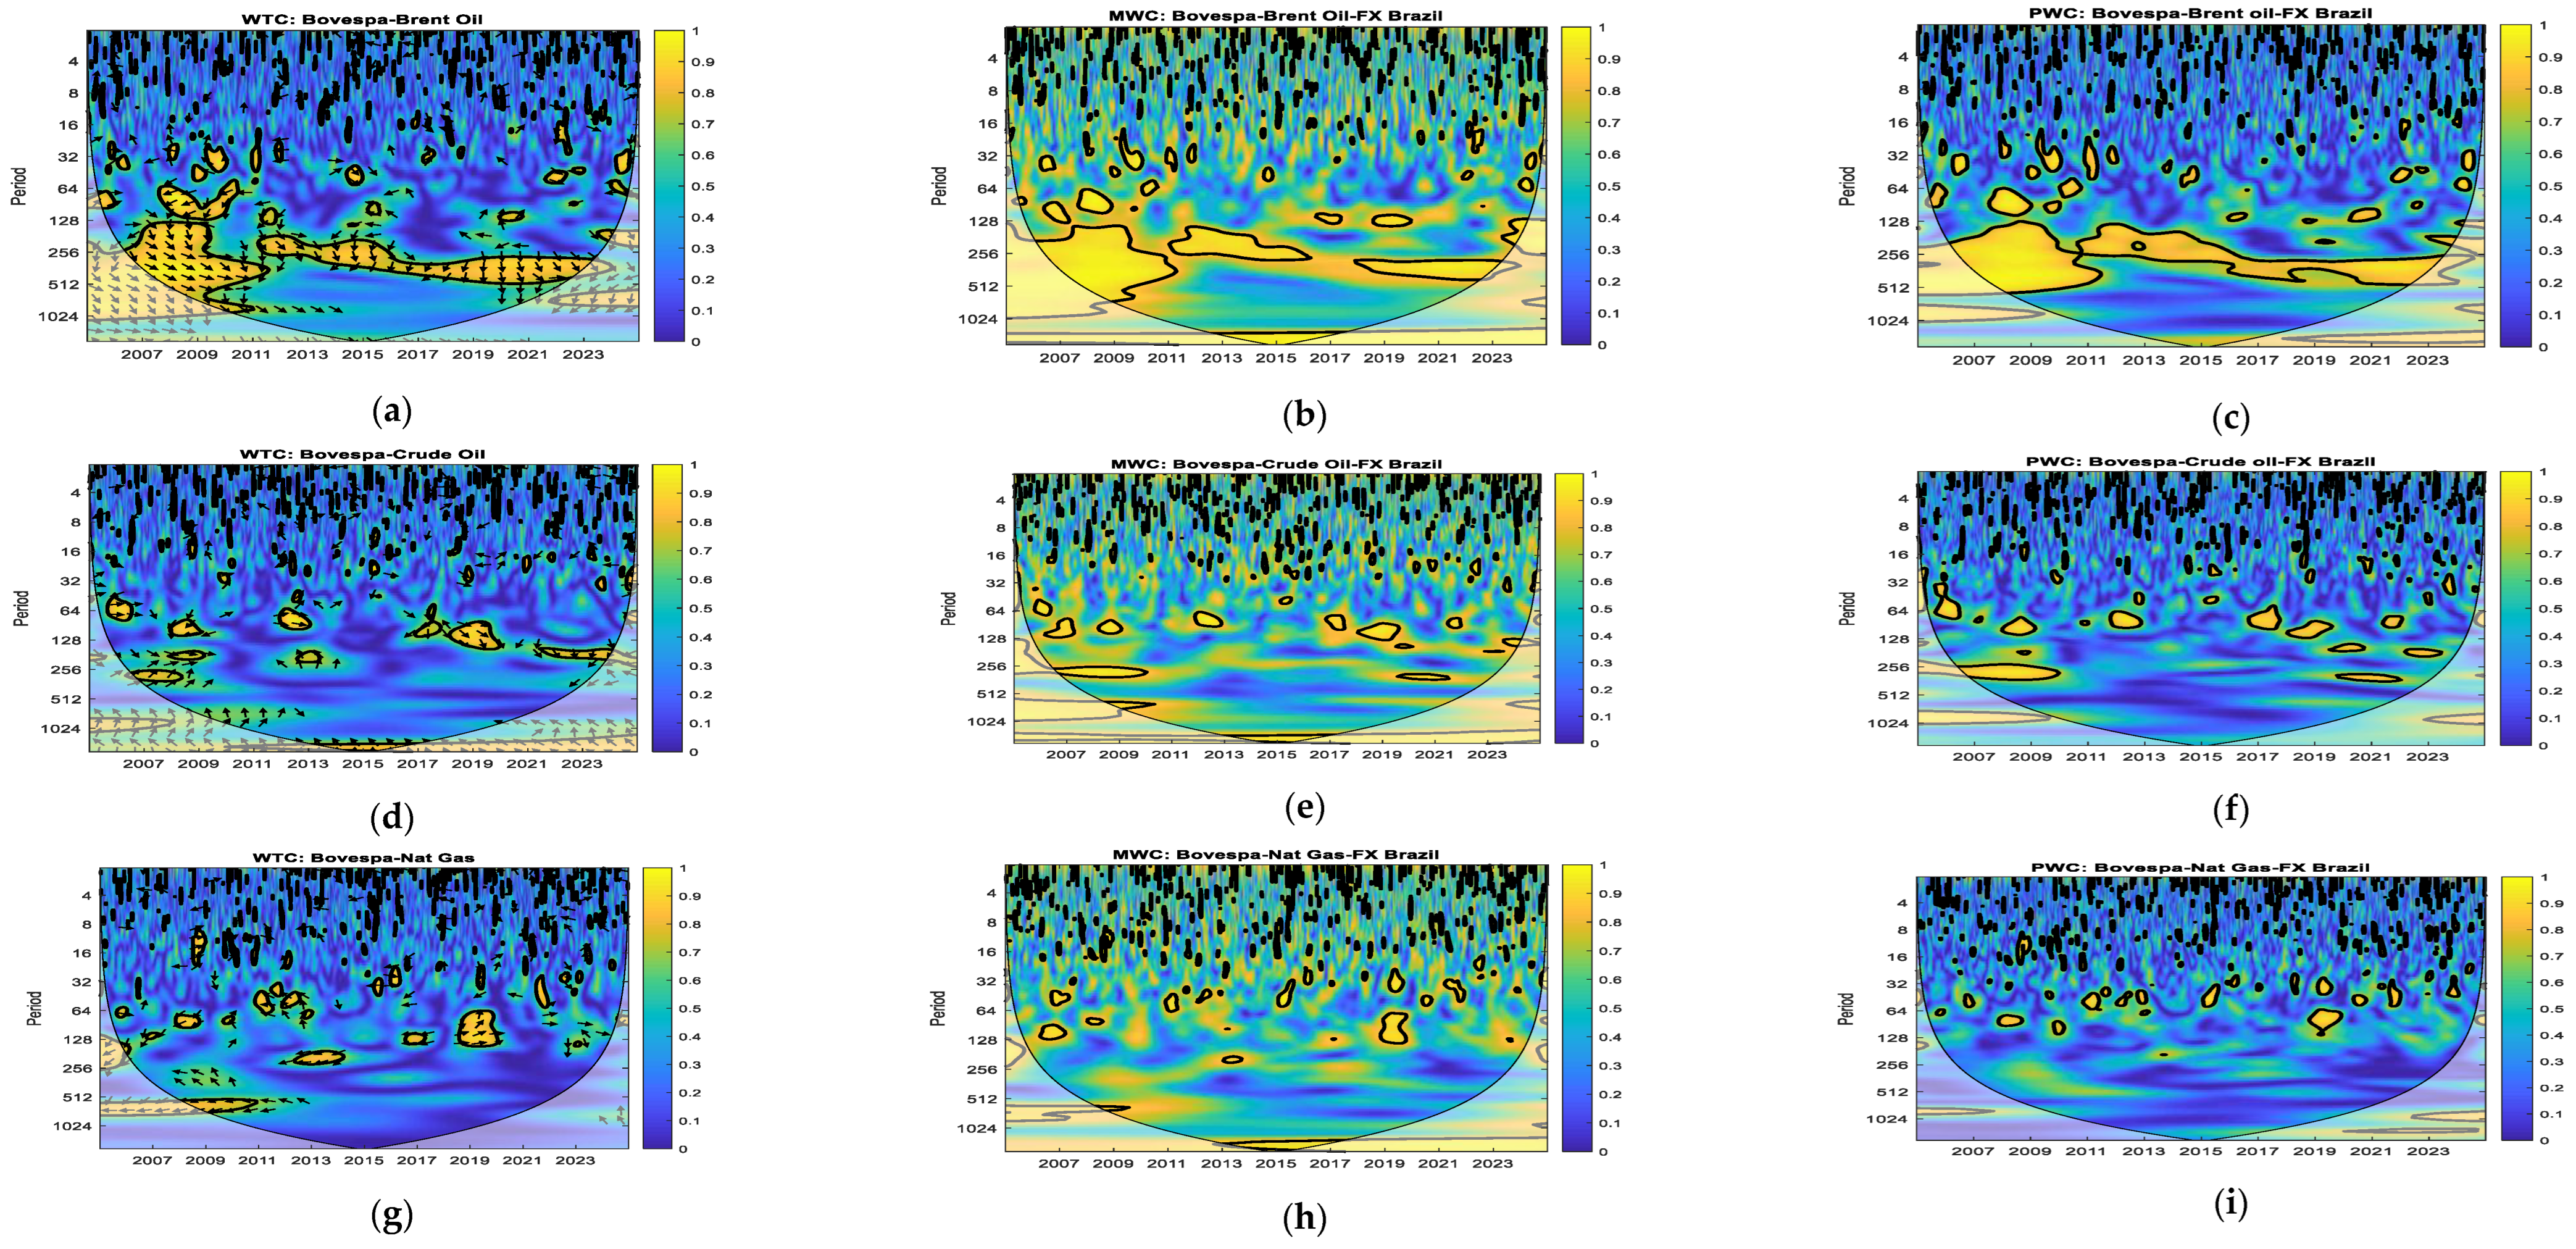
The Wavelet Coherence results (Figure 1a–f) show a strong yet time-varying coupling between the Brazilian Bovespa index and oil prices (Brent and crude), primarily during medium-frequency cycles (32–256 days). This result is interpreted through the earnings and cost channels that affect corporate profitability. Indeed, WTC analysis (Figure 1a,d) shows varying lead–lag relationships, with oil leading stocks during crisis episodes such as the 2008–2009 global financial crisis. On the contrary, the Bovespa index leads oil markets during non-crisis periods (for instance, 2012 and 2019–2020), showing the foresight characteristic of stock markets again. This in-phase relationship shows that high oil prices positively affect stock market performance, given Brazil’s commodity-exporting structure and oil-dominated sector. Furthermore, MWC analysis (Figure 1b,e) shows that the inclusion of the exchange rate increases coherence at the medium/long horizon range (128–1024 days), while PWC analysis (Figure 1c,f) reveals once more that the foreign exchange rate is a major channel for spillovers in relation to Brent oil price and long-term crude oil price dynamics.
In contrast, the correlation between Bovespa and natural gas (Figure 1g–i) appears to be less pronounced and structurally dissimilar. The WTC model (Figure 1g) suggests an inverse relationship between the two indices over the longer horizon (512–1024 days), suggesting the possible presence of diversification effects, but coherence remains ambiguous in the short- and intermediate-time windows. The inclusion of the exchange rate in the MWC model (Figure 1h) and the PWC model (Figure 1i) implies that FX is insignificant in explaining the medium-term dependence, whereas it becomes increasingly significant in explaining the long-term dependence.
In summary, this study finds that the Brazilian economy is highly dependent on commodities, whereby oil emerges as the driver of stock market performance and an important source of systemic risk in major crises, such as the global financial crisis, oil price crash (2014–2016), and the COVID-19 outbreak, with natural gas serving partially as a hedge asset.
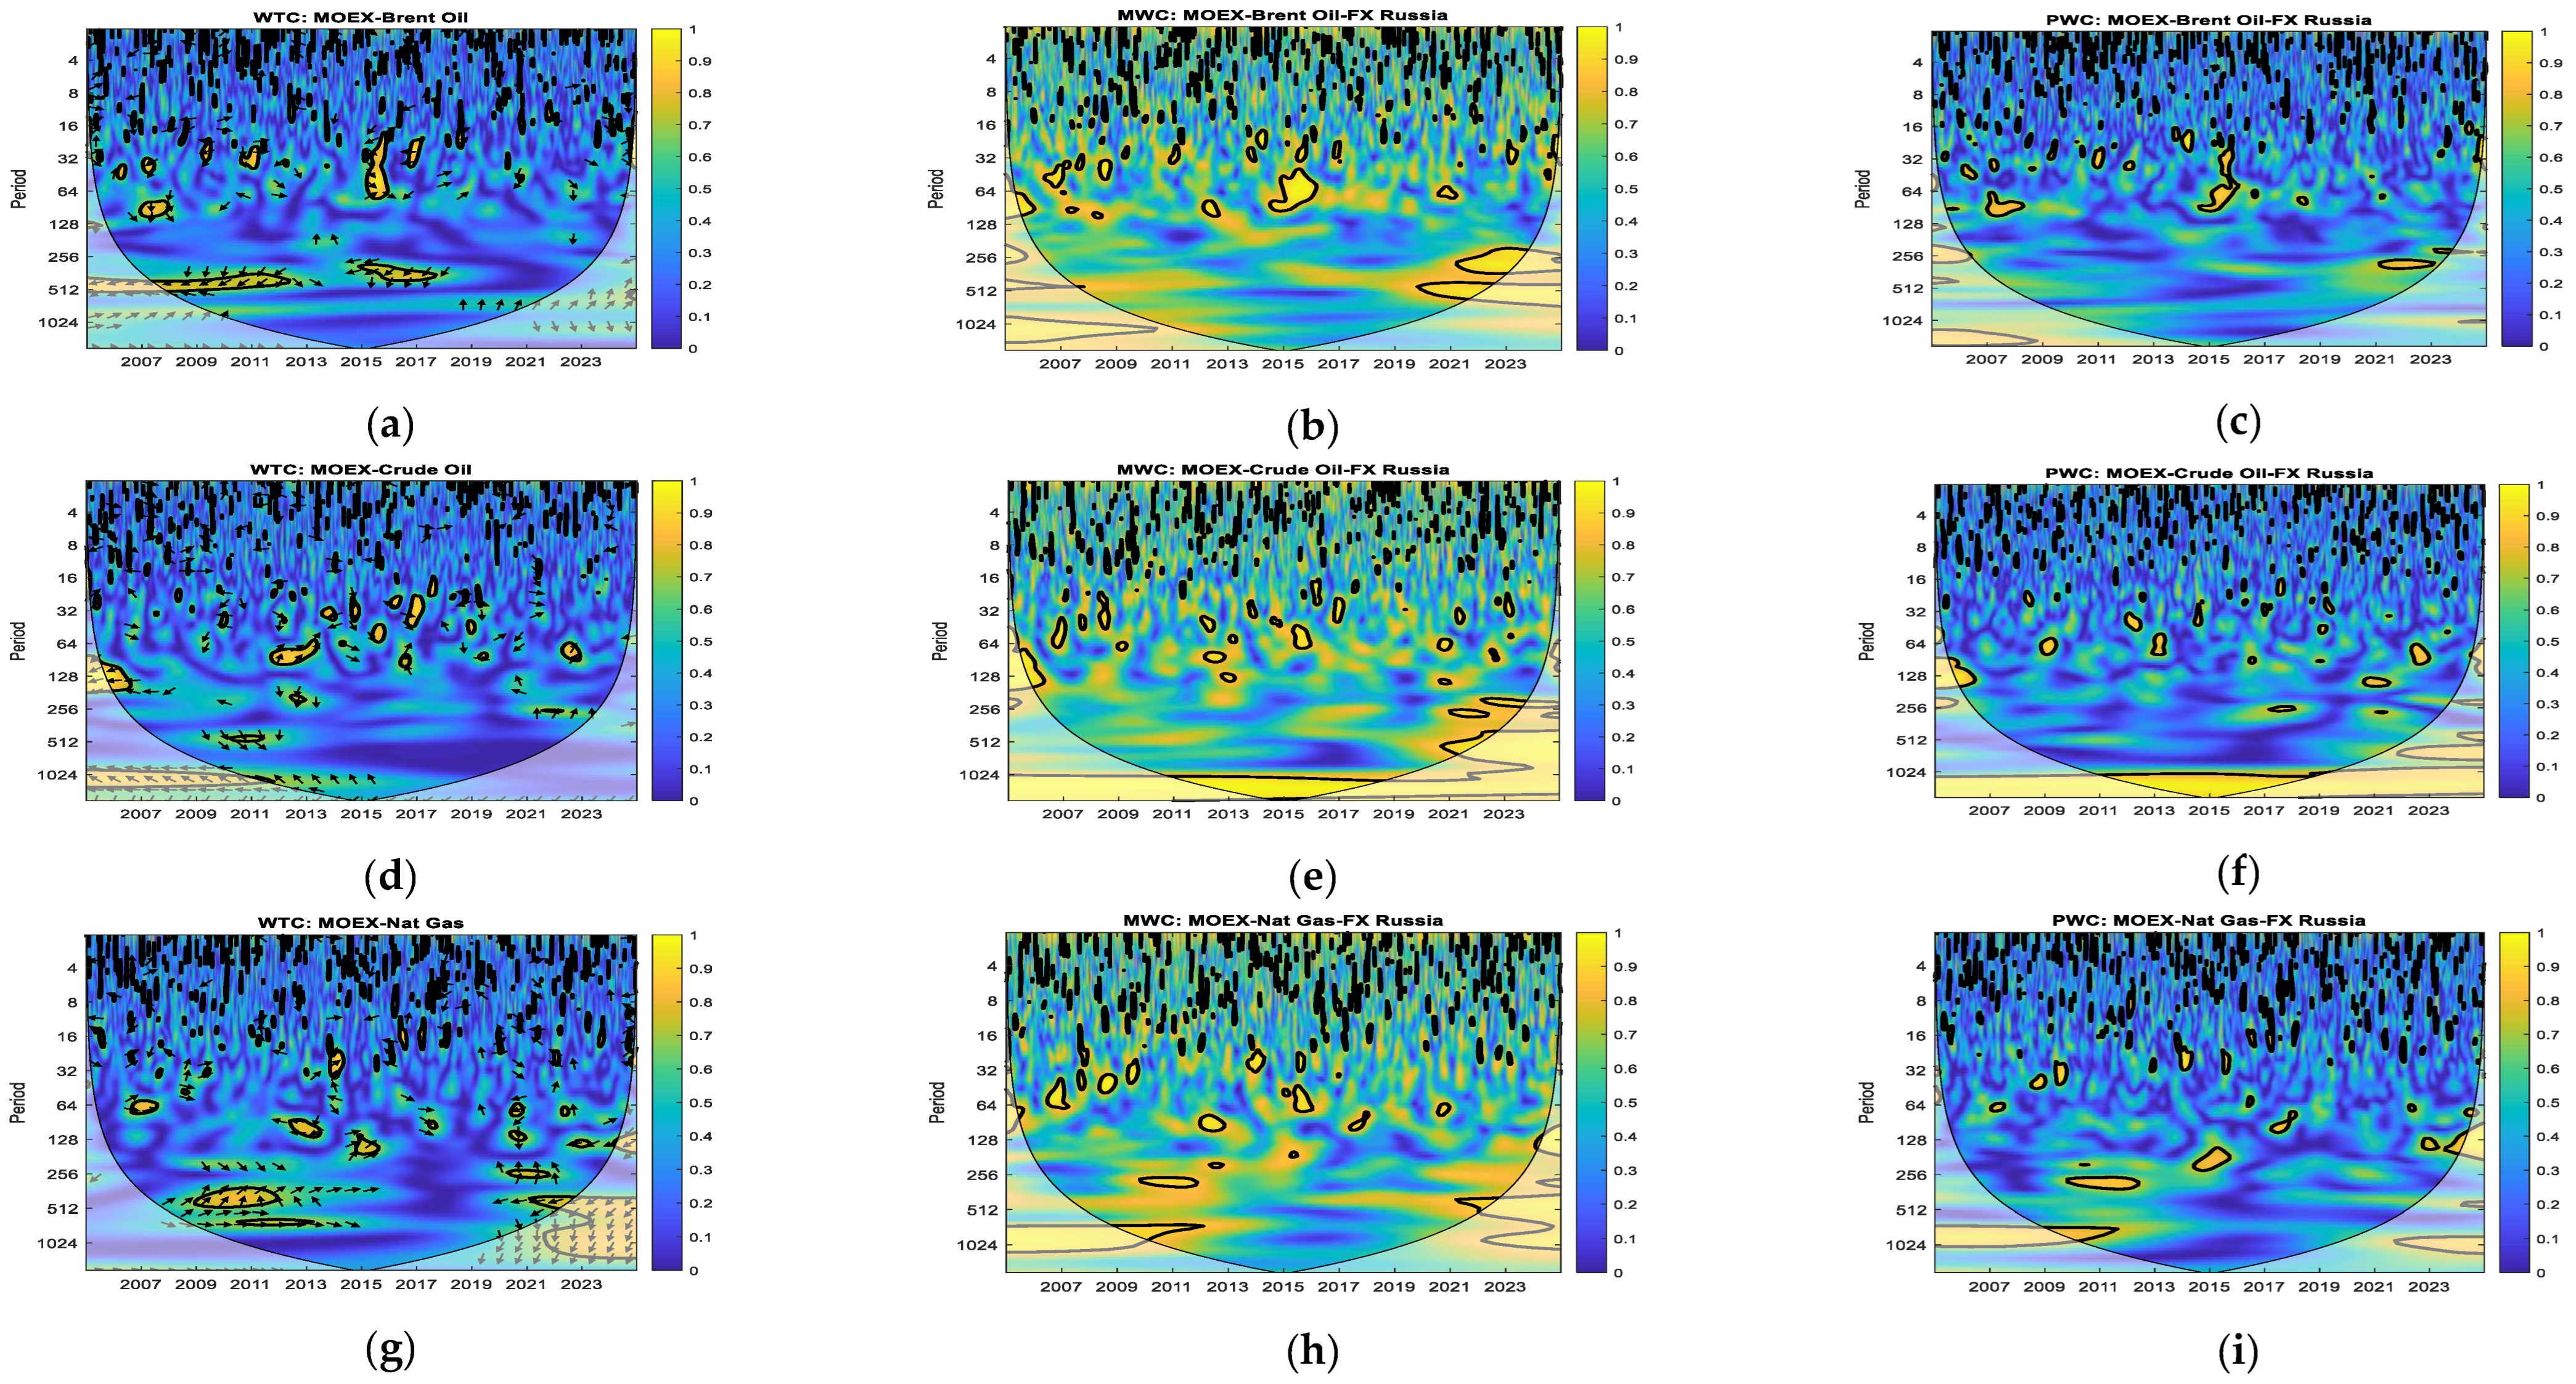
As can be seen from Wavelet Coherence analysis for Russia (Figure 2a–f), there is an intense time-dependent relationship between the MOEX index and oil prices (Brent and crude), with the latter mostly dominating stock prices and playing a major role in determining their behavior, especially under conditions of economic distress. According to the results of WTC analysis (Figure 2a–d), Brent and crude oil overtake the stock market at medium frequencies (32–128 days) for several critical periods, including 2007–2008, 2008–2012, 2015–2017, and 2020, indicating the predominance of the energy sector in forming equity returns. In turn, this tendency manifests itself most clearly during periods of crisis (for example, global financial crises and the COVID-19 pandemic), as indicated by the high coherence, which shows systemic contagion and makes the stock market react mostly as a derivative of oil prices. In addition, the findings from the MWC tests (Figure 2b–e) reveal that accounting for the exchange rate improves coherence, especially on short- and medium-term time horizons, whereas the findings from the PWC tests (Figure 2c–f) point to a notable decline in coherence when the FX variable is stripped out, which is consistent with the notion that FX, specifically the ruble, is a crucial channel through which transmission takes place, owing to capital movements and FX risk pricing. Nonetheless, oil-stock co-movement is not affected in the long run (512–1024 days).
On the other hand, the relation between MOEX and natural gas (Figure 2g–i) is not only less significant but also more inconsistent and frequency-specific. First, from Figure 2g, which shows the results of the WTC analysis, the stock market and natural gas demonstrate intermittent leading roles in the short-, medium-, and long-run perspectives, without any systematic dominance characteristic of oil. Secondly, adding the exchange rate to the framework of MWC analysis (see Figure 2h) allows us to conclude that FX plays a major role in increasing mutual dependencies at medium-range frequencies (32–128 days) and especially during high-stress periods on the market, whereas at some long-run frequencies (e.g., 2009–2011), this effect declines. The same conclusion about the impact of FX is drawn from the PWC analysis results shown in Figure 2i, where one may observe that in short-to-medium-term bands, the elimination of the exchange rate considerably decreases coherence levels, indicating its importance for gas-equity interactions, whereas long-term coherence proves the existence of some inherent relations irrespective of currency.
Overall, the results confirm the Russian economy’s extreme oil dependency, with FX as a vital transmission mechanism, while natural gas plays a subsidiary role.
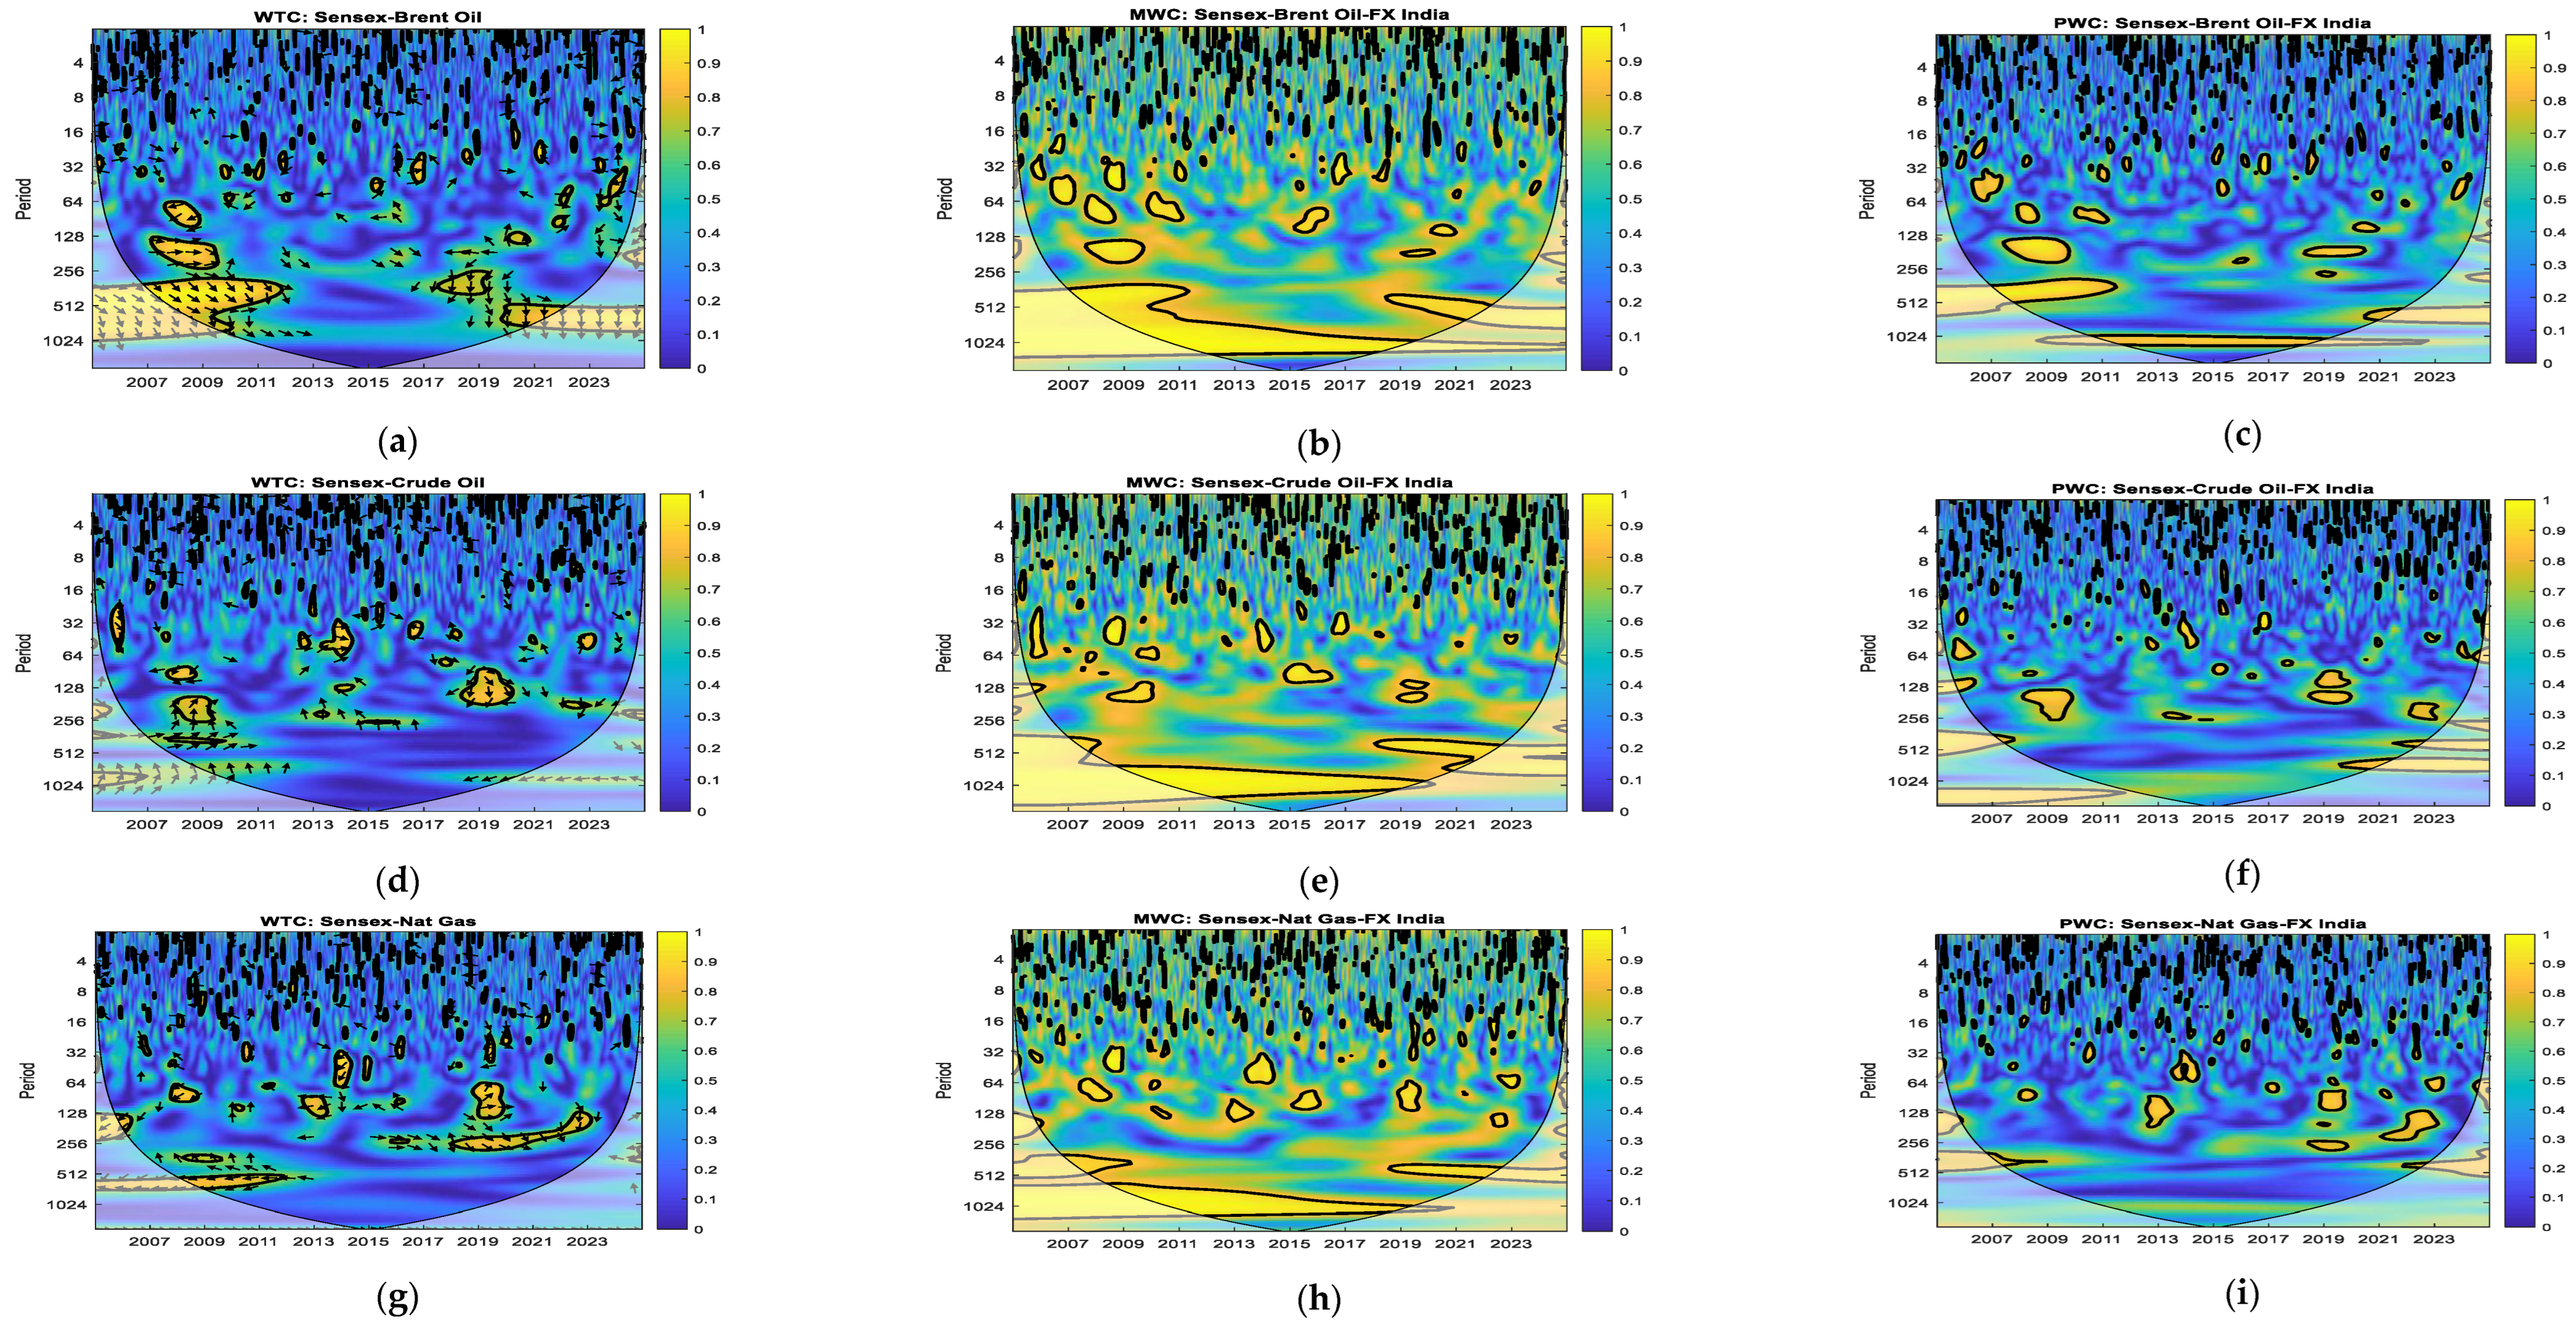
The Wavelet Coherence analysis for India (Figure 3a–f) indicates significant dependence between the stock market (Sensex) and oil markets (Brent and crude oil), mainly because India is a net oil importer. It is evident from the WTC analysis presented in Figure 3a,d show that oil precedes the stock market at medium frequencies (32–256 days). These precedents occur, for instance, during financial crises, such as 2008–2009 and, relatively recently, 2018–2020. The relationship during the mentioned timeframes follows an in-phase pattern, indicating co-movement. For oil-exporting countries, rising oil prices boost equity returns through higher exports and currency appreciation, while for net oil-importing countries like India, they reduce equity returns for the same reasons. As seen in the MWC analyses in Figure 3b,e, coherence improves when the exchange rate is included, particularly at shorter frequencies (32–128 days) for Brent oil and at medium-to-long frequencies for crude oil; however, coherence is reduced when the FX is dropped, as seen in Figure 3c,f. This is indicative of the influence of rupee-US dollar dynamics, in which rising oil prices generally lead to currency devaluation, worsening its effects on equities. Over the long term, especially for crude oil, FX emerges as the more important determinant of dependence.
In contrast, the connection between the Sensex index and natural gas (Figure 3g–i) turns out to be much less intense and consistent, and no clear lead–lag effects are identified using WTC analysis (Figure 3g). Although there exist several periods during which the natural gas is found to lead the stock market, the general connection remains rather weak, illustrating low integration of natural gas in Indian financial markets. The introduction of exchange rates into the MWC framework, however, reveals considerable medium-term coherence in this case (Figure 3h), thereby confirming that FX influences the interdependence between natural gas prices and equity indices. This result is corroborated by the PWC analysis (Figure 3i), which shows that the decrease in coherence following the exclusion of the FX variable demonstrates the latter’s crucial importance for medium-to-long-term connections.
As shown by the results, India’s financial system remains highly influenced by external factors, with oil shocks affecting equities through inflation and currency effects, while natural gas’s connection to equities is mostly driven by exchange rate dynamics.
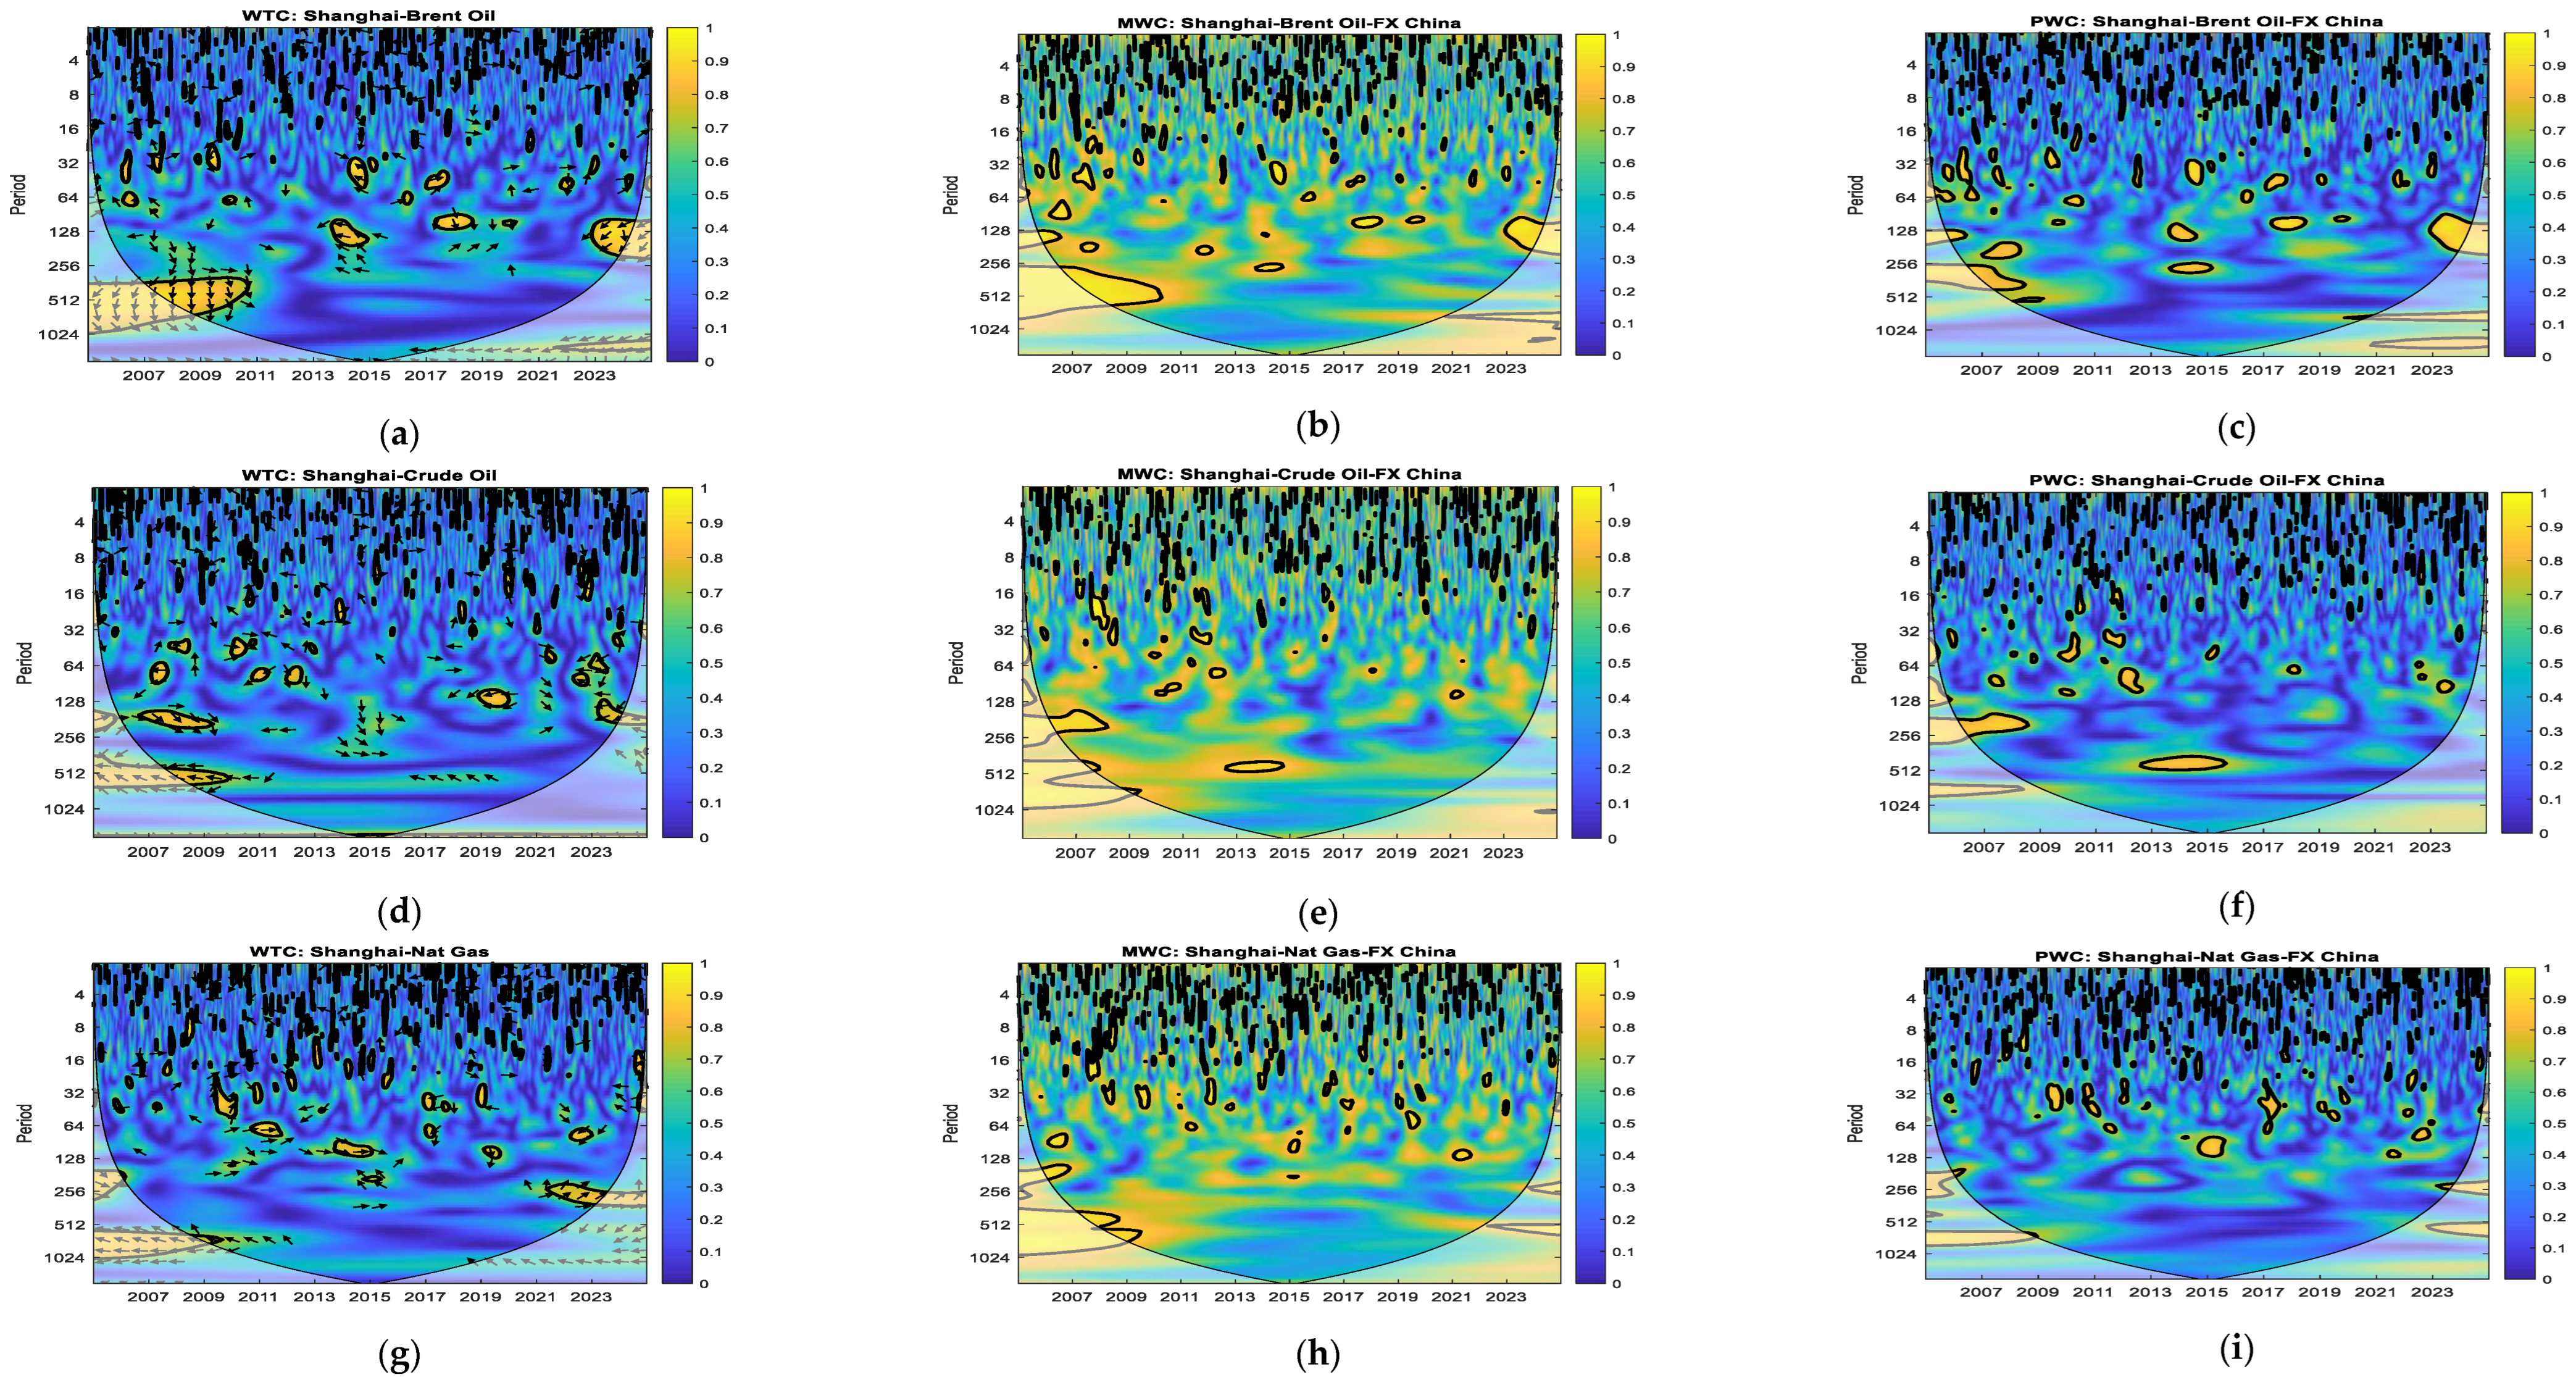
From the Wavelet Coherence analysis of China (Figure 4a–f), it is evident that there is an intermittent, dynamic link between the stock market and oil markets (Brent and crude oil) due to China’s diversified economic structure and a policy-regulated market environment. For instance, the WTC analysis presented in Figure 4a,d reveals the periods where the Shanghai Stock Index is leading in relation to Brent oil at medium-term scales (32–128 days) between 2014 and 2018, whereas oil leads the Shanghai Stock Index in selected times (such as 2022–2023 and 2009–2010). Generally, coherence is intermittent and weak, especially during the global financial crisis, since the transmission process has been interrupted by internal policies implemented by the Chinese government. However, the oil-price crash of 2014–2016 and the pandemic of 2020 display short-term synchronization, which means that the connection weakens as the period extends, implying a partial effect of changes in oil prices on Chinese stocks. The introduction of the exchange rate into MWC (Figure 4b,e) shows a significant effect on coherence levels, especially during crises, but the PWC (Figure 4c,f) confirms the absence of substantial differences in interdependence after excluding the FX factor. Instead, the oil-to-stock linkages appear to be influenced primarily by global demand conditions and the effects of domestic macroeconomic policies, rather than by foreign currency factors.
Conversely, the interaction between the Shanghai index and natural gas (Figure 4g–i) demonstrates moderate interdependence without directional leadership at various time frames, including coherence at shorter and intermediate time intervals and without any leading effect in the long run (up to 256 and 512 days). Based on the WTC analysis (Figure 4g), there were in-phase correlations and leading behavior of the Shanghai stock market in the long run, suggesting that stock movements can be interpreted through forecasts of future energy consumption and economic activity. According to the MWC results (Figure 4h), there is interdependence across time frames, and the PWC analysis (Figure 4i) reveals a small decline in coherence when FX effects are controlled.
Generally, the results show that China’s financial market is not directly influenced by commodity prices abroad, as the energy–stock connection is mainly based on domestic forecasts of demand growth and economic activity rather than on international channels of transmission.
Wavelet Coherence for South Africa (Figure 5a–f) reveals moderately strong, but economically induced interdependence of the ALSI and oil markets (Brent and crude oil). It is caused by South Africa being a net oil importer and by its equity market being resource-based. As shown by the WTC analysis (Figure 5a,d), there is a time-varying lead–lag relationship where oil leads the stock market during crisis periods (such as 2008, 2009–2010, and 2018–2020), which implies that growing oil prices negatively affect equities due to increased costs of imports and inflation. In some periods (such as 2010 and 2012–2015), however, the ALSI leads oil prices, and this lead is explained by the dominance of resource companies like Sasol (energy or mining firms), whose share prices reflect investor expectations of global growth and commodity demand. Anticipated demand boosts share prices, and a rise in the ALSI’s resource sector typically signals higher future commodity prices, especially crude oil. MWC shows (Figure 5b,e) that including the currency (in this case, Rand) substantially strengthens coherence, especially on medium-to-long-term scales (32–256 and 512–1024 days). Moreover, according to PWC (Figure 5c,f), removing FX results in a significant drop in coherence. This underscores the impact of currency volatility in amplifying oil shocks during financial stress, although the short-term dynamics are mostly driven by idiosyncratic and local factors.
Contrastingly, the ALSI-Natural Gas (Figure 5g–i) correlation is lower, heterogeneous, and predominantly exhibits inverse or switching patterns. The WTC analysis (Figure 5g) shows evidence of anti-correlation in both short- and long-run periods, along with the presence of some lead–lag dynamics, in which either market dominates depending on the timeframe analyzed. For the MWC analysis (Figure 5h), the inclusion of the exchange rate improves coherence in medium and long terms (32–256 days; 2008–2012). Conversely, the PWC analysis (Figure 5i) shows decreased coherence in the absence of FX, reinforcing the idea that the exchange rate drives gas-stock co-movement.
The conclusions point out that the South African economy is susceptible to commodity risks through its currency, with oil being the most influential commodity for the stock market, while natural gas appears to have a secondary, partially diversifying effect.
Table 3 presents a structured comparison of wavelet results for BRICS countries, outlining similarities and differences, and provides a short analytical interpretation. Wavelet Coherence analysis reveals common structural dynamics and heterogeneity in the co-movement among energy commodities, exchange rates, and stock markets across countries. Although all economies exhibit time–frequency-persistent co-movements, with exchange rates as an important transmission channel, the sign and intensity of these linkages differ considerably across economic structures. The oil-exporting economies (Brazil and Russia) exhibit strong positive co-movement driven by commodity revenues, but the oil-importers (India and South Africa) lose the synergy due to inflationary and currency-depreciation pressures. As for China, the pattern is more irregular and less homogeneous, owing to its own diverse economic structure. Taken together, these results emphasize the importance of country-specific determinants and investment horizons in understanding global financial interconnectedness.

5. Conclusions and Policy Implications

This research presents an extensive time–frequency analysis elucidating the interdependence among energy commodities (namely Brent, crude oil, and natural gas), foreign exchange rates, and stock market indices across the BRICS nations. The empirical results offer several crucial insights into the dynamics that control international financial markets in both periods of relative stability and severe crises. This descriptive statistic confirms the existence of fat tails and large volatility shocks by demonstrating that financial returns in these markets are non-normal, with strong skewness and kurtosis. The Wavelet Transform Coherence (WTC) and Partial Wavelet Coherence (PWC) analyses reveal a highly intricate, scale-dependent relationship.
A salient finding across all nations is that the foreign exchange rate serves as a principal conduit for the transmission of energy price shocks to equity markets. When currency influence is removed, the shift from Multiple Wavelet Coherence (MWC) to PWC consistently shows reduced coherence regions, especially in South Africa and Russia. Because of the significant influence of state-owned energy companies, the link is in-phase in Brazil and Russia, where increases in oil prices typically coincide with improvements in stock indexes. Conversely, in net importing nations such as India and South Africa, surges in oil prices frequently precipitate declines in equity markets, primarily through mechanisms of currency devaluation and inflationary pressures. Market leadership is inherently dynamic; while oil frequently dictates stock indices during global crises (e.g., the 2008 Global Financial Crisis), equity markets (notably in China and Brazil) occasionally pre-empt oil prices during recovery phases, reflecting anticipated demand and future economic activities.
The implications of this study provide critical guidance for policymakers, central bankers, and international investors. Central banks, especially those in South Africa and India, need to recognize that controlling inflation and maintaining currency stability are intrinsically related to changes in energy prices. Monetary actions targeted at stabilizing the home currency can serve as a mitigating buffer against the detrimental impacts of global oil price volatility on the local stock market, since the exchange rate is a key factor in determining the degree of dependence. For nations such as Russia and Brazil, where stock indices (MOEX/Bovespa) are highly sensitive to Brent oil, there is a pronounced need for structural economic diversification. Regulatory bodies should promote the expansion of non-resource sectors (such as technology and services) to diminish the hyper-coupling of the national index with global commodity cycles, thereby safeguarding domestic investors from downturns instigated by energy fluctuations. Investors and portfolio managers ought to eschew uniform hedging strategies, as the coherence between oil and stocks varies across short-term (8–32 days) and long-term (256–1024 days) scales, necessitating a frequency-dependent approach to hedging. Active hedging through the utilization of oil futures and currency derivatives is imperative to mitigate systemic risk. Natural gas’s significant impact on the Sensex and Shanghai indices highlights the growing importance of transition fuels. Governments should expedite the development of domestic renewable energy sources and strategic petroleum reserves to reduce reliance on the USD-denominated energy market, which presently exposes their equity markets to both commodity and currency shocks.
During oil upswings, Brazil showed overweight energy-linked shares; we used medium-to-long-term co-movement to follow trends. Risk management hedges BRL/USD exposure; currency strengthens oil-stock connections. Russian investors treated stocks as leveraged oil exposure and aligned their portfolios with oil price cycles across all time horizons. Risk management prioritizes dual hedging (oil + FX/RUB), as both are primary transmission routes. Indian investors are underweight equities amid rising oil prices; they prefer industries resistant to input cost shocks. Risk management involves hedging both currency depreciation (INR) and oil exposure. China invests in diversified, sector-rotating strategies rather than commodity-driven positioning. Risk management should shift away from oil hedging and move toward domestic macroeconomic and policy risks. South Africa invests during periods of oil shocks, decreases its equity exposure, and closely monitors sectors that are heavy in resources. The risk management strategy actively hedges against Rand volatility, which is the primary channel for spillover effects.

Author Contributions

Conceptualization, C.R.T.-D.; methodology, B.M.M.; software, B.M.M.; validation, C.R.T.-D.; formal analysis, B.M.M.; investigation, C.R.T.-D. and B.M.M.; resources, C.R.T.-D. and B.M.M.; data curation, C.R.T.-D.; writing—original draft preparation, C.R.T.-D. and B.M.M.; writing—review and editing, C.R.T.-D. and B.M.M.; visualization, C.R.T.-D. and B.M.M.; project administration, C.R.T.-D. All authors have read and agreed to the published version of the manuscript.

Funding

This research received no external funding.

Institutional Review Board Statement

Not applicable.

Informed Consent Statement

Not applicable.

Data Availability Statement

The original contributions presented in this study are included in the article. Further inquiries can be directed at the corresponding author.

Conflicts of Interest

The authors declared no potential conflicts of interest with respect to the research, authorship, and publication of this article.

Appendix A

Table A1. List of variables and sources employed.
VariablesNameCountryAcronymClassSources
Crude oilCrude Oil WTI FuturesInternationalCr OilEnergy Commodity Thomson Reuters Eikon
https://www.uj.ac.za/library-database/thomson-reuters-eikon/ (accessed on 10 November 2025)
Brent OilBrent Crude Oil FuturesInternationalBr OilEnergy Commodity
Natural gasNatural GasInternationalNGasEnergy Commodity
ALSIJSE All shares indexSouth AfricaStockEquity priceThomson Reuters Eikon
https://eikon.refinitiv.com/ (accessed on 10 November 2025)
BOVESPAIBOVESPA indexBrazilStockEquity price
SENSEXBSE SENSEXIndiaStockEquity price
MOEXMOEX Russia indexRussiaStockEquity price
SHANGHAISHANGHAI Composite indexChinaStockEquity price
ZARSpot ZAR/USD (Rand)South AfricaFxForeign exchange rateThomson Reuters Eikon
https://eikon.refinitiv.com/ (accessed on 10 November 2025)
BRLSpot BRL/USD (Brazilian Real)BrazilFxForeign exchange rate
INRSpot INR/USD (Indian Rupee)IndiaFxForeign exchange rate
RUBSpot RUB/USD (Russian Ruble)RussiaFxForeign exchange rate
CNYSpot CNY/USD (Chinese Yuan)ChinaFxForeign exchange rate
Sources: Authors’ compilation.
Table A2. EGARCH estimate parameters.
India China SA
ParamstockFXBr-oilCr-oilNGASstockFXBr-oilCr-oilNGASstockFXBr-oilCr-oilNGAS
μ 0.0596 ***
(0.0127)
0.0036
(0.0034)
0.0207
(0.0256)
−0.0415
(0.0896)
−0.0237
(0.0351)
0.0485 ***
(0.0128)
−0.0021 ***
(0.0007)
0.0207
(0.0256)
−0.0415
(0.0896)
−0.0237
(0.0351)
0.0336 ***
(0.0116)
0.0157
(0.0126)
0.0207
(0.0267)
−0.1116 *
(0.0515)
−0.0236 *
(0.0100)
θ 0.0732 ***
(0.0134)
−0.0492 ***
(0.0157)
0.0134
(0.0138)
−0.0285 ***
(0.0139)
−0.0317 **
(0.0149)
0.0286 *
(0.0135)
−0.0676 ***
(0.0123)
0.0134
(0.0138)
−0.0285 **
(0.0139)
−0.0317 **
(0.0151)
0.0129 *
(0.0078)
−0.0237 *
(0.0141)
0.0134 *
(0.0601)
−0.0298 ***
(0.0123)
−0.0316 **
(0.0151)
ω 0.0008
(0.0023)
−0.0154 ***
(0.0049)
0.0134 ***
(0.0015)
0.0987 ***
(0.0035)
0.0234 **
(0.0016)
0.0044 ***
(0.0017)
−0.0126 ***
(0.0022)
0.0134 ***
(0.0015)
0.0987 ***
(0.0035)
0.0234 ***
(0.0016)
−0.0007
(0.0020)
−0.0016
(0.0012)
0.0134 ***
(0.0015)
0.0813 ***
(0.0028)
0.0234 ***
(0.0016)
α −0.0980 ***
(0.0097)
0.03578 ***
(0.0084)
−0.0528 ***
(0.0071)
−0.0927 ***
(0.0129)
0.0014 ***
(0.0028)
−0.0138 **
(0.0096)
−0.0341 ***
(0.0057)
−0.0528 ***
(0.0071)
−0.0927 ***
(0.0129)
0.0084 **
(0.0035)
−0.1154 ***
(0.0088)
0.0438 ***
(0.0073)
−0.0528 ***
(0.0071)
−0.1080 ***
(0.0122)
0.0114 ***
(0.0440)
β 0.9826 ***
(0.0009)
0.9926 ***
(0.0023)
0.9904 ***
(0.0000)
0.9785 ***
(0.0002)
0.9892 **
(0.0001)
0.9924 ***
(0.0002)
0.9959 ***
(0.0000)
0.9904 ***
(0.0000)
0.9785 ***
(0.0002)
0.9892 ***
(0.0001)
0.9825 ***
(0.0009)
0.9861 ***
(0.0009)
0.9903 ***
(0.0000)
0.9825 ***
(0.0000)
0.9892 ***
(0.0001)
γ −0.1695 ***
(0.0137)
−0.1664 ***
(0.0184)
−0.1177 ***
(0.0038)
−0.2424 ***
(0.006)
−0.1422 ***
(0.0068)
−0.1457 ***
(0.0040)
−0.1678 ***
(0.0131)
−0.1177 ***
(0.0038)
−0.2424 ***
(0.0060)
−0.1421 ***
(0.0022)
−0.1180 ***
(0.0122)
−0.0889 ***
(0.0113)
−0.1177 ***
(0.0038)
−0.2399 ***
(0.0134)
−0.1422 ***
(0.0068)
6.5629 ***
(0.5654)
4.5349 ***
(0.3088)
7.7118 ***
(0.7863)
3.6821 ***
(0.2014)
6.5596 ***
(0.5458)
4.62806 ***
(0.3159)
2.6688 ***
(0.1333)
7.7118 ***
(0.7863)
3.6819 ***
(0.2013)
6.5603 ***
(0.5460)
11.1593 ***
(1.5448)
12.5635 ***
(1.8372)
7.7121 ***
(0.7869)
4.0516 ***
(0.2320)
6.5596 ***
(0.5458)
ARCH(3)3.891
(0.5486)
2.2482
(0.6184)
1.1817
(0.1366)
2.1694
(0.7072)
2.759
(0.5367)
1.789
(0.9181
2.2407
(0.7209)
3.0018
(0.9066)
2.0017
(0.8071)
2.759
(0.3267)
2.2401
(0.4241)
3.9117
(0.5339)
2.0018
(0.5167)
1.365
(0.6243)
2.759
(0.4367)
ARCH(5)5.94
(0.3121)
3.31
(0.3376)
3.7880
(0.5267)
4.3062
(0.7086)
4.094
(0.7165)
2.799
(0.9320)
4.6195
(0.5398)
5.7879
(0.5067)
3.3063
(0.6386)
4.095
(0.6056)
2.1050
(0.9448)
6.2451
(0.3425)
3.7881
(0.5197)
3.92
(0.8489)
4.095
(0.8166)
ARCH(7)6.682
(0.5616)
4.429
(0.2284)
1.9637
(0.1250)
8.3137
(0.3094)
4.76
(0.3249)
2.905
(0.3316)
3.9239
(0.6432)
1.9637
(0.8725)
3.8314
(0.9394)
4.761
(0.5249)
4.3164
(0.6303)
8.9609
(0.6319)
1.9640
(0.1249)
2.874
(0.4376)
4.76
(0.6249)
Note: where “***”, “**”, and “*” indicate the significance level at 1%, 5%, and 10% respectively.

References

  1. Ali, R., Mangla, I. U., Rehman, R. U., Xue, W., Naseem, M. A., & Ahmad, M. I. (2020). Exchange rate, gold price, and stock market nexus: A quantile regression approach. Risks, 8(3), 86. [Google Scholar] [CrossRef] [Scilit]
  2. Allen, M. R., & Smith, L. A. (1996). Monte Carlo SSA: Detecting irregular oscillations in the presence of colored noise. Journal of Climate, 9(12), 3373–3404. [Google Scholar] [CrossRef] [Scilit]
  3. Amoako, G. K., Asafo-Adjei, E., Mintah Oware, K., & Adam, A. M. (2022). Do volatilities matter in the interconnectedness between world energy commodities and stock markets of BRICS? Discrete Dynamics in Nature and Society, 2022(1), 1030567. [Google Scholar] [CrossRef] [Scilit]
  4. Badwan, N., Al-Khazaleh, S., Qubbaj, I., & Bani Ahmad, A. Y. (2025). Dependence structure of the US dollar index and crude oil prices: A regime-switching copula approach. Journal of Financial Economic Policy, 18(3), 457–479. [Google Scholar] [CrossRef] [Scilit]
  5. Bhullar, P. S., Gupta, P. K., Kiranmai, J., & Tandon, D. (2024). Interdependence between energy commodities and global stock indices: A volatility transmission approach. FIIB Business Review, 15(3), 353–366. [Google Scholar] [CrossRef] [Scilit]
  6. Chien, F., Sadiq, M., Kamran, H. W., Nawaz, M. A., Hussain, M. S., & Raza, M. (2021). Co-movement of energy prices and stock market return: Environmental wavelet nexus of COVID-19 pandemic from the USA, Europe, and China. Environmental Science and Pollution Research, 28(25), 32359–32373. [Google Scholar] [CrossRef] [Scilit] [PubMed]
  7. Ertugrul, H. M., Polat, O., Yıldırım, D. Ç., & Açık, A. (2025). Dynamic interlinkages between precious metal, exchange rate and crude oil: Evidence from an extended TVP-VAR analysis. Computational Economics, 66(2), 1545–1570. [Google Scholar] [CrossRef] [Scilit]
  8. Grinsted, A., Moore, J. C., & Jevrejeva, S. (2004). Application of the cross wavelet transform and wavelet coherence to geophysical time series. Nonlinear Processes in Geophysics, 11(5/6), 561–566. [Google Scholar] [CrossRef] [Scilit]
  9. Iqbal, N., Fareed, Z., Shahzad, F., He, X., Shahzad, U., & Lina, M. (2020). The nexus between COVID-19, temperature and exchange rate in Wuhan city: New findings from partial and multiple wavelet coherence. Science of The Total Environment, 729, 138916. [Google Scholar] [CrossRef] [Scilit] [PubMed]
  10. Jiang, Z., & Yoon, S. M. (2020). Dynamic co-movement between oil and stock markets in oil-importing and oil-exporting countries: Two types of wavelet analysis. Energy Economics, 90, 104835. [Google Scholar]
  11. Khan, M. A., Khan, F., Sharif, A., & Suleman, M. T. (2023). Dynamic linkages between Islamic equity indices, oil prices, gold prices, and news-based uncertainty: New insights from partial and multiple wavelet coherence. Resources Policy, 80, 103213. [Google Scholar]
  12. Kumar, S., Pathak, R., Tiwari, A. K., & Yoon, S. M. (2017). Are exchange rates interdependent? Evidence using wavelet analysis. Applied Economics, 49(33), 3231–3245. [Google Scholar] [CrossRef] [Scilit]
  13. Mihanović, H., Orlić, M., & Pasarić, Z. (2009). Diurnal thermocline oscillations driven by tidal flow around an island in the Middle Adriatic. Journal of Marine Systems, 78, S157–S168. [Google Scholar] [CrossRef] [Scilit]
  14. Mudiangombe, B. M., & Mwamba, J. W. M. (2023). Dependence structure and time–frequency impact of exchange rates on crude oil and stock markets of BRICS countries: Markov-switching-based wavelet analysis. Journal of Risk and Financial Management, 16(7), 319. [Google Scholar] [CrossRef] [Scilit]
  15. Muneer, S., Waris, M., Kanwal, S., & Tripathi, A. (2026). Dynamic co-movements of stock markets and implications for portfolio managers: Evidence from wavelet approach. International Journal of Emerging Markets, 21(2), 488–512. [Google Scholar] [CrossRef] [Scilit]
  16. Nelson, D. B. (1991). Conditional heteroskedasticity in asset returns: A new approach. Econometrica, 59(2), 347–370. [Google Scholar] [CrossRef] [Scilit]
  17. Ng, E. K., & Chan, J. C. (2012). Geophysical applications of partial wavelet coherence and multiple wavelet coherence. Journal of Atmospheric and Oceanic Technology, 29(12), 1845–1853. [Google Scholar] [CrossRef] [Scilit]
  18. Razi, U., Cheong, C. W., Shams, S., Sarker, T., Sharif, A., & Afshan, S. (2025). Assessing the turbulence: Wavelet coherence and causality analysis of energy price volatility and exchange rate instability. Energy, 331, 136948. [Google Scholar] [CrossRef] [Scilit]
  19. Singh, S., Singh, M., & Attri, S. (2026). Dynamic volatility linkages among crude oil, exchange rate, interest rate, gold and equity markets: An empirical Asian perspective. Managerial Finance, 52(1), 160–182. [Google Scholar] [CrossRef] [Scilit]
  20. Tabash, M. I., Babar, Z., Sheikh, U. A., Khan, A. A., & Anagreh, S. (2022). The linkage between oil price, stock market indices, and exchange rate before, during, and after COVID-19: Empirical insights of Pakistan. Cogent Economics & Finance, 10(1), 2129366. [Google Scholar] [CrossRef] [Scilit]
  21. Tiwari, A. K., Mutascu, M. I., & Albulescu, C. T. (2016). Continuous wavelet transform and rolling correlation of European stock markets. International Review of Economics & Finance, 42, 237–256. [Google Scholar] [CrossRef] [Scilit]
  22. Torrence, C., & Compo, G. P. (1998). A practical guide to wavelet analysis. Bulletin of the American Meteorological Society, 79, 61–78. [Google Scholar]
  23. Torrence, C., & Webster, P. J. (1998). The annual cycle of persistence in the El Nño/Southern Oscillation. Quarterly Journal of the Royal Meteorological Society, 124(550), 1985–2004. [Google Scholar] [CrossRef] [Scilit]
  24. Torrence, C., & Webster, P. J. (1999). Interdecadal changes in the ENSO–monsoon system. Journal of Climate, 12(8), 2679–2690. [Google Scholar]
  25. Vacha, L., & Barunik, J. (2012). Co-movement of energy commodities revisited: Evidence from wavelet coherence analysis. Energy Economics, 34(1), 241–247. [Google Scholar] [CrossRef] [Scilit]
  26. Zeng, H., Ahmed, A. D., Lu, R., & Dai, N. (2022). Dependence and spillover among oil market, China’s stock market and exchange rate: New evidence from the Vine-Copula-CoVaR and VAR-BEKK-GARCH frameworks. Heliyon, 8(11), e11737. [Google Scholar] [PubMed]
Figure 1. (ai) Wavelet Coherence transform, multiple wavelet, and partial wavelet graphs for Brazil: The 5% significance level, determined through Monte Carlo simulations with phase-randomized surrogate series, is delineated by the black contour. The cone of influence representing areas influenced by edge effects is revealed as a shaded boundary. The color gradient from blue to yellow illustrates the variation in power intensity, from low to high, thereby reflecting the strength of co-movement between variables. Legend: The frequency-period lines delineate the periodicity band of the solar cycle spanning from 4 to 1024 days, which is further categorized into short-term (4–32 days), medium-term (32–128 days), and long-term (128–1024 days) intervals. Arrows denote the relative phase based on their angular orientation relative to the horizontal axis; the arrow positions illustrate the phase difference between the two series.
Ijfs 14 00175 g001
Figure 2. (ai) Graphs of Wavelet Coherence, multiple and partial for Russia. Same explanation as Figure 1. (ai) The arrow position indicates the phase difference between the two series: the variables are in phase when the arrows point to the right (positively linked), and out of phase when the arrows point to the left (negatively linked). When the arrows are pointing right and up, the stock index promotes energy commodities. When the arrows point right and downward, energy commodities drive the stock index. In the out-of-phase situation, stock explains energy commodities when the arrows point to the left and downward. When the arrows point to the left and up, energy commodities indicate stock prices.
Ijfs 14 00175 g002
Figure 3. (ai) Graphs of Wavelet Coherence, multiple and partial for India. Same explanations as for Figure 1ai and Figure 2ai.
Ijfs 14 00175 g003
Figure 4. (ai) Graphs of Wavelet Coherence, multiple and partial for China. Same explanations as for Figure 1ai and Figure 2ai.
Ijfs 14 00175 g004
Figure 5. (ai) Graphs of Wavelet Coherence, multiple and partial for South Africa. Same explanations as for Figure 1ai and Figure 2ai.
Ijfs 14 00175 g005
Table 1. Descriptive statistics of the energy prices. Stock markets and foreign exchange rates of BRICS economies.
Br_oilCr_oilNat_GBovesFX_BrMOEXFX_RuSensexFX_IndShangFX_ChiALSIFX_SA
Mean0.0010−0.0365−0.01700.03100.01200.0367−0.02180.04760.01320.0221−0.00270.03770.0199
Median0.07000.0000−0.03340.05530.00000.07850.00000.07710.00000.06330.00000.0693−0.0288
Std. Dev2.47893.92833.35601.64941.04031.93351.23891.35390.43011.48540.19361.20781.0607
Skewn−0.7170−0.97560.3120−0.42090.1959−1.9408−0.5429−0.29620.1777−0.6317−0.0127−0.27850.9306
Kurtosis22.119352.19017.576112.87477.888160.828935.793815.032610.14458.518112.77218.654016.5002
J-Bera7653750458844412045050076994232241603021810654667319883.672138668
Prob0.00000.00000.00000.00000.00000.00000.00000.00000.00000.00000.00000.00000.0000
ADF−15.154
(0.01)
−17.672
(0.01)
−16.004
(0.01)
−15.919
(0.01)
−16.03
(0.01)
−17.001
(0.01)
−16.879
(0.01)
−15.44
(0.01)
−16.039
(0.01)
−14.994
(0.01)
−14.669
(0.01)
−18.041
(0.01)
−17.943
(0.01)
Notes: Table 1 summarizes the descriptive statistics for Brent oil, crude oil, natural gas, the stock index, and the currency markets. The sample mean, median, standard deviation, skewness, kurtosis, J-Bera test statistic, p-value, and ADF are all included.
Table 2. EGARCH estimates.
Brazil Russia
ParamstockFXBr-oilCr-oilNGASstockFXBr-oilCr-oilNGAS
μ 0.0328 **
(0.0172)
−0.0039
(0.0076)
0.0209
(0.0215)
−0.0409
(0.0896)
−0.0237
(0.0351)
0.0788 ***
(0.0146)
0.0240 ***
(0.0058)
0.0207
(0.0256)
−0.04147
(0.0895)
−0.0237
(0.0351)
θ 0.2065 ***
(0.0331)
0.1924 ***
(0.0301)
−0.157 ***
(0.0316)
−0.0297 **
(0.0131)
−0.0317 **
(0.0152)
0.0089
(0.0088)
0.0130
(0.0145)
0.0134
(0.0138)
0.0285 **
(0.0139)
−0.0317 **
(0.0151)
ω 0.0102 ***
0.0018)
−0.0034 *
(0.0020)
0.0134 ***
(0.0014)
0.0991 ***
(0.0035)
0.0234 ***
(0.0016)
0.0073 ***
(0.0024)
−0.0014
(0.0023)
0.0134 ***
(0.0015)
0.0987 ***
(0.0035)
0.0234 ***
(0.0016)
α −0.0690 ***
(0.0082)
0.0581 ***
(0.0082)
−0.0527 ***
(0.0071)
−0.0901 ***
(0.0129)
0.0014
(0.0084)
−0.0469 ***
(0.0093)
0.0648 ***
(0.0109)
−0.0528 ***
(0.0071)
0.0927 ***
(0.0129)
0.0044 *
(0.0024)
β 0.9840 ***
(0.0009)
0.9828 ***
(0.0010)
0.9904 ***
(0.0000)
0.9783 ***
(0.0002)
0.9892 ***
(0.0001)
0.9853 ***
(0.0008)
0.9923 ***
(0.0002)
0.9904 ***
(0.0000)
0.9785 ***
(0.0002)
0.9892 ***
(0.0001)
γ −0.1301 ***
(0.0132)
−0.1662 ***
(0.0143)
−0.1178 ***
(0.0038)
−0.2454 ***
(0.0046)
−0.1422 ***
(0.0068)
−0.1935 ***
(0.0153)
−0.2222 ***
(0.0041)
−0.1177 ***
(0.0038)
−0.2424 ***
(0.0060)
−0.1422 ***
(0.0068)
9.7123 ***
(1.1762)
8.3126 ***
(0.8907)
7.7122 ***
(0.7850)
3.7360 ***
(0.2072)
6.5613 ***
(0.5461)
5.4084 ***
(0.3884)
6.0588 ***
(0.5282)
7.7118 ***
(0.7863)
3.6819 ***
(0.2013)
6.5604 ***
(0.5460)
ARCH(3)1.0017
(0.1673)
2.0089
(0.9245)
2.759
(0.9967)
2.0090
(0.9245)
2.759
(0.8967)
2.6898
(0.1062)
2.2469
(0.8192)
0.0018
(0.9066)
2.0017
(0.4372)
2.759
(0.2472)
ARCH(5)1.7966
(0.1341)
2.1751
(0.7013)
4.095
(0.1656)
1.1751
(0.8013)
4.095
(0.7015)
1.3059
(0.2048)
3.5586
(0.1408)
1.7879
(0.1067)
0.3062
(0.1386)
4.094
(0.2316)
ARCH(7)1.9832
(0.1309)
3.7207
(0.3443)
4.761
(0.6024)
2.7207
(0.5043)
4.761
(0.2499)
1.3908
(0.143)
4.8299
(0.402)
1.9637
(0.8025)
0.8313
(0.9094)
4.76
(0.8089)
Note: Table 2 presents the estimates of the EGARCH model, where “***”, “**”, and “*” indicate the significance level at 1%, 5%, and 10%, respectively.
Table 3. Comparative summary of wavelet results across countries.
CountryBrazilRussiaIndiaChinaSouth Africa
Oil–Stock RelationshipStrong, mostly positive (in-phase)Strong, positive and persistentModerate, often negative or mixedWeak to moderate, inconsistentModerate, often negative
Gas–Stock RelationshipModerate, mixedModerate to strongWeak to moderateWeakWeak to moderate
Role of Exchange Rate (FX)Significant driver (reduces coherence in PWC)Dominant transmission channel (large reduction in PWC)Critical driver, especially short–medium termLimited role in many periodsPrimary transmission channel
Lead–Lag DynamicsOil leads in crises; stocks lead in stable periodsOil consistently leads stocksOil leads stocksMixed leadershipOil leads in crises; mixed otherwise
Time–Frequency CharacteristicsStrong in medium–long termStrong across all horizonsStrong in short–medium termSporadic coherence, mostly short–medium termStrong in medium–long term
Economic InterpretationOil-exporting economy; commodity-driven equity marketHighly energy-dependent economyOil-importing; currency depreciation amplifies shocksDiversified economy; indirect energy dependenceOil-importing; FX (Rand) highly sensitive to oil shocks
Note: Own design.
Disclaimer/Publisher’s Note: The statements, opinions and data contained in all publications are solely those of the individual author(s) and contributor(s) and not of MDPI and/or the editor(s). MDPI and/or the editor(s) disclaim responsibility for any injury to people or property resulting from any ideas, methods, instructions or products referred to in the content.