Article

Corporate Financial Distress and Equity Market Contagion: Evidence from Energy Sector Collapses in the U.S. Stock Market


by
Salem Hadi Al Mustanyir
Department of Accounting and Finance, Cork University Business School, University College Cork, T12 K8AF Cork, Ireland
Int. J. Financial Stud. 2026, 14(5), 129; https://doi.org/10.3390/ijfs14050129
Submission received: 25 March 2026 / Revised: 22 April 2026 / Accepted: 29 April 2026 / Published: 11 May 2026
(This article belongs to the Special Issue Advances in Financial Risk Management)

Highlights

What are the main findings?
  • Energy-sector corporate filing events do not propagate systemic financial contagion, challenging conventional risk models.
  • Evidence from energy-sector firms across NYSE and NASDAQ shows limited market-wide spillover effects.
  • U.S. court-supervised reorganization and pre-filing disclosures emerge as key stabilizers of investor sentiment during distress events.
What is the implication of the main finding?
  • The results provide a policy-relevant framework for designing filing and restructuring mechanisms tailored to commodity-driven sectors exposed to price volatility.

Abstract

This study provides the first empirical analysis of how energy-sector corporate filing events transmit to financial markets, bridging a critical gap between corporate financial distress literature and commodity market dynamics. The analysis employs an event study methodology with Wilcoxon signed-rank tests and panel regression models to examine 51 U.S. energy firms that experienced financial distress (2015–2021) across the NYSE and NASDAQ. Post-announcement cumulative abnormal returns (CARs) show positive median values (WSR: 40.5 for NYSE in 10-day window, p < 0.10; 97.8 for NASDAQ in 10-day window, p < 0.05; 36.24 for NASDAQ in 5-day window, p < 0.10). Panel regression results show significant differences in post-announcement CARs relative to the event day for both indices (NYSE: 10-day window coefficient = 117.1, p < 0.05; NASDAQ: 10-day = 199.6, p < 0.01; 5-day = 150.8, p < 0.05), as well as in pre-announcement windows for NYSE (5-day coefficient = 93.5, p < 0.10; 10-day = 86.6, p < 0.10). The findings suggest that markets respond to energy-sector corporate distress events without broad-based disruption, likely due to early signals of financial distress, clarified expectations regarding recovery paths under Chapter 11 restructuring, and reduced information asymmetry through disclosures. Policymakers can leverage these insights to refine corporate filing frameworks for commodity-dependent sectors.
JEL Classification:
Q41; Q43; Q48; G33; G14

1. Introduction

The modern global economy is marked by continuous expansion, driven by globalization, technological advancements, and rapid, unpredictable shifts (Srebro et al., 2021). Many firms struggle to adapt to this evolving landscape, often facing financial distress that, in severe cases, results in corporate filing events—a persistent challenge rather than a temporary setback (Edward, 1983). Corporate filing represents a state in which firms can no longer fulfill their debt obligations or sustain operational viability. The primary criterion for declaring an enterprise in such a condition is typically a decision by the competent court (Kitowski et al., 2022; Sari et al., 2022). These events have far-reaching effects on economies and financial markets, often disrupting economic stability and investor confidence (Srebro et al., 2021). Their effects on market liquidity, credit availability, economic growth, and society can be substantial, though they vary depending on the circumstances (Muslim & Dasril, 2021).
Oil is one of the most important energy sources within the broader energy system (Gong et al., 2022; Wen et al., 2021) due to its irreplaceable role in production and daily life (Niu et al., 2023; Wen et al., 2021; B. Wu et al., 2021), accounting for 30% of total energy consumption and remaining the world’s major energy source in 2024 (IEA, 2024). Oil demand and its price fluctuation have important impacts on fiscal and monetary policies, stock markets, consumption, and wealth accumulation (Baumeister & Hamilton, 2019; Liu et al., 2019; Mensi et al., 2020; Tang et al., 2021; Wei et al., 2019; Yin & Ma, 2018). As part of global rapid and unpredictable shifts, energy market shocks driven primarily by oil dynamics in the last ten years have put pressure on the global economy and energy security and have become one of the main political agendas and research topics for scholars and policymakers worldwide (Gong et al., 2022). Given that the modern global economy is characterized by continuous expansion and transformation, the energy sector has not been immune to corporate filing events resulting from these developments, nor will it likely be exempt from them in the future. Since energy companies are deeply integrated into financial systems through market capitalization, investor portfolios, and credit markets, these events could trigger significant spillovers in financial markets.
Extensive research has explored the influence of energy markets on fundamental economic and policy areas. A broad spectrum of studies has examined how energy market dynamics affect economic growth (Rasheed, 2023), exchange rates and monetary policy (Forhad & Alam, 2022; Kocaarslan, 2024), balance of trade (Balli et al., 2021), sustainable debt markets (Pham & Nguyen, 2022), green energy transitions (Geng et al., 2021; Karacan et al., 2021), food price stability (Dalheimer et al., 2021), social welfare (Yang et al., 2022), and manufacturing investment (Wang et al., 2024). While this literature provides rich insights into the broader economic and policy implications of energy markets, research focusing specifically on the connection between energy markets and financial markets has mainly emphasized their co-movement, volatility transmission, and dynamic interdependence across different periods and regions (Hamilton, 1996; Kilian & Park, 2009; Le & Do, 2022; A. I. Maghyereh et al., 2016; Sadorsky, 1999). Despite this extensive coverage, the specific impact of corporate filing events within energy markets on stock markets remains notably absent from the literature.
Turning to the broader literature on corporate filing, numerous studies have extensively examined various aspects of corporate filing across multiple areas. A considerable body of research has focused on developing predictive models for assessing the likelihood of corporate filing in firms across different times, countries, and industries (Kitowski et al., 2022; Máté et al., 2023; Muslim & Dasril, 2021; Muzani & Yuliana, 2021; Sari et al., 2022; Srebro et al., 2021; Ullah et al., 2021; Voda et al., 2021). Other studies have examined the implications of corporate filing in areas such as tax advantages and its influence on corporate debt (Ricca et al., 2021), and the impact of corporate life cycles and corporate filing on earnings management (Durana et al., 2021), as well as the financial health of agricultural enterprises (Vavrek et al., 2021).
Moreover, research has explored the legal repercussions of corporate filing (Suryati et al., 2022), the risk of corporate filing given the growing role of digital financing (Ji et al., 2022), the probability of corporate filing when investing in cryptocurrency (Kozlovskyi et al., 2022), and legal considerations related to collateral in corporate filing proceedings (Fauzia et al., 2022). Studies have also investigated how debtor-friendly corporate filing frameworks affect entrepreneurship and innovation (Prusak et al., 2022), the link between investment choices and corporate filing in MSMEs (Rustan, 2021), and the responsibility for legal fee payments in corporate filing proceedings (Sukardi, 2021). Notwithstanding these broad explorations, the specific intersection of energy-sector corporate filing and stock market responses remains underexplored, indicating a notable gap in the literature that this study aims to address.
Literature on cross-market linkages shows that firm-level financial distress may extend beyond individual firms and be reflected in broader market outcomes, including asset prices and market co-movements (Bhattacharyya & Kasa, 2018; Issa et al., 2024; Liu et al., 2019; Prusak & Potrykus, 2021). Previous studies have focused on how shocks originating from commodity markets, particularly energy markets involving oil and gas, influence firms through changes in default risk and financing constraints (Degl’Innocenti et al., 2025; A. Maghyereh & Al-Zoubi, 2026). In contrast, this study examines the reverse direction by focusing on corporate filing in the energy sector and its impact on stock market behavior. The analysis considers how firm-level outcomes are reflected in equity market reactions without departing from the established structure of prior evidence (Tao et al., 2025).
Reactions of stock markets to corporate filings in the energy sector may not be transmitted through a single mechanism but rather emerge as part of a broader adjustment process. Following such events, trading patterns tend to adjust as market participants reposition portfolios in response to evolving perceptions of firm-level financial distress (Khan et al., 2024; Shao, 2025). At the same time, the gradual dissemination of relevant signals contributes to revisions in expectations, as both public and market-based indicators evolve over time (De Blasis et al., 2024; Kallenos et al., 2025). These adjustments are also shaped by shifts in investor positioning when uncertainty intensifies around firm-specific outcomes, which may coincide with pressure on financial flexibility within the energy sector (Michalkova & Ponisciakova, 2025; Vukčević et al., 2024). Collectively, these dynamics may explain how corporate filing events in the energy sector are reflected in stock market movements, rather than following a single or predefined transmission structure.
While existing literature has contributed significantly to understanding the relationship between energy markets and financial markets, as well as various aspects of corporate filing, a critical gap remains. Specifically, the impact of corporate filing on stock markets has received limited attention, particularly in the context of recent events. This gap is even more pronounced when it comes to corporate filing within the energy sector. Despite the ongoing and increasingly frequent energy market shocks driven by global economic shifts, the research leaves this important and persistent question largely unexplored. Therefore, this study responds to that need by analyzing how such filings influence stock markets, with particular focus on the immediate implications and the broader context of energy market shocks. The investigation concentrates on the most influential energy markets—those leading in production, consumption, and imports—as well as major stock markets that hold substantial weight in the global economy, where more robust evidence and meaningful contributions to understanding other international markets can be drawn.
This study contributes by redefining the analytical focus from conventional examinations of energy market influences on firm outcomes to the stock market implications of corporate filing events within the energy sector. It positions listed energy firms as event-driven sources through which filing-related signals are incorporated into equity pricing processes. Focusing on energy firms, the study provides novel empirical evidence on how firm-level filing events are reflected in stock market reactions, thereby extending the literature on financial distress by emphasizing direct market adjustments rather than firm-centered outcomes.

2. Methodology

To investigate the markets’ reaction to companies’ filing announcements and whether the attention-grabbing provides an explanation for pre- and post-event abnormal returns, the study sample included all filed U.S. energy companies that were listed in stock markets. The database used for tracking the filed energy company was Haynes Boone (Boone, 2022). All companies’ data were tracked using the code of the court where the company’s filing decision was made to ensure that all companies are U.S. companies. This tracking process identified 262 filed U.S. energy companies. To serve the purpose of the study, which focuses on publicly traded equities, each company’s listing status was identified. A total of 51 companies were identified as publicly listed on U.S. stock exchanges, of which 35 were traded on NYSE and 16 on NASDAQ. The remaining 211 companies do not align with the study’s purpose.
The study identified the announcement date of each filing from the Haynes Boone database. If the filing date was not found in the database, it was obtained from court records where the company was filed or from press releases. These 51 filing cases represent the population of all U.S. energy companies publicly listed on NYSE or NASDAQ that filed over the period from 2015 to 2021, which represents the most recent available data at the time of conducting this study. Notably, the analysis focuses on the filing event days, not the firms themselves, where each case provides multiple daily observations across pre-event and post-event windows.
The study employed an event study to estimate abnormal returns to stock exchanges at the time energy companies filed announcements for a 21-day test period from −10 to +10, with the NYSE and NASDAQ serving as proxies for the financial markets in which the filed companies were listed. Abnormal returns were computed by subtracting the event-day market index change from the average daily change in the same quarter in the prior year to control for seasonal patterns and market trends, providing a more stable benchmark than using the previous day’s return (Li et al., 2018). Abnormal returns are estimated using the following formula:
AR i , t   =   P i , t o b s   P - i , q p r e v
where
ARi,t = Abnormal return of market proxy i at time t.
P i , t o b s = Observed closing price of proxy i at time t.
P - i , q p r e v = Average daily price of proxy i over quarter q in the previous year.
The study computed the abnormal return (AR) for 5 event windows to test the stock market reaction on the announcement day (zero), one day before and one after (−1, +1), and two days before and two after (−2, +2). These short event windows focus on capturing the immediate market reaction around the event. Moreover, cumulative abnormal return (CAR) was also computed, including the return for five days before the announcement day and five after (−1, −5 and +1, +5), and 10 days before and 10 days after (−1, −10 and +1, +10). These wider windows allow for the observation of lingering effects or potential delayed responses.
The event-window design results in 459 observations across the examined windows, extending the dataset beyond the 51 filing cases in the sample, as each event window contributes multiple AR and CAR observations. This structure allows for a more granular assessment of market reactions to corporate filing events (Miller, 2023; Sasikumar & Sundaram, 2024). The cumulative abnormal returns (CAR) for each event window are calculated as follows:
CAR i , ( t 1 ,   t 2 )   =   t = t 1 t 2 A R i , t
where
CARi,(t1, t2) = Cumulative abnormal return of market proxy i across the event window from day t1 to day t2.
ARi,t = Abnormal return of market proxy i on day t, calculated as the difference between the proxy’s observed daily price on the event day and its average daily price for the same quarter of the previous year.
t1 = Start of the event window.
t2 = End of the event window.
This approach follows Heston and Sadka, who document that seasonal-adjusted benchmarks deliver lower estimation noise in short-horizon event studies relative to market model residuals (Fama & French, 2015; Heston & Sadka, 2008). Unlike conventional models that require selecting an arbitrary estimation window, this method offers a transparent, replicable benchmark that is exogenously determined by the calendar. For corporate filing events, the conventional market model would necessitate estimating expected returns over a pre-event window that may be contaminated by early distress signals. The prior-year same-quarter benchmark circumvents this contamination entirely by relying on data from a period preceding any indication of financial distress.
This study employed descriptive analysis to assess the impact of company closures on stock market performance. Given that the AR and CAR data for the New York and NASDAQ stock exchanges (AR: −2, −1, 0, 1, 2; CAR: −10, −5, 5, 10) did not meet the normality assumption, as indicated by the Shapiro–Wilk test, and due to the smaller sample size of NASDAQ, the Wilcoxon signed-rank test (WSR) was utilized. This non-parametric test is appropriate for small sample sizes and does not assume normal distribution, making it suitable for the study dataset (Fagerland, 2012; Manap et al., 2023). The Wilcoxon signed-rank test assesses whether the median of AR or CAR significantly deviates from zero (Bagkavos & Patil, 2021). The present study employed a two-sided Wilcoxon signed-rank test with significance levels set at 1%, 5%, and 10%. The significance value (p-value) of the median AR or CAR from zero is reported to indicate the probability of a difference if the null hypothesis is true, which is the hypothesis that the median is zero. The median of all the study events was calculated to identify any patterns in the stock markets’ performance at the time of companies’ closure. The statistical analysis was performed using STATA software version 14.0.
The study conducted further analysis to examine how the stock market responded across different event time windows relative to the closure date. Specifically, market reactions at various time intervals before and after the closure were compared to the response at time 0 (closure date). This analysis identifies variations in the market’s reaction to the news of company closures and examines whether market reactions were concentrated around the closure event or spread over time. To do so, a panel regression model was employed, given the cross-sectional nature of the data—where firms are observed at a single point in time corresponding to their filing date. A panel data approach facilitates the control of unobserved heterogeneity across firms (Baltagi, 2021; Hsiao, 2022). The independent variable represents event time categories (−10, −5, −2, −1, 0, 1, 2, 5, 10), with time 0 (closure date) serving as the baseline for comparison. The dependent variables, AR and CAR, measured the stock market’s reaction to company closures. A random effects model was selected based on the assumption that unobserved firm-specific effects are uncorrelated with the independent variables, ensuring efficient estimations while capturing variations across firms (Wooldridge, 2016). The present study employed a panel regression approach with significance levels set at 1%, 5%, and 10%. The significance value (p-value) of the difference between the event time windows relative to the closure date was reported to assess the likelihood of a difference under the null hypothesis, which posits that the market response at each event time window (relative to time 0, the closure date) is equal to zero.

3. Results

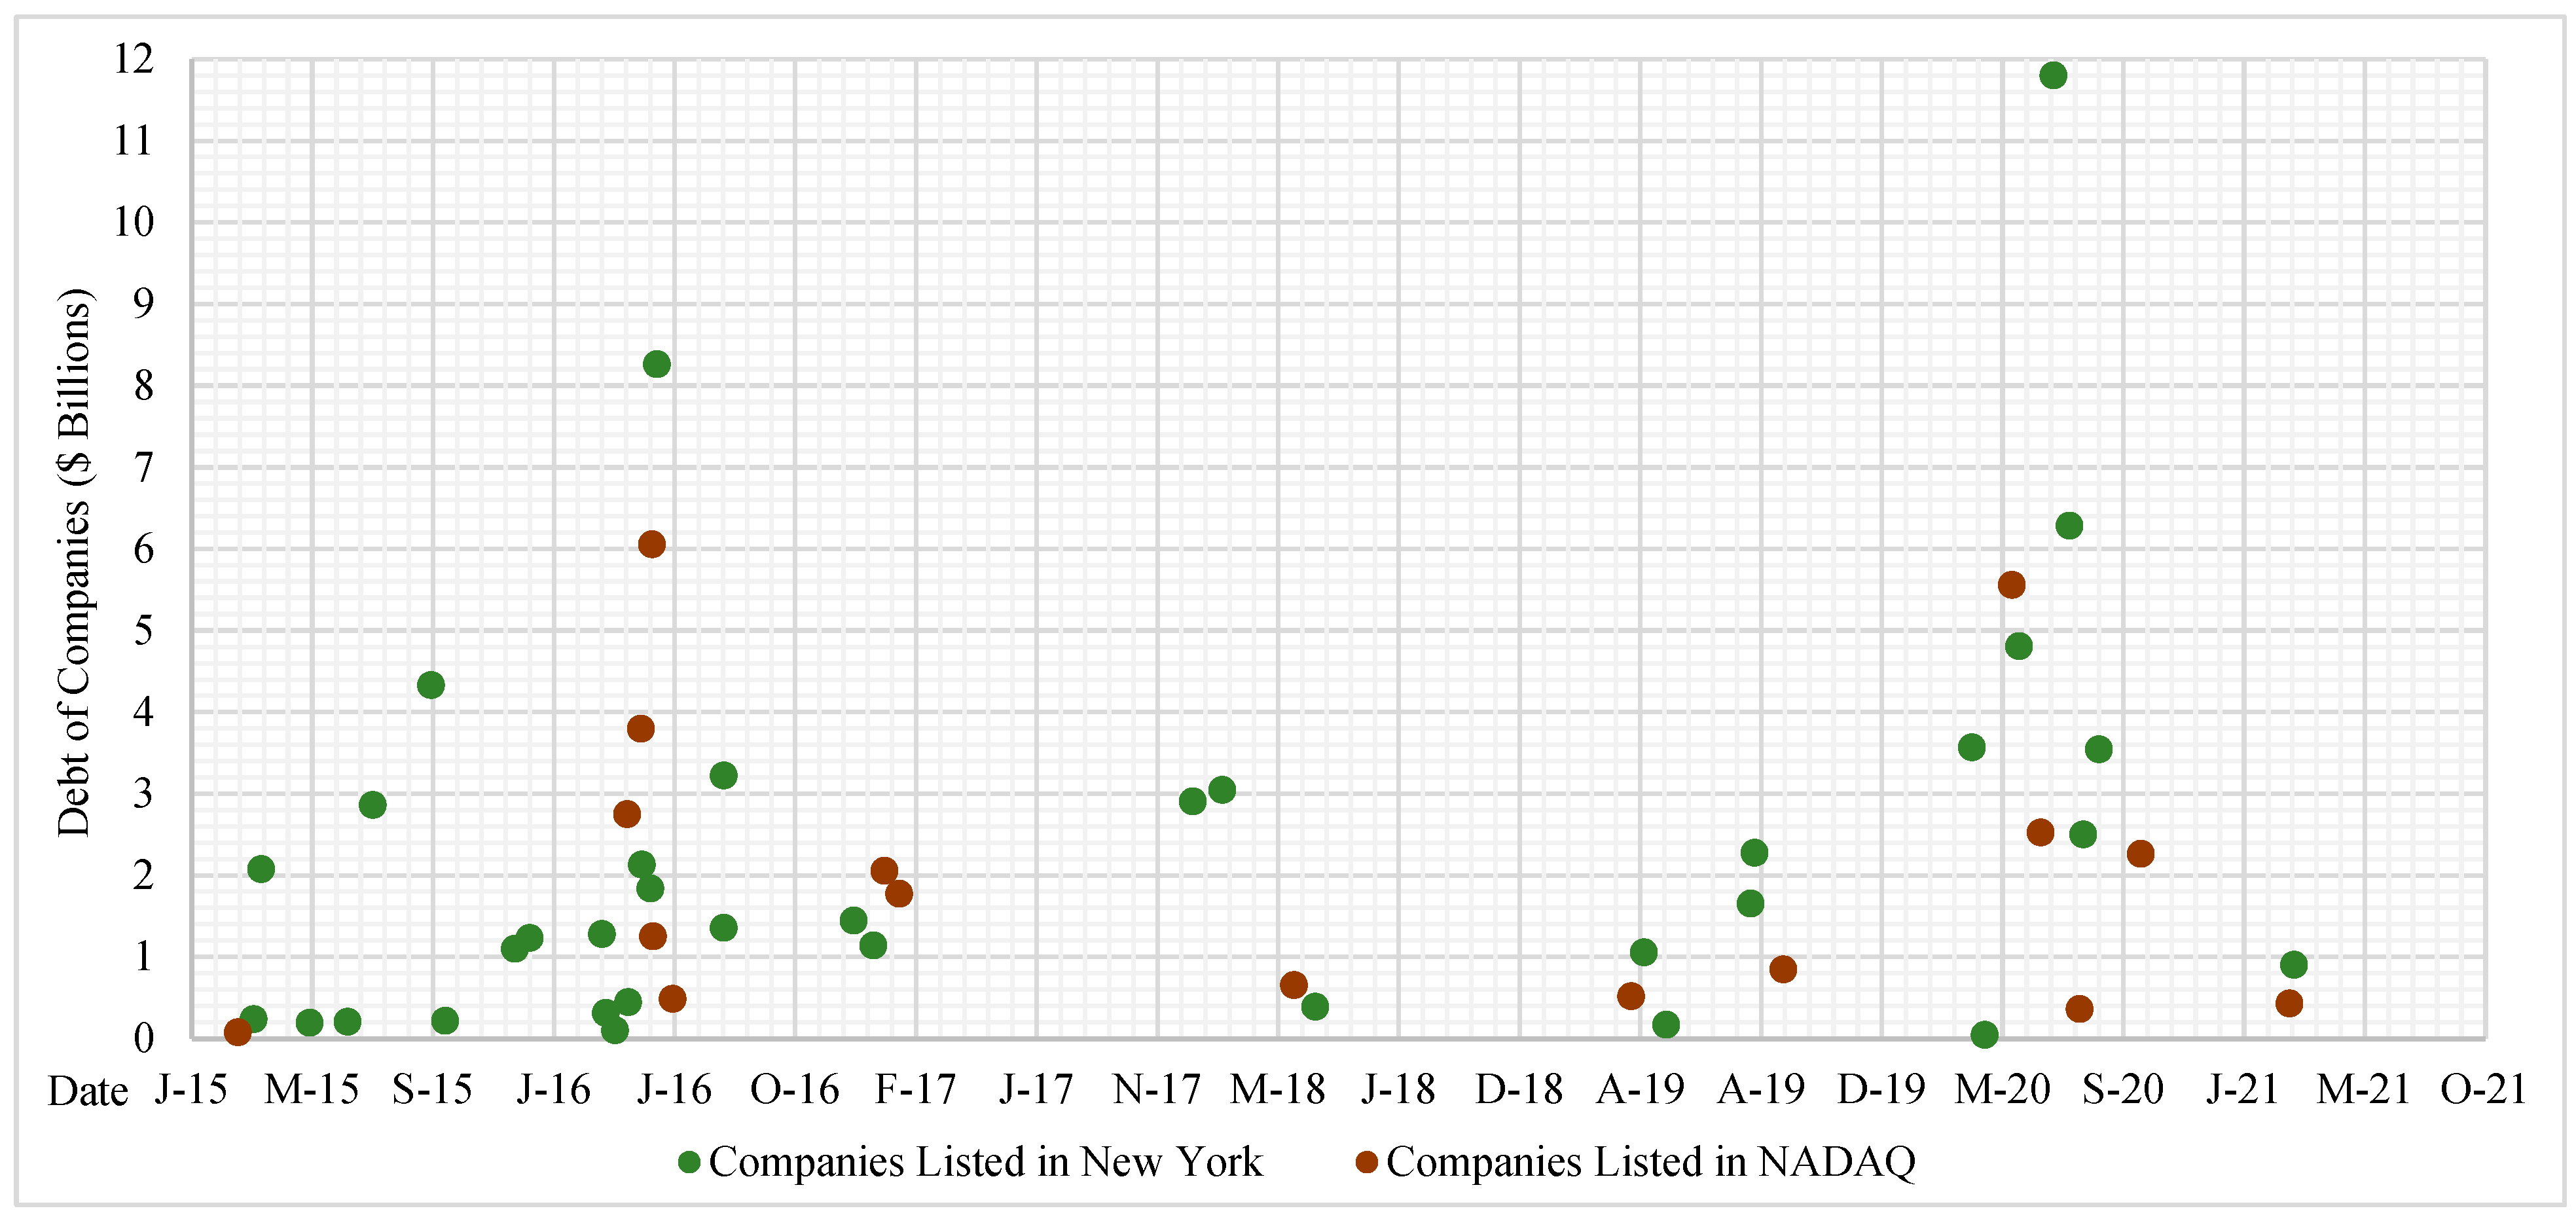
The study finds that 51 energy companies listed on the NYSE and NASDAQ filed between 2015 and 2021, with debt levels ranging from $77 million to $11.8 billion and an average debt of $2.1 billion. Of these, 35 companies were listed on the NYSE, carrying an average debt of $2.2 billion, while 15 were listed on NASDAQ, with an average debt of $1.9 billion. The majority of filings occurred between December 2015 and July 2016 and between April and September 2020. During these periods, 27 energy companies filed for financial distress, with an average debt of $2.9 billion (see Figure 1). The sample exhibits substantial cross-sectional variation in firm size and leverage, as reflected in the wide dispersion of reported debt levels, thereby increasing the representativeness of the sample structure. In addition, the dataset covers firms operating across different issuance intensities and capital structures within the energy sector.
For event window 10 after the announcement, the WSR test yielded a p-value of 0.09 for the NYSE, with a median CAR of 40.5, suggesting that the CAR is significantly different from zero (see Table 1). Similarly, NASDAQ exhibited a p-value of 0.05 with a median CAR of 97.8, indicating a statistically significant deviation from zero. This suggests that both markets responded without a negative effect in the ten days following the event. The CAR of NASDAQ on the fifth day after the announcement was also significantly different from zero (p = 0.10, median = 36.24). CAR values remain positive across post-announcement windows in both specifications, with variation in statistical significance across event windows.
The panel regression results indicate significant differences in the CAR relative to the AR at the announcement day for both exchanges, with variation across event windows and between the two stock markets. For the NYSE, the CAR for the 10-day window before the announcement had a p-value of 0.09 and a coefficient of 86.6, while the 10-day window after the announcement was also significant, with a p-value of 0.02 and a coefficient of 117.1 (see Table 2). In addition, the 5-day window before the announcement showed a significant difference, with a p-value of 0.07 and a coefficient of 93.5. This indicates that NYSE exhibits statistically significant CAR responses in both pre- and post-announcement windows. For NASDAQ, the CAR was significant over both post-announcement windows—10-day (p-value of 0.00, coefficient of 199.6) and 5-day (p-value of 0.02, coefficient of 150.8)—while pre-announcement windows did not exhibit statistically significant results, indicating that the response is primarily concentrated after the announcement.

4. Discussion

The clustering of energy company filings between December 2015 and July 2016 and April and September 2020 coincides with two major episodes of market disruption that exposed structural vulnerabilities in the energy sector (see Figure 1). The first wave followed the 2014–2016 energy price collapse, triggered by a global oversupply driven largely by the rapid expansion of U.S. shale production, alongside OPEC’s decision in late 2014 to maintain output levels rather than cut production (Baumeister & Kilian, 2016; IMF, 2015). While the price shock placed pressure on the entire sector, some firms might have already been in weak financial condition, and the downturn may have simply accelerated their collapse. Companies with high debt burdens were likely more exposed to financial distress once revenues declined, as they could have faced difficulty covering fixed obligations or accessing refinancing options in an increasingly risk-averse financial environment.
A similar dynamic emerged during the second critical window in 2020, when the energy market experienced one of its most severe shocks in decades. The COVID-19 pandemic led to a collapse in global energy demand as travel restrictions and industrial shutdowns took hold. Despite this, supply levels remained elevated in the early months of the crisis, compounding the pressure on prices (IEA, 2020). These conditions created acute cash flow constraints for firms already operating on thin margins or carrying substantial debt loads. Many of the companies that filed during this time had limited operational scale and financial flexibility, making them unable to adjust to the sudden revenue drop.
Turning to the econometric findings, the significant CARs with positive medians observed in the 10-day window following the filing announcements suggest that the broader market, as represented by the NYSE and NASDAQ indices, did not respond with generalized pessimism. This impression is reinforced by NASDAQ’s performance in the shorter 5-day post-announcement window, which also registered statistically significant positive CARs. The stronger post-event CARs observed on NASDAQ may reflect its composition of younger or smaller firms, including technology-oriented companies whose business models and investor base may be more sensitive to rapid changes and recovery prospects. This interpretation is supported by the panel regression results reported in Table 2, which show statistically significant positive coefficients for NASDAQ in both the 5-day and 10-day post-announcement windows (p < 0.05 and p < 0.01, respectively). Rather than prompting widespread risk repricing or sectoral volatility, the filings appear to have been interpreted without triggering adverse market-wide sentiment.
This impression is further supported by the relatively elevated medians observed in the 10-day post-filing window, reaching 97.87 for NASDAQ and 40.5 for NYSE, indicating that a substantial portion of firms experienced abnormal gains during this period. One plausible interpretation is that markets had already priced in the filings prior to the announcements, reducing the surprise element and immediate negative pressure. The observed post-event significance also suggests that investor expectations may have adjusted following the filings, potentially in light of clarifying information regarding the scale of financial distress or anticipated recovery paths. Media coverage and analyst commentary may have also influenced investor reactions, helping to moderate extreme responses. This role of media coverage and information in shaping market expectations is well documented in the financial literature (Adams et al., 2023; Dunham & Garcia, 2021; Y. Wu & Wang, 2024). These patterns do not indicate that the filings triggered systemic concern, but rather that the market absorbed the news in a contained manner, without broad-based disruption or contagion effects.
The panel regression findings offer additional insight into how markets responded to the filing announcements. Both NYSE and NASDAQ exhibited significant and positive coefficients in the 10-day post-announcement windows, showing a pattern consistent with the WSR findings by capturing shifts in abnormal returns relative to the filing day. NASDAQ’s statistically significant positive CARs in the shorter 5-day post-announcement window lend further support to this impression. Although the underlying assumptions differ across the two methods, the convergence in direction strengthens the interpretation that investor sentiment either stabilized or modestly improved following the announcements. This could reflect a reassessment of the implications once the filings were public, especially if the announcements were accompanied by clearer signals about operational continuity or restructuring intent.
Significant coefficients were also observed in the pre-filing windows, particularly over the 5- and 10-day periods, suggesting that market adjustments began prior to the official filing announcements. These pre-event movements likely reflect growing investor awareness of firm-level distress through industry-specific stress signals, prior disclosures, or broader market information flow. The significance found notably on the NYSE, which generally lists more established firms, may indicate that such signals are more readily incorporated where companies have greater visibility and analyst coverage. Importantly, these dynamics do not indicate a disorderly reaction but rather a measured adjustment process, where filing news was gradually anticipated and absorbed without triggering market instability or contagion. This interpretation aligns with the nature of Chapter 11 filings, allowing firms to restructure under court supervision while continuing operations (Courts, 2023). Prior studies indicate that Chapter 11 reorganization, as opposed to Chapter 7 liquidation, reduces investor panic by signaling operational continuity and recovery potential (Bris et al., 2006; Hotchkiss et al., 2008).
Taken together, the results suggest that equity markets approached these filing announcements with a degree of nuance rather than reacting with blunt negative sentiment. The absence of sharp declines and the presence of modest post-filing gains imply that investors may have differentiated between firm-level distress and broader sectoral implications. This measured reaction could reflect a growing investor familiarity with filings as a restructuring mechanism—particularly under Chapter 11—rather than an outright signal of collapse. It may also indicate that, in the context of repeated energy market shocks during the study period, market participants became more adept at parsing which filings signaled systemic risk and which represented isolated firm-specific failures. The non-linear and dispersed nature of abnormal returns across pre- and post-announcement windows underscores that market reactions evolved over time, shaped by unfolding information rather than concentrated surprise.
Recent empirical research provides strong support for the findings of this study by illustrating how financial markets tend to react in a measured and differentiated manner to firm-level filing announcements. Evidence shows that distressed firms frequently engage in earnings management around periods of financial difficulty, which can shape investor expectations and reduce the surprise element of filing events. This aligns with the study’s observation of significant abnormal returns both before and after the filing dates, suggesting that markets may anticipate such events based on prior signals (Howe & Houston, 2016). Furthermore, changes in investor sentiment—particularly when informed by financial news and social media activity—have been found to significantly influence perceived distress levels and market reactions, reinforcing the role of media and public commentary in moderating investor behavior (Adams et al., 2023; Dunham & Garcia, 2021; Seok et al., 2024). The ability of information channels to shape sentiment supports the study’s findings of contained market responses, without signs of panic or systemic repricing. In addition, liquidity constraints associated with elevated debt levels may have served as an early observable signal of financial distress, allowing markets to anticipate filings before official announcements (Michalkova & Ponisciakova, 2025; Vukčević et al., 2024).
Additionally, research shows that markets do not uniformly penalize all filings and instead exhibit nuanced behavior, reacting selectively based on the context and perceived implications of the filing. Studies demonstrate that even when peer filings occur, firms adjust their reporting, but broad-based negative spillovers are generally avoided—consistent with the study’s evidence of limited contagion across indices (Delshadi et al., 2024). These insights are further supported by findings that, although long-term market reactions can vary, initial responses to filing announcements often reflect informed investor judgment rather than indiscriminate selling (Coelho & Taffler, 2009). Together, these studies corroborate the return patterns observed—significant, yet contained—highlighting that financial markets can absorb filing shocks with composure, particularly when expectations have been shaped in advance and distress remains firm-specific.
Beyond firm-specific dynamics and investor sentiment, broader macroeconomic conditions and policy interventions during the 2015–2016 and 2020 periods likely contributed to the overall market stability observed in response to energy-sector filings. These episodes saw substantial monetary and fiscal actions that may have influenced investor behavior and reduced the likelihood of broader market disruption. During both periods, the Federal Reserve maintained historically low interest rates—hovering around 0–0.25% in 2015 and returning to that range in March 2020—which helped reduce borrowing costs and sustain market liquidity (FR, 2015, 2020). These accommodative monetary policies, while not directly aimed at energy price shocks, appear to have supported financial conditions and moderated investor concerns.
Inflation remained subdued throughout both periods, which may have helped anchor investor expectations and provided policymakers with more flexibility to respond without immediate inflationary pressures (U.S. Bureau of Labor Statistics, 2025). In addition, large-scale fiscal spending initiatives in 2020 injected substantial liquidity into the economy, strengthening household and corporate balance sheets and contributing to more stable market sentiment (U.S. Department of the Treasury, 2020). Although these measures did not prevent filings in the energy sector, they likely limited contagion effects and supported investor confidence in broader financial stability.
The findings of this study offer critical insights for investors, regulators, and policymakers navigating the interplay between sector-specific instability and financial markets. First, the absence of systemic negative market reactions to energy company filings suggests that Chapter 11 filings—often restructuring rather than liquidation events—may mitigate contagion risks. Policymakers could leverage this insight to refine filing frameworks not only for commodity-dependent sectors (e.g., oil) but also for other industries integral to financial market indices. For example, jurisdictions with stock exchanges heavily weighted toward specific sectors (e.g., technology, manufacturing) could structure filing laws to preemptively isolate distress signals, ensuring that firm-level distress does not destabilize broader indices. Second, the observed pre-announcement abnormal returns indicate that markets anticipate distress early, underscoring the need for transparent disclosure requirements to reduce information asymmetry. For investors, these results highlight the importance of monitoring leverage and preemptive risk pricing across sectors, particularly during periods of macroeconomic volatility. Finally, the resilience of major U.S. exchanges (NYSE and NASDAQ) to energy-sector shocks underscores the role of deep liquidity and diversified indices in absorbing disruptions—a lesson for emerging markets seeking to fortify financial stability.
This study acknowledges several limitations. First, the sample is restricted to publicly traded U.S. energy companies, excluding private firms and non-U.S. markets, which may limit the generalizability of findings to other jurisdictions with differing filing laws or market structures. Second, the analysis does not account for firm-specific factors (e.g., size, asset liquidity) that could mediate filing impacts, potentially obscuring heterogeneous effects. Third, the event study’s reliance on index-level data may mask sectoral or peer-level spillovers not captured by broad market indices. This implies that firm-specific reactions to filing events could be diluted or averaged out when using index returns, potentially underestimating the true market impact at the individual firm level. Fourth, the analysis does not consider the possibility of spillover effects on non-filing energy firms, whose stock prices may have been influenced by peer filings. Fifth, the timing of filing announcements may carry signaling implications or reflect endogeneity—firms might delay or accelerate filing based on anticipated market reactions or internal strategic considerations. Future research could address these gaps to provide a deeper understanding of the mechanisms behind market reactions.

5. Conclusions

This study investigates the financial market implications of filing announcements within the U.S. energy sector—a topic largely overlooked despite the sector’s global economic significance. Applying an event study to 51 publicly traded energy firms that filed between 2015 and 2021, the findings reveal a nuanced market response that departs from conventional expectations of broad-based pessimism. Statistically significant and positive CARs observed both before and after filing announcements indicate that equity markets absorbed these events with measured composure, rather than reacting with systemic distress. The evidence points to a rational investor response, influenced by early distress signals and clarified expectations regarding recovery paths, while media coverage, information flows, liquidity constraints, and the Chapter 11 framework collectively helped mitigate panic.
The theoretical contribution of this study lies in demonstrating that firm-level filing events in the energy sector do not necessarily trigger broader financial contagion, challenging conventional risk models that assume systemic spillovers from sector-specific distress. The practical implications are twofold: first, policymakers should ensure transparent and timely disclosure of filing-related information, allowing markets to price distress signals efficiently rather than suppressing them. This reduces information asymmetry and prevents sudden panic. Second, investors should monitor a broad set of pre-filing signals, including liquidity constraints, debt levels, media coverage, information flows, and behavioral sentiment indicators, to anticipate distress before official announcements. Future research could build on these findings by examining firm-level heterogeneity and cross-jurisdictional dynamics. In sum, this study provides the first empirical assessment of how energy-sector filings affect equity markets, filling a critical gap in the literature.

Funding

This research received no external funding.

Institutional Review Board Statement

Not applicable.

Informed Consent Statement

Not applicable.

Data Availability Statement

The study utilizes publicly available bankruptcy data from the Haynes Boone database. Complete datasets supporting the findings are available within the manuscript.

Conflicts of Interest

The author declares no conflicts of interest.

References

  1. Adams, T., Ajello, A., Silva, D., & Vazquez-Grande, F. (2023). More than words: Twitter chatter and financial market sentiment. arXiv, arXiv:2305.16164. [Google Scholar] [CrossRef]
  2. Bagkavos, D., & Patil, P. N. (2021). Improving the Wilcoxon signed rank test by a kernel smooth probability integral transformation. Statistics & Probability Letters, 171, 109026. [Google Scholar] [CrossRef]
  3. Balli, E., Çatık, A. N., & Nugent, J. B. (2021). Time-varying impact of oil shocks on trade balances: Evidence using the TVP-VAR model. Energy, 217, 119377. [Google Scholar] [CrossRef]
  4. Baltagi, B. H. (2021). Unbalanced panel data models. In Econometric analysis of panel data (pp. 229–257). Springer. [Google Scholar]
  5. Baumeister, C., & Hamilton, J. D. (2019). Structural interpretation of vector autoregressions with incomplete identification: Revisiting the role of oil supply and demand shocks. American Economic Review, 109(5), 1873–1910. [Google Scholar] [CrossRef]
  6. Baumeister, C., & Kilian, L. (2016). Understanding the decline in the price of oil since June 2014. Journal of the Association of Environmental and Resource Economists, 3(1), 131–158. [Google Scholar] [CrossRef]
  7. Bhattacharyya, M., & Kasa, S. R. (2018). A test for detecting structural breakdowns in markets using eigenvalue decompositions. arXiv, arXiv:1809.07114. [Google Scholar]
  8. Boone, H. (2022). Oil patch bankruptcy monitor. Available online: https://www.haynesboone.com/news?f.ItemDateYear=2022 (accessed on 13 June 2025).
  9. Bris, A., Welch, I., & Zhu, N. (2006). The costs of bankruptcy: Chapter 7 liquidation versus Chapter 11 reorganization. The Journal of Finance, 61(3), 1253–1303. [Google Scholar] [CrossRef]
  10. Coelho, L., & Taffler, R. (2009, March 18). When is bad news really good news? The case of strategic vs. non-strategic bankruptcies. Available online: https://w4.stern.nyu.edu/finance/docs/pdfs/Seminars/083m-taffler.pdf (accessed on 13 June 2025).
  11. Courts, U. S. (2023). Chapter 11—Bankruptcy basics. Available online: https://www.uscourts.gov/contact-us (accessed on 13 June 2025).
  12. Dalheimer, B., Herwartz, H., & Lange, A. (2021). The threat of oil market turmoils to food price stability in Sub-Saharan Africa. Energy Economics, 93, 105029. [Google Scholar] [CrossRef]
  13. De Blasis, R., Galati, L., Grassi, R., & Rizzini, G. (2024). Information flow in the FTX bankruptcy: A network approach. Physica A: Statistical Mechanics and Its Applications, 655, 130167. [Google Scholar] [CrossRef]
  14. Degl’Innocenti, M., Santilli, G., Sclip, A., & Zhou, S. (2025). Commodity price risk, supply chain, and lending. Energy Economics, 150, 108808. [Google Scholar] [CrossRef]
  15. Delshadi, M., Hammami, A., & Magnan, M. (2024). Tension in financial reporting: Reacting to a peer bankruptcy announcement. Journal of Accounting, Auditing & Finance, 41, 317–347. [Google Scholar] [CrossRef]
  16. Dunham, L. M., & Garcia, J. (2021). Measuring the effect of investor sentiment on financial distress. Managerial Finance, 47(12), 1834–1852. [Google Scholar] [CrossRef]
  17. Durana, P., Michalkova, L., Privara, A., Marousek, J., & Tumpach, M. (2021). Does the life cycle affect earnings management and bankruptcy? Oeconomia Copernicana, 12(2), 425–461. [Google Scholar] [CrossRef]
  18. Edward, A. (1983). Corporate financial distress: A complete guide to predicting, avoiding, and dealing with bankruptcy. Wiley Interscience. John Wiley and Sons. Available online: https://www.econbiz.de/Record/corporate-financial-distress-a-complete-guide-to-predicting-avoiding-and-dealing-with-bankruptcy-altman-edward/10000687093 (accessed on 13 June 2025).
  19. Fagerland, M. W. (2012). t-tests, non-parametric tests, and large studies—A paradox of statistical practice? BMC Medical Research Methodology, 12, 78. [Google Scholar] [CrossRef] [PubMed]
  20. Fama, E. F., & French, K. R. (2015). A five-factor asset pricing model. Journal of Financial Economics, 116(1), 1–22. [Google Scholar] [CrossRef]
  21. Fauzia, A., Octavia, D. G. R., & Hamdani, F. (2022). The conflict of the norms in the execution of secured objects which are enforced by liability rights when the debtor is bankrupt. Progressive Law Review, 4(01), 1–9. [Google Scholar]
  22. Federal Reserve [FR]. (2015). Annual report 2015. Available online: https://www.federalreserve.gov/publications/annual-report/2015-monetary-policy-and-economic-developments.htm (accessed on 4 June 2025).
  23. Federal Reserve [FR]. (2020). Monetary policy report—2020. Available online: https://www.federalreserve.gov/monetarypolicy/2020-02-mpr-part2.htm (accessed on 4 June 2025).
  24. Forhad, M. A. R., & Alam, M. R. (2022). Impact of oil demand and supply shocks on the exchange rates of selected Southeast Asian countries. Global Finance Journal, 54, 100637. [Google Scholar] [CrossRef]
  25. Geng, J.-B., Liu, C., Ji, Q., & Zhang, D. (2021). Do oil price changes really matter for clean energy returns? Renewable and Sustainable Energy Reviews, 150, 111429. [Google Scholar] [CrossRef]
  26. Gong, X., Sun, Y., & Du, Z. (2022). Geopolitical risk and China’s oil security. Energy Policy, 163, 112856. [Google Scholar] [CrossRef]
  27. Hamilton, J. D. (1996). This is what happened to the oil price-macroeconomy relationship. Journal of Monetary Economics, 38(2), 215–220. [Google Scholar]
  28. Heston, S. L., & Sadka, R. (2008). Seasonality in the cross-section of stock returns. Journal of Financial Economics, 87(2), 418–445. [Google Scholar] [CrossRef]
  29. Hotchkiss, E. S., John, K., Mooradian, R. M., & Thorburn, K. S. (2008). Bankruptcy and the resolution of financial distress. Handbook of Empirical Corporate Finance, 2, 235–287. [Google Scholar] [CrossRef]
  30. Howe, J. S., & Houston, R. (2016). Earnings management, earnings surprises, and distressed firms. Accounting and Finance Research, 5(1), 1–64. [Google Scholar] [CrossRef][Green Version]
  31. Hsiao, C. (2022). Analysis of panel data. Cambridge University Press. [Google Scholar]
  32. IMF. (2015). IMF world economic outlook, October 2015. Available online: https://www.imf.org/en/Publications/WEO/Issues/2016/12/31/World-Economic-Outlook-October-2015-Adjusting-to-Lower-Commodity-Prices-43229 (accessed on 26 May 2025).
  33. International Energy Agency [IEA]. (2020). Global energy review 2020. Available online: https://www.iea.org/reports/global-energy-review-2020 (accessed on 26 May 2025).
  34. International Energy Agency [IEA]. (2024). Growth in global energy demand surged in 2024 to almost twice its recent average. Available online: https://www.iea.org/news/growth-in-global-energy-demand-surged-in-2024-to-almost-twice-its-recent-average?utm_source=chatgpt.com (accessed on 1 April 2025).
  35. Issa, S., Bizel, G., Jagannathan, S. K., & Gollapalli, S. S. C. (2024). A comprehensive approach to bankruptcy risk evaluation in the financial industry. Journal of Risk and Financial Management, 17(1), 41. [Google Scholar] [CrossRef]
  36. Ji, Y., Shi, L., & Zhang, S. (2022). Digital finance and corporate bankruptcy risk: Evidence from China. Pacific-Basin Finance Journal, 72, 101731. [Google Scholar] [CrossRef]
  37. Kallenos, T. L., Papakyriakou, P., Sakkas, A., & Taoushianis, Z. (2025). Tests of global flights to safety with US financial firm bankruptcy announcements. European Financial Management, 31(3), 1170–1194. [Google Scholar] [CrossRef]
  38. Karacan, R., Mukhtarov, S., Barış, İ., İşleyen, A., & Yardımcı, M. E. (2021). The impact of oil price on transition toward renewable energy consumption? Evidence from Russia. Energies, 14(10), 2947. [Google Scholar] [CrossRef]
  39. Khan, M. S. R., Yoshimura, H., & Kadoya, Y. (2024). Emotional instability and financial decisions: How neuroticism fuels panic selling. Risks, 12(12), 203. [Google Scholar] [CrossRef]
  40. Kilian, L., & Park, C. (2009). The impact of oil price shocks on the US stock market. International Economic Review, 50(4), 1267–1287. [Google Scholar] [CrossRef]
  41. Kitowski, J., Kowal-Pawul, A., & Lichota, W. (2022). Identifying symptoms of bankruptcy risk based on bankruptcy prediction models—A case study of Poland. Sustainability, 14(3), 1416. [Google Scholar] [CrossRef]
  42. Kocaarslan, B. (2024). US dollar and oil market uncertainty: New evidence from explainable machine learning. Finance Research Letters, 64, 105375. [Google Scholar] [CrossRef]
  43. Kozlovskyi, S., Petrunenko, I., Mazur, H., Butenko, V., & Ivanyuta, N. (2022). Assessing the probability of bankruptcy when investing in cryptocurrency. Investment Management & Financial Innovations, 19(3), 312. [Google Scholar]
  44. Le, H. A., & Do, D. T. (2022). The impacts of crude oil market structure on stock market growth: Evidence from Asian countries. Complexity, 2022(1), 6522367. [Google Scholar] [CrossRef]
  45. Li, F., Zhang, H., & Zheng, D. (2018). Seasonality in the cross section of stock returns: Advanced markets versus emerging markets. Journal of Empirical Finance, 49, 263–281. [Google Scholar] [CrossRef]
  46. Liu, K., Luo, C., & Li, Z. (2019). Investigating the risk spillover from crude oil market to BRICS stock markets based on Copula-POT-CoVaR models. Quantitative Finance and Economics, 3(4), 754–771. [Google Scholar] [CrossRef]
  47. Maghyereh, A., & Al-Zoubi, H. (2026). The effect of oil price uncertainty on the joint default risk of oil and natural gas companies. Energy Research Letters, 7. [Google Scholar] [CrossRef]
  48. Maghyereh, A. I., Awartani, B., & Bouri, E. (2016). The directional volatility connectedness between crude oil and equity markets: New evidence from implied volatility indexes. Energy Economics, 57, 78–93. [Google Scholar] [CrossRef]
  49. Manap, A., Ginting, R. U. B., Lubis, Z., Idris, N., & Mustangin, M. (2023). Stock price, return, and abnormal return differences before and after stock split in high and low profile companies listed on the Indonesian stock exchange. Al-Kharaj: Journal of Islamic Economic and Business, 5(1), 32–49. [Google Scholar] [CrossRef]
  50. Máté, D., Raza, H., & Ahmad, I. (2023). Comparative analysis of machine learning models for bankruptcy prediction in the context of pakistani companies. Risks, 11(10), 176. [Google Scholar] [CrossRef]
  51. Mensi, W., Rehman, M. U., & Al-Yahyaee, K. H. (2020). Time-frequency co-movements between oil prices and interest rates: Evidence from a wavelet-based approach. The North American Journal of Economics and Finance, 51, 100836. [Google Scholar] [CrossRef]
  52. Michalkova, L., & Ponisciakova, O. (2025). Bankruptcy prediction, financial distress and corporate life cycle: Case study of central European enterprises. Administrative Sciences, 15(2), 63. [Google Scholar] [CrossRef]
  53. Miller, D. L. (2023). An introductory guide to event study models. Journal of Economic Perspectives, 37(2), 203–230. [Google Scholar] [CrossRef]
  54. Muslim, M. A., & Dasril, Y. (2021). Company bankruptcy prediction framework based on the most influential features using XGBoost and stacking ensemble learning. International Journal of Electrical and Computer Engineering (IJECE), 11(6), 5549–5557. [Google Scholar] [CrossRef]
  55. Muzani, M., & Yuliana, I. (2021). Comparative analysis of Altman, Springate and Zmijewski models in predicting the bankruptcy of retail companies in Indonesia and Singapore. TIJAB (The International Journal of Applied Business), 5(1), 81–93. [Google Scholar] [CrossRef]
  56. Niu, X., Chen, W., & Wang, N. (2023). Spatiotemporal dynamics and topological evolution of the global crude oil trade network. Energies, 16(4), 1728. [Google Scholar] [CrossRef]
  57. Pham, L., & Nguyen, C. P. (2022). How do stock, oil, and economic policy uncertainty influence the green bond market? Finance Research Letters, 45, 102128. [Google Scholar] [CrossRef]
  58. Prusak, B., Morawska, S., Łukowski, M., & Banasik, P. (2022). The impact of bankruptcy regimes on entrepreneurship and innovation. Is there any relationship? International Entrepreneurship and Management Journal, 18(1), 473–498. [Google Scholar] [CrossRef]
  59. Prusak, B., & Potrykus, M. (2021). Short-term price reaction to filing for bankruptcy and restructuring proceedings—The case of Poland. Risks, 9(3), 56. [Google Scholar] [CrossRef]
  60. Rasheed, S. A. (2023). The impact of oil price volatility on economic growth and stability in Iraq through the public expenditure for the period (2003–2020). International Journal of Professional Business Review, 8(6), 17. [Google Scholar] [CrossRef]
  61. Ricca, L. T., Jucá, M. N., & Junior, E. H. (2021). Tax benefit and bankruptcy cost of debt. The Quarterly Review of Economics and Finance, 81, 82–92. [Google Scholar] [CrossRef]
  62. Rustan, D. (2021). Financial literacy, financial behavior and financial attitudes towards investment decisions and firm bankruptcy. ATESTASI: Jurnal Ilmiah Akuntansi, 4(1), 79–87. [Google Scholar]
  63. Sadorsky, P. (1999). Oil price shocks and stock market activity. Energy Economics, 21(5), 449–469. [Google Scholar] [CrossRef]
  64. Sari, K. R., Martini, R., Almira, N., Hartati, S., & Husin, F. (2022). Prediction of bankruptcy risk using financial distress analysis. Golden Ratio of Finance Management, 2(2), 77–86. [Google Scholar] [CrossRef]
  65. Sasikumar, S., & Sundaram, N. (2024). Event study methodology trends in the stock market: A systematic review based on bibliometric analysis. Multidisciplinary Reviews, 7(10), 2024234. [Google Scholar] [CrossRef]
  66. Seok, S., Cho, H., & Ryu, D. (2024). Dual effects of investor sentiment and uncertainty in financial markets. The Quarterly Review of Economics and Finance, 95, 300–315. [Google Scholar] [CrossRef]
  67. Shao, Y. (2025). The impact of news media sentiment on financial markets. Available online: https://papers.ssrn.com/sol3/papers.cfm?abstract_id=5236318 (accessed on 13 October 2025).
  68. Srebro, B., Mavrenski, B., Bogojević Arsić, V., Knežević, S., Milašinović, M., & Travica, J. (2021). Bankruptcy risk prediction in ensuring the sustainable operation of agriculture companies. Sustainability, 13(14), 7712. [Google Scholar] [CrossRef]
  69. Sukardi, D. (2021). The legal responsibility of debtor to payment curators in bankruptcy situation. Jurnal Pembaharuan Hukum, 8(2), 142–156. [Google Scholar] [CrossRef]
  70. Suryati, S., Sardana, L., & Disurya, R. (2022). Legal analysis of limited company which was submitted to bankruptcy. Nurani: Jurnal Kajian Syari’ah Dan Masyarakat, 22(1), 109–120. [Google Scholar] [CrossRef]
  71. Tang, Y., Xiao, X., Wahab, M., & Ma, F. (2021). The role of oil futures intraday information on predicting US stock market volatility. Journal of Management Science and Engineering, 6(1), 64–74. [Google Scholar] [CrossRef]
  72. Tao, Z., Li, T., Chen, Y., & Huang, X. (2025). Does geopolitical risks drive the extreme spillovers of bulk energy and chemical commodity. PLoS ONE, 20(6), e0326268. [Google Scholar] [CrossRef]
  73. Ullah, H., Wang, Z., Abbas, M. G., Zhang, F., Shahzad, U., & Mahmood, M. R. (2021). Association of financial distress and predicted bankruptcy: The case of Pakistani banking sector. The Journal of Asian Finance, Economics and Business, 8(1), 573–585. [Google Scholar]
  74. U.S. Bureau of Labor Statistics. (2025). Consumer prices up 2.3 percent from April 2024 to April 2025. Available online: https://www.bls.gov/opub/ted/2025/consumer-prices-up-2-3-percent-from-april-2024-to-april-2025.htm (accessed on 4 June 2025).
  75. U.S. Department of the Treasury. (2020). Economic impact payments. Available online: https://home.treasury.gov/policy-issues/coronavirus/assistance-for-american-families-and-workers/economic-impact-payments (accessed on 4 June 2025).
  76. Vavrek, R., Kravčáková Vozárová, I., & Kotulič, R. (2021). Evaluating the financial health of agricultural enterprises in the conditions of the Slovak Republic using bankruptcy models. Agriculture, 11(3), 242. [Google Scholar] [CrossRef]
  77. Voda, A. D., Dobrotă, G., Țîrcă, D. M., Dumitrașcu, D. D., & Dobrotă, D. (2021). Corporate bankruptcy and insolvency prediction model. Technological and Economic Development of Economy, 27(5), 1039–1056. [Google Scholar] [CrossRef]
  78. Vukčević, M., Lakićević, M., Melović, B., Backović, T., & Dudić, B. (2024). Modern models for predicting bankruptcy to detect early signals of business failure: Evidence from Montenegro. PLoS ONE, 19(5), e0303793. [Google Scholar] [CrossRef]
  79. Wang, Z., Li, R., & Kong, Q. (2024). Shanghai oil futures prices and firms’ investment decisions: Evidence from Chinese manufacturing firms. Energy Economics, 134, 107560. [Google Scholar] [CrossRef]
  80. Wei, Y., Sun, S., Ma, J., Wang, S., & Lai, K. K. (2019). A decomposition clustering ensemble learning approach for forecasting foreign exchange rates. Journal of Management Science and Engineering, 4(1), 45–54. [Google Scholar] [CrossRef]
  81. Wen, F., Zhang, K., & Gong, X. (2021). The effects of oil price shocks on inflation in the G7 countries. The North American Journal of Economics and Finance, 57, 101391. [Google Scholar] [CrossRef]
  82. Wooldridge, J. M. (2016). Introductory econometrics: A modern approach (6th ed.). Cengage Learning. [Google Scholar]
  83. Wu, B., Wang, L., Wang, S., & Zeng, Y.-R. (2021). Forecasting the US oil markets based on social media information during the COVID-19 pandemic. Energy, 226, 120403. [Google Scholar] [CrossRef] [PubMed]
  84. Wu, Y., & Wang, X. (2024). The cross section of information transmission in news media and stock returns. Finance Research Letters, 67, 105780. [Google Scholar] [CrossRef]
  85. Yang, Y., Liu, Z., Saydaliev, H. B., & Iqbal, S. (2022). Economic impact of crude oil supply disruption on social welfare losses and strategic petroleum reserves. Resources Policy, 77, 102689. [Google Scholar] [CrossRef]
  86. Yin, L., & Ma, X. (2018). Causality between oil shocks and exchange rate: A Bayesian, graph-based VAR approach. Physica A: Statistical Mechanics and Its Applications, 508, 434–453. [Google Scholar] [CrossRef]
Figure 1. Listed Energy Companies in New York and NASDAQ Stock Exchange Filed in the Period Between 2015 and 2021.
Ijfs 14 00129 g001
Table 1. Wilcoxon Signed-Rank Test for NYSE- and NASDAQ-Listed Firms.
Events WindowsNew York Stock ExchangeNASDAQ Stock Exchange
WSR p-ValueMedianWSR p-ValueMedian
−1, −100.20130.20.95−0.79
−1, −50.2148.50.8744.24
−20.1426.50.50−3.77
−10.396.50.876.22
00.958.30.3522.61
10.8910.40.1915.65
20.1124.00.57−7.83
1, 50.75−14.20.10 *36.24
1, 100.09 *40.50.05 **97.87
***, **, and * indicate significance at the 1, 5, and 10% levels, respectively.
Table 2. Panel Regression Results for NYSE- and NASDAQ-Listed Firms.
Events WindowsNew York Stock ExchangeNASDAQ Stock Exchange
Regress p-ValueCoefficientRegress p-ValueCoefficient
−1, −100.09 *86.630.62−32.7
−1, −50.07 *93.50.93−5.09
−20.6424.50.944.71
−10.6920.20.71−24.01
0Base-WindowBase-Window
10.82120.2379.93
20.4539.60.8810.10
1, 50.41430.02 **150.83
1, 100.02 **117.10.00 ***199.57
_cons0.83−8.40.84−9.3
***, **, and * indicate significance at the 1, 5, and 10% levels, respectively.
Disclaimer/Publisher’s Note: The statements, opinions and data contained in all publications are solely those of the individual author(s) and contributor(s) and not of MDPI and/or the editor(s). MDPI and/or the editor(s) disclaim responsibility for any injury to people or property resulting from any ideas, methods, instructions or products referred to in the content.