Article

Mapping Firm Debt and Productivity with Spatial Analysis in the Visegrad Countries

1
Doctoral School of Regional- and Business Administration Sciences, Széchenyi István University, Egyetem Sq. 1., 9026 Győr, Hungary
2
Kautz Gyula Faculty of Business and Economics, Széchenyi István University, Egyetem Sq. 1., 9026 Győr, Hungary
*
Author to whom correspondence should be addressed.
Int. J. Financ. Stud. 2026, 14(3), 64; https://doi.org/10.3390/ijfs14030064
Submission received: 2 December 2025 / Revised: 30 January 2026 / Accepted: 5 February 2026 / Published: 4 March 2026
(This article belongs to the Special Issue Financial Stability in Light of Market Fluctuations)

Abstract

Economic crises significantly restrict corporate access to external financing, and regional differences in recovery capacity deserve close attention. This study examines the financial structure and debt of large enterprises in the Visegrád Four (V4) countries (Hungary, Czechia, Poland, Slovakia), focusing on firms with annual revenues above €10 million. Using data from 2021 to 2023, the analysis explores the relationship between corporate debt—including total debt and loan volumes—and regional economic characteristics at the NUTS 3 level. Financial indicators are assessed in comparison with regional productivity data and a sector-specific specialization index sourced from Eurostat. The analysis targets the post-COVID-19 recovery period, which significantly influenced corporate financial behavior. The results indicate that corporate debt increased sharply at the onset of the COVID-19 pandemic and subsequently declined, while remaining strongly concentrated in capital regions. Higher firm concentration and employment scale are associated with greater regional indebtedness, whereas stronger productive capacity is linked to lower reliance on external debt outside metropolitan cores. Overall, the findings highlight pronounced structural and regional heterogeneity, illustrating how spatial concentration and underlying regional characteristics shape corporate debt dynamics during periods of economic stress.
JEL Classification:
F65; G21; G32

1. Introduction

Hungary, the Czech Republic, Slovakia, and Poland, collectively known as the Visegrad Four (V4), play a central role in the economic landscape of Central and Eastern Europe. The transition of the four economies from centrally planned systems to market economies required profound structural and institutional changes that shaped long-run patterns of economic vulnerability (Svejnar, 2002). Rapid market opening and financial liberalization during the 1990s, followed by simultaneous accession to the European Union in 2004, expanded access to external finance and markets. EU integration is commonly associated with stronger investor confidence and improved access to external finance, but it may also reinforce reliance on cross-border capital flows and externally driven growth models, particularly in Central and Eastern Europe (Alcidi et al., 2024; Medve-Bálint & Éltető, 2024).
Research on post-socialist transition economies documents high sensitivity to financial crises. Against the background, large and frequently volatile inflows of foreign capital have historically distorted balance-of-payments positions and increased exposure to external shocks (Brada & Tomsik, 2003). Limited institutional and financial maturity has been associated with more pronounced credit cyclicality, as banks tend to contract corporate lending more sharply during economic downturns (Bank for International Settlements, 2025; Montañez-Enríquez et al., 2024). During the 2008–2009 crisis, firms across Central and Eastern Europe significantly curtailed innovation activity, which revealed strong constraints in adaptive capacity (Friz & Guenther, 2021). Crisis effects persist more strongly where governments command limited fiscal space, and institutional stability remains fragile (Furceri & Zdzienicka, 2011).
Over the past three decades theV4 economies moved away from broadly comparable starting positions and followed increasingly divergent development paths. Historical legacies, policy choices, and the timing and quality of reforms produced marked differences in growth trajectories, industrial structures, and state capacities (Kant, 2025). All four countries integrated into the European Union and global value chains (Dyker, 2001), yet crisis management strategies and spatial economic patterns developed along distinct lines, including different forms of territorial concentration and sectoral specialization (Kaniok & Hloušek, 2025).
The COVID-19 pandemic generated unprecedented economic disruption and exposed pronounced national and regional asymmetries in crisis-management capacity. Unlike earlier crises, the pandemic created a quasi-natural experiment that allows comparison of reactions by economies with broadly similar initial conditions when confronted with a common and simultaneous shock (Römisch, 2020). Corporate lending, employment, and structural characteristics acted as primary channels through which resilience or fragility materialized. Structural and regulatory features played a particularly salient role and helped identify mechanisms that either amplified or moderated the shock (Bailey et al., 2021).
Several motivations have prompted the research. First, despite extensive cross-country analyses of crisis impacts in Central and Eastern Europe, there is limited comparative evidence on how territorial economic structures shape the transmission and persistence of shocks across regions in the V4, particularly during the COVID-19 period.
During the 2008 financial crisis, the absence of a unified European strategy complicated crisis management in Central and Eastern Europe and led to heterogeneous policy effectiveness across member states (Végh, 2013). Drawing on a comparative assessment of pre-crisis fiscal positions, financial structures, and sectoral exposures, Hárskúti (2012) shows that Poland entered the global financial crisis with relatively stronger macroeconomic fundamentals and policy space, while the Czech Republic experienced a relative slowdown in convergence. Slovakia’s high dependence on the automotive industry increased its cyclical vulnerability, whereas Hungary combined elevated public debt, extensive foreign-currency lending, and limited fiscal room for countercyclical policy responses. In the COVID-19 period, operating principles appeared similar, yet Poland’s lower automotive exposure reduced its vulnerability (Kovács & Zsigmond, 2020). The effects of the Pandemic are visible not only in corporate lending but also in employment dynamics, a core indicator of macroeconomic adaptability in the V4 (Poór et al., 2025; Zieliński, 2022). The EBRD (European Bank for Reconstruction and Development (EBRD), 2021) identifies shared priorities for recovery (green transition, digitalization, research and development, and infrastructure) that advanced unevenly because of differences in institutional capacity and financing schedules. Corporate lending plays an especially important role during crises, since the level of credit directly affects investment, growth prospects, and firm survival (Beck et al., 2008; Tondl, 2016). When financing tightens, the impact varies by country and region (Duchin et al., 2010), which motivates a granular spatial analysis of lending patterns.
Second, while prior research links regional development and industrial structure to differential economic adjustment, there is limited empirical evidence on how territorial disparities and sectoral specialization translate into heterogeneous financial exposure and post-shock adjustment patterns at the regional level. Prior research indicates that regional development and industrial composition influence adaptability in two directions. More advanced and diversified regions tend to absorb economic shocks more quickly, reflecting stronger structural resilience (Ezcurra et al., 2006), while excessive specialization increases vulnerability because crises can strongly affect economies built around a narrow set of key sectors (Dzemydaitė, 2021; Zapreskó-Farkas, 2024). These insights justify an explicit examination of how sectoral specialization relates to financial vulnerability and adjustment dynamics at NUTS 3 level.
Third, several existing studies rely on aggregated territorial units, which can obscure meaningful regional heterogeneity and limit insights into spatial variation in corporate financial adjustment during crises. A finer territorial resolution reveals spatial differences and supports targeted, place-sensitive interventions. The World Bank (Kilroy & Ganau, 2020) likewise recommends fine-grained geographic lenses for cohesion policy and development funding because such lenses allow measures tailored to specific regional needs and opportunities. Understanding these differences is particularly important for interpreting spatial variation in corporate lending and for tracing how crisis episodes, especially COVID-19, reshaped firms’ financial structures.
A growing literature documents the corporate and macroeconomic consequences of COVID-19, highlighting disruptions to firm performance and economic adjustment prosess (Brada et al., 2021). The present study contributes an unusually large database that covers more than 15,000 medium and large firms and provides over 76,000 observations for 2019 to 2023. The scope enables direct comparisons across the pre-COVID, COVID, and post-COVID phases and allows tracking of changes in firm-level and territorial indicators over time. The analysis focuses on observable financial adjustment patterns—specifically changes in corporate debt—following a common exogenous shock. The term resilience is therefore used in a narrow, descriptive sense and does not imply a full assessment of regional adaptive capacity, such as the concept of Martin (2012).
The methodology is quantitative. The analysis uses firm-level financials and economic indicators for 2019 to 2023 from the EMIS corporate database, aggregated to NUTS 3 regions for the V4 countries (Hungary, the Czech Republic, Slovakia, and Poland). Core variables include the number of firms, revenues, loan stocks, and EBITDA. To assess economic performance and labor market scale, the study benchmarks these data against Eurostat measures of gross value added (GVA) and employment. To gauge spatial concentration of corporate structures, the Krugman specialization index is applied, and QGIS ver. 3.40.13 is used for geographic visualization. Resilience is operationalized as the sensitivity and recovery of key indicators relative to a 2019 baseline, measured by the level and growth of corporate credit, revenues, and employment. The design supports an integrated assessment of COVID-19 impacts at both macroeconomic and spatial scales.
The paper proceeds as follows. After the introduction, the relevant literature and the theoretical framework are reviewed, followed by the research questions and the detailed methodology. The empirical results then appear, and the paper closes with conclusions and policy recommendations. The findings can inform institutions that shape regional development policy and corporate support instruments, and can assist policymakers who aim to reduce territorial inequalities and to understand the evolution of firms’ financial structures.

2. Literature Review

2.1. Economic and Spatial Effects of Crisis and Resilience

Post-socialist economies implemented profound institutional and financial reforms during the transition to market systems. The reform process continues to shape macro-financial vulnerability and regional development trajectories. Svejnar (2002) shows that the early years of transition combined rapid market opening with institutional instability and heavy reliance on foreign capital. Large-scale capital inflows distorted external balances and increased sensitivity to global shocks, while the dominance of foreign-owned banks has been associated with stronger external dependence in Central and Eastern Europe (Brada & Tomsik, 2003). Daniel and Jones (2007) demonstrate in their dynamic model that the initial phase of financial liberalization typically coincides with rapid credit expansion and rising risk-taking, developments that raise the probability of crises. This mechanism appears particularly salient in Central and Eastern Europe, where financial liberalization and EU integration occurred at the same time. Becker et al. (2010) argue that EU accession improved macroeconomic stability but did not generate autonomous financial deepening, so the region continued to rely on a dependent growth model. The macro-financial configuration described in these studies contributed to a sharp decline in lending and investment during the 2008–2009 crisis and exposed a high degree of cyclical fragility in post-socialist economies.
Regional and macroeconomic research analyses how such crises reshape economies and societies in space. The international literature shows that shocks affect countries and regions to different degrees, and that the variation depends on industrial structure, development level, institutional quality, and the degree of specialization. Analyses of post-socialist industrial concentration indicate that Poland sustained growth with more moderate regional specialization, while Hungary, Slovakia, and the Czech Republic experienced rising concentration in manufacturing and construction between 2000 and 2007. Concentration supported development in some places, but excessive specialization became a barrier elsewhere and increased structural vulnerability (Hegyi-Kéri, 2013). NUTS 3 evidence for the V4 further suggests that economically stronger regions were hit harder by the 2008 financial crisis because they hosted nationally critical industries that were more exposed to global shocks (Zapreskó-Farkas, 2024).
Studies of Central and Eastern Europe also point to clusters of high-performing regions that adjust more quickly in downturns and reconfigure their structures in adaptive ways. Positive regional spillovers support the persistence of these clusters and can sustain or widen spatial disparities. In the recovery from COVID-19, an integrated regional approach became necessary. Countries that need tight coordination between economic and social policy and the European Union’s regional support funds, which are central to financing in Central and Eastern Europe, should be steered toward structural transformation and flexibility to strengthen resilience (Brada et al., 2021). Data for EU member states from 2010 to 2020 show that the pandemic reversed earlier convergence in GDP growth rates. Output fell less in more advanced countries, while unemployment moved along different paths. Employment gaps narrowed temporarily in the first year of the pandemic, but structural inequalities persisted over a longer horizon (Abraham et al., 2021). At the firm level, recent evidence from Visegrad Group countries further shows that the COVID-19 pandemic as a major macroeconomic shock led to significant and heterogeneous changes in corporate debt levels and financial stability, reinforcing the importance of analyzing crisis impacts in a regionally and structurally differentiated Central and Eastern European context (Gajdosikova et al., 2025).
GDP remains the anchor metric in the allocation of cohesion policy funds, yet several studies argue that it does not capture territorial differences in social welfare and vulnerability. The economic and social effects of COVID-19 justify the use of multidimensional indices that also account for poverty rates, the quality of education and health services, and political stability (Sánchez & Jiménez-Fernández, 2023). NUTS 3 work also highlights the role of innovation. For EU-27 and the United Kingdom between 2002 and 2022, regions with a sectoral mix close to the aggregate average appear particularly sensitive to the effects of innovation investment. The interaction of innovation capacity and economic diversification supports sustainable growth, especially where infrastructure and skills are in place (Weinel & Cajias, 2025).
The analysis of territorial specialization and resilience builds on core frameworks in regional economics. Krugman’s Geography and Trade provides the foundation for understanding how spatial concentration arises and how specialization and agglomeration can create both competitive advantages and risks for regions (Krugman, 1991). The Krugman specialization index measures how far a region’s sectoral composition deviates from that of a reference group, which makes it an indicator of relative specialization. Values range from 0 (indicating an identical structure to the benchmark) to 1 (reflecting complete divergence). Later applications show that the index is well-suited to evaluate the extent of specialization in European regions and its implications for resilience (Midelfart et al., 2004; Palan, 2010). Evidence from the smart specialization literature underscores that neither specialization nor diversification guarantees growth by itself. Place-based design, flexible policy, and support for restructuring are essential for sustainable development (Dzemydaitė, 2021).
Convergence and specialization processes within the European Union reveal limited real convergence, meaning that poorer regions sometimes grow faster. Specialization patterns in Central and Eastern Europe differ from those in Western Europe, which has consequences for resilience (Marelli, 2007). Over longer horizons, production structures show signs of convergence as highly specialized regions move closer to the EU average, yet geography, market access, and region size remain decisive determinants (Ezcurra et al., 2006). The experience of 2008 confirms that regions concentrating key industries proved more exposed to global shocks (Zapreskó-Farkas, 2024).
The economic dominance of capital regions in Central and Eastern Europe intensified after the transition and generated persistent regional disparities across the post-socialist space. Faludi (2006) explains that the European Union’s territorial cohesion agenda sought to counter such imbalances by promoting more polycentric territorial development. Evidence from the financial sector confirms a strong link between capital-city dominance and regional inequalities. Karkowska and Pawłowska (2017) document that banking activity, financial intermediation, and credit allocation remain heavily concentrated in capital regions in several CEE economies. Such spatial concentration strengthens the economic power of metropolitan centers and raises systemic vulnerability, because regions dependent on a single dominant financial hub tend to experience sharper fluctuations and weaker adjustment capacity during crises. More recent research indicates that the spatial concentration of advanced and financial services has deepened across Europe. Bourdeau-Lepage (2007) shows that Central and Eastern European capital cities, including Budapest, Prague, and Warsaw, host a disproportionately high share of advanced producer services, which reinforces spatial inequality and shapes regional economic trajectories.

2.2. Macroeconomic Significance of Corporate Lending

Government support measures, including state-guaranteed loans, moratoria, subsidized credit schemes, and liquidity facilities, mitigated short-term financial stress during the pandemic (European Bank for Reconstruction and Development (EBRD), 2021). At the same time, firm-level and financial market evidence shows that these interventions contributed to a temporary increase in corporate indebtedness (Gopalakrishnan et al., 2022; Pagano & Zechner, 2022). Over the medium term, these interventions aimed to restore financing stability and strengthen economic resilience.
Corporate capital structure and lending are not only preconditions for firm operation and growth. They also shape macroeconomic outcomes, in particular the trajectory of economic growth and the effectiveness of crisis responses. The literature shows that financial intermediation supports development and can help reduce income inequality (Beck et al., 2008). Long-horizon studies document a stable relationship between real-economy credit and nominal GDP (Ryan-Collins et al., 2016). In the euro area, lending to small- and medium-sized enterprises is central to growth, and expanding credit to nonfinancial corporations directly stimulates performance and investment (Tondl, 2016; Vasilyeva et al., 2021). For Hungary, the Czech Republic, and Poland, access to external finance plays a key role in firm growth, especially when internal funds are insufficient. The effects, however, depend on country-specific financial and institutional environments (Lee, 2023).
During crises, financing constraints tighten. The literature identifies both supply-side and demand-side channels. On the supply side, financial disruptions lead firms to increase cash holdings, rely more on internal finance, and reduce dividend payouts (Akbar et al., 2017; Bliss et al., 2015; Duchin et al., 2010). On the demand side, firms may postpone or cancel investment because of heightened uncertainty and weaker expectations (Kahle & Stulz, 2013). After a crisis, older firms typically regain access to credit more easily, while higher-risk firms and small- and medium-sized enterprises that face debt or EBITDA constraints often turn to alternative finance, including informal lending or interfirm credit (Casey & O’Toole, 2014; Cowling et al., 2016; Kariya, 2022). Tighter bank lending conditions can raise corporate bond issuance, particularly in euro area countries with more developed debt markets (Kaya & Wang, 2016). Recent evidence focusing on small- and medium-sized enterprises in Central and Eastern Europe shows that the relevance and predictive importance of financial health and indebtedness indicators vary systematically across different phases of the economic cycle, underscoring that financing constraints and firm responses are inherently time- and cycle-dependent rather than stable over time (Durana et al., 2025b).
Bank lending frictions were especially salient during COVID-19. Using data for 19 countries, Khan (2022) shows that firms already facing stricter bank terms before the pandemic were more likely to experience cash flow stress, payment arrears, and limited access to bank funding, promoting many firms to substitute toward trade credit and delayed payments to ease liquidity pressures. In contrast, Martins et al. (2024) document that government support measures, including state-guaranteed loans and debt payment moratoria, played a central role, and they increased firm indebtedness during the pandemic phase. The monetary tightening that began in 2022 raised funding costs and compressed debt capacity, reflecting tighter financial conditions and rising policy rates across advanced economies (Bank for International Settlements, 2025). The above dynamics strengthen the case for analyzing corporate lending with spatial detail, since the incidence of constraints and the adjustment margins differ across regions and sectors within the V4 economies.

3. Methodology

3.1. Data and Sample Definition

The study evaluates the medium- and large-enterprise segment in the V4 economies with a focus on firms that carry meaningful economic weight. Firm-level data for the four countries were extracted from the EMIS database for all companies with annual revenue above 10 million euros. Applying the 10 million euro threshold aligns with the European Commission’s upper bound for the small enterprise category (European Commission, 2020). Above this threshold, firms must prepare detailed annual financial statements under Directive 2013/34/EU, which include disclosures on liabilities and indebtedness (European Parliament and the Council, 2013).
According to Eurostat (2019), medium-sized firms with 50 to 249 employees and revenues above 10 million euros, together with large firms with at least 250 employees and revenues above 50 million euros, account for only 1.1 percent of the business population, yet provide 51.6 percent of employment and 64.7 percent of value added. The statistics confirm that the revenue-based selection covers the principal actors behind economic performance and labor market outcomes.
Across the five study years, we retrieved 136,054 firm records from EMIS for the V4. Among these, 15,238 firms had available reports in all five years, which yielded 76,190 firm-year observations that constitute a balanced five-year panel and the analytical backbone. The balanced panel structure reflects a deliberate focus on firms with continuous financial reporting and does not capture firm exit or entry during the period. Relative to the stock of medium and large firms, the sampling coverage is substantial. Based on statistics, the V4 included 37,664 firms in this size class (Eurostat, 2025). Table 1 reports the number of firms in the analytical panel and the coverage ratio by country, which we refer to later in Section 4 when interpreting geographic representativeness.
Firms were assigned to NUTS 3 regions using the postal code and registered office fields available in EMIS. The NUTS 3 resolution supports detailed analysis of regional economic differences and allows systematic comparison of corporate structures, financial indicators, and development levels across territories. Understanding these differences is especially relevant for corporate lending and its spatial variation, and for tracing how crises, most notably COVID-19, affected capital structure. Regional weights and benchmarks rely on Eurostat regional accounts, which provide internationally harmonized measures and ensure comparability across the V4 and the wider European Union (Eurostat, 2025). The NUTS 3 level analytical dataset underlying the empirical analysis is provided in the Supplementary Materials.
The observation window from 2019 to 2023 provides a continuous five-year timeline that is long enough to detect meaningful changes in liabilities and indebtedness (Suta et al., 2025). The window spans the 2020–2021 pandemic shock and the subsequent recovery. Data for 2022 to 2023 enable an assessment of reversion toward pre-pandemic levels and the identification of persistent structural shifts. This structure allows for a consistent comparison of pre-shock, shock, and post-shock dynamics within a single empirical framework.

3.2. Variables, Measurement, and Descriptive Diagnostics

The empirical analysis combines firm-level aggregates and regional economic indicators to explain differences in corporate financial debt across NUTS 3 regions. An overview of variable definitions and measurement units is provided in Table 2.
Corporate indebtedness is measured by financial debt (DEBT), which serves as the dependent variable in the regression analysis. Firm presence and economic scale are captured by the number of firms in the region (COUNT) and the total operating revenues (REV) aggregated at the regional level. Together, these variables proxy agglomeration intensity and the overall scale of corporate activity, which are expected to be closely related to the level of external financing. In addition, average EBITDA margin (AVG_EBITDA%) is included as a profitability control to account for internal financing capacity at the firm population level.
Regional economic performance is described using gross value added (GVA), employment (EMPL), and labor productivity (PROD/CAP). GVA measures the level of regional value creation and output, while EMPL captures the scale of labor input and labor market adjustment capacity. PROD/CAP reflects efficiency and income-generating potential and provides an indirect measure of internal financing strength. Together, indicators characterize regional productivity rather than representing interchangeable measures of economic size.
Pairwise correlations indicate strong co-movement between GVA and EMPL (Spearman’s rho = 0.946, p < 0.01) at the NUTS 3 regional level, which reflects a close relationship between regional output and labor input. While such high correlation warrants careful consideration, it is not treated as a sufficient reason for excluding either variable. First, standard econometric guidance emphasizes that high pairwise correlation alone is neither a necessary nor a sufficient condition for harmful multicollinearity in multivariate settings (Gujarati, 2009). Instead, the practical relevance of collinearity depends on its consequences for estimation and inference. Second, diagnostic criteria focus on coefficient behavior rather than correlation levels. As noted by Kennedy (2008), problematic multicollinearity typically manifests through unstable coefficient signs, inflated standard errors, or strong sensitivity to small specification changes. These diagnostics provide a more informative basis for variable selection than correlation thresholds. Third, bootstrap-based inference is used to assess sampling stability directly. Resampling methods are particularly well suited to identifying coefficient instability, as wide bootstrap distributions, confidence intervals spanning zero, or highly specification-dependent p-values indicate fragile estimates (Tibshirani & Efron, 1993). In this study, excluding employment is associated with a loss of robustness of the GVA coefficient under bootstrap inference, whereas retaining both variables results in more stable estimates. Finally, the joint inclusion of GVA and EMPL is supported by their distinct conceptual roles. While GVA captures regional output and value creation, EMPL reflects labor-market scale and adjustment capacity. Retaining both variables, therefore, aligns with the principle that control variables should be included based on clear conceptual relevance rather than statistical significance alone (Angrist & Pischke, 2009). Taken together, these considerations justify the inclusion of both variables despite strong co-movement.
In addition to financial metrics, we incorporate the Krugman Specialization Index (KSI) to capture specialization patterns. The index measures the divergence between a region’s sectoral structure and a chosen benchmark, with values close to 0 indicating high similarity and values near 1 indicating stronger divergence and hence greater specialization (Krugman, 1991; Palan, 2010). In this study, index values come directly from Eurostat at NUTS 3, using the national sectoral structure as the benchmark for each country. This design follows established European applications and preserves cross-country comparability (Longhi et al., 2004; Midelfart et al., 2004).
To describe the basic characteristics of the variables, we conducted a descriptive statistical analysis including means, medians, standard deviations, minimum–maximum ranges, and quartiles. The results are summarized in Table 2, which reports the distributional properties and normality diagnostics of the variables. All variables display strong right-skewness, as confirmed by the significant Shapiro-Wilk statistics (p < 0.001). Large gaps between mean and median further indicate asymmetric, heavily skewed distributions. Wide dispersions and large minimum–maximum intervals highlight substantial corporate and territorial heterogeneity within the V4.
For REV, extreme upper-tail values pull the means upward, while medians remain much lower. This indicates that a small number of very large firms dominate the economic structure, whereas most firms operate at considerably smaller scales. The same pattern appears for DEBT, where maximum values exceed minimum values by factors of over 200, suggesting extreme variation in balance-sheet size across firms and regions.
The Krugman Index (KURG) ranges from 0.12 to 0.95, signaling substantial variation in territorial specialization within the V4. The average value (0.35) implies moderate specialization overall, while the high maximum indicates highly concentrated industrial structures, particularly in selected Polish and Hungarian regions.

3.3. Empirical Strategy and Research Design

We formulate three research questions that address the spatial distribution of corporate debt, its change over time, and its determinants at the intersection of the firm level and macro indicators. Each question is paired with a testable hypothesis and an associated method. Distributional diagnostics from Table 3 motivate nonparametric inference as the primary approach. Where appropriate, parametric results are reported as robustness checks. Table 4 summarizes the design and will be referenced when presenting the empirical results.
Data processing included harmonization of currency units and time labels, de-duplication, and consistency screening across EMIS and Eurostat. Regional assignments were verified by cross-checking postal codes and official locality names. Records with missing core fields were excluded listwise. Outliers were retained for descriptive coverage but handled with robust and bootstrap procedures in inference. Cartographic rendering was performed in the QGIS ver 3.40.13 software.

4. Results

4.1. Concentration of Debt and Spatial Patterns of Economic Indicators

The concentration of corporate and economic activity in the capital NUTS 3 regions shows considerable variation across the V4 countries, yet a general pattern emerges: a substantial share of national economic performance is tied to the capital regions. As Table 5 illustrates, the share of firms located in these regions is high in all four countries, though to differing degrees. Budapest hosts 40.9% of all firms, Prague 30%, Bratislava 36.6%, while Warsaw accounts for only 21.6%. This primary structural difference strongly shapes the subsequent performance indicators.
The distribution of corporate revenues reveals even more pronounced disparities. In Hungary, nearly 54% of all corporate revenues originate from firms based in Budapest—the highest share in the region. The dominance of Prague and Bratislava is also significant (42–45%), whereas in Poland, the capital-region revenue share is only 26.4%. This indicates that Poland has a far more polycentric economic structure, while Hungary’s corporate and financial activity is concentrated in a single metropolitan center.
Corporate debt shares follow a similar pattern. Firms in Budapest account for 53.8% of total corporate debt, while Warsaw contributes 45.7%, which, considering Poland’s size, further supports the interpretation of a more decentralized financial geography. In the Czech Republic and Slovakia, the capital-region debt share ranges between 45% and 63%, pointing to strong financial dominance in these capital regions.
GVA reveals the structural significance of capital regions. Budapest generates 36.9% of Hungary’s national GVA, Prague 27.7% of the Czech total, and Bratislava 28.3% of Slovakia’s. In contrast, the Warsaw region accounts for only 13.8% of Poland’s national GVA, demonstrating the comparatively smaller economic role of Poland’s capital within its national structure. The four countries exhibit a marked degree of capital-city concentration, yet Hungary stands out as the most centralized economic system among the V4. The observed patterns are consistent with the broader European trends and theoretical perspectives placing a dominant economic role on capital regions (Meijers et al., 2007).
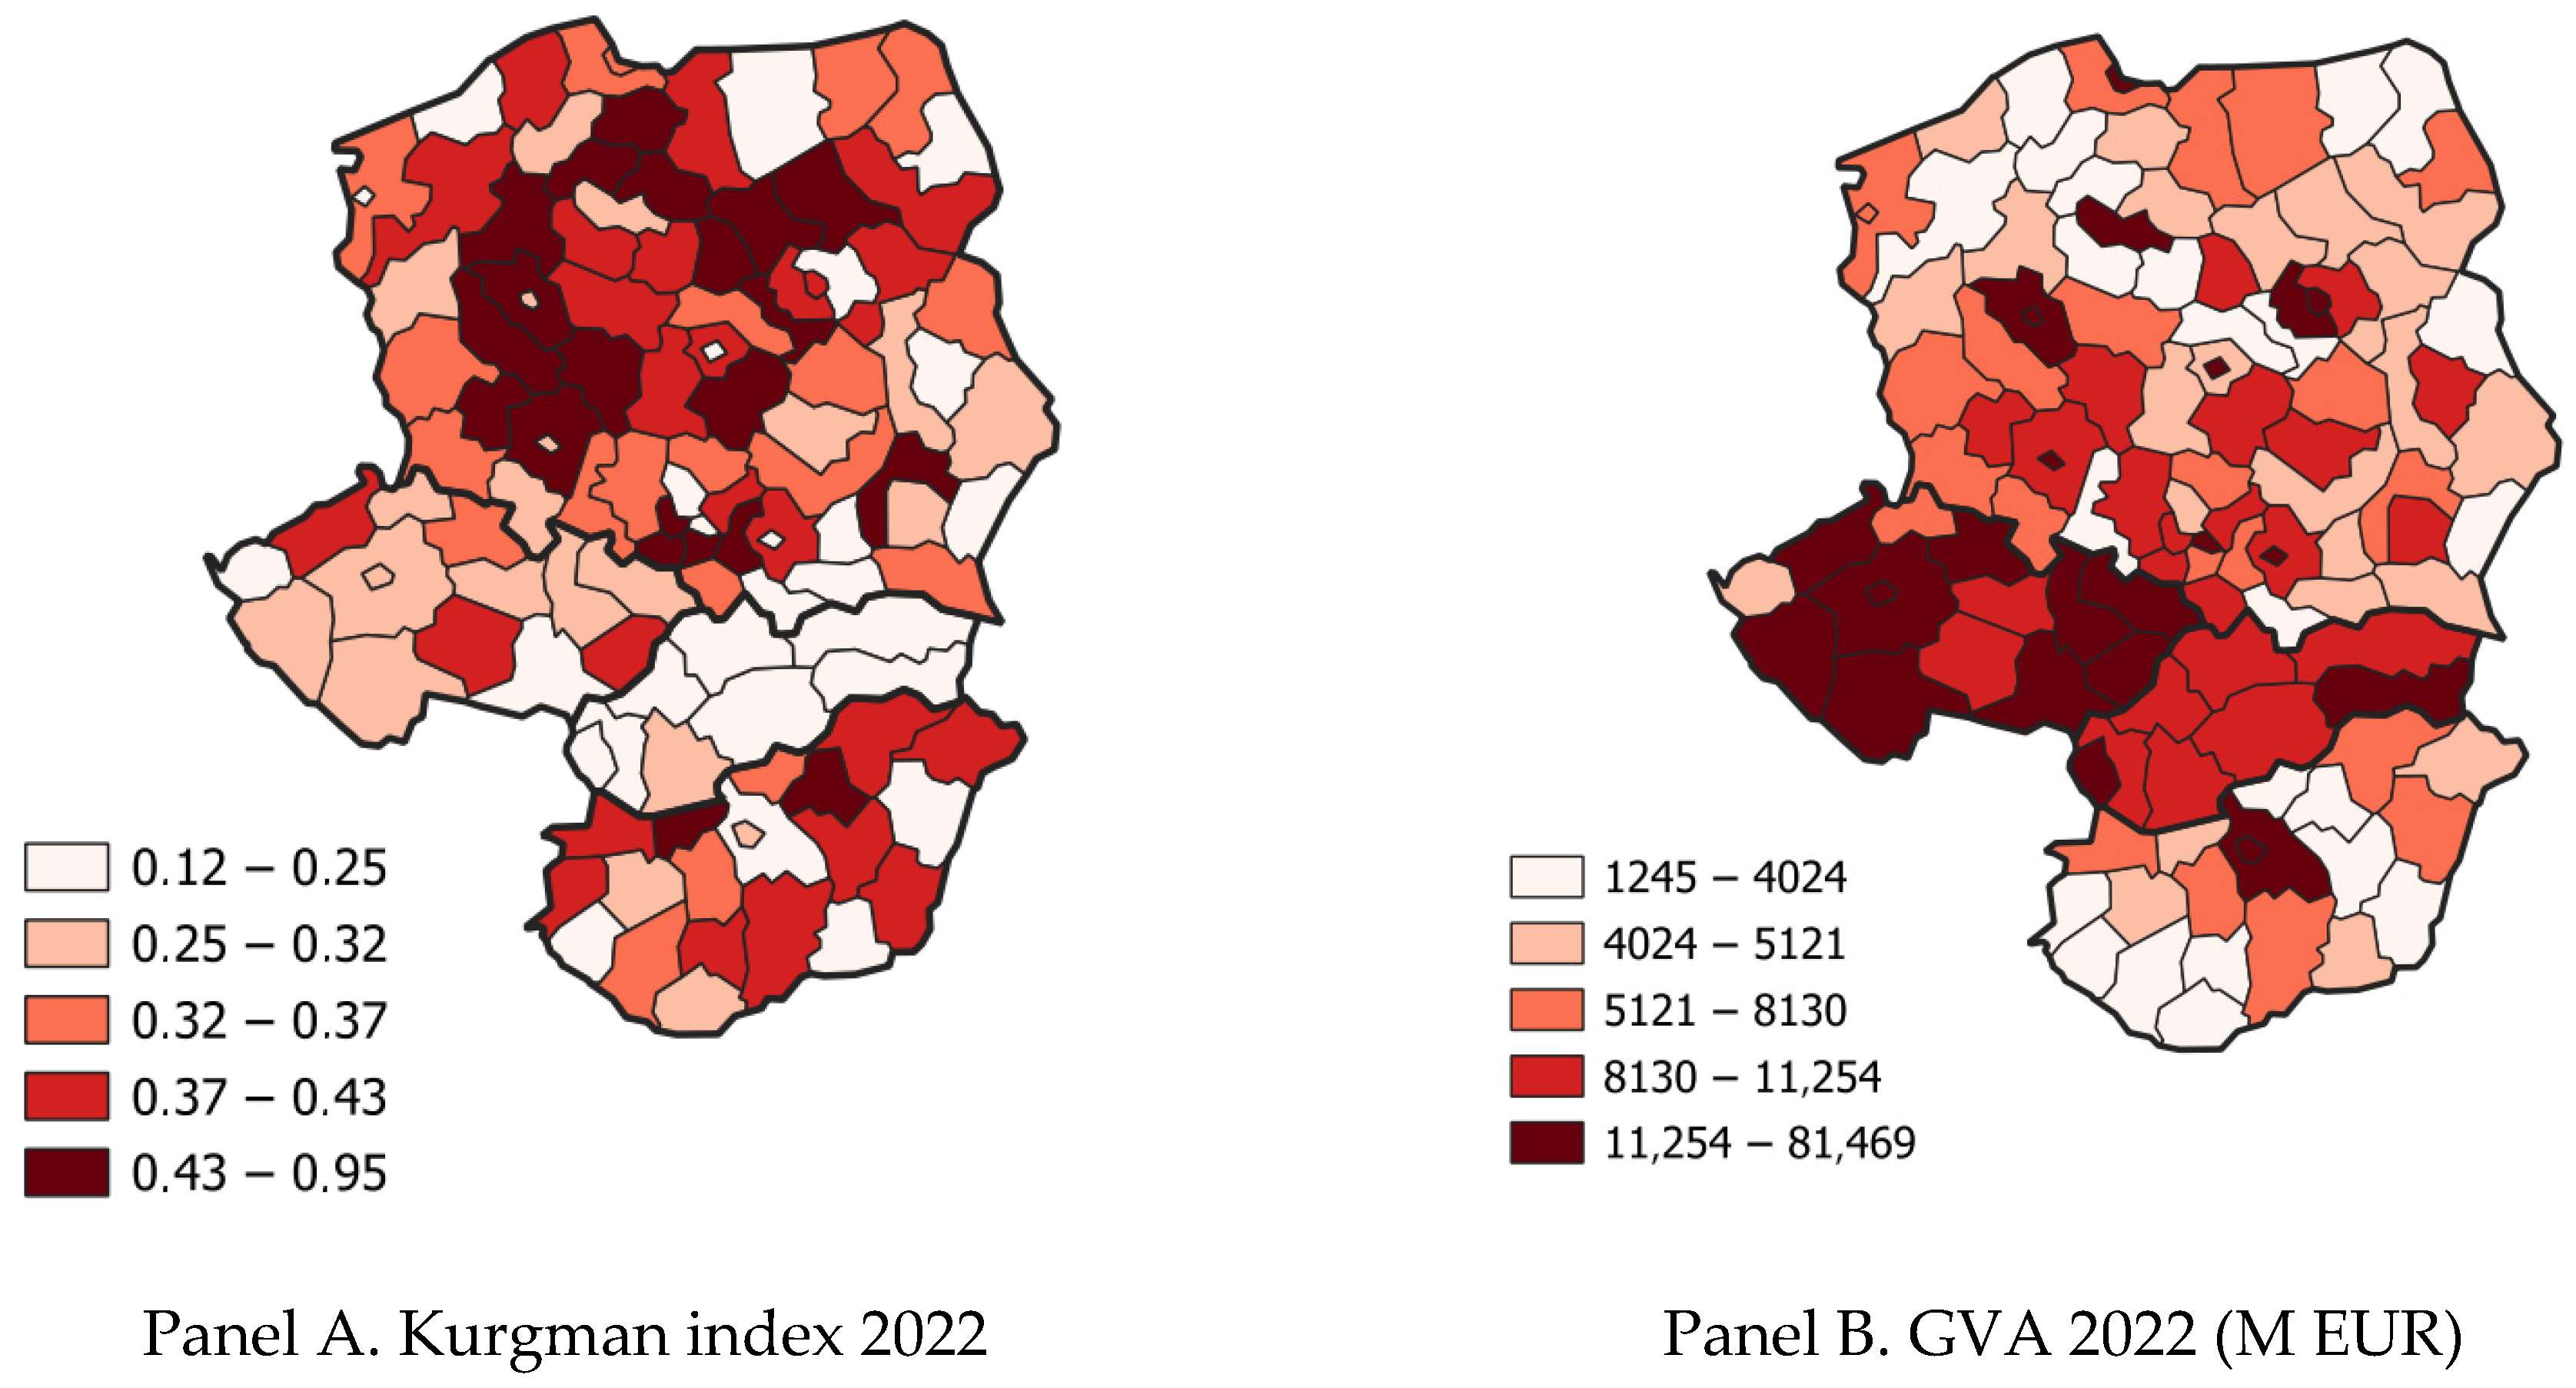
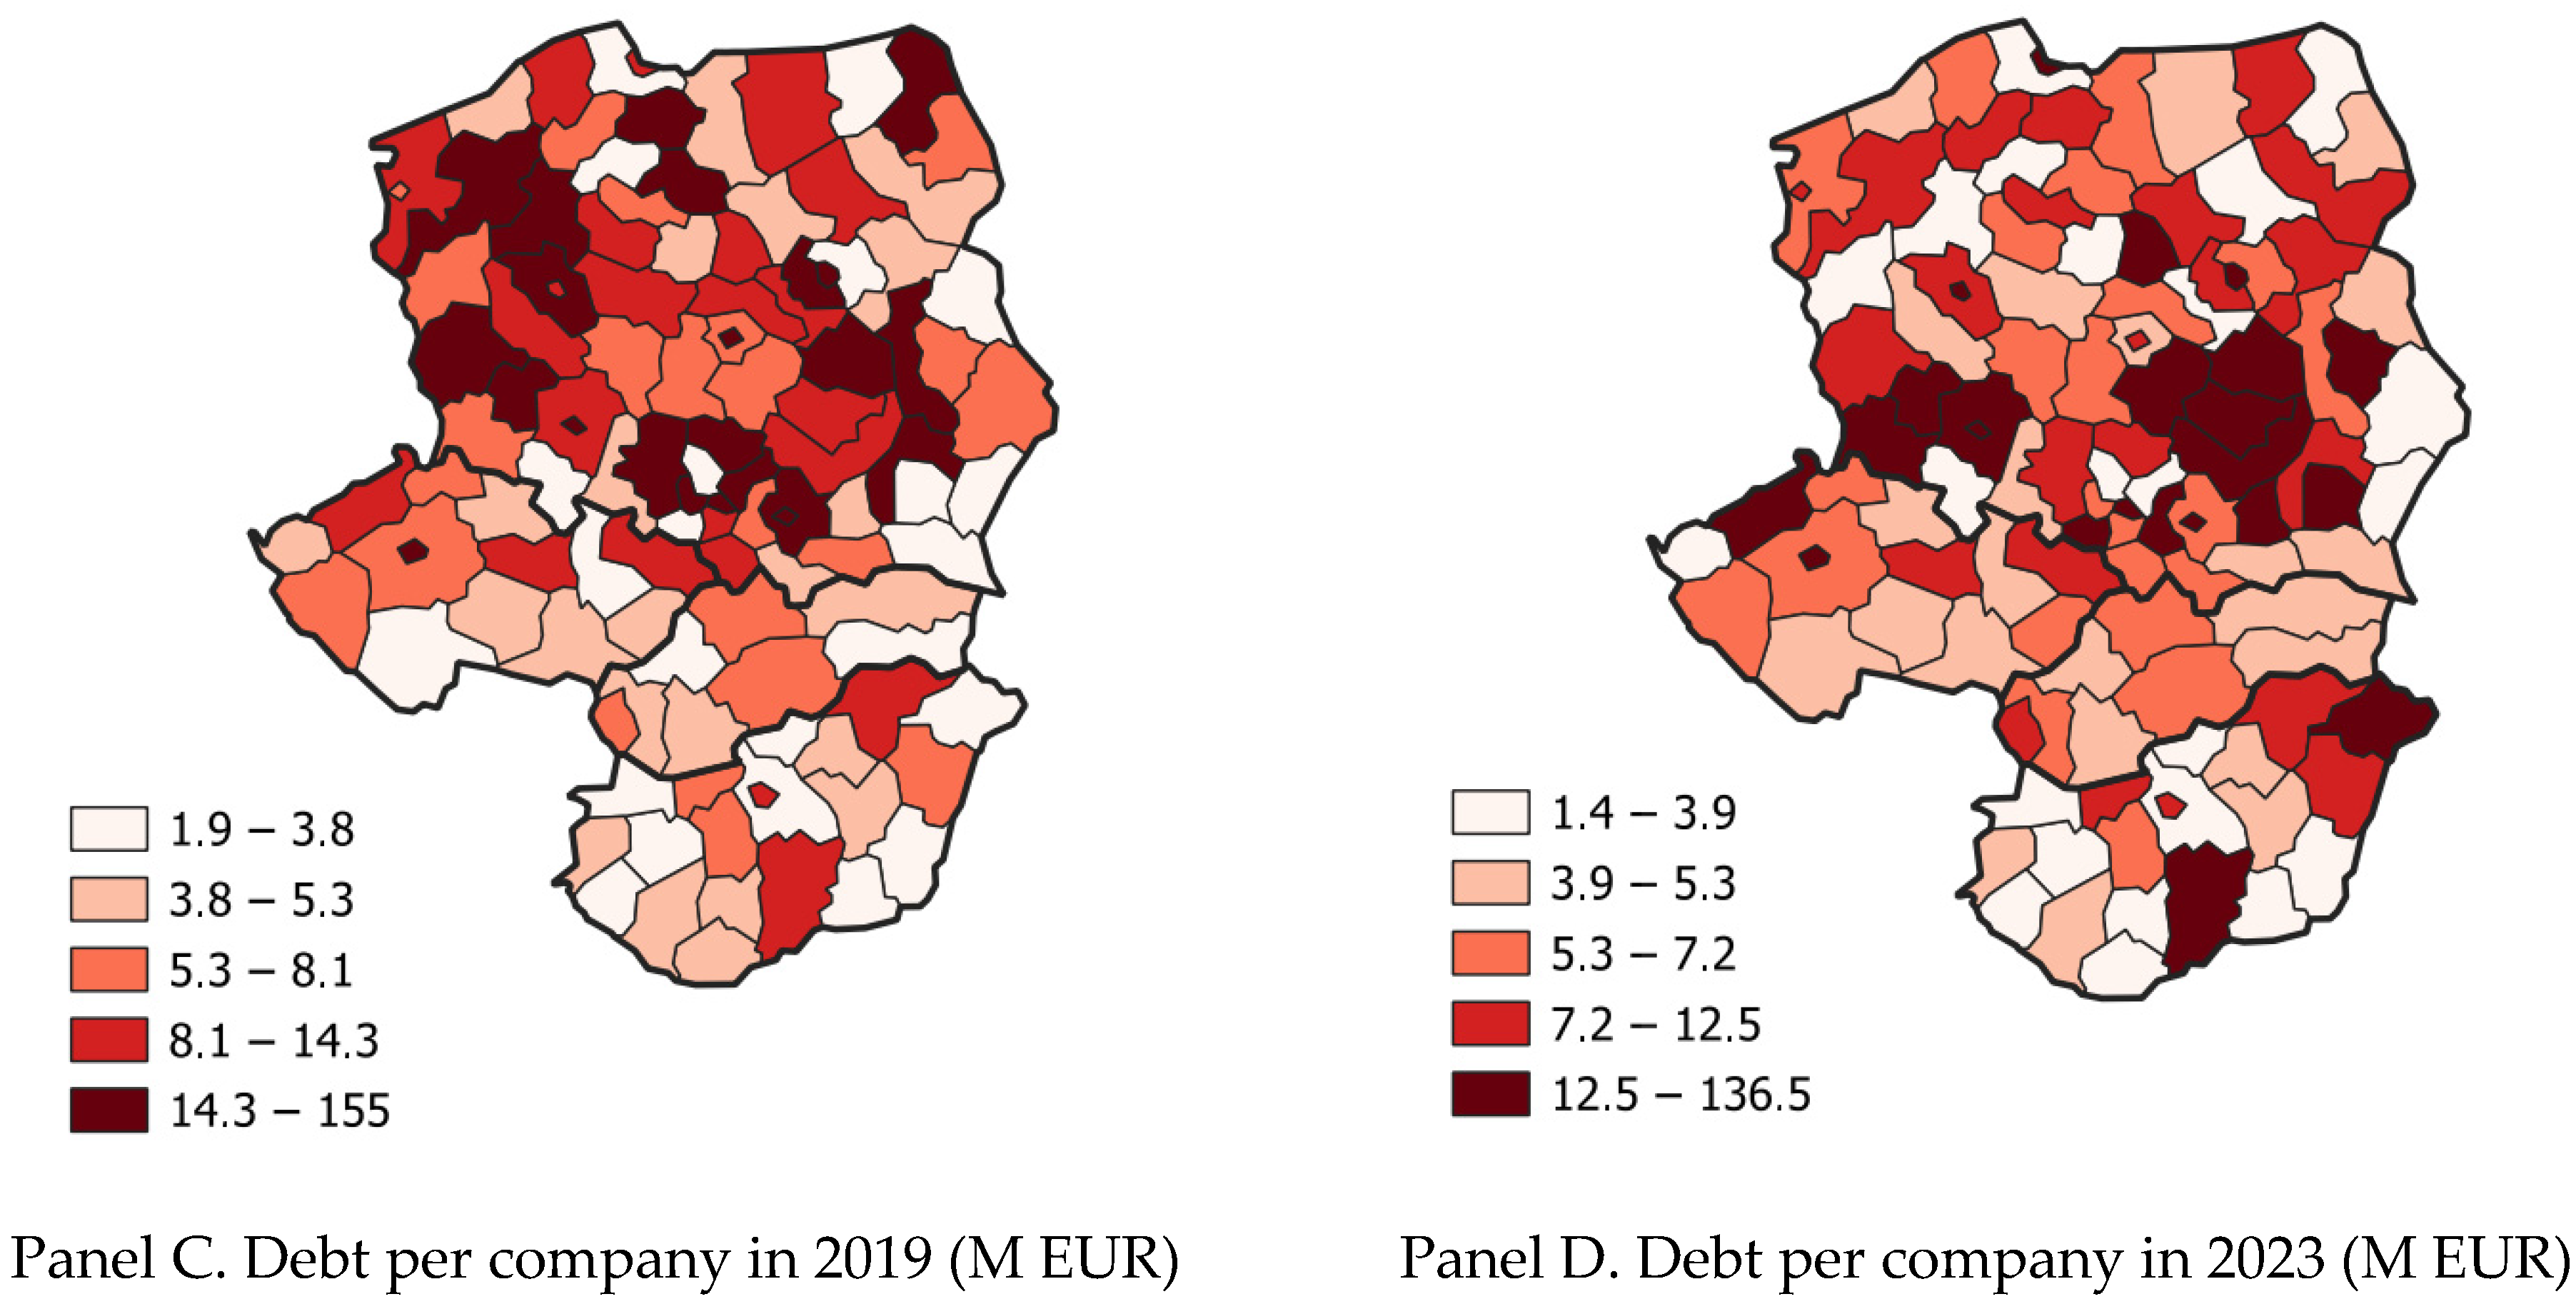
A unified cartographic design highlights regional heterogeneity for four indicators: the Krugman index, GVA, and average debt per firm in 2019 and 2023 (see Figure 1). Each map uses five quantile-based classes on a common color scale so that spatial contrasts remain comparable across indicators. Quantile classification follows established practice in cross-regional dashboards such as the OECD guidance and the European Commission’s Regional Competitiveness Index report, which improves interpretability when distributions are skewed (OECD, 2023; European Commission, 2019).
The Krugman index shows wide dispersion across the V4. Polish regions record the highest average specialization at 0.38, indicating a more concentrated sector mix. The Płock region (PL923) reaches 0.95, close to complete divergence from the national structure, driven by energy and chemicals. Hungarian regions also display relatively high specialization, with a mean of 0.35. The Czech Republic averages 0.30, while Slovakia records the lowest mean at 0.21, consistent with the most diversified structure. The values suggest higher crisis sensitivity in Poland and Hungary, while Slovakia’s diversification may provide a buffer.
GVA likewise exhibits strong spatial disparities. Average regional GVA is highest in the Czech Republic at 14,532 million euros and in Slovakia at 12,277 million euros, while the Polish and Hungarian regions show lower averages of 8086 and 7190 million euros. Capital regions stand out across the board. Prague and Warsaw exceed 80,000 million euros, whereas some peripheral regions scarcely reach 1250 million euros. The maps, therefore, reveal pronounced capital primacy, especially in the Czech Republic and Poland.
Average liabilities per firm reveal divergent crisis dynamics. Before the pandemic, Polish regions posted the highest liabilities at 15.35 million euros per firm, while regions in the other three countries clustered near 5 million euros. By 2023, Poland’s average declined to 12.96 million euros, yet remained the highest in the region. Hungary and the Czech Republic rose to 7.32 and 7.91 million euros per firm, respectively, and Slovakia reached 6.06 million euros. Extremes are notable. The maximum regional average was 154.99 million euros per firm in 2019 and 136.50 million euros per firm in 2023, while the minimum values hovered around 1.9 and 1.4 million euros. These shifts indicate widening spatial inequality after the crisis. Some regions experienced substantial increases in average indebtedness, while others stagnated or declined.

4.2. Effect of COVID-19 on Corporate Indebtedness

Paired t-tests evaluate changes in corporate indebtedness between 2019 and 2023. Table 6 reports the results. The comparison between 2019 and 2020 shows a significant increase (t = 2.043; p = 0.043; mean difference +441), which indicates a marked rise in corporate debt during the initial phase of the crisis. Government-supported and state-guaranteed lending programs introduced in response to COVID-19 explain most of this increase. Policymakers designed these instruments to ease liquidity pressures and preserve employment. Firms mainly relied on short-term working-capital loans to cover fixed costs and operating expenditures, which generated a temporary spike in debt levels. Guarantee schemes, debt moratoria, and interest-subsidized loans (European Bank for Reconstruction and Development (EBRD), 2021) expanded leverage in the short run but supported the restoration of financial stability in the medium term.
The significant rise in indebtedness between 2019 and 2020 aligns closely with international evidence on corporate finance during COVID-19. Multiple studies show that firms worldwide increased reliance on debt financing in the first phase of the pandemic, often through state-guaranteed bank lending programs that bridged liquidity shortfalls caused by sudden revenue losses (Gopalakrishnan et al., 2022; Pagano & Zechner, 2022). Martins et al. (2024) report a similar pattern for Portugal and emphasize that moratoria and government-guaranteed credit facilities substantially raised corporate indebtedness.
The sample shows a different pattern in the later years. A significant decline occurred between 2021 and 2022 (t = −2.201; p = 0.030; mean difference −257), suggesting that firms began to reduce leverage as the economy gradually recovered. A similar dynamic emerges between 2020 and 2023 (t = −2.599; p = 0.011; mean difference −434), confirming that the exceptionally high debt levels of 2020 were followed by a period of gradual consolidation. The remaining year pairs (2019–2021, 2019–2022, 2019–2023, 2020–2021, 2020–2022, 2021–2023) do not display significant differences, which implies that indebtedness mainly reflected the initial shock and the subsequent normalization phase. The results correspond to the assessment in OECD (2023). Post-COVID financial conditions tightened, guarantee and liquidity-support programs were phased out, and credit demand weakened because of rising interest rates and elevated uncertainty. As lending growth slowed, the earlier expansion of corporate indebtedness gave way to consolidation.

4.3. Macro-Level Determinants of Regional Indebtedness

Table 7 reports the results of the bootstrapped regression analysis explaining regional variation in corporate financial debt, along with model fit statistics and bootstrap median coefficients with associated p-values based on 5000 bias-corrected accelerated (BCa) replications. Results cover the full sample of NUTS 3 regions and for an alternative specification excluding capital regions, which serves as a robustness check addressing the concentration of corporate headquarters and financial activity in metropolitan cores.
The baseline model estimated on the full sample exhibits substantial explanatory power, accounting for 68.8 percent of cross-regional variation in corporate debt (R2 = 0.688; adjusted R2 = 0.683). The exclusion of capital regions is associated with a marked reduction in model fit (R2 = 0.379; adjusted R2 = 0.369), confirming that capital regions contribute disproportionately to aggregate variation in regional indebtedness. Importantly, however, the capital-excluded specification remains highly significant and continues to reveal systematic relationships between regional characteristics and corporate borrowing. The capital-excluded specification, therefore, serves as a meaningful robustness check rather than a purely auxiliary exercise.
Across both specifications, COUNT displays a positive and statistically robust association with corporate debt. In the full sample, a higher number of firms is associated with substantially higher regional indebtedness (β = 49.2, p = 0.002), while the effect remains positive and highly significant in the robustness check, albeit with a smaller magnitude (β = 10.6, p < 0.001). This result underscores the role of agglomeration intensity and scale effects in shaping regional borrowing and is consistent with long-established firm-level evidence linking size and leverage (Rajan & Zingales, 1995; Titman & Wessels, 1988) as well as more recent empirical benchmarks confirming the robustness of size effects in capital structure decisions (Frank & Goyal, 2009).
By contrast, total REV exhibits a strong and statistically significant association with debt in the full sample (β = 0.058, p < 0.001), but loses significance once capital regions are excluded. The absence of a robust revenue effect outside metropolitan cores suggests that the revenue-debt relationship is largely driven by headquarters concentration and scale effects in capital regions, rather than reflecting a generalizable regional mechanism.
EMPL and PROD/CAP show robust but directionally distinct associations with corporate debt. In the full sample, higher employment is associated with lower indebtedness (β = −44.7, p < 0.001), while productivity likewise shows a negative and statistically significant coefficient (β = −0.265, p = 0.001). In the capital-excluded model, both variables remain statistically significant, although the sign of employment turns positive (β = 6.0, p = 0.013), indicating that the relationship between labor input and debt differs between metropolitan and non-metropolitan regions. Taken together, the results point to an internal financing channel whereby regions with stronger productive capacity and efficiency rely less on external borrowing, consistent with the pecking order framework (Myers, 2001) and prior evidence from Central and Eastern Europe (Hernadi & Ormos, 2012; Mateev et al., 2013).
The role of GVA proves conditional on the regional context. In the full sample, GVA is positively associated with corporate debt (β = 0.376, p = 0.042), reflecting scale-related output effects and stronger credit demand in advanced, capital-dominated regions. Once capital regions are excluded, the coefficient turns negative and remains statistically robust (β = −0.186, p = 0.002). This contrast highlights the distinction between output scale and internal financing capacity: outside metropolitan cores, higher value creation appears to be associated with greater financial autonomy and reduced reliance on external debt. This interpretation aligns with evidence suggesting that firms in more advanced regions tend to finance a larger share of activity internally (Lee, 2023; Rajan & Zingales, 1995).
Regional specialization, measured by the KRUG, does not exhibit a robust association with debt in the full sample (p = 0.097), but becomes positive and highly significant in the capital-excluded specification (β = 2122.5, p < 0.001). The results imply that the effect of specialization is obscured by the disproportionate weight of capital regions and becomes more clearly identifiable once metropolitan areas are excluded. By contrast, average EBITDA margins and the COVID-19 dummy variable remain statistically insignificant across both specifications, suggesting that short-term profitability and pandemic-related shocks do not exert an independent effect on regional corporate indebtedness once structural characteristics are taken into account.

5. Discussion

This study provides an integrated spatial and temporal interpretation of corporate indebtedness in the V4 countries by combining concentration analysis, paired comparisons, and bootstrapped regression at the NUTS 3 level. Taken together, the results demonstrate that corporate debt dynamics during and after the COVID-19 shock were shaped by a combination of pronounced metropolitan dominance, phase-specific adjustment, and underlying structural characteristics of regional economies. The concentration analysis shows pronounced spatial unevenness in corporate debt and economic activity across the V4. Capital regions host a disproportionately large share of firms, revenues, gross value added, and—most notably—corporate debt. In Hungary, sampled firms that are located in Budapest account for more than half of total corporate debt, while Prague and Bratislava similarly dominate national financial aggregates in the Czech Republic and Slovakia; Poland represents a partial exception with a more polycentric structure. Importantly, debt appears even more concentrated than output, which highlights the central role of metropolitan cores not only in production but also in financial intermediation. The pattern is consistent with regional evidence showing that capital regions and manufacturing cores form persistent high-performance clusters and that within-country spatial heterogeneity dominates post-crisis adjustment in Central and Eastern Europe (Pintera, 2024). Complementary evidence highlights the role of firm clustering and regional production density in shaping credit access and leverage dynamics (Durana et al., 2025a), while in the V4 context, these concentration patterns are further reinforced by development strategies centered on foreign direct investment and centralized investment incentives that systematically favor capital regions and industrial hubs (Medve-Bálint & Éltető, 2024).
Beyond capital dominance, the spatial dispersion of GVA highlights widening regional inequality in the post-COVID period. Regional GVA differs by an order of magnitude between metropolitan cores and peripheral areas, indicating persistent structural gaps in economic capacity. Evidence from European policy monitoring documents uneven recovery outcomes following COVID-19, shaped by differences in productive structure and institutional capacity across regions (OECD, 2023). Recent macro-financial assessments further emphasize that tightening financial conditions and elevated uncertainty tend to amplify spatial disparities in credit conditions and adjustment (Bank for International Settlements, 2025).
The paired t-test results introduce a temporal perspective into the analysis. Corporate debt increased significantly during the initial phase of the COVID-19 shock and declined thereafter, indicating a sequence of shock-induced borrowing followed by gradual consolidation. This pattern is consistent with evidence showing that firms relied heavily on state-guaranteed lending and liquidity-support instruments during the acute phase of the pandemic (Martins et al., 2024). As emergency support measures were gradually phased out and financial conditions tightened, leverage began to normalize, reflecting balance-sheet adjustment rather than a persistent upward trend in indebtedness (Pagano & Zechner, 2022). Similar post-pandemic normalization patterns have been documented at the European level, where recovery trajectories differed across regions but were driven by common macro-financial conditions rather than uniform debt accumulation trends (OECD, 2023). The observed post-COVID normalization of corporate debt thus appears to reflect a combination of supply-side and demand-side mechanisms. While tighter financial conditions and the gradual withdrawal of emergency support constrained credit supply, firm-level deleveraging strategies and improved cash flow management also contributed to balance-sheet adjustment, indicating that normalization was driven by both external constraints and internal financial decisions.
The bootstrapped regression analysis provides insight into the structural drivers of regional corporate indebtedness beyond the immediate shock phase. Firm density emerges as the most robust determinant across specifications, highlighting the importance of agglomeration intensity and regional scale in shaping borrowing behavior. Recent studies document that scale- and clustering-related factors can explain up to one-third or more of cross-regional variation in credit activity, as firm concentration amplifies both credit demand and access to external finance (Krishnamurthy & Muir, 2025). Importantly, the persistence of the firm density effect after excluding capital regions indicates that agglomeration mechanisms are not confined to metropolitan headquarters but reflect broader regional production structures. By contrast, aggregate revenues exhibit a strongly context-dependent relationship with regional corporate indebtedness. Although revenues are often interpreted as proxies for economic scale, macro-financial research suggests that revenue aggregates primarily capture accounting concentration and headquarters effects rather than decentralized financing capacity, particularly in bank-based financial systems. Consistent with this view, revenue-driven credit relationships weaken substantially outside core financial regions, where fragmented capital flows and limited interregional financial integration constrain the transmission of scale effects. Accordingly, the absence of a robust revenue-debt relationship outside capital regions in our results aligns with evidence that revenue aggregates reflect metropolitan financial intermediation structures rather than region-wide corporate financing behavior, especially in the post-COVID environment characterized by elevated capital flow volatility (Alcidi et al., 2024). Employment and labor productivity display robust associations with corporate debt outside capital regions, pointing to an internal financing channel consistent with the pecking order framework. Regions with stronger productive performance appear less reliant on external borrowing, suggesting that retained earnings and operational cash flows substitute for debt finance in non-metropolitan economies. The pattern aligns with post-crisis evidence showing that efficiency improvements ease financing constraints in structurally heterogeneous regions such as Central and Eastern Europe (Durana et al., 2025a). Moreover, recent firm-level evidence indicates that leverage–performance relationships are non-linear, with optimal debt ratios typically concentrated in a moderate range (around 20–30%), beyond which excessive indebtedness undermines efficiency and post-crisis recovery (Dsouza et al., 2025). The role of GVA is more nuanced and context-dependent. In the full sample, higher GVA is associated with higher corporate debt, reflecting scale effects and stronger credit demand in advanced regions. However, once capital regions are excluded, the coefficient turns negative and remains statistically robust, indicating that outside metropolitan cores, higher value creation is linked to reduced reliance on external finance. The distinction between output scale and internal financing capacity supports the view that firms in more advanced non-capital regions exhibit greater financial autonomy (Lee, 2023). Consistent with this interpretation, recent macro-level evidence shows that productivity-enhancing structural upgrading can generate substantial GVA gains on the order of EUR 100,000 per additional high-quality job, without proportional increases in leverage; this reflects stronger internal cash flow generation even in financially constrained settings (Figuerola-Ferretti et al., 2025). Sectoral specialization, measured by the Krugman index, does not exhibit a stable direct association with corporate debt in the full sample. Rather than serving as a proxy for regional resilience, specialization appears to capture structural exposure, whose effects on indebtedness are largely dominated by scale, productivity, and institutional factors. This pattern indicates that, once capital regions are excluded, specialization-related financing effects become more visible outside metropolitan cores, as reflected in the positive and statistically significant coefficient. The conditional relevance of specialization aligns with regional evidence suggesting that specialization mainly influences exposure to shocks, while post-shock financial outcomes are shaped by broader structural and performance-related factors (Sargento & Lopes, 2023; Zapreskó-Farkas, 2024).
Overall, the results indicate that corporate debt dynamics during crises are shaped by the interaction of spatial concentration and underlying regional structures rather than by uniform cyclical responses. Heightened uncertainty, tighter financial conditions, and fragmented capital flows tend to reinforce existing regional asymmetries, amplifying differences between metropolitan cores and non-capital regions rather than smoothing them (Bank for International Settlements, 2025). By integrating spatial concentration, structural characteristics, and regional heterogeneity at a fine territorial scale, the analysis reinforces the view that crisis-related credit dynamics are inherently place-specific and cannot be adequately captured by aggregate national indicators alone.

6. Conclusions

The empirical results reveal a clear temporal adjustment pattern at the NUTS 3 level. Corporate debt increased sharply during the initial phase of the COVID-19 pandemic and subsequently declined as firms adjusted through deleveraging and cash flow management. The sequence is consistent with established crisis-finance mechanisms (Acharya et al., 2016; Pagano & Zechner, 2022) where external borrowing serves as a short-term buffer during shocks, followed by balance-sheet repair in the recovery phase. Importantly, the findings demonstrate that this adjustment process is not spatially uniform. Capital regions and major industrial hubs exhibit persistently higher indebtedness, while non-capital regions display lower and more heterogeneous debt levels.
The regression results highlight the central role of scale and productive capacity in shaping regional debt patterns. Firm density emerges as a robust determinant across specifications, underscoring the importance of agglomeration effects and the concentration of economic activity. Productivity and employment indicators point to an internal financing channel, consistent with pecking order logic, whereby regions with stronger productive performance rely less on external debt. The role of GVA proves conditional: while it captures scale-related borrowing in capital regions, higher value added outside metropolitan cores is associated with lower indebtedness, suggesting greater internal financing capacity and more efficient production structures.
From a policy perspective, findings carry several implications for the V4 countries. The pronounced spatial concentration of corporate debt indicates that access to finance and financial intermediation remain uneven across regions. In capital regions, where borrowing levels are high and financial markets are deeper, policy instruments that support investment quality and productivity, such as innovation finance or green investment incentives (Tóth et al., 2024), may be most effective. In contrast, firms located in non-capital regions are more likely to benefit from liquidity-support measures, strengthened regional banking networks, and targeted credit guarantee schemes that alleviate financing constraints without encouraging excessive leverage. Based on the findings, the case for place-based financial policies may be reinforced, complementing national credit and industrial strategies rather than relying on uniform instruments.
Several limitations should be acknowledged when interpreting the results. With respect to external validity, the proposed methodological framework is not directly transferable to Western European economies without adaptation. The V4 countries share key characteristics of post-socialist transition economies, including distinct institutional legacies, greater reliance on foreign-owned firms and external finance, and strong spatial concentration in capital regions, which differentiate their corporate financing dynamics from those of Western Europe. At the same time, the framework combining spatial concentration measures, temporal comparisons, and bootstrapped regional regressions is well-suited for application to other transition and emerging economies with similar structural features.
First, the geographic scope is restricted to the V4 countries, which limits the external validity of the findings beyond Central and Eastern Europe. Second, the analysis focuses on medium and large firms, as defined by revenue thresholds, and therefore does not capture the behavior of micro and small enterprises, which may exhibit different financing dynamics and higher sensitivity to economic shocks. Third, heavy-tailed distributions and correlated regressors constrain causal interpretation. While bootstrap-based inference strengthens the robustness of the estimated associations, the empirical framework is not designed to identify causal effects or to disentangle credit supply and credit demand channels. In addition, sectoral specialization is measured using the Krugman index as provided by Eurostat, which ensures cross-country comparability but limits the exploration of alternative concentration measures. In addition, the analysis relies on EMIS as a harmonized commercial database, which ensures cross-country comparability for medium and large firms but may be subject to coverage bias, reporting heterogeneity, and classification limitations, as is common with commercial firm-level datasets. A systematic cross-validation of EMIS records against administrative or alternative commercial databases is beyond the scope of this study and is therefore identified as an important direction for future research.
The limitations also point to promising directions for future research. Extending the analysis to Western European regions would allow benchmarking of V4 patterns within a broader institutional context, rather than a direct replication of the empirical relationships identified in transition economies. Longer panels covering earlier crises, such as the global financial crisis of 2008–2009, could shed further light on the persistence of spatial debt dynamics across different shock episodes. Future work could also integrate richer financial data to separate supply- and demand-side credit mechanisms and examine how corporate debt interacts with investment in innovation, environmental transition, and long-term productivity growth. Overall, the study demonstrates that corporate debt dynamics during crises are inherently spatial and structurally conditioned. By moving beyond aggregate national indicators and adopting a fine-grained regional perspective, the analysis contributes to a better understanding of how financial adjustment processes unfold across heterogeneous territories in Central and Eastern Europe.


Supplementary Materials

The following supporting information can be downloaded at: https://www.mdpi.com/article/10.3390/ijfs14030064/s1, The supplementary material file is provided as an attached Excel document.

Author Contributions

B.R.-P.: Data curation, Writing—Original draft preparation, Visualization; A.S.: Conceptualization, Methodology, Software, Writing—Review & Editing, Visualization; Á.T.: Conceptualization, Supervision. All authors have read and agreed to the published version of the manuscript.

Funding

This research did not receive any specific grant from funding agencies in the public, commercial, or not-for-profit sectors.

Institutional Review Board Statement

Not applicable.

Informed Consent Statement

Not applicable.

Data Availability Statement

The original contributions presented in this study are included in the article. Further inquiries can be directed to the corresponding author.

Conflicts of Interest

The authors declare that they have no known competing financial interests or personal relationships that could have appeared to influence the work reported in this paper.

References

  1. Abraham, F., Cortina, J. J., & Schmukler, S. L. (2021). The rise of domestic capital markets for corporate financing: Lessons from East Asia. Journal of Banking and Finance, 122, 105987. [Google Scholar] [CrossRef]
  2. Acharya, V., Mehran, H., & Thakor, A. (2016). Caught between Scylla and Charybdis? Regulating bank leverage when there is rent seeking and risk shifting. Review of Corporate Finance Studies, 5(1), 36–75. [Google Scholar] [CrossRef]
  3. Akbar, S., Rehman, S., Liu, J., & Shah, S. (2017). Credit supply constraints and financial policies of listed companies during the 2007–2009 financial crisis. Research in International Business and Finance, 42, 559–571. [Google Scholar] [CrossRef]
  4. Alcidi, C., Shamsfakhr, F., Arnal, J., & Gojsic, D. (2024). EU capital flows: Latest developments from a global perspective (2024). Publications Office of the European Union.
  5. Angrist, J. D., & Pischke, J.-S. (2009). Mostly harmless econometrics: An empiricist’s companion. Princeton University Press. [Google Scholar]
  6. Bailey, D., Crescenzi, R., Roller, E., Anguelovski, I., Datta, A., & Harrison, J. (2021). Regions in COVID-19 recovery. Regional Studies, 55(12), 1955–1965. [Google Scholar] [CrossRef]
  7. Bank for International Settlements. (2025). Annual economic report 2025. Bank for International Settlements. [Google Scholar]
  8. Beck, T., Demirgüç-Kunt, A., & Maksimovic, V. (2008). Financing patterns around the world: Are small firms different? Journal of Financial Economics, 89(3), 467–487. [Google Scholar] [CrossRef]
  9. Becker, T., Daianu, D., Darvas, Z., Gligorcv, V., Landesmann, M., Petrovic, P., Pisani-Ferry, J., Rosati, D., Sapir, A., & Weder di Mauro, B. (2010). Whither growth in central and eastern Europe? Policy lessons for an integrated Europe (Bruegel Blueprint Series). Bruegel. [Google Scholar]
  10. Bliss, B., Cheng, Y., & Denis, D. (2015). Corporate payout, cash retention, and the supply of credit: Evidence from the 2008–2009 credit crisis. Jorunal of Financial Economics, 115(3), 521–540. [Google Scholar] [CrossRef]
  11. Bourdeau-Lepage, L. (2007). Advanced services and city globalization on the Eastern fringe of Europe. Belgeo, (1), 133–146. [Google Scholar] [CrossRef]
  12. Brada, J. C., Gajewski, P., & Kutan, A. M. (2021). Economic resiliency and recovery, lessons from the financial crisis for the COVID-19 pandemic: A regional perspective from Central and Eastern Europe. International Review of Financial Analysis, 74, 101658. [Google Scholar] [CrossRef] [PubMed]
  13. Brada, J. C., & Tomsik, V. (2003). Foreign direct invesment and perceptions of vulnerability to foreign exchange crises: Evidence from transition economies (ZEI working paper). ZEI. [Google Scholar]
  14. Casey, E., & O’Toole, C. (2014). Bank lending constraints, trade credit and alternative financing during the financial crisis: Evidence from European SMEs. Journal of Corporate Finance 27, 173–193. [Google Scholar] [CrossRef]
  15. Cowling, M., Liu, W., Minniti, M., & Zhang, N. (2016). UK credit and discouragement during the GFC. Small Business Economics, 47(4), 1049–1074. [Google Scholar] [CrossRef]
  16. Daniel, B. C., & Jones, J. B. (2007). Financial liberalization and banking crises in emerging economies. Journal of International Economics, 71(3), 202–221. [Google Scholar] [CrossRef]
  17. Dsouza, S., Kathavarayan, K., Mathias, F., Bhatia, D., & AlKhawaja, A. (2025). Leveraging success: The hidden peak in debt and firm performance. Econometrics, 13(2), 23. [Google Scholar] [CrossRef]
  18. Duchin, R., Ozbas, O., & Sensoy, B. (2010). Costly external finance, corporate investment, and the subprime mortgage credit crisis. Journal of Financial Economics, 97(3), 418–435. [Google Scholar] [CrossRef]
  19. Durana, P., Kovalova, E., Blazek, R., & Bicanovska, K. (2025a). Business efficiency: Insights from Visegrad four before, during, and after the COVID-19 pandemic. Economies, 13(2), 26. [Google Scholar] [CrossRef]
  20. Durana, P., Poliak, M., Kovalova, E., & Blazek, R. (2025b). Prediction models reloaded: Advanced insights for SMEs in the Bucharest Nine countries. Oeconomia Copernicana, 16(2), 689–760. [Google Scholar] [CrossRef]
  21. Dyker, D. A. (2001). The dynamic impact on the Central-Eastern European economies of accession to the European Union: Social capability and technology absorption. Europe-Asia Studies, 53(7), 1001–1021. [Google Scholar] [CrossRef]
  22. Dzemydaitė, G. (2021). The impact of economic specialization on regional economic development in the European Union: Insights for formation of smart specialization strategy. Economies, 9(2), 76. [Google Scholar] [CrossRef]
  23. European Bank for Reconstruction and Development (EBRD). (2021). Transition report 2021–2022: System upgrade—Delivering the digital dividend. EBRD.
  24. European Commission. (2019). The EU regional competitiveness index 2019. Publications Office of the European Union. [Google Scholar]
  25. European Commission. (2020). User guide to the SME definition. Publications Office of the European Union. Available online: https://op.europa.eu/en/publication-detail/-/publication/756d9260-ee54-11ea-991b-01aa75ed71a1 (accessed on 15 July 2025).
  26. European Parliament and the Council. (2013). Directive 2013/34/EU of European Parliament an of the Council of 26 June 2013 on the annual financial statements, consolidated financial statements and related reports of certain types of undertakings, amending Directive 2006/43/EC of the European Parliament and of the Council and repealing Council Directives 78/660/EEC and 83/349/EEC. Publications Office of the European Union. [Google Scholar]
  27. Eurostat. (2019). Structural business statistics overview. Publications Office of the European Union. Available online: https://ec.europa.eu/eurostat/statistics-explained/index.php?title=Structural_business_statistics_overview (accessed on 25 July 2025).
  28. Eurostat. (2025, July 5). Eurostat regional database. Publications Office of the European Union. Available online: https://ec.europa.eu/eurostat/web/main/data/database (accessed on 25 July 2025).
  29. Ezcurra, R., Pascual, P., & Rapún, M. (2006). Regional specialization in the European Union. Regional Studies, 40(6), 601–616. [Google Scholar] [CrossRef]
  30. Faludi, A. (2006). From European spatial development to territorial cohesion policy. Regional Studies, 40(6), 667–678. [Google Scholar] [CrossRef]
  31. Figuerola-Ferretti, I., Lumbreras, S., Paraskevas, P., & Paraskevopoulos, I. (2025). Sustainability in action: Macro-level evidence from Europe (2008–2023) on ESG, green employment, and SDG-aligned economic performance. Sustainability, 17(20), 9103. [Google Scholar] [CrossRef]
  32. Frank, M. Z., & Goyal, V. K. (2009). Capital structure decisions: Which factors are reliably important? Financial Management, 38(1), 1–37. [Google Scholar] [CrossRef]
  33. Friz, K., & Guenther, J. (2021). Innovation and economic crisis in transition economies. Eurasian Business Review, 11(4), 537–563. [Google Scholar] [CrossRef]
  34. Furceri, D., & Zdzienicka, A. (2011). The real effect of financial crises in the European transition economies. Economics of Transition, 19(1), 1–25. [Google Scholar] [CrossRef][Green Version]
  35. Gajdosikova, D., Chatterjee, S., & Kovalova, E. (2025). The impact of significant macroeconomic turbulence on corporate debt levels: A case study of Visegrad Group countries during COVID-19 pandemic. Equilibrium. Quarterly Journal of Economics and Economic Policy, 20(2), 803–848. [Google Scholar] [CrossRef]
  36. Gopalakrishnan, B., Jacob, J., & Mohapatra, S. (2022). COVID-19 pandemic and debt financing by firms: Unravelling the channels. Economic Modelling, 114, 105929. [Google Scholar] [CrossRef] [PubMed]
  37. Gujarati, D. N. (2009). Basic econometrics. McGraw-Hill. [Google Scholar]
  38. Hárskúti, J. (2012). A pénzügyi gazdasági válság hatása a közép-kelet-európai országokra és a működő tőkebefektetésekre. In Multidiszciplináris kihívások—Sokszínű válaszok. BGF KVIK. [Google Scholar]
  39. Hegyi-Kéri, Á. (2013). Regional specialization and geographic concentration of economic sectors in the Visegrád countries. Theory, Methodology, Practice–Review of Business and Management, 9(1), 31–41. [Google Scholar]
  40. Hernadi, P., & Ormos, M. (2012). What managers think of capital structure and how they act: Evidence from Central and Eastern Europe. Baltic Journal of Economics, 12(2), 47–71. [Google Scholar] [CrossRef]
  41. Kahle, K. M., & Stulz, R. M. (2013). Access to capital, investment, and the financial crisis. Journal of Financial Economics, 110(2), 280–299. [Google Scholar] [CrossRef]
  42. Kaniok, P., & Hloušek, V. (2025). Visegrad four as an institution in times of EU crises. European Politics and Society, 26(5), 1070–1088. [Google Scholar] [CrossRef]
  43. Kant, C. (2025). EU accession, institutional change, growth, and human capital. Economies, 13(6), 177. [Google Scholar] [CrossRef]
  44. Kariya, A. (2022). Earnings-based borrowing constraints & corporate investments in 2007–2009 financial crisis. Journal of Corporate Finance, 75, 102227. [Google Scholar] [CrossRef]
  45. Karkowska, R., & Pawłowska, M. (2017). The concentration and bank stability in Central and Eastern European countries. Narodowy Bank Polski, Education & Publishing Department. [Google Scholar]
  46. Kaya, O., & Wang, L. (2016). The role of bank lending tightening on corporate bond issuance in the eurozone. Quarterly Review of Economics and Finance, 60, 1–11. [Google Scholar] [CrossRef]
  47. Kennedy, P. (2008). A guide to econometrics. John Wiley & Sons. [Google Scholar]
  48. Khan, S. U. (2022). Financing constraints and firm-level responses to the COVID-19 pandemic: International evidence. Research in International Business and Finance, 59, 101545. [Google Scholar] [CrossRef]
  49. Kilroy, A., & Ganau, R. (2020). Economic growth in European Union NUTS-3 regions. World Bank Group. [Google Scholar]
  50. Kovács, Á., & Zsigmond, T. (2020). Economic effects of COVID-19 on the V4 countries. Available online: https://www.researchgate.net/profile/Tibor-Zsigmond/publication/350289791_Economic_Effects_of_COVID-19_on_the_V4_Countries/links/6091bea8a6fdccaebd0921c3/Economic-Effects-of-COVID-19-on-the-V4-Countries.pdf (accessed on 25 July 2025).
  51. Krishnamurthy, A., & Muir, T. (2025). How credit cycles across a financial crisis. Journal of Finance, 80(3), 1339–1378. [Google Scholar] [CrossRef]
  52. Krugman, P. (1991). Geography and trade. MIT Press. [Google Scholar]
  53. Lee, M. (2023). Determinants of firm-level growth: Lessons from the Czech Republic, Hungary, and Poland. The South East European Journal of Economics and Business, 18(1), 46–57. [Google Scholar] [CrossRef]
  54. Longhi, S., Nijkamp, P., & Traistaru, L. (2004). Economic integration and regional structural change in a wider Europe: Evidence from new EU and accession countries. Journal for Institutional Innovation, Development & Transition, 8, 48–55. [Google Scholar]
  55. Marelli, E. (2007). Specialisation and convergence of European regions. The European Journal of Comparative Economics, 4(2), 149–178. [Google Scholar]
  56. Martin, R. (2012). Regional economic resilience, hysteresis and recessionary shocks. Journal of Economic Geography, 12(1), 1–32. [Google Scholar] [CrossRef]
  57. Martins, A. M., Couto, G., & Pimentel, P. (2024). Pandemic effect on company’s sustainability debt policy: The case of Portugal. Journal of Infrastructure, Policy and Development, 8(6), 4608. [Google Scholar] [CrossRef]
  58. Mateev, M., Poutziouris, P., & Ivanov, K. (2013). On the determinants of SME capital structure in Central and Eastern Europe: A dynamic panel analysis. Research in International Business and Finance, 27(1), 28–51. [Google Scholar] [CrossRef]
  59. Medve-Bálint, G., & Éltető, A. (2024). Economic nationalists, regional investment aid, and the stability of FDI-led growth in East Central Europe. Journal of European Public Policy, 31(3), 874–899. [Google Scholar] [CrossRef]
  60. Meijers, E., Waterhout, B., & Zonneveld, W. (2007). Closing the gap: Territorial cohesion through polycentric development. European Journal of Spatial Development, 5(2), 1–24. [Google Scholar] [CrossRef]
  61. Midelfart, K.-H., Overman, H. G., Redding, S. J., & Venables, A. J. (2004). The location of European industry. In European integration and the functioning of product markets (pp. 113–170). Edward Elgar Publishing. [Google Scholar] [CrossRef]
  62. Montañez-Enríquez, R., Busch, M. O., & Ramos-Francia, M. (2024). Untangling the finance-growth nexus: The dual role of financial development in the transmission of shocks. Emerging Markets Review, 63, 101192. [Google Scholar] [CrossRef]
  63. Myers, S. C. (2001). Capital structure. Journal of Economic Perspectives, 15(2), 81–102. [Google Scholar] [CrossRef]
  64. OECD. (2023). OECD regional outlook 2023: The longstanding geography of inequalities. OECD Publishing. [Google Scholar]
  65. Pagano, M., & Zechner, J. (2022). COVID-19 and corporate finance. Review of Corporate Finance Studies, 11(4), 849–879. [Google Scholar] [CrossRef]
  66. Palan, N. (2010). Measurement of specialization the choice of indices (FIW working paper). FIW. [Google Scholar]
  67. Pintera, J. (2024). Regional convergence in the European Union—Factors of growth between the great recession and the COVID crisis. Economic Systems, 48(1), 101169. [Google Scholar] [CrossRef]
  68. Poór, J., Juhász, T., Caha, Z., Stor, M., & Haromszeki, Ł. (2025). Factors influencing labour shortages in Visegrad (V4) countries with regard to difficult economic environments. Regional Statistics, 15(1), 90–116. [Google Scholar] [CrossRef]
  69. Rajan, R., & Zingales, L. (1995). What do we know about capital structure? Some evidence from international data. Journal of Finance, 50(5), 1421–1460. [Google Scholar] [CrossRef]
  70. Römisch, R. (2020). COVID-19 effects on Central Europe. Interreg Central Europe. Available online: http://interregcentral.eu/Content.Node/discover/Covid-19-effects-on-Central-Europe.pdf (accessed on 15 July 2025).
  71. Ryan-Collins, J., Werner, R. A., & Castle, J. (2016). A half-century diversion of monetary policy? An empirical horse-race to identify the UK variable most likely to deliver the desired nominal GDP growth rate. Journal of International Financial Markets, Institutions and Money, 43, 158–176. [Google Scholar] [CrossRef]
  72. Sargento, A., & Lopes, A. S. (2023). Territorial resilience on the aftermaths of COVID-19 crisis-An exploratory analysis on the role of innovation. Regional Science Policy & Practice, 16, 12697. [Google Scholar] [CrossRef]
  73. Sánchez, A., & Jiménez-Fernández, E. (2023). European Union cohesion policy: Socio-economic vulnerability of the regions and the COVID-19 shock. Applied Research in Quality of Life, 18(1), 195–228. [Google Scholar] [CrossRef]
  74. Suta, A., Molnár, P., Limbach, Z., & Tóth, Á. (2025). Dictionary-based assessment of European Sustainability Reporting Standard (ESRS) disclosure topics. Discover Sustainability, 6(1), 146. [Google Scholar] [CrossRef]
  75. Svejnar, J. (2002). Transition economies: Performance and challenges. Journal of Economic Perspectives, 16(1), 3–28. [Google Scholar] [CrossRef]
  76. Tibshirani, R. J., & Efron, B. (1993). An introduction to the bootstrap. Monographs on Statistics and Applied Probability, 57(1), 1–436. [Google Scholar]
  77. Titman, S., & Wessels, R. (1988). The determinants of capital structure choice. Journal of Finance, 43(1), 1–19. [Google Scholar] [CrossRef]
  78. Tondl, G. (2016). Interest rates, corporate lending and growth in the Euro area (Department of Economics working paper No. 227). Vienna University of Economics and Business. [Google Scholar]
  79. Tóth, Á., Suta, A., Szauter, F., & Lukács, E. (2024). Quantitative analysis of green investments in European automotive companies: A digital reporting analysis. Clean Technologies and Environmental Policy, 27, 8749–8761. [Google Scholar] [CrossRef]
  80. Vasilyeva, R., Turygin, O., Ie, O., & Kozlova, M. (2021). The impact of lending to non-financial corporations on economic growth. Proceedings of CBU in Economics and Business, 2, 111–115. [Google Scholar] [CrossRef]
  81. Végh, M. Z. (2013). Válságkezelés innovatív módszerekkel–Közép-Európa EU-tagállamai példáin keresztül megközelítve. In Bajmóczy Zoltán–Elekes Zoltán (Szerk.): Innováció: A Vállalati Stratégiától a Társadalmi Stratégiáig, Szeged (pp. 45–60). JATE Press. [Google Scholar]
  82. Weinel, F., & Cajias, M. (2025). Working paper identification of sustainable growth regions through innovation on NUTS-3. Urban Science, 9(4), 134. [Google Scholar] [CrossRef]
  83. Zapreskó-Farkas, E. (2024). A visegrádi országok felzárkózása–konvergenciaszámítás, 2000–2019. Területi Statisztika, 64(6), 757–778. [Google Scholar] [CrossRef]
  84. Zieliński, M. (2022). The effect of the COVID-19 pandemic on the labor markets of the Visegrad countries. Sustainability, 14(12), 7386. [Google Scholar] [CrossRef]
Figure 1. Regional distribution of key economic and financial indicators in the V4 countries.
Ijfs 14 00064 g001aIjfs 14 00064 g001b
Table 1. Sample coverage by country.
CZHUPLSKTotal
Firms included in the EMIS panel258922088861178015,238
Eurostat firm count 2023, employment above 509276586919,261326037,664
Coverage ratio27.91%37.63%46.00%54.60%40.46%
Table 2. Variable codes and definitions.
CodeVariable NameUnit/ScaleSource
Dependent variable
DEBTFinancial debtMillion eurosEMIS
Independent variables
COUNTNumber of firms in regionCountEMIS
REVTotal operating revenueMillion eurosEMIS
AVG_EBITDA%EBITDA margin, averagePercentEMIS
KURGKrugman Specialization Index (KSI)0 to 1Eurostat
GVAGross value addedMillion eurosEurostat
EMPLEmploymentThousand personsEurostat
PROD/CAPNominal labor productivity per personEuro per personEurostat
Table 3. Descriptive statistics of the examined variables.
CodeCountMeanStd. DeviationMinimumMedianMaximumShapiro-Wilk p-Value
COUNT575132.50209.228.0078.001867.00<0.001
REV57513,435.8143,510.471.075189.56693,504.59<0.001
DEBT5752443.7614,133.991.04485.01224,880.17<0.001
KURG5750.350.130.120.340.95<0.001
AVG_EBITDA%5759.272.372.999.0734.30<0.001
GVA5028.7210.441.026.0981.47<0.001
EMPL502233.18137.251.32206.55984.85<0.001
PROD/CAP50234.059.4121.3031.9586.80<0.001
Note. Monetary variables are reported in million euros as indicated. Employment and productivity are reported per thousand persons and thousand euros per person, where applicable.
Table 4. Research design overview.
Research QuestionHypothesisMethod
RQ1. How is corporate debt distributed across NUTS 3 regions, and what spatial patterns emergeDebt is geographically concentrated. Capital regions and economically advanced areas display higher levels, while peripheral regions show lower levelsDescriptive statistics and GIS-based spatial analysis using NUTS 3 assignments from Section 3.1 and coverage in Table 1
RQ2. How did corporate debt change between 2019 and 2023Corporate debt declined among firms with revenue above 10 million euros in the V4 from 2019 to 2023Primary test uses the Student’s t-test at the regional panel level. A paired t-test is reported as a robustness check, with skewness noted in Table 2
RQ3. Which factors among firm and macro indicators explain the level of corporate debtDebt correlates positively with development level, firm performance, and regional specialization once controls are includedBootstrap multiple regression with heteroskedasticity-consistent inference and country fixed effects. Specialization is captured by the KSI described in Section 3.2
Table 5. Economic and Corporate Concentration in the Capital NUTS 3 Regions of the V4 Countries.
CountryCapital NameFirms in CapitalCapital’s Share of FirmsRevenue per Firm in Capital (m EUR)Capital’s Revenue Share of Total (%)Capital’s Debt Share of Total (%)Capital’s GVA Share of Total (%)
CZPrague77730.01%18242.46%62.76%27.69%
HUBudapest90440.94%17453.97%53.77%36.88%
PLWarsaw186721.56%16326.42%45.73%13.80%
SKBratislava65136.57%7945.36%45.27%28.35%
Total 419927.56%15634.64%49.02%21.46%
Table 6. Paired sample Student’s t-test.
Measure 1Measure 2tdfpMean DifferenceSE Difference
Debt 2019Debt 20202.0431140.043 *441.049215.9
Debt 2019Debt 2021−0.8091140.420−965.6281193.2
Debt 2019Debt 2022−0.9491140.345−1222.9381288.5
Debt 2019Debt 20230.0361140.9727.315206.0
Debt 2020Debt 2021−1.0881140.279−1406.6771292.4
Debt 2020Debt 2022−1.1991140.233−1663.9871387.4
Debt 2020Debt 2023−2.5991140.011 *−433.733166.9
Debt 2021Debt 2022−2.2011140.030 *−257.310116.9
Debt 2021Debt 20230.8431140.401972.9431153.9
Debt 2022Debt 20230.9881140.3251230.2541245.2
Note: Significance levels are indicated with * p < 0.05, ** p < 0.01, *** p < 0.001.
Table 7. Bootstrapped multiple regression.
Panel A—Model Fit Measures
ModelSampleRR2Adjusted R2RMSE
M1Full Sample0.8290.6880.6838272
M1Capital excluded0.6160.3790.3691315
ModelVariableFull SampleCapital Excuded
UnstandardizedpUnstandardizedp
M0(Intercept)2489.880<0.0011092.527<0.001
M1(Intercept)8715.7580.024−2428.341<0.001
COUNT49.228 **0.00210.589 ***<0.001
KRUG4756.4030.0972122.456 ***<0.001
REV0.058 ***<0.0010.002
COVID_BIN−215.0870.197−93.0100.248
AVG_EBITDA%175.0920.24417.6920.382
GVA0.376 *0.042−0.186 **0.002
EMPL−44.667 ***<0.0016.044 *0.013
PROD/CAP−0.265 **0.0010.042 **0.008
Note. Bootstrapping based on 5000 replicates. Significance levels are indicated with * p < 0.05, ** p < 0.01, *** p < 0.001.
Disclaimer/Publisher’s Note: The statements, opinions and data contained in all publications are solely those of the individual author(s) and contributor(s) and not of MDPI and/or the editor(s). MDPI and/or the editor(s) disclaim responsibility for any injury to people or property resulting from any ideas, methods, instructions or products referred to in the content.