In this present crisis, government is not the solution to our problems; government is the problem.
—U.S. Pres. Ronald Reagan, First Inaugural Address, 1981
Why is our society broken? Because government got too big, did too much and undermined responsibility.
future U.K. Prime Minister David Cameron, keynote address, 2009
1. Introduction
Deeply embedded in Western consciousness is the “truth” about the predatory state, reflected in
Levi’s (
1988) classic
Of Rule and Revenue and reinforced by the stories of the emergence of democracy via the Magna Carta, based upon concessions by the English King in return for the financial support of elites. The core story suggests that the very definition of a political system is one that extracts resources from individuals. As reflected in the phrase “death and taxes” (are the only things inevitable), the idea that we are victims of the state runs deep in our psyche. Besides reducing profits and incomes through taxation, state spending is seen to “crowd out” private-sector activity and increase inflation as well as wage pressure (
Alesina et al., 2002). Despite such certainty, the issues around tax systems and why they differ remains “largely neglected,” particularly in regard to social and cultural forces behind tax choices (
Wainwright, 2013). Recent work on fiscal policy suggests the need for more research into how taxation, spending, and regulation shape political and economic opportunities across space and among different social groups, particularly poignant in light of the 2008 global financial and 2020 pandemic crises, and the fiscal policy emergency measures taken to manage them (
Tapp & Kay, 2023;
August et al., 2021;
Whiteside, 2021;
Spies-Butcher & Bryant, 2024).
Political currents in economic policy discourse also center on fiscal policy. The crisis of Keynesianism during the “stagflation” period of the 1970s, when both inflation and unemployment remained at high levels due to the OPEC oil price shock, seemingly closed the argument, as Hayekian-inspired monetarist shock treatment tamed inflation under Reagan and Thatcher in the early 1980s, ushering in the current “neoliberal period” of market triumphalism. However, macroeconomic tools appear to have had limited effect in addressing structural issues such as inequality and climate change, opening the way for the return to a more active role for government (
Piketty, 2014). Fiscal policy, in turn, has shifted wildly from the tax-cutting focus of Trump (austerity) to the “Inflation Reduction Act” (balanced stimulus) of Biden, with large spending increases in the U.S., and back again with the new Trump Administration, a debate repeated in other Western countries grappling with inflation-based austerity vs. stimulus in the post-pandemic period.
This article seeks to expose the superficial nature of the recurring central political debate that taxes reduce economic growth and spending tends to be wasteful. The policy discourse on taxation since the 1980s has revolved around commonly held assumptions:
High taxes and/or government spending dampen individual incentives to work and invest, and corporations to expand and invest, reducing economic growth and employment.
Extensive welfare spending based on progressive taxation reduces growth and has limited effects on inequality, because it tends to be captured by more politically powerful special interest groups.
If such claims are true, they should hold over time and space. The recent availability of new datasets over the 2000s allows us to examine in broad terms the relationships among taxes, growth, and inequality. We innovate based on previous studies by utilizing a new approach to statistical modeling, functional data analysis (FDA). FDA (
Ramsay & Silverman, 2005) offers analysis techniques that do not impose the strict linear relationships that are required in standard linear model analyses including regression and panel data analysis. The main feature of FDA is that it provides nonparametric analyses of functions rather than points. For example, in the case of growth versus tax analyses, FDA allows us to model the growth-versus-tax relationship that exists amongst states or countries not only for a given year but over a longer time period.
Our analysis leads us to conclude that fiscal policy, constrained by 3–7-year political cycles, has only a marginal effect on long-term growth or equity. We should instead look to longer-term patterns of taxation to explain the fortunes of countries and individuals. Some patterns are temporal, a form of policy isomorphism. It is common knowledge that tax rates in the West since the 1960s have tended to decline and be simplified from previously more progressive and segmented income brackets in line with the gains by pro-market advocates. As with corporate tax rates, the thinking is that simplification and a lowering of rates would improve tax collection and income mobility, based on optimal taxation theory (
Mankiw et al., 2009). That has not proven to be the case, as both deficits and inequality have tended to increase, which explains why there are renewed calls for increasing taxation on the wealthy, along with calls for flat and stable income taxation on the middle class and zero or even negative taxation on lower-income earners (
Gruber & Saez, 2002;
Diamond & Saez, 2011).
While we cannot prove ultimate causal relationships, we can demystify the assumptions around them. Rather than fiscal policy cause and effects, we can see stable geographic patterns (
Cassette et al., 2013), ones that belie the idea that tax systems must compete (to ever lower levels) in order to attract business (
Tiebout, 1956). The most clear ones are the differences between North and South, and for the U.S. vs. EU. Northern countries have more effective and direct taxation systems, and lower levels of corruption, allowing for a more positive cycle of taxing and spending. In the Global South, lower tax compliance and a heavier reliance on indirect taxes mean governments have a less sound fiscal base for
either growth or equity investments. Corruption on top of this reinforces a negative cycle of tax avoidance and lack of financial development or investment in infrastructure or human capital. The main new thrust in regard to growth explanations focuses on the importance of institutions to enforce property rights and reduce transactions costs as a way of ensuring stable and equitable growth through regulated markets (
North, 1981).
Acemoglu et al.’s (
2005, p. 387) work suggests that property rights allow for individuals and groups to compete on a fair playing field, creating “effective constraints on power-holders;” however, such notions are paradoxical in the sense that power-holders must agree to enforce a system that constrains their own (short-term) self-gain. In sum, there are clearly longer-term factors that explain the general approach to taxation by country or macro-region well beyond political elections (
Afonso et al., 2010). Our analysis reinforces the need for a more nuanced study of institutional and other unclear causal variables for fiscal patterns; these are not easily translated into ready datasets, suggesting the need for a more comparative historical case study approach. Such patterns suggest that rather than unidirectional causality, fiscal patterns tend to reinforce themselves over time. Thus, as we demonstrate, while the U.S. seemingly veers wildly from one Administration to the next, it does so within a pattern of historical constraints.
Our study adds to the emerging literature on financial geography, supporting the idea that there are wider factors beyond economics to explain the locations and flows of finance, including geographically based path dependency (
Wójcik & Bratton, 2024;
Knox-Hayes & Wójcik, 2020). While the globalization of finance, financialization, and FinTech have received increasing attention, not much has been paid to taxation (
Węgrzyn, 2025). Fiscal policy is likely to be of increasing importance given the rise of state-led capitalism in China, the role of sovereign wealth funds, and tax base erosion to offshore financial centers (
Lai, 2023). Moreover, as inequality linked to populist movements seizes attention, there is increasing discussion about fiscal policy priorities (
August et al., 2021;
Piketty, 2014).
We also have a stark difference among market-oriented states, including the U.S., Canada, and the UK in the West and more progressive taxation in Western Europe (
Esping-Anderson, 1990). Fiscal shocks play out quite distinctly in the EU and the U.S. (
Burriel et al., 2010). The rest of this article examines the relationship between taxation and growth, and then taxation and equity at a global level and across U.S. states. We begin each section with a brief overview of the literature, and then turn to the findings from our statistical analysis.
2. The Ambiguous Relationship Between Fiscal Policy and Growth
While the common assumption of most of the economics literature is that increased taxes/spending reduces growth, the empirical results from the literature are far more ambiguous. For example,
Fölster and Henrekson (
2001), when studying a group of countries from 1970 to 1995, find that levels of government expenditure are negatively associated with economic growth, both for countries in the North and the South. They state that an increase in expenditure of 10% is associated with a decrease of 0.7–0.8% in growth. The same negative relationship holds for taxation and economic growth for non-OECD countries.
Deskins and Hill’s (
2010) econometric study of U.S. state-level taxes from 1985 to 2003 finds that the effects of the level of taxation diminish from a negative effect of USD 1000 in tax increases being associated with a decline of 1.1% in growth rates to a negligible effect more recently. Yet,
Wasylenko (
1997) finds that differences in taxation have no significant effect on location decisions or levels of economic activity across U.S. states. If policymakers are overestimating the importance of taxation for economic growth, they may well be ignoring more challenging core issues in the business climate that more directly affect growth, such as the quality of education, which would, on the contrary, suggest higher taxes for its funding.
One way to tackle this issue would be to look at whether the type of taxation matters. Once more, there are ambiguous results, though the literature tends to view taxes negatively.
Arnold et al.’s (
2011) panel data analysis of OECD countries and firms between 1996 and 2004 examines the effects of different types of taxes on economic growth, productivity, and investment. They find that taxes on “immovable property” are the least harmful, followed by consumption and other property taxes, personal income taxes, and finally, corporate income taxes.
Y. Lee and Gordon (
2005) find negative growth effects of corporate taxation; a 10% reduction in rates, according to them, can lead to growth of 1.1%. Here again, we see where economic analysis stops and political/social judgement comes in. For example, VATs are easier to collect but more regressive than corporate taxes. On the other hand,
Burgess and Stern (
1993), in their overview of taxation in developing countries, make the following well-accepted observations: developing countries generally collect fewer taxes and rely more on indirect taxes. Overall levels have improved over time, but they are generally more successful in this shift to rely upon sales rather than increasing income or property taxes. The implication is that higher and more taxes are associated with higher levels of economic development but not necessarily equity.
If the flip side of taxation is government spending (though curiously few studies match them), the literature is equally uncertain about its effects, or how to prioritize spending.
Baldacci et al. (
2008), through a panel data analysis of 118 developing countries from 1971 to 2000, find that both education and health spending have positive impacts on economic growth. They find the same positive effects for improving governance and controlling inflation. These results reinforce a long-standing conclusion in the economic growth literature about the positive benefits of human capital (
Lucas, 1988;
Barro, 1996). Turning to the quality of governance as measured by corruption indices,
Rajkumar and Swaroop’s (
2008) regression exercise finds diminishing impacts of health and education spending when the quality of governance declines, suggesting factors exogenous to fiscal policy matter.
Barro (
1990) further finds that government spending in infrastructure has positive links to growth. Meanwhile
Romer’s (
1990) study stresses the importance of government R&D investments to improve economic growth, a central part of endogenous growth theory.
Becker’s (
2015) meta study of R&D investment and economic growth reinforces the findings that such spending does not “crowd out” private, market-based activity. Her observations are rather that tax credits, subsidies, and university funding all compliment rather than reduce private R&D spending.
Carlsson et al. (
2009) posit that the benefits of R&D depend upon the ability to apply it to new sectors and useful products, which is a primary driver in U.S. postwar growth.
There is similar ambiguity in regard to studies of local taxes.
Meurers and Moenius (
2020) paradoxically find that both public investment and lower taxes help explain firm locations across U.S. counties, but the effect depends on distances from economic centers.
Reed’s (
2008) well-cited study of U.S. states from 1970 to 1999 finds that (5-year) lagged taxes are negatively related to income growth. He does not find that the same relationship holds for “contemporaneous” tax effects, for which he finds positive tax effects (76). In a more recent update,
Brewer et al.’s (
2021) uphold Reed contention of a negative relationship between state taxes and income but also note that “taxes no longer have the strongly harmful, lasting effects on economic growth found in Reed,” noting that the relationship breaks down in the post-1990 period. Meanwhile, Helms’ econometric study of U.S. state spending (
Helms, 1985, p. 574) from 1965 to 1979 finds that state and local taxes are negatively associated with growth when spending is used for transfer payments (which they relate to redistribution); however, when taxes are spent on public services “such as education, highways, and public health and safety, the favorable impact on location and production decisions … may more than counterbalance the disincentive effects of the associated taxes.” Yet, other studies along these lines find that tax incentives have little discernible effect on local economic growth in the U.S. (
Reese, 2014;
DeBacker et al., 2019).
In sum, while economists are generally negative on taxation, they are positive on some types of spending, particularly infrastructure, R&D, and education. This ability to provide contradictory advice results from separating taxation from spending decisions, when in fact they are decisions about the same funds. Moreover, the line between “human capital” investments writ large and welfare expenditures is not that clear, if the latter is defined broadly as “safety net” measures. Without access to health, education, and help during times of personal or social crisis, the labor force cannot be productive.
3. Taxes and Growth-Global Analysis
It is beyond the scope of this article to cover every potential causal aspect of fiscal policy. As noted above, considering issues such as technology, human capital changes, and institutions alone would each require voluminous approaches. As reflected in the studies reviewed in this paper, no author is able to consider every potential variable that could affect growth in such a dynamic environment. For example, AI could change growth trajectories and exacerbate inequality in ways that are largely unpredictable. Moreover, data limitations prevent such a comprehensive approach.
Our aim here is much more modest—to find consistent, singular databases that cover long periods of time and see if the political assumptions about taxation, growth, and equity exhibit clear patterns across time and space. The limited availability of robust global and historical data we find that fits such specifications constrains our ability to test out more nuanced questions, such as types of taxes and spending. For example, our initial gathering of data on such revealed incommensurate measures, such as infrastructure/construction spending cutting across a wide variety of types of spending and levels of government across countries. Our question is more about the starting point—do taxes clearly impede growth but help equity?
Some reflection immediately reveals hidden complexity belying the political assumptions. For example, the simple idea that taxes are a drain ignores the fact that taxes can pay for crucial government investments in human capital and infrastructure. Thus, it is curious that the conservative anti-tax position is rarely matched to the liberal pro-government spending one in analyses in a more direct way in the literature. We can start with a descriptive approach, to simply see if the basic premise, that taxes drag down growth, holds up.
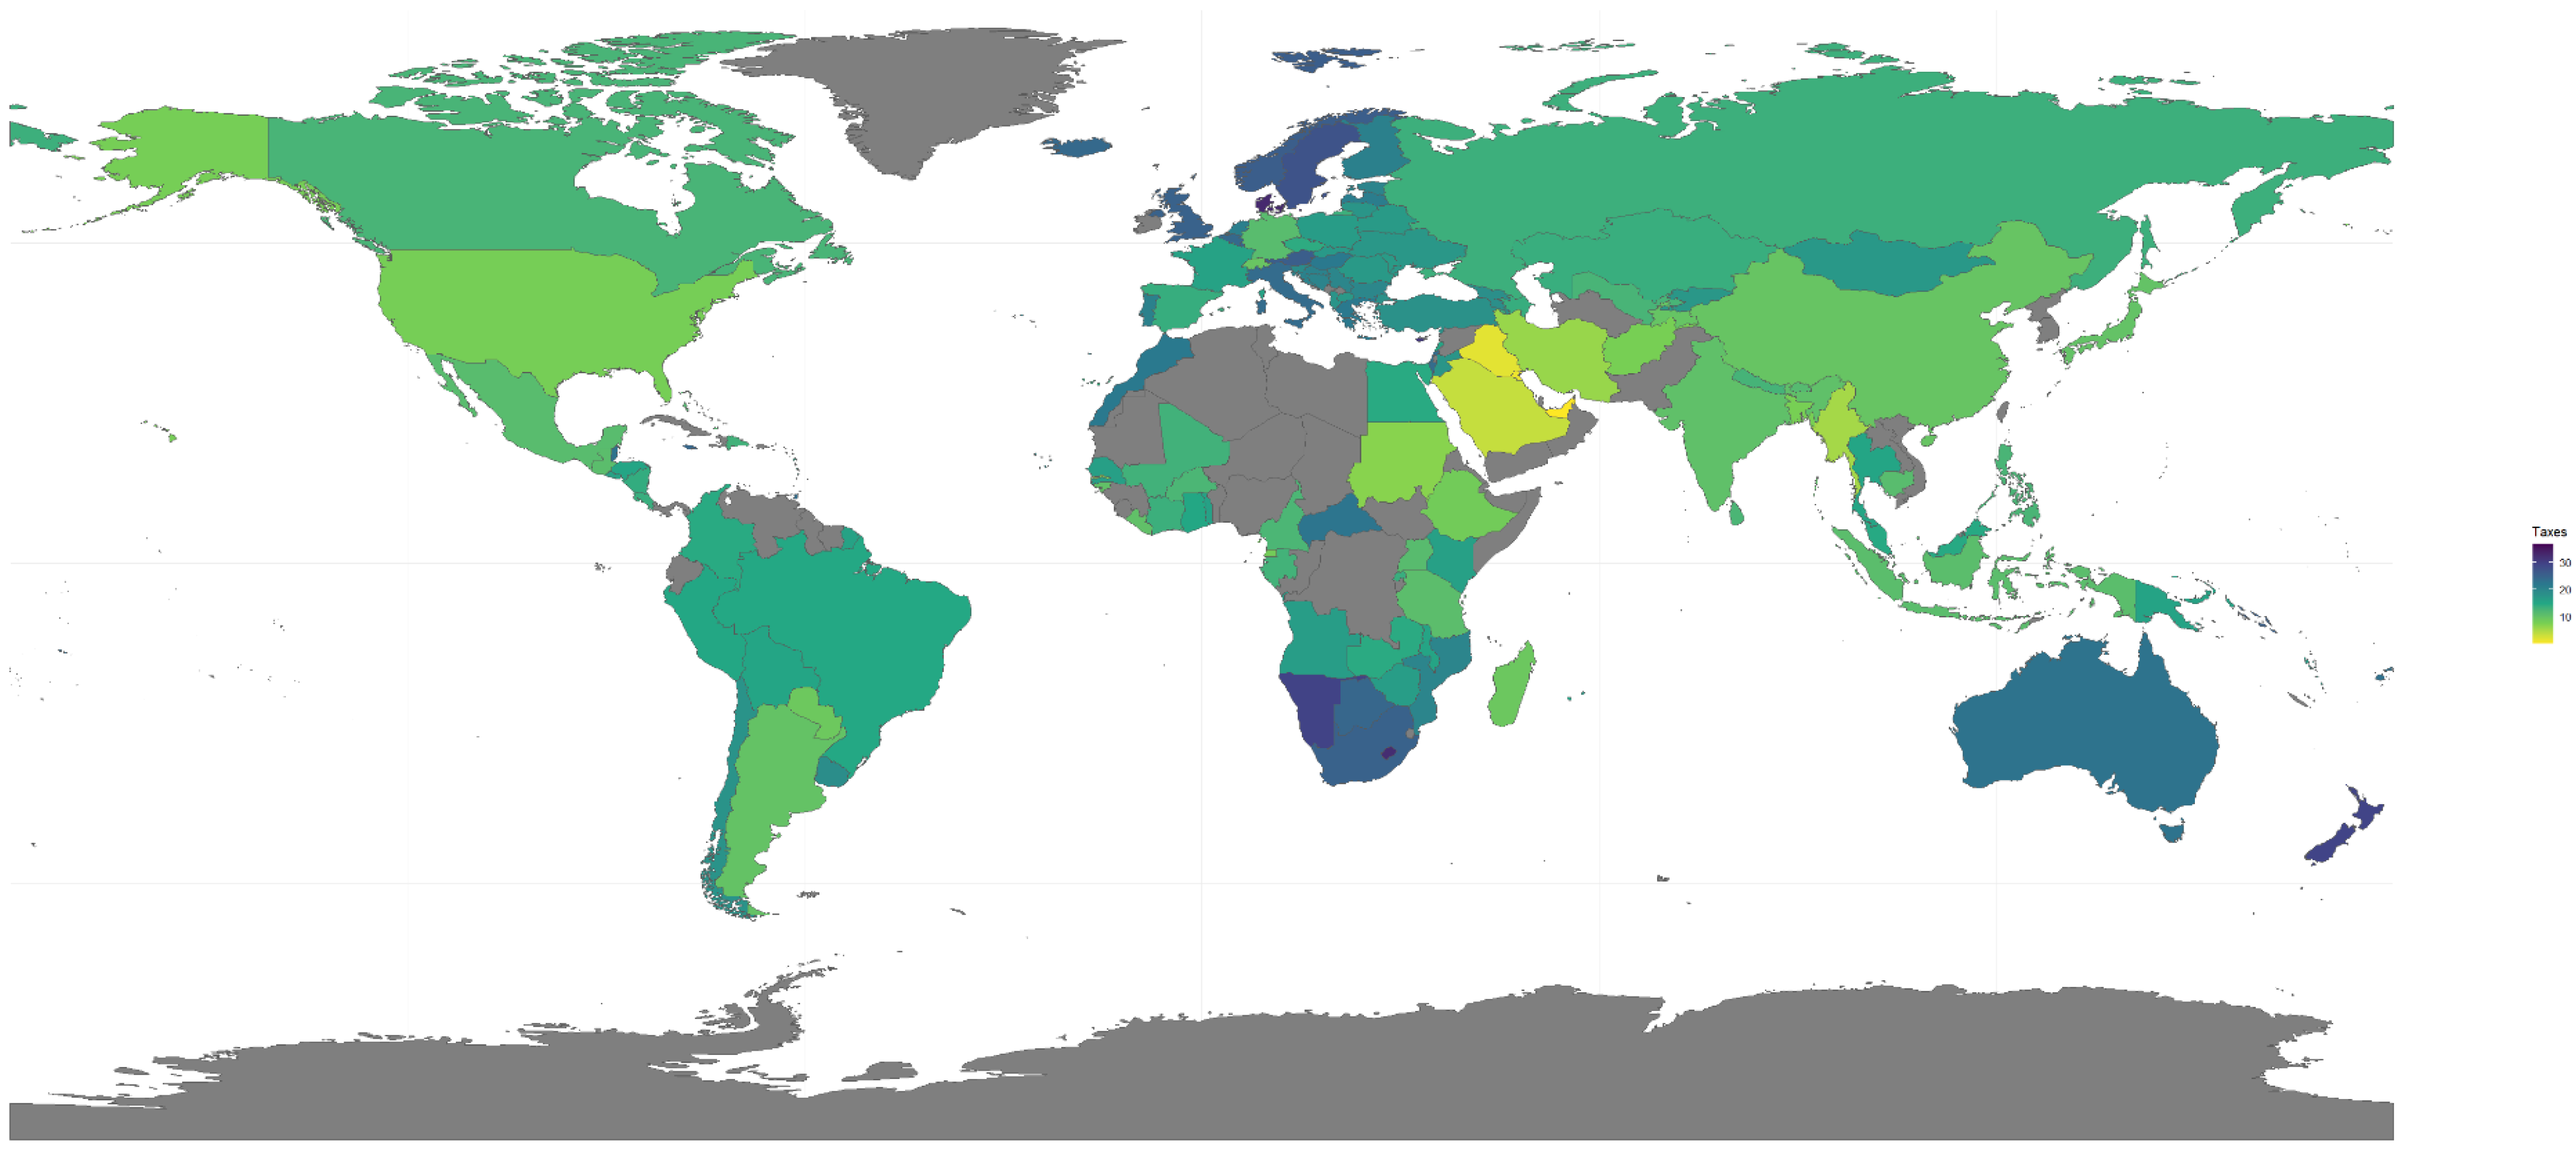
Figure 1 reflects general tax rates (not including social security) across the world. Gray areas are ones without data. Yellow reflects lower rates, light green lower–middle, dark green middle–higher, and blue higher rates.
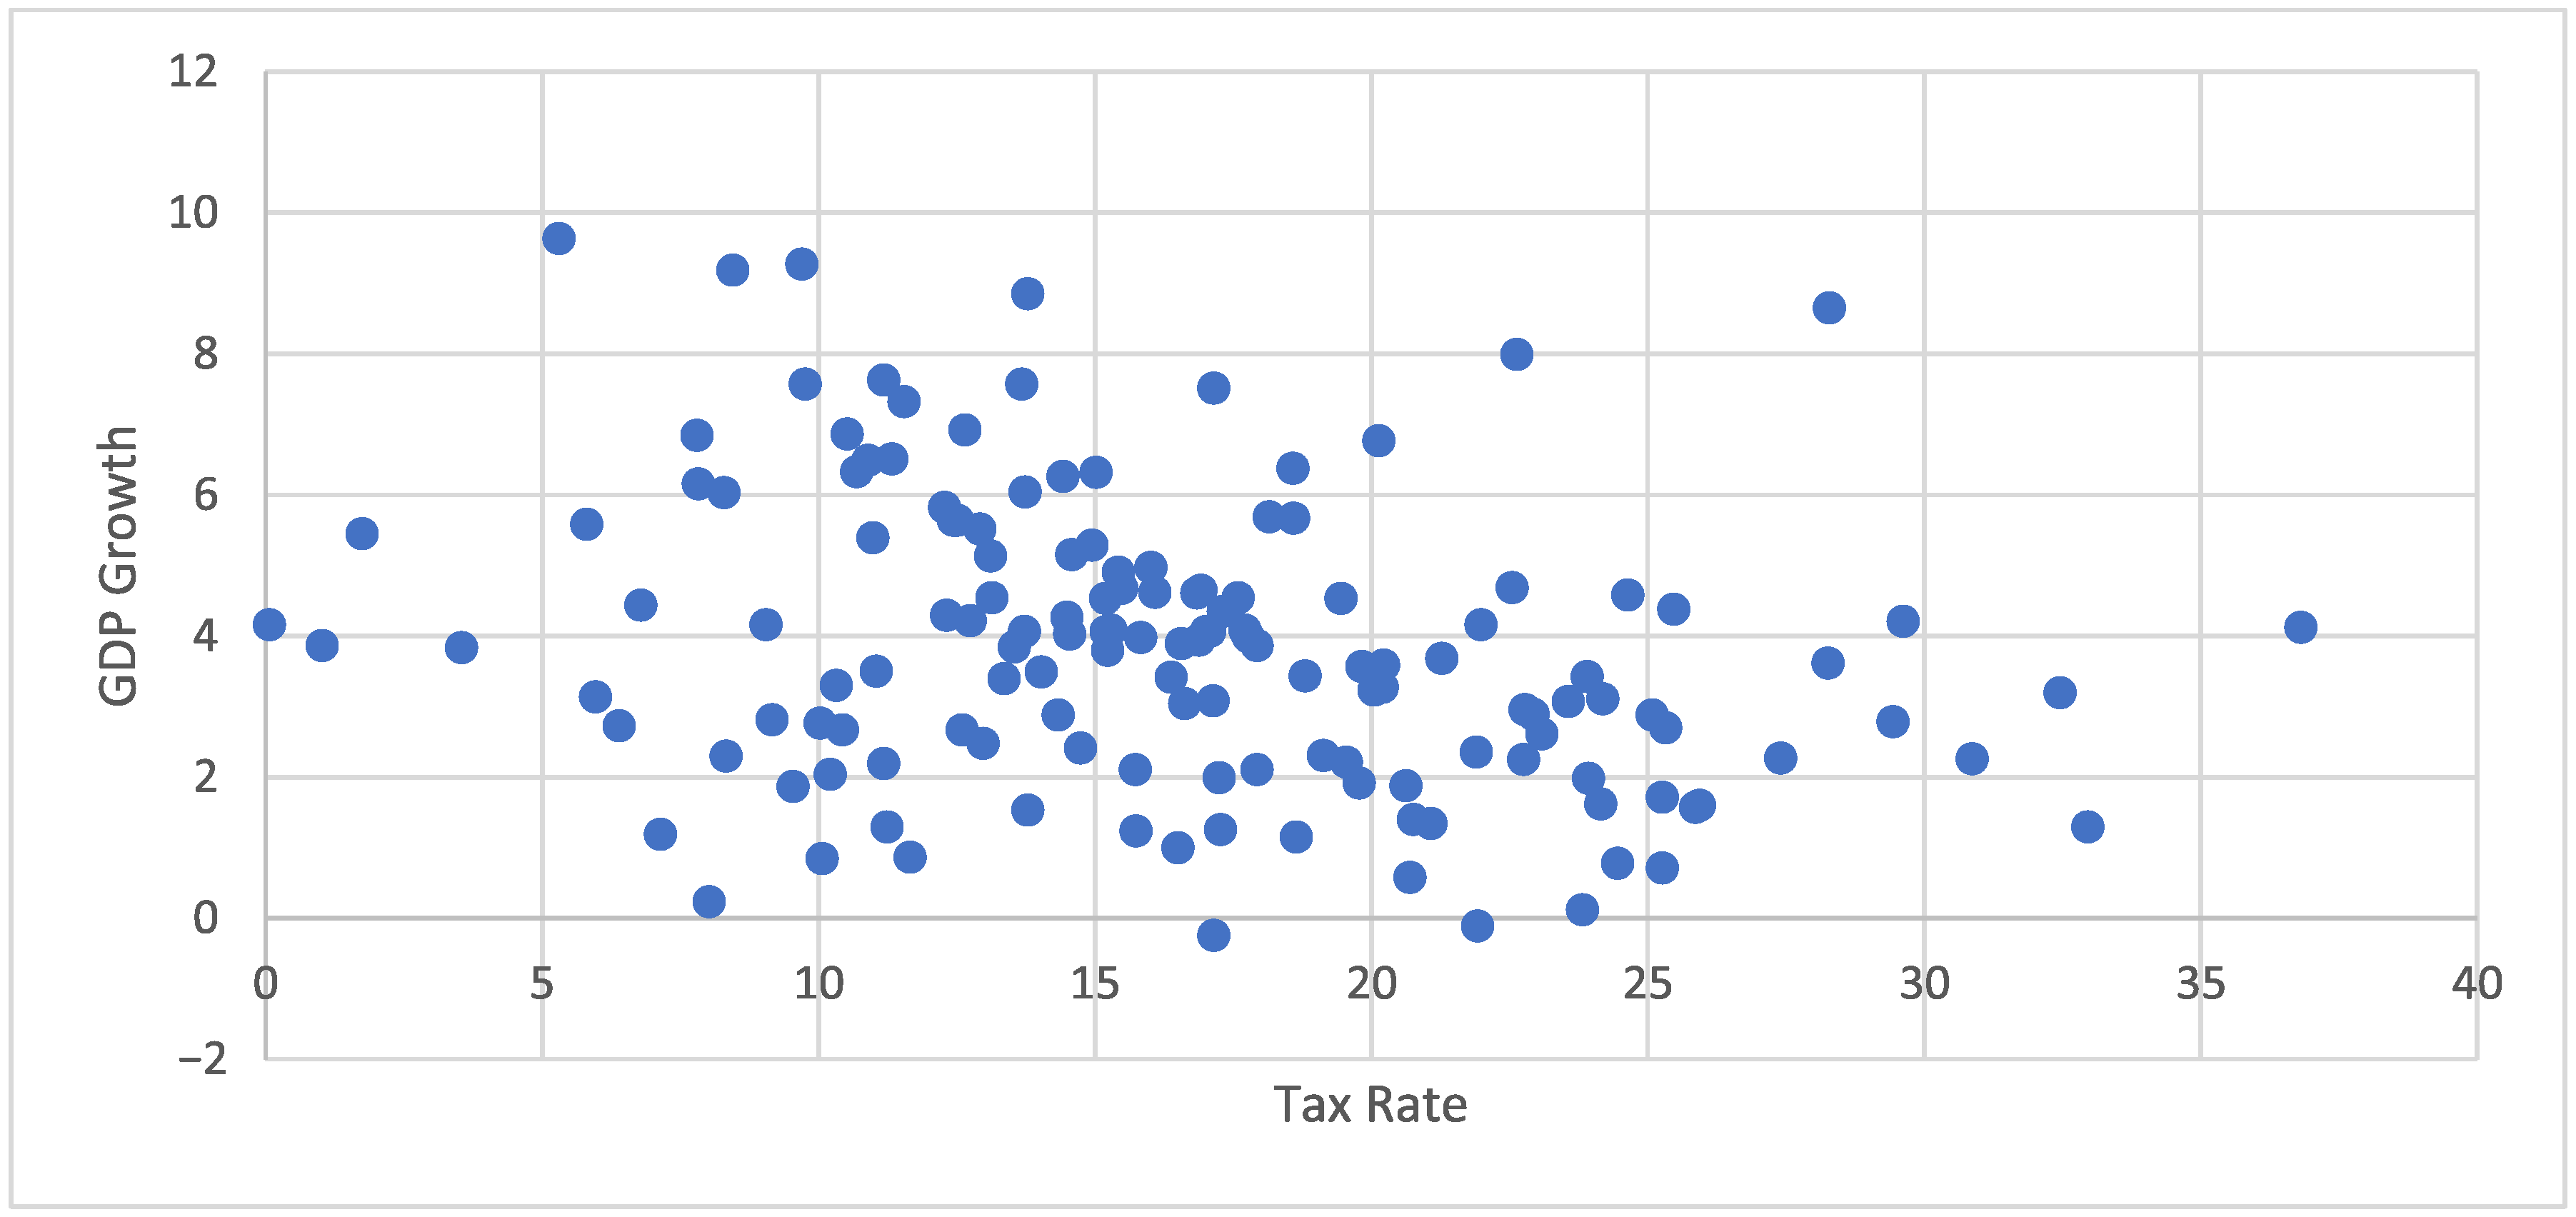
Examining general central tax revenues as a percentage of GDP (not including social security), the following scatterplot reflects a seemingly random pattern of distribution; clearly, other factors play a crucial role in growth well beyond tax rates. In examining the data, we see a striking mix of Northern and Southern countries as both high and low tax collectors. Not surprisingly, Scandinavian countries have high tax revenues; however, so do several countries in the South, such as Macau and Namibia. Looking at the bottom of the list, we are not surprised to see Middle Eastern oil exporters such as the UAE, Kuwait, Iraq, and Saudi Arabia with low taxes. There are also failing states such as Somalia, Afghanistan, and the Republic of Congo. The U.S., Switzerland, and Japan also have relatively low tax collection, with rates between 10 and 11%. The U.K., avowed as a twin market-based economy to the U.S., actually has a much higher tax rate, averaging 25.27%.
We need to recognize that such figures do not reflect tax collection effectiveness, which is fraught in the South, and increasingly in the North as well (
Hira et al., 2019).
Gordon and Li (
2009) estimate that the size of the informal economy in the South ranges from 14% in the middle-income countries to 32.5% in the poorest ones. They point to the challenges of taxation when only a limited percentage of households and businesses have access to the formal banking sector.
3.1. FDA of Taxation and Global Growth
We implemented functional data analysis (FDA), with growth and equity being dependent variables and the level of taxation being the independent variable. We did not consider specific types of taxes or spending as there were inadequate data. The models were fit using U.S. and global data. We selected functional data analysis (FDA) because it is best able to handle the characteristics of our time series, cross-state/country data. Such data have the characteristic issues of autocorrelation and heteroskedasticity, as there are widely varying economic and political bases for each unit of analysis. We do not attempt to claim that FDA is superior to other methods, as it is out of the scope of this article to do so, but simply to try a new technique that can add to the insights of the existing literature.
FDA has been increasingly applied in biology, criminology, and economics since the early 2000s (
Ainsworth et al., 2011). Unlike panel data analysis, which is often used for cross-country regression comparisons, FDA takes a regression approach, treating each dataset as a whole function, rather than looking at individual data points. While OLS regression focuses on variables, FDA examines processes, in the multi-dimensional aspect of functions, seeking out continuity and smoothness across relationships over time. Also, FDA makes no parametric assumptions (e.g., linearity) between the dependent and independent variables. Our FDA models consider the relationship between y (growth, equity) and x (taxation) for a given year, and then this relationship is extended over multiple years. FDA seeks to smooth out variations within the dataset in order to better define the relationship (function) over the whole period (
Kokoszka, 2017, pp. 2–5). In a sense, what FDA attempts to enact is to draw a smooth curve through each country’s annual tax rates—not just connecting dots, but capturing the underlying functional shape. This transforms discrete tax changes (e.g., 2010: 25%, 2011: 24%, 2012: 22%) into a continuous policy trajectory τ(t) that reflects how quickly and smoothly reforms were implemented, thus revealing the underlying policy framework and momentum behind them. As one anonymous reviewer states, “the (FDA) approach can model transfer policies as dynamic trajectories rather than static levels, capture the distributed lag structures and non-linear thresholds in human capital returns, and handle the sparse, multi-source inequality data by converting discrete measures into smooth functional objects.”
The analysis examines whether the function assumes a distinct form, such as a concave shape (
Ramsay & Silverman, 2002, p. 15). Thus, there are no assumptions of linearity in the analysis. In treating each unit as a separate function, FDA is able to compare across trajectories without making common assumptions of their nature (
Dass & Shropshire, 2012). Given the potential for lasting effects from either shocks or changes in trajectory, we use logarithmic transformations to smooth out accelerations and examine lags in the relationship between the dependent and independent variables (
Ramsay & Silverman, 2005, pp. 27–30). FDA has been applied elsewhere to understand how global crises affect stock market returns in the G7 countries (
Das et al., 2019).
We assert that FDA has major advantages for our data structure over the widely used tool of linear regression. Suppose that we have, for the
i-th year, 50 states where the j-th state has a dependent variable y
ij corresponding to economic growth and an independent variable x
ij related to taxation. If we are interested in examining the linear relation between economic growth and taxation in the i-th year, we may consider the simple linear regression model
where
are error terms that are typically assumed to be independent and normally distributed for the states j = 1, …, 50.
Our primary interest in Equation (1) concerns the parameter . If it is significantly positive (negative), then we would conclude that economic growth and taxation are positively (negatively) associated in year i. A problem with simple linear regression in this context is the strong assumption of linearity expressed by . Another problem with the simple linear regression analysis is that there is a corresponding regression equation for each year. An economist would not want to fit all of these regression equations individually because there is a natural belief that is related to , for example. The relationship that we observe in one year is likely similar in the subsequent year. A concurrent FDA model takes the relationship between the terms into account and through nonparametric methods introduces smoothness between the yearly terms. Therefore, in concurrent FDA models, it is informative to look at plots of estimated parameters versus the year i. If, for example, the plot is demonstrably above zero, then this suggests that economic growth is positively associated with taxation, and that this relationship exists over the timeframe of the dataset (examining the curve of the set of points).
3.2. Results of FDA of Global Growth Versus Taxation
Because of data limitations with the Gini coefficient, the FDA results are only discussed for the analysis of global growth vs. taxation.
Figure 2 provides a scatterplot of GDP growth vs. tax rate, demonstrating no clear relationship at first glance.
In
Figure 3, we provide the plot of
versus the year i for the FDA of global growth versus taxation. The analysis was restricted to 59 countries over the period of 1998–2019, where the growth variable y
i was defined as the percentage increase in GDP from year i − 1 to year i and the taxation variable x
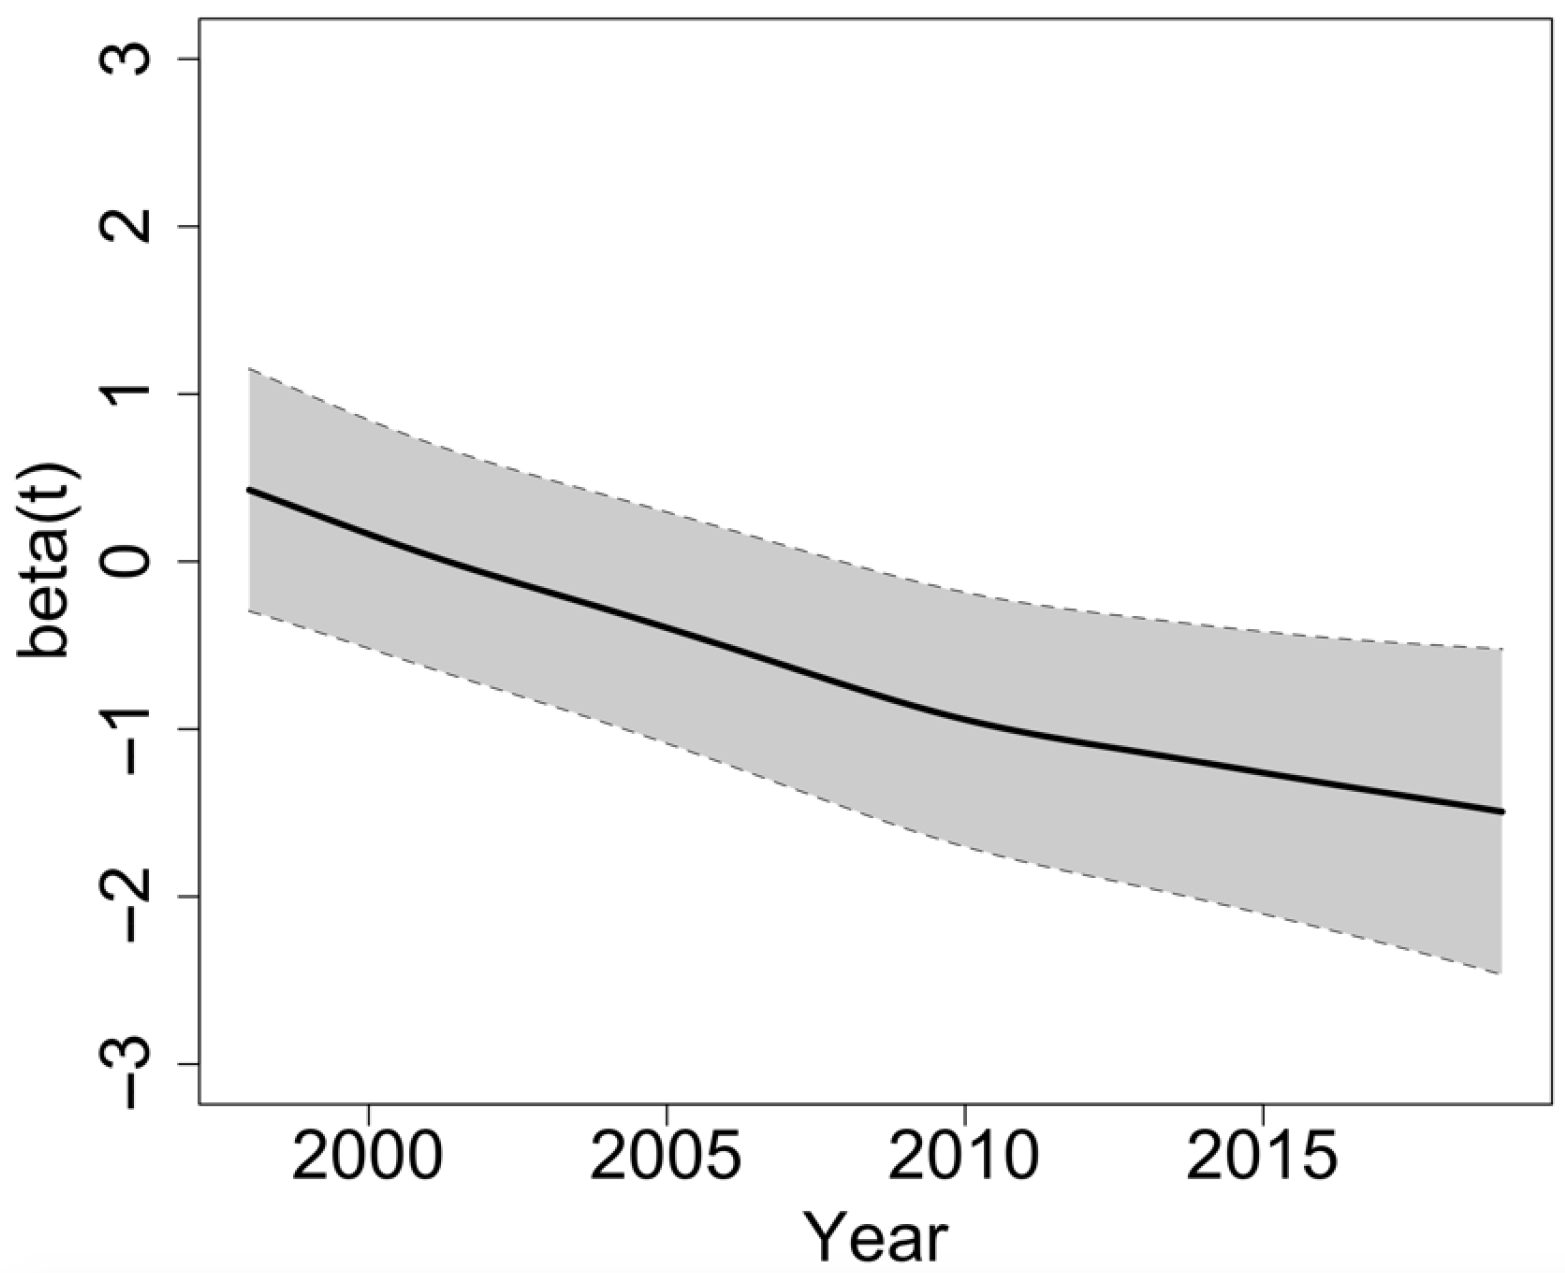
i was defined as the logarithm of total taxes relative to GDP in year i. The FDA was based on complete data from the 59 × 22 = 1298 country/year combinations. As was the case with the U.S. data, the primary message from
Figure 3 is that increasing taxation is associated with the decreasing economic growth (i.e., the
parameters are predominantly negative). The parameters are entirely negative from 2002. We also note that
Figure 3 has the same decreasing shape as can be observed in
Figure 1. This implies that for the global data, the same level of taxation is associated with
negative growth in recent times compared to the early 2000s.
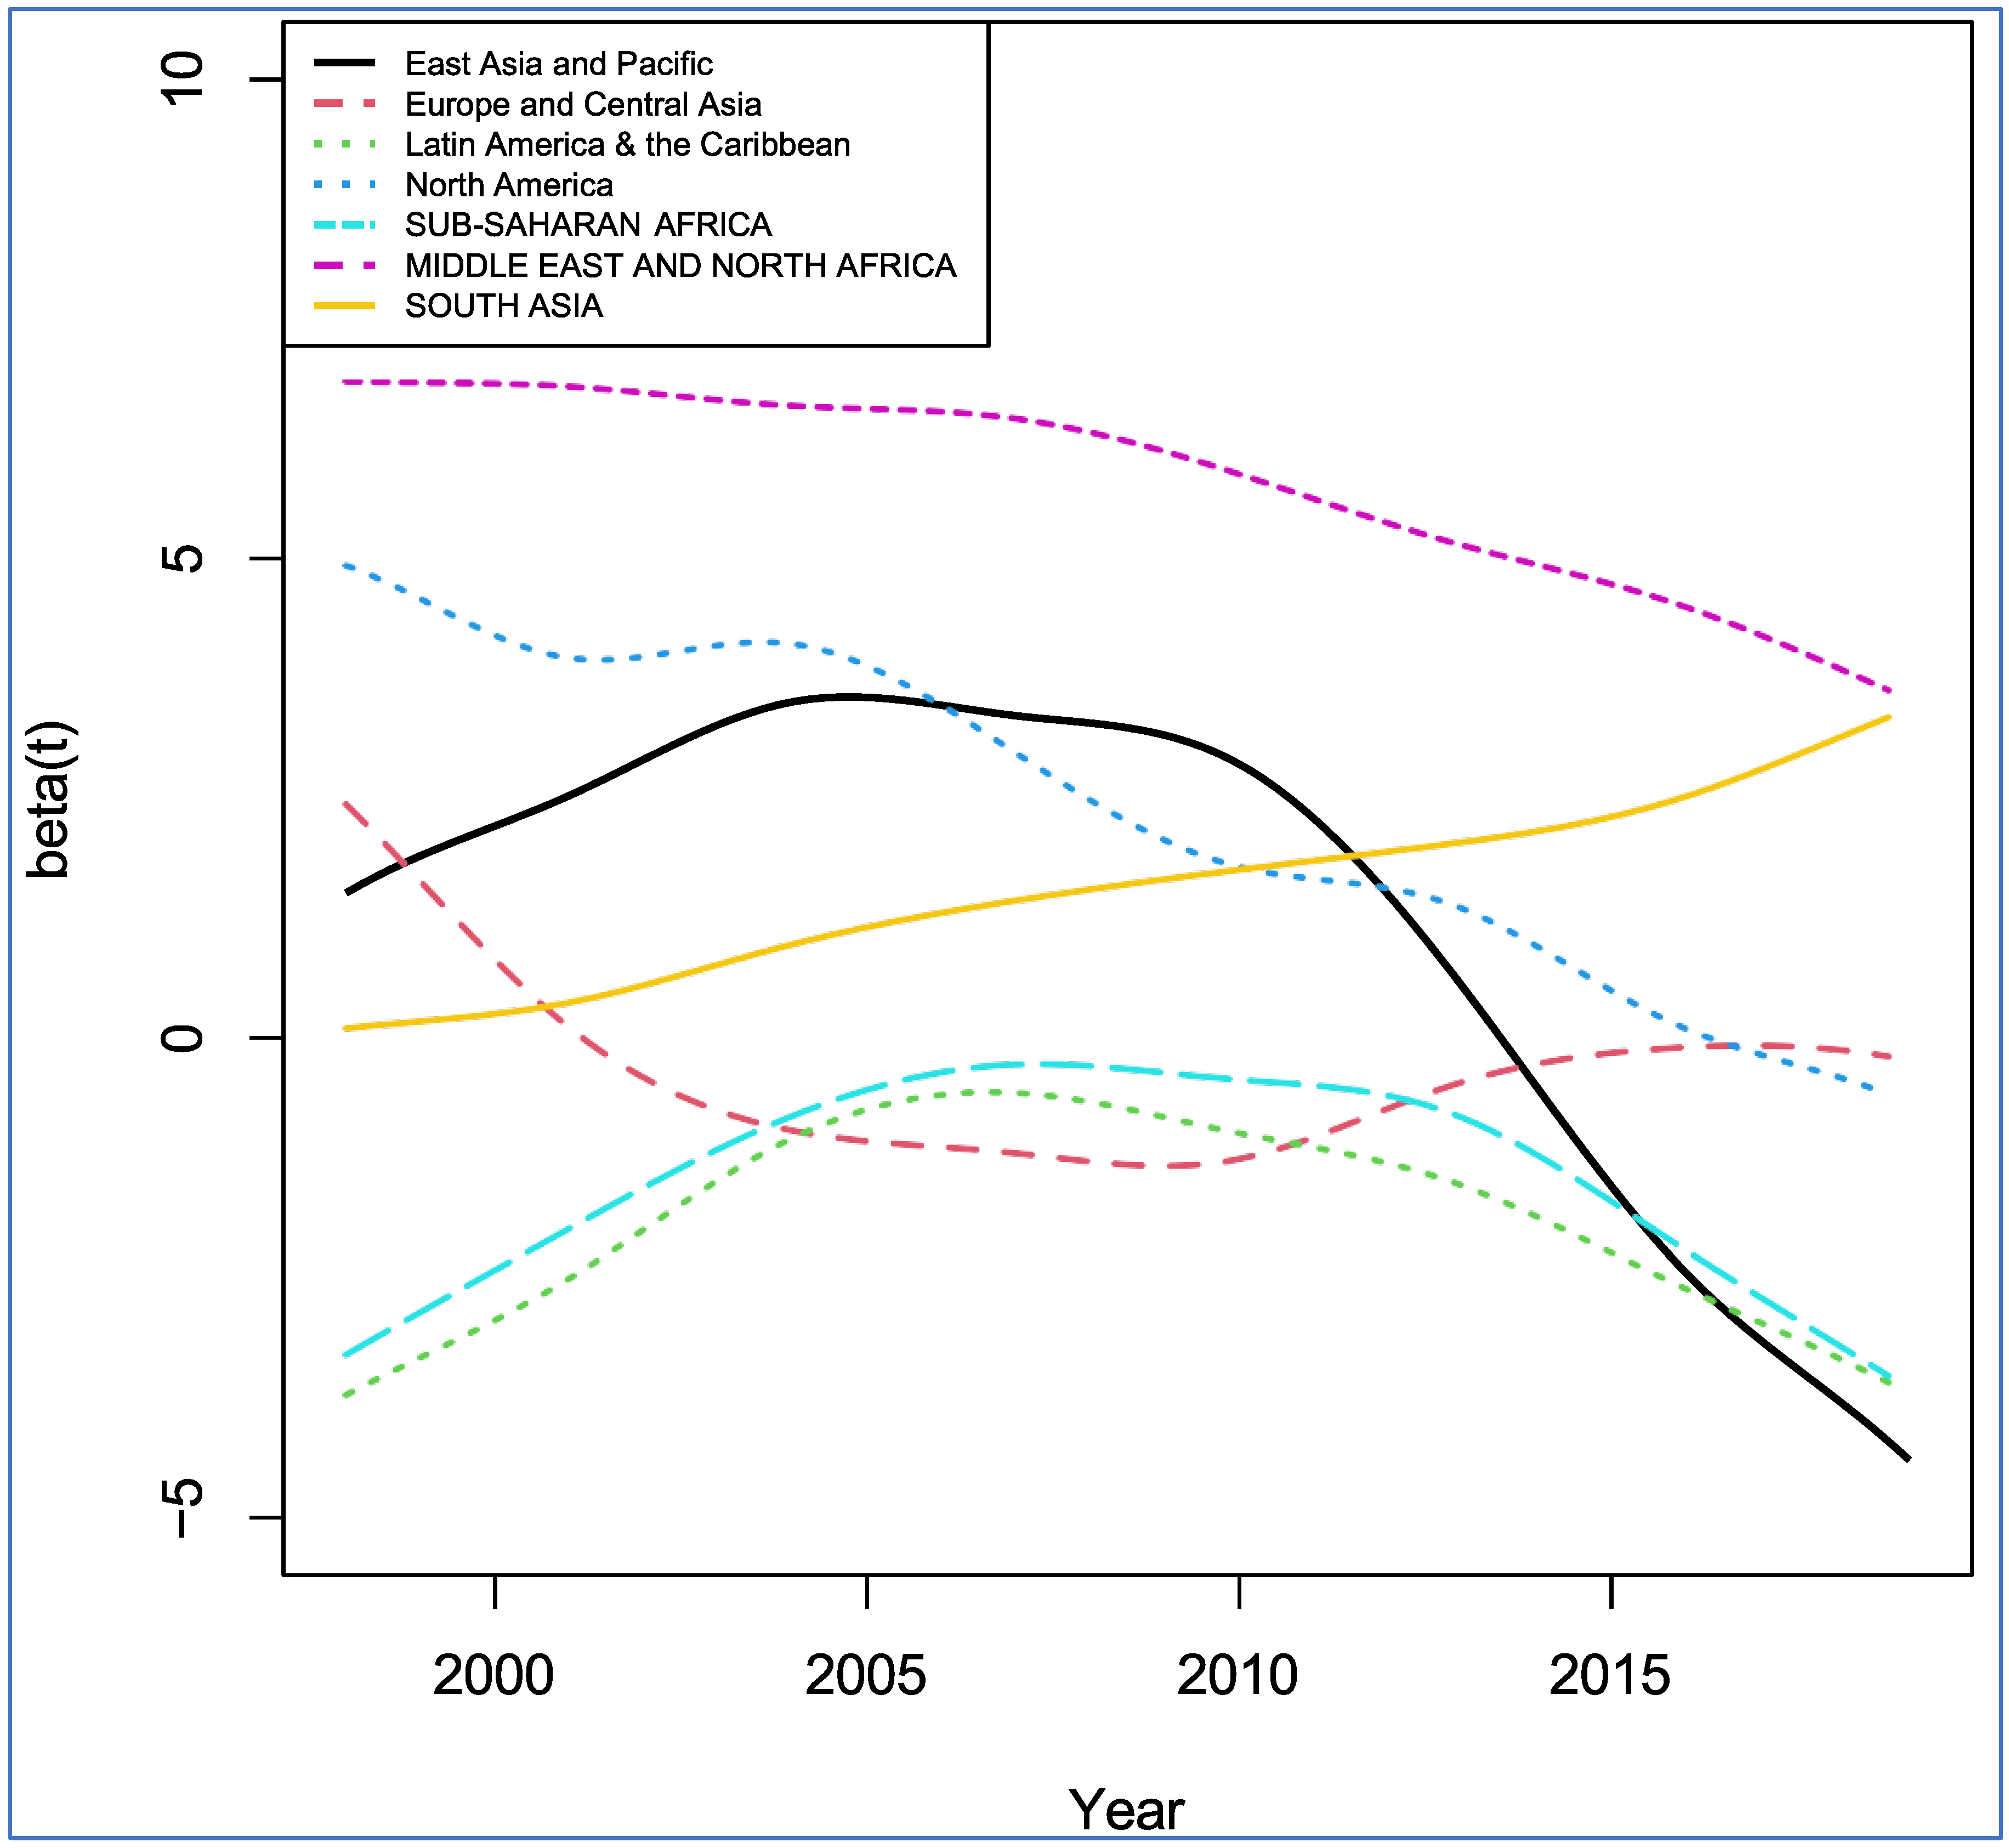
Our analysis suggests that the premise that there is a general tradeoff between taxation and growth holds, but inconsistently over time. Moreover, if we start to break down the patterns by macro-region, we can see in
Figure 4 that the relationship is not robust. The geographic macro-regions are defined based on the World Bank’s geographic designations (
https://datahelpdesk.worldbank.org/knowledgebase/articles/906519, accessed on 10 May 2024).
The results reveal that taxation negatively affects economic growth in sub-Saharan Africa and Latin America and the Caribbean. Conversely, it has a positive impact on economic growth in the Middle East, North Africa, and North America, though this positive effect diminishes over time. In East Asia and the Pacific, taxation exerts an increasingly positive effect on economic growth, with the effect turning from positive before 2013 to negative afterward. In Europe and Central Asia, taxation has a minimal impact on economic growth. In short, there is a time-varying relationship between taxation and growth over time and space. This reinforces our point that the nature of taxation also changes over time and space and thus we need to be far more cautious about accepting the common knowledge assumptions about its negative effects on growth.
One possible reason for the general shift in trajectory towards negativity is the 2008 global financial crisis. The crisis led to major declines in growth as real estate and financial markets collapsed, thus suggesting that the preceding relationships are more likely to hold during “normal” economic periods. Positive relationships in East Asia and North America and a neutral relationship between taxation and growth elsewhere undoubtedly raise questions about the capacity of government to make effective investments, such as in human capital, and suggest that government spending is conversely far less effective in Latin America and sub-Saharan Africa. This suggests that the main social/policy question is more likely about government capacity to make effective investments rather than the level of taxation. Unfortunately, there are no good datasets around government capacity. The World Bank’s Governance Indicators and Transparency International’s Corruption Perceptions Index, for example, have well-documented limitations, such as a reliance on surveys of foreign businessmen or on the timing of individual regulatory processes. Nonetheless, it is interesting that such measures rarely reveal changes in a country’s rank order position. We test this theme further by unpacking the main target of conservative critics of taxation, namely transfer payments.
4. The Effect of Transfer Payments on Growth and Equity Is Equally Unclear
There is a general assumption that transfer payments to the poor hurt growth by reducing investment and raising interest rates (
Clark et al., 2006). Beyond that are the political tropes that the poor “are lazy” and that government “largesse” reduces work ethic. On the other side, progressives rest their case on compassion and as an investment in human capital. Even conservatives seem to recognize the value of helping the indigent and those negatively affected by changing circumstances, such as trade adjustment assistance and pandemic relief. However, theorizing about the issue of inequality is even more challenging than growth given the lack of robust datasets. Like tracking the health effects of emissions from climate change, inequality could have many different sources at different levels, from wealth being passed down to commodity concentration of a country’s exports.
The general relationship between inequality and growth remains controversial.
Anderson et al. (
2016) conduct a meta-analysis of regression studies and find moderate evidence that spending reduces inequality, which they state is “underreported” in the literature.
Persson and Tabellini (
1994) find a statistical link between inequality and slower growth for democracies, but this view is not consensual.
Kennedy et al.’s (
2017) recent study of Australian states finds that inequality has increased since the early 1980s, and that, after a lag period, it “adversely” affects economic growth. They point to the importance of both physical and human capital for growth, implying the importance of government investment. Such notions are commensurate with long-standing Keynesian contentions around multiplier effects, the idea that putting money into workers’ pockets increases their spending and spurs their economy, as championed by Ford’s famous policy to increase his workers’ salaries so that they could buy the Model Ts (autos) they fabricated, but are not well supported in the econometric literature.
Berg et al. (
2018) examine the relationship between inequality and growth through a panel data analysis. They go to lengths to examine inequality after government transfers (net of taxes and subsidies). They find that lower inequality is associated with “faster and more durable” growth. Redistribution (via government spending) has a “benign” effect on growth except when it is “very large.” Inequality negatively affects economic growth through higher fertility and lower education and life expectancy rates. They thereby dismiss the conservative idea that higher inequality could have beneficial impacts on growth, for example, through improving capital concentration for investment. Moreover, unequal societies have less consistent growth and are more prone to longer recoveries after the event of an economic shock.
There
is a consensus around the abandonment of the earlier popular
Kuznets (
1955) curve, which expected that inequality would increase initially, then flatten out and eventually decline as a country developed. Most economists are far more unclear about any shared pattern;
Piketty et al.’s (
2018) U shape of declining inequality in the West during the middle of the 20th century followed by a more recent rise from the 1980s has gained some traction. Finding such a pattern is distinct from claiming any clear linkage between economic growth and income distribution (
Partridge, 2005), though it would be uncontroversial to claim that growth reduces absolute poverty.
There are patterns over time. It is clear that tax rates in the West have generally declined since the 1980s, and this overlaps with an increasing trend of inequality.
Frank (
2009) supports this view, finding that income shares of the top decile were stable after World War II, but increased substantially during the 1980s–1990s, driven by increasing income at the top end of the distribution. Similarly,
Heathcote et al. (
2009), when examining inequality across the U.S. from 1967 to 2006, find a steady increase in income and wealth inequality over the sample period. Taxes and transfers “compress” (reduce) income inequality, especially at the bottom of the distribution, but “have little overall effect on the trend” (44). In other words,
spending may reduce hardships, especially in counter-cyclical periods, for lower-income populations, but it
does not affect relative inequality over the long run.
There is an emerging literature that points to deeper roots of inequality patterns than fiscal policy.
D. S. Lee (
1999) points to the stagnant minimum wage as one key factor in rising inequality in the U.S. Emerging authors instead approach inequality as measured by intergenerational mobility, and they find that on a country-by-country basis, there is clear evidence that a lack of mobility inhibits future growth (
Aiyar & Ebeke, 2019). However, as with the lifetime income/savings studies, such data are hard to gather, and our knowledge is thereby limited. Examining long-term postwar trends,
Morris and Western (
1999) suggest unionization, globalization, shifts from manufacturing to services, and major workforce demographic shifts including more women entering the workforce, the baby boom, and increases in immigration all may have played a role in rising inequality. At the same time, there is a mainstream economic literature that posits no measurable effect of trade/openness on inequality (
Beaton et al., 2017).
5. Transfer Payments Appear to Make a Difference to Inequality, if Sustained over Long Periods
There are no consistent global inequality datasets over long periods of time. Inequality is generally measured by the Gini coefficient, which examines income differences across lower and higher percentiles of a population, but does not address wealth. Unlike growth, Gini is not a widely scrutinized macroeconomic variable in most countries, and thus estimates on a point-by-point basis are more problematic; however, we believe it is sufficient for identifying the general patterns we seek here. While it would be ideal to examine income shares as well as intergenerational wealth, outside of
Piketty’s (
2014) tax-based study of Western countries, no robust global dataset along these lines exists. Many countries have inconsistent entries in the World Development Indicators of the World Bank for Gini between 2005 and 2015, so taking an average across these years allows us a general comparison.
The most unequal societies, seen in the left-hand column of
Table 1, are all in the South; however, they include many middle-income countries, including some with relatively high growth rates, such as Botswana, which averaged a growth of 4.79% over the period. In terms of lower levels of inequality, we are not surprised to see the Scandinavian countries, but alongside them are Eastern and Central European countries. Here, again, we cannot paint any easy picture that higher government expenditures necessarily lead to lower inequality or vice versa.
Thus, it is important to take a deeper look at whether this apparent deficiency is made up for by measurable improvements in equity outcomes over the long run. To do so, we examined the Standardized World Income Inequality Database (
Solt, 2020), to provide some observations on long-run inequality for select countries. It is the only consistent historical global inequality database that takes into account transfer payments that we could find.
Table 2 provides the earliest reported year for pre-tax, pre-transfer, and post-tax/transfer Gini estimates of household income. The reason for separating out the pre- and post-transfer Ginis is to try to control for the movement of the Gini due to other factors, such as a recession or the rise of the financial sector, which are more likely to increase inequality. By isolating the effect of transfers, we can see more clearly whether they really make a difference,
even when general conditions for inequality were deteriorating. We have included all countries that have data points beginning in the 1960s, as well as the difference between the earliest and latest years.
Even with limited data, our analysis of the Solt database does indicate (in col. c) that social transfer expenditures can make a significant difference to income inequality, at least for countries/regions in the North, especially in the EU, where the social welfare state is more extensive. Countries/regions in the South demonstrate negligible effects on Ginis. Countries/regions in the South simply do not have much in the way of transfer payments. Finally, we notice in the columns (d, e) that there are in general two groups of countries/regions in regard to historical performance on inequality. Most show slight deterioration in terms of inequality over long periods of time, regardless of government spending, with the Gini remaining within 0–3 points. A number of OECD countries including the U.S., UK, Germany, Australia, and Japan show significantly worsening income equity from the 1960s to the current decade. However, Western European countries in general had less deterioration of income inequality than other countries, due to their transfer payments.
Our FDA did not reveal clear results about the relationship between taxation and equity; however, our overall conclusion is that transfer payments do generally improve equity over the long run. Such findings resonate with other global econometric studies of transfer payments, such as
Caminada et al. (
2021), who find social transfer payments reduced poverty by 18% across 49 countries, with social security payments accounting for 81% of the reduction, family and children payments 14%, and unemployment 8%.
Wimer et al. (
2020) find that transfer payments “greatly” reduced poverty in the U.S., particularly for households with children.
6. Analysis of U.S. States: No Clear Patterns for Size of Government and Growth or Equity
We were able to obtain tax records, GDP, GDP growth, and Gini (inequality) data for 2006–2019 for U.S. states. Gini is only available from 2006 to 2019, so that was the limiting factor. Consider that the U.S. average growth rate for the period was 1.8%. We find a great deal of clustering across states, despite huge differences between “red” low-tax states such as Texas (GDP/K of USD 55,254 and average growth of 3.26%) and “blue” high-tax states such as Washington (USD 60,960 and 3.43%). It seems clear that other factors, such as a tech or resource boom, are far more important than fiscal policy.
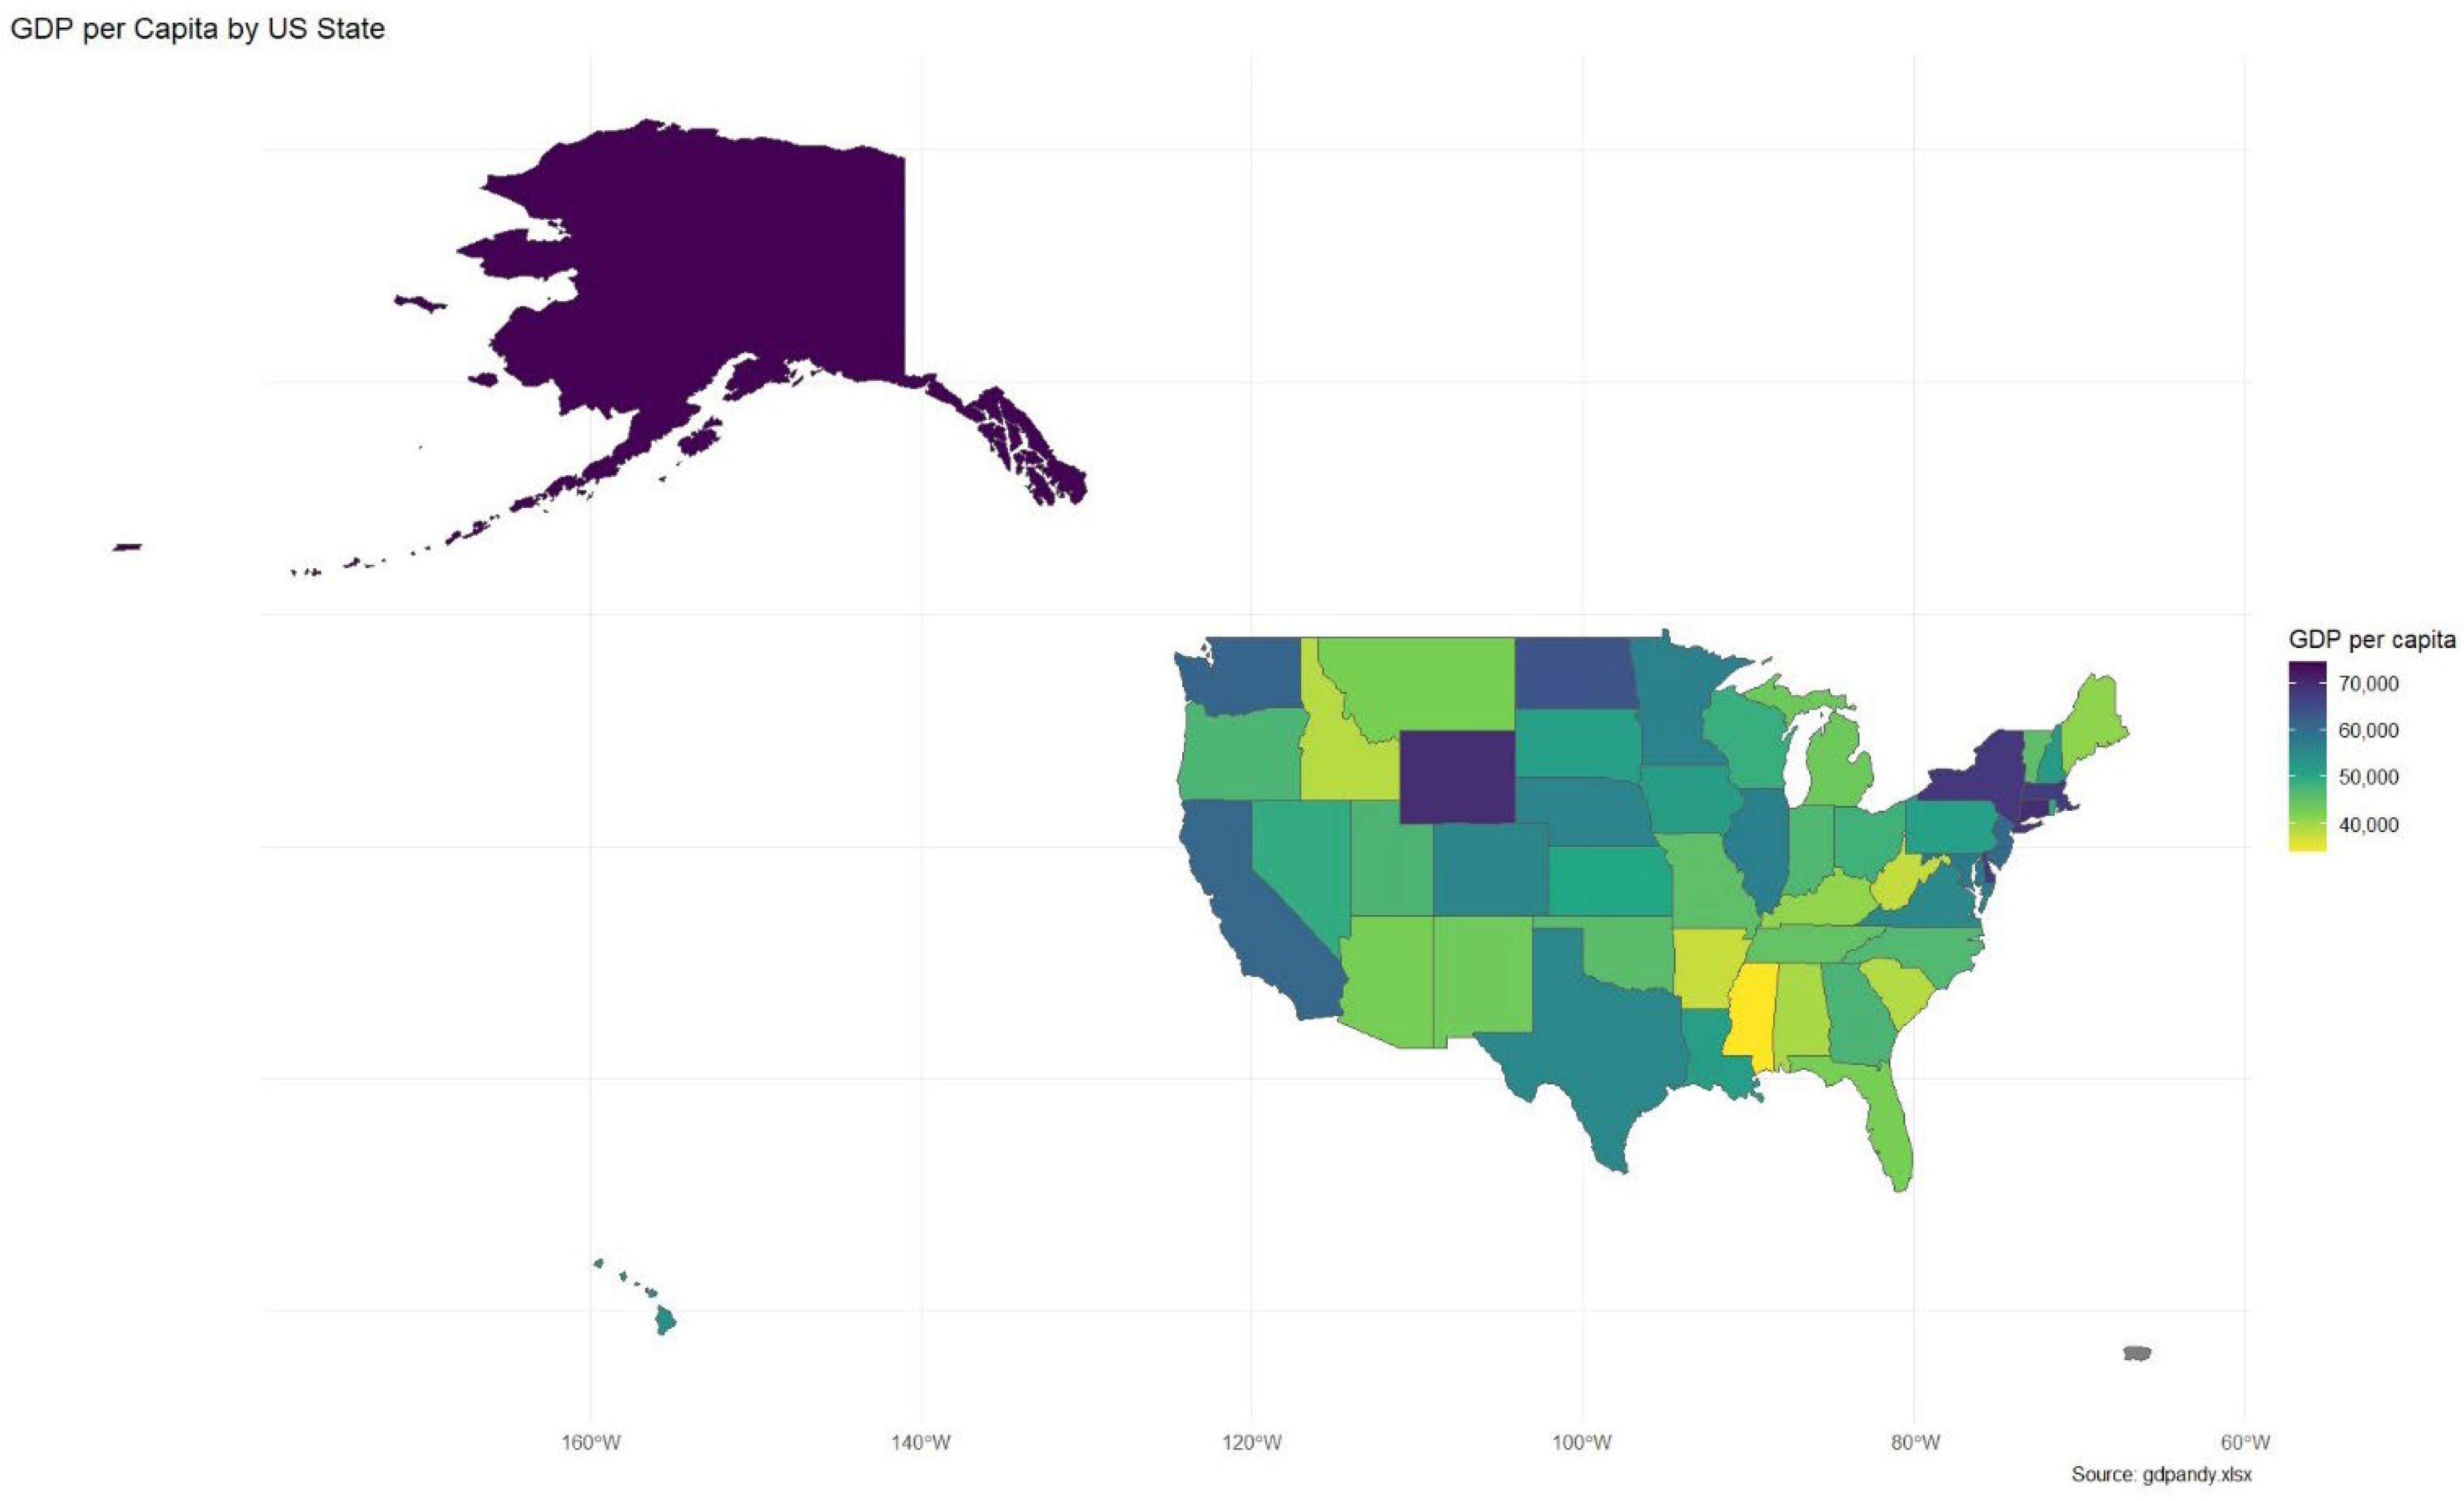
In order to drill down further, we calculated the GDP per capita (see
Figure 5), overall average tax rate (% of GDP), and rate for key tax categories (as a % of overall taxes) by state for the period of 2006–2019. A note of caution is in order, as this includes only taxes on the state level; local tax collection varies considerably. There are many different ways to consider economic performance vs. taxation and the reader can use the
Appendix A data to conduct their own analysis. Here are a few highlights. The national range of overall tax rates is surprisingly limited, with the overall average for the U.S. being 5.5%. As we can see in the map below, the lack of correlation between taxes and income is underscored by the range of per-capita income by state.
The fastest-growing states have a wide range of both overall tax rates and types of taxes. North Dakota’s 7.8% tax rate is considerably higher than Texas’ rate of 3.35%, though both rely very heavily on sales taxes. The slowest growing state is low property tax state Louisiana, with an overall tax rate of just 4.3%. Low-growth Vermont stands out with a high property tax contribution of 34%. This is related to its state welfare programs, including its unique health care coverage for all citizens. Beyond that, only five states collect property taxes in the double digit percentages (as a % of overall taxes), New Hampshire, Wyoming, Arkansas, Washington, and Montana, all with very different growth rates. In fact, the percentages by types of tax collected are remarkably consistent in states across time.
Turning to inequality, both fiscally liberal and conservative states are unequal. Progressive New York, D.C., Connecticut, and California as well as conservative Southern states such as Louisiana, Mississippi, and Florida are the most unequal. Here, again, there is no prima facie pattern to fiscal policy and inequality.
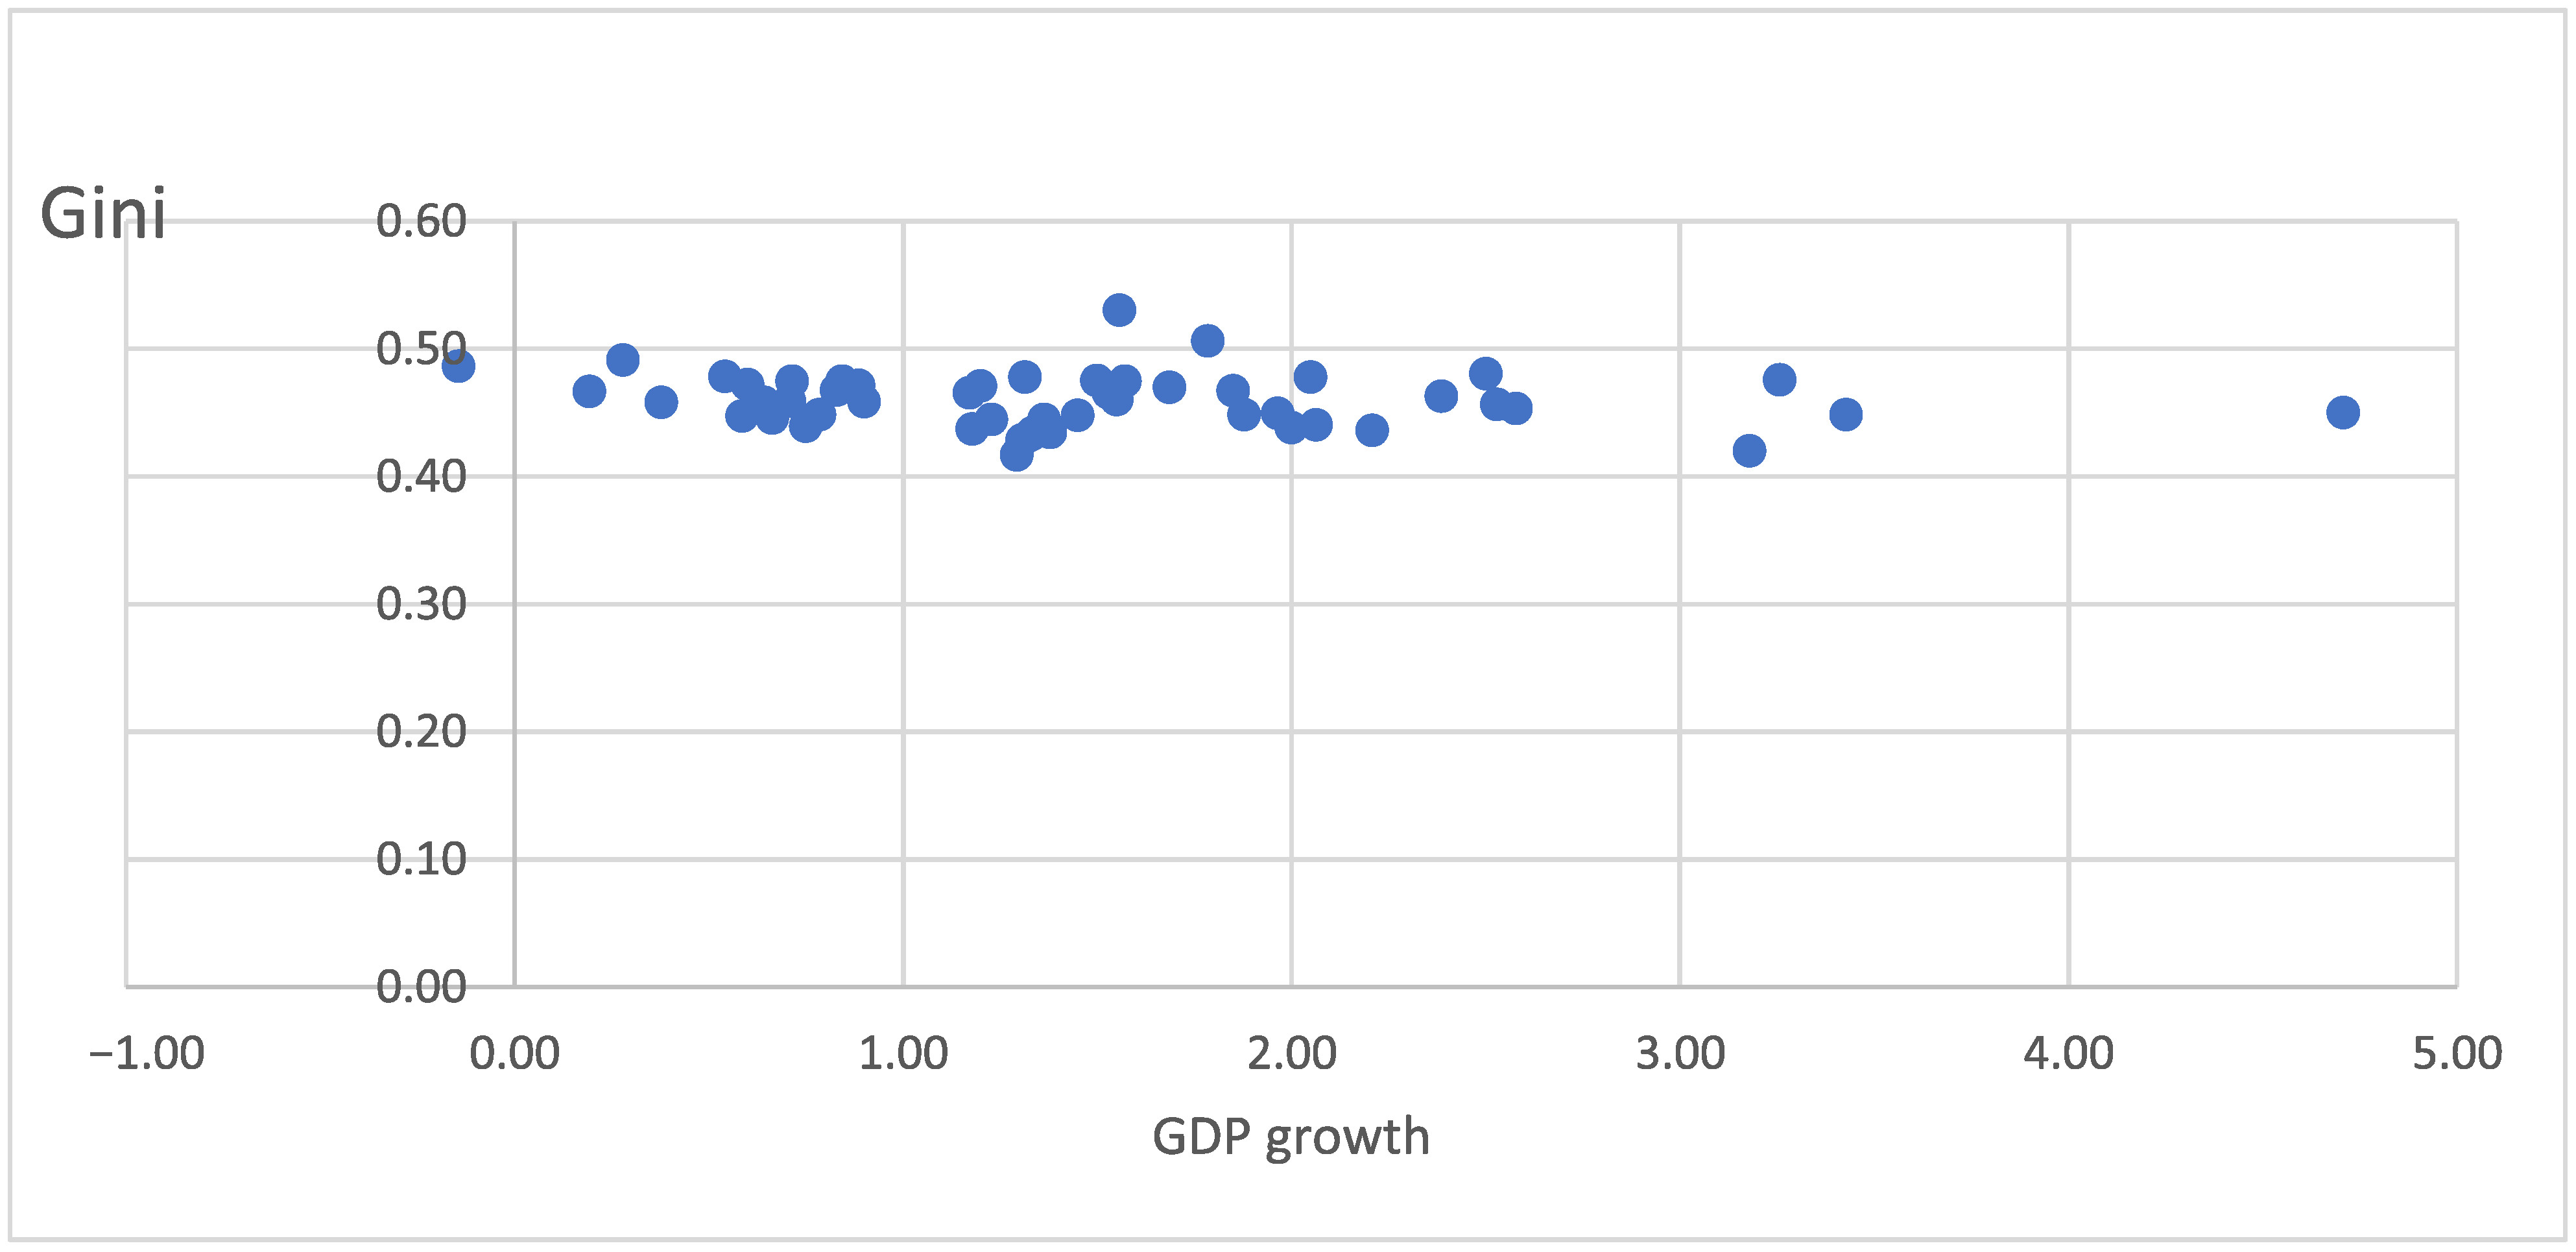
Nor is there any clear pattern in examining income distribution (Gini) vs. tax rates or types of taxes, as can be seen in
Figure 6. Here again, we see little relationship between fiscal policy and macroeconomic outcomes to support either the right argument that low taxes lead to growth or the left argument that high taxes reduce inequality.
Results of FDA of U.S. States’ Growth and Equity Versus Taxation
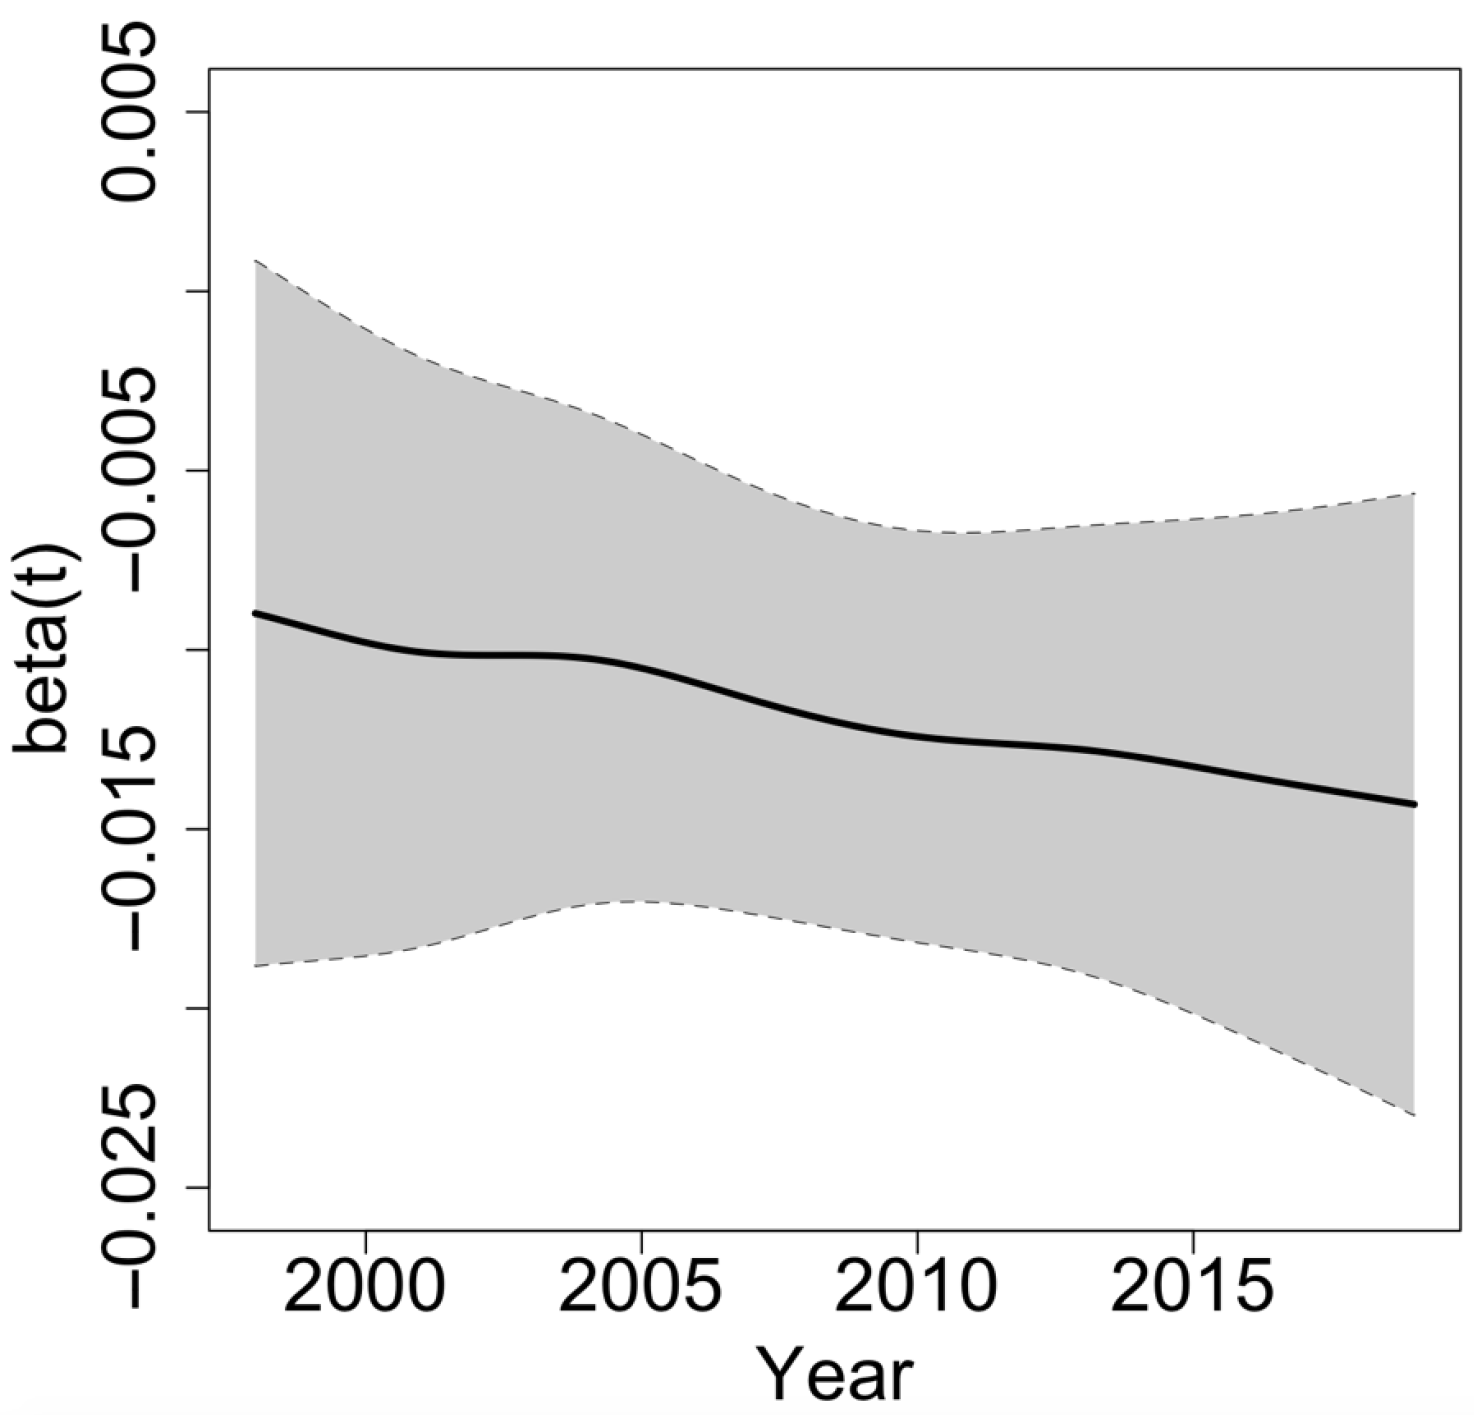
In
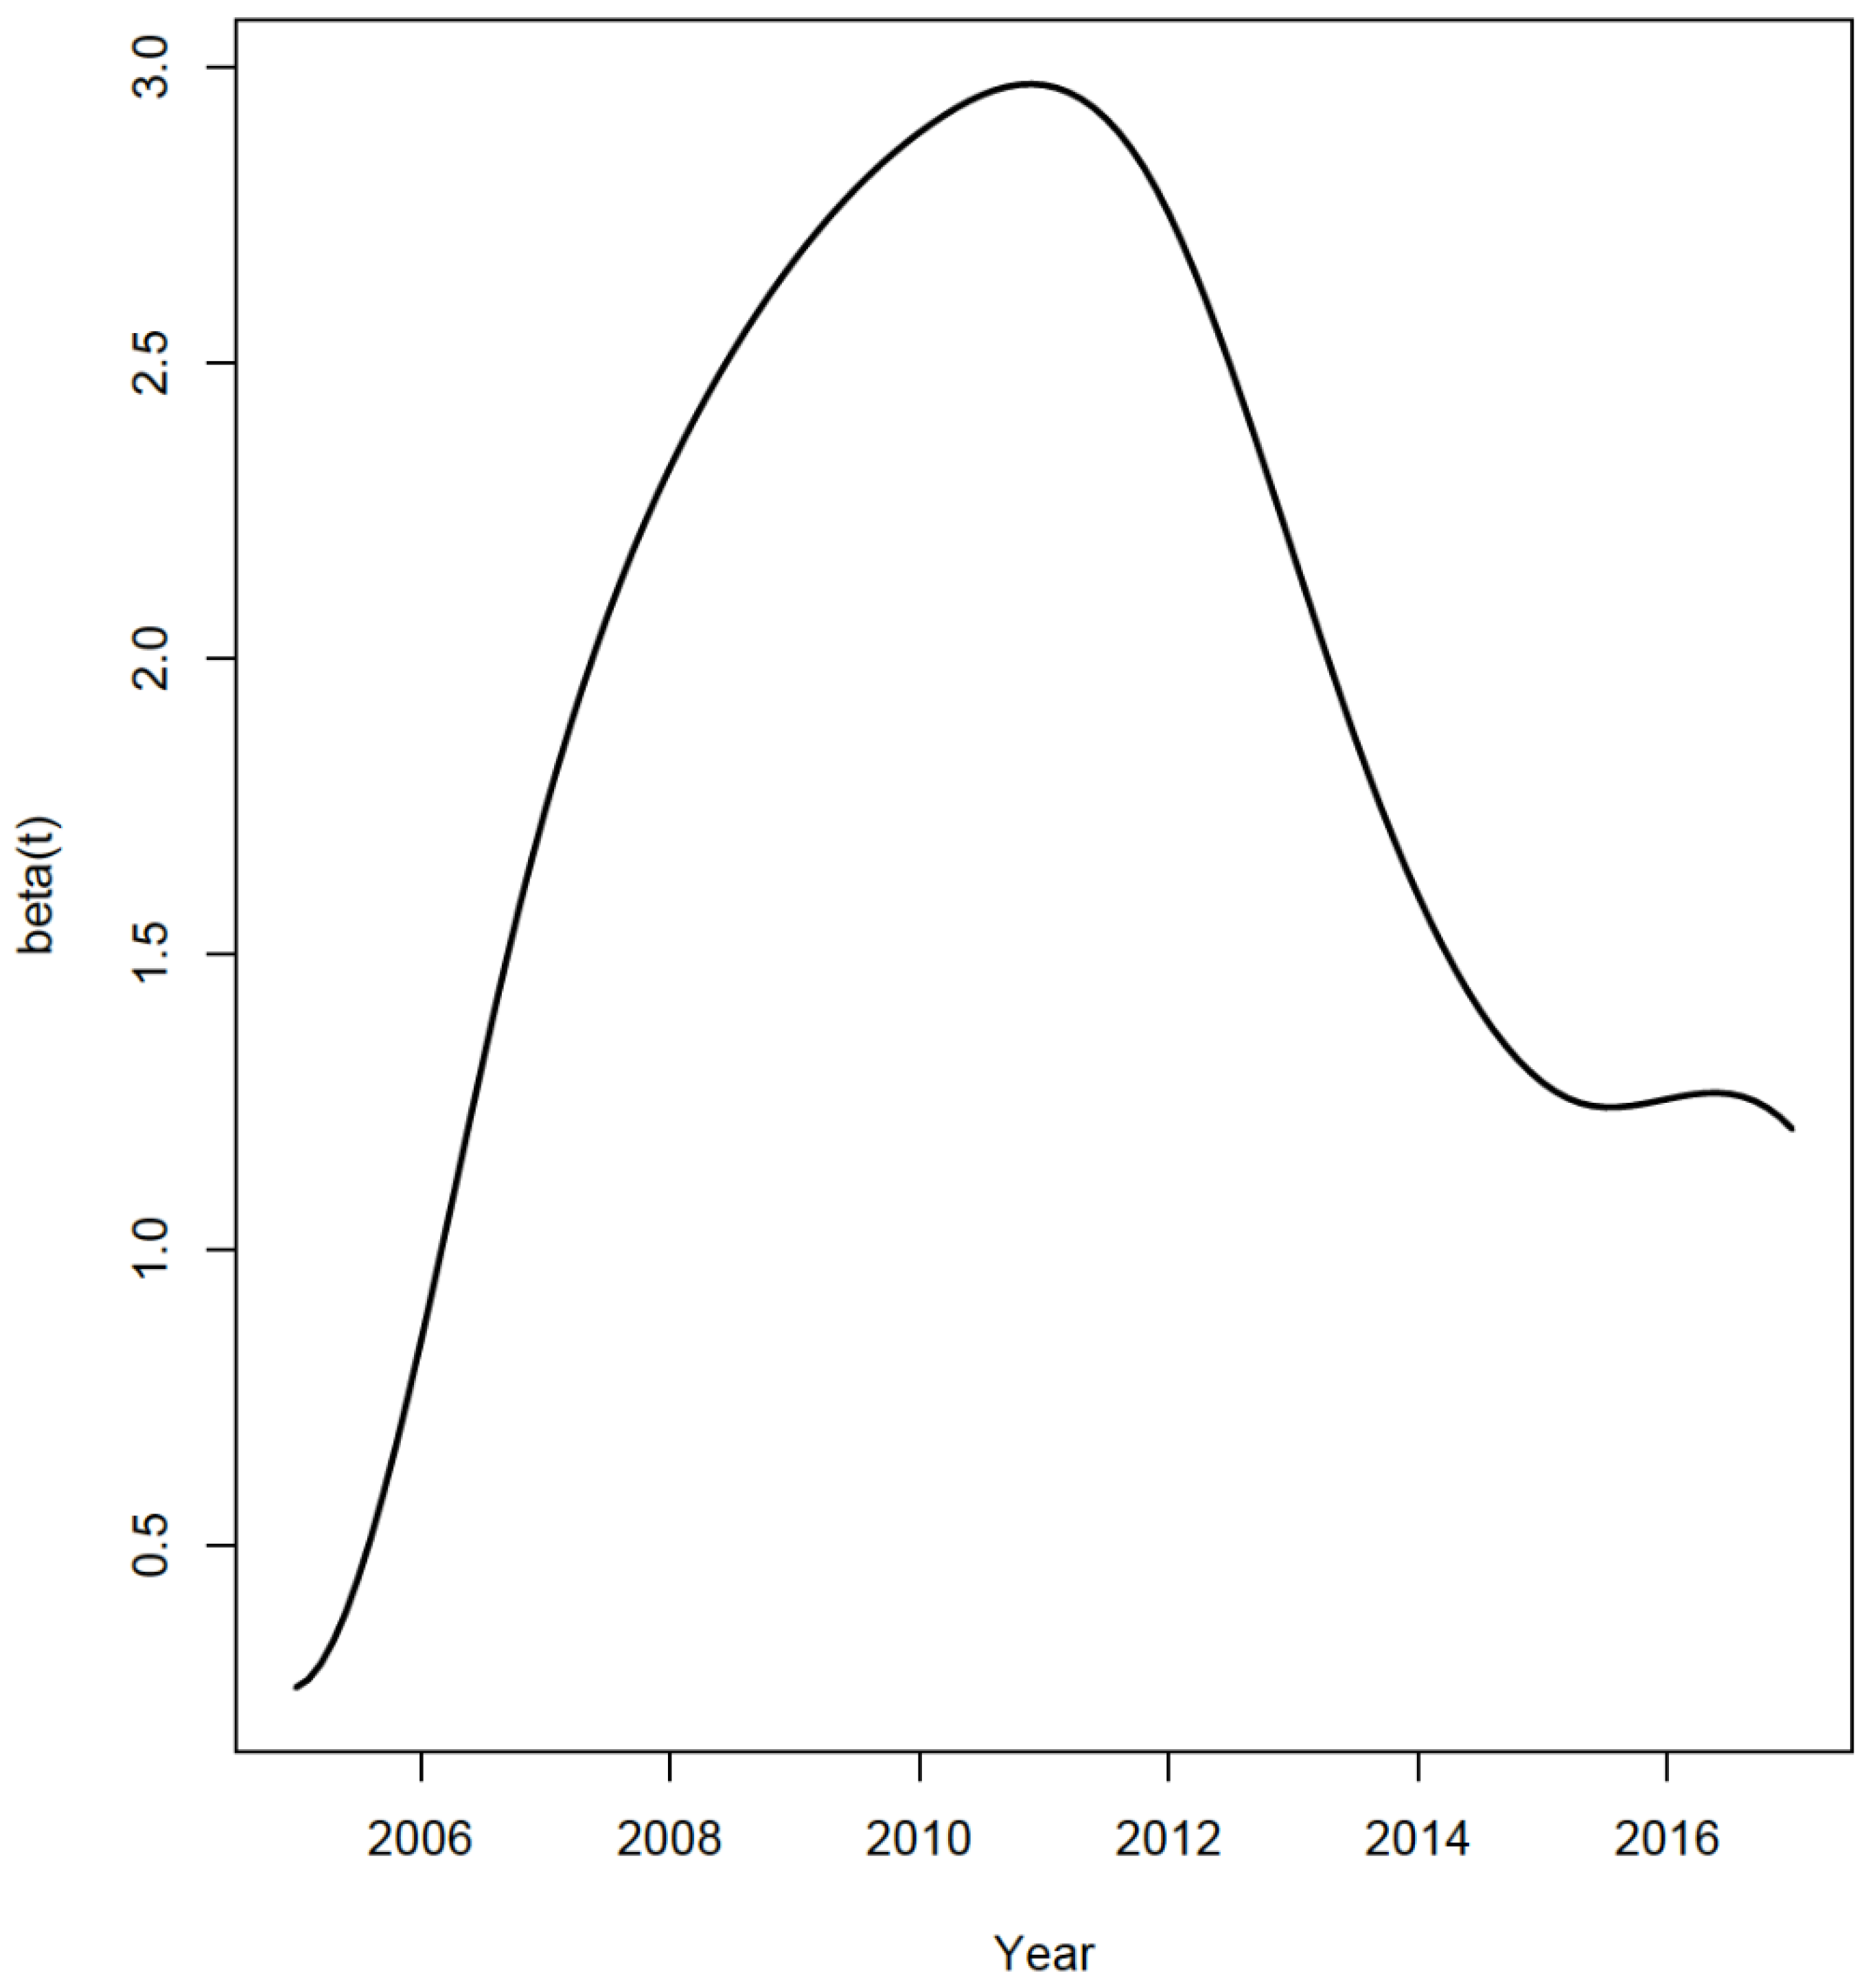
Figure 7, we provide the plot of
i versus the year i for the FDA of U.S. growth versus taxation. The analysis was restricted to 48 states (excluding North Dakota and Alaska) over the period of 1998–2019, where the growth variable y
i was defined as the percentage increase in GDP from year i-1 to year i and the taxation variable x
i was defined as the logarithm of total taxes relative to GDP in year i. The FDA was based on complete data from the 48 × 22 = 1056 state/year combinations. The primary message from
Figure 1 is that increasing taxation is associated with decreasing economic growth (i.e., the
parameters are all negative). A secondary message is that the
parameter is decreasing over time; the implication is that the same level of taxation is more associated with negative growth in recent times than in the early 2000s.
It is worth mentioning some limitations of the analysis. It could very well be that growth and taxation have different associations over time. For example, there could be a lag effect due to taxation that takes time to impact growth. We attempted to model the lag effect by several years, but we did not observe any qualitative differences from those observed in
Figure 7. Also, it could be the case that growth is related to different types of taxation (e.g., personal tax, property tax). For these analyses, we did not have complete data but observed similar results on the restricted datasets as those observed in
Figure 1.
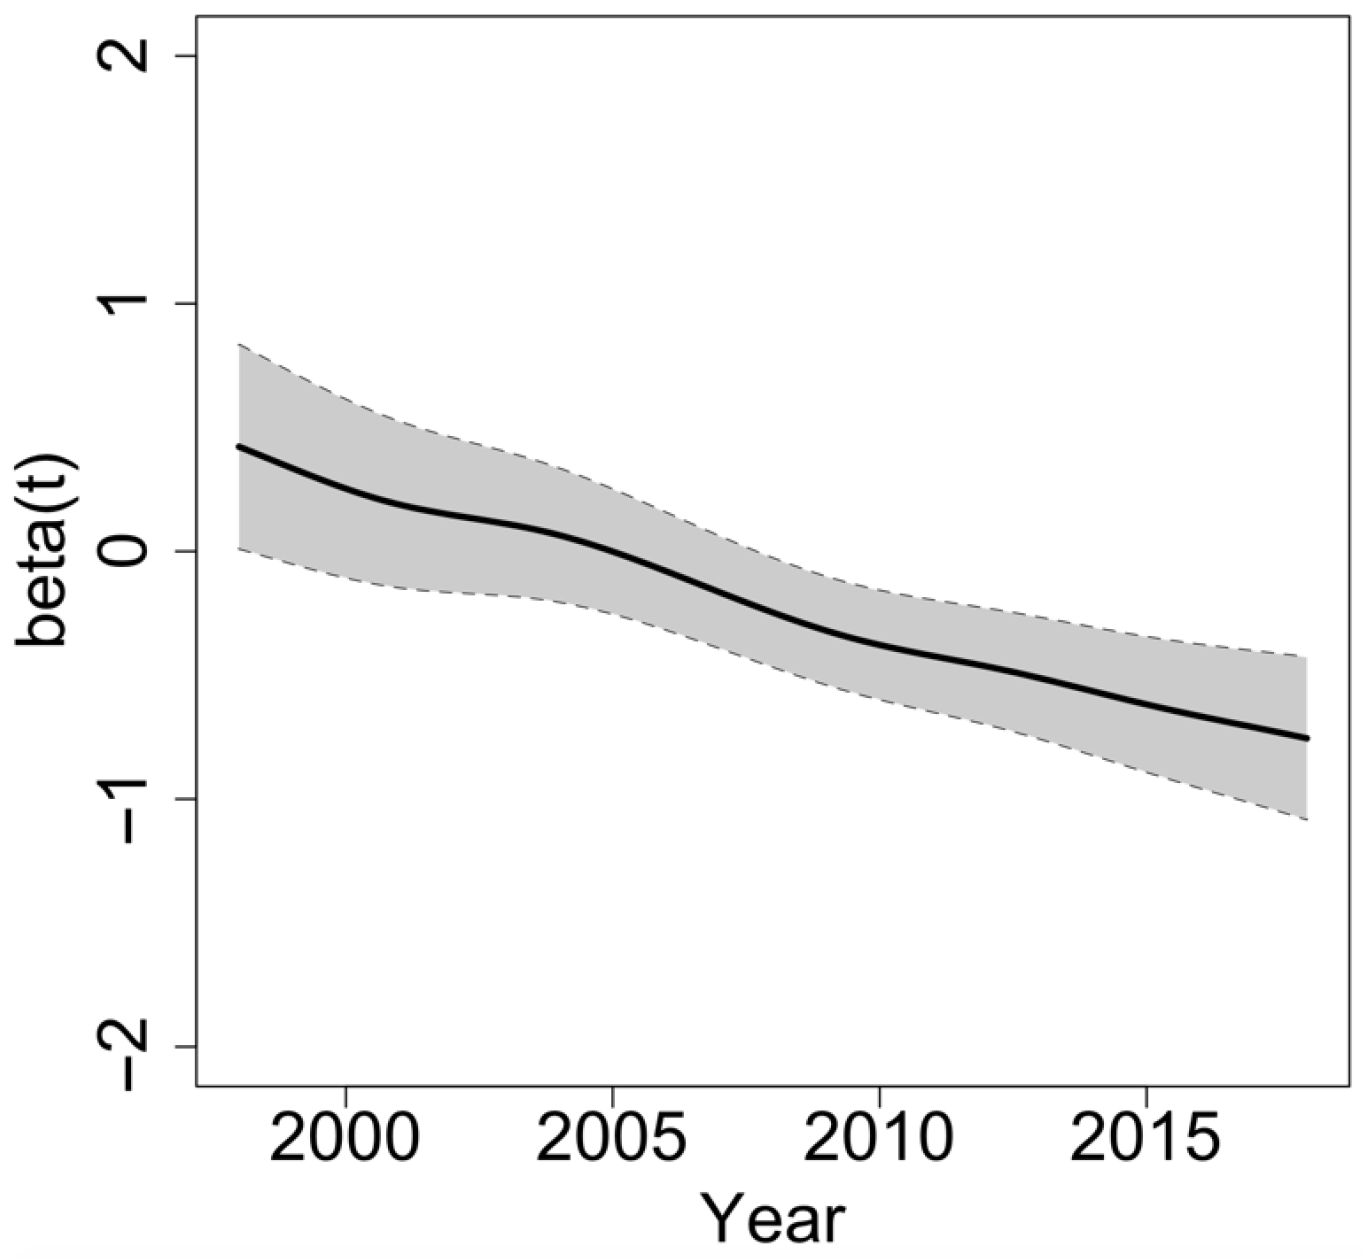
In
Figure 8, we provide the plot of
versus the year i for the FDA of U.S. equity versus taxation. The analysis involved all states over the period of 1998–2018 where the equity variable y
i was defined as the percentage increase in the Gini index from year I − 1 to year i and the taxation variable x
i was defined as the logarithm of total taxes relative to GDP in year i. The FDA was based on complete data from the 50 × 21 = 1050 state/year combinations. The primary message from
Figure 8 is that increasing taxation is associated with decreasing equity (prior to 2005) and that increasing taxation is associated with increasing equity (beyond 2005). Recall that large values of the Gini index denote inequity. A secondary message is that the
parameter is decreasing over time; the implication is that the same level of taxation is more highly associated with equity in more recent times.
In our examination of the U.S. states, we have seen again that there is conditional evidence for taxation being a general drag on growth, but we found an ambiguous relationship between taxation and inequality. As with our previous test, this could reflect a changing relationship over time. Indeed,
Wimer et al. (
2020) find that income inequality reduced from 1967 to 1980 and then sharply increased afterward. While initially the reader may find such FDA findings as ambiguous, we would rather interpret them as significant in terms of the underlying assumptions of fiscal policy. The finding that there is a weak but consistent tradeoff between taxation and growth but that the tradeoff between taxation and equity varies over time suggests a level of complexity well beyond such assumptions.
7. Conclusions and Research Agenda: Social Pacts to Explain Fiscal Policy Outcomes
We have shown the longstanding political assumptions around taxes and spending to be superficial and off-base. In contrast to monetary policy run by independent central banks, fiscal policy is inherently politicized. Attempts to create an explicit fiscal policy approach tend to be exceptional and complicated. For example, the EU’s Stability and Growth Pact created a monetary union on the basis of shifting fiscal policy norms. In some northern EU states, such as Germany and Scandinavia, tight fiscal discipline was a reflection of corporatist agreements, concessions by unions for wage control in return for more generous government welfare spending. In other states, such as Greece, fiscal policy has had no such historical parameters, and thus the Eurozone crisis of the early 2000s reflected the failure to adequately shift fiscal policy norms (
Acocella et al., 2009).
In parallel, the U.S. Republican Party’s common complaint about “over-regulation” would be equally specious. As with government spending, our results suggest it is not the amount of regulation, but the type of regulation that matters. Long-term factors such as the quality of regulatory institutions and consensus around rules of the game may have far more impact than the amount of written regulations (
Hira, 2003). Similarly,
Huber et al. (
2006) find that social welfare expenditures in Latin American democracies tend to reduce inequality, echoing findings for OECD countries.
Bergh and Henrekson’s (
2011) examination of government size and growth finds a slight negative effect, but, like our study, they raise flags, such as the exception of Scandinavia, with high taxes and growth. They suggest strategic government investments and trust, reducing transactions costs, as potential underlying reasons. We are not able within the scope of this article to examine the wide range of causes or reasons behind the persistence of fiscal pacts (long-term agreements on levels of taxation and spending), but we can suggest some directions for future research here.
It seems we need to reach for longer-term explanations to truly explain fiscal policy choices and their effects, including historical context and path dependency. While clearly the overall size of the welfare state grew in the West during the first half of the 20th century, in line with expansion of the voting franchise and mass industrial production, the relative levels of shares of welfare spending have remained remarkably consistent by country in terms of relative ranking, indicating that taxes and spending reflect more of a social compact than an immediate set of decisions (absent a crisis such as the pandemic). Most countries appear to have reached a “limit” on social welfare-based transfer spending since 1980 (
Lindert, 1996) and most have gone through some retrenchment in state spending and intervention more broadly, such as privatization, as part of the adoption of neoliberalism. The more important point is that the origins and extent of such country-level differences in social welfare spending have deep historical roots that are fairly idiosyncratic to class and interest groups, rather than any rational or deliberate economic calculus, thus leading to different assumptions about the optimal role of public vs. private leadership (
Esping-Anderson, 1990;
Luebbert, 1991;
Iversen & Stephens, 2008). For example,
Alesina et al. (
2001) conclude, in comparing potential reasons why the U.S. and the EU differ so much in the size of their welfare states, that racial tensions and bias against minorities reduced historical support for a welfare state in the U.S., justified by the myth that poverty is caused by laziness. They also cite important differences in voting systems, with proportionality leading to greater redistribution.
Alesina and Angeletos (
2005), furthermore, suggest that core beliefs underlie the difference between the more extensive European welfare states and the U.S., with the former believing that luck, chance, and inheritance play a significant role in status, while the in the U.S., the idea of hard work is at the core. They conclude that both overshoot the reality of mobility, but in reverse directions. In fact, a rich emerging literature suggests that the level of inequality, age distribution, and electoral conditions are more likely to direct the level of government redistributional spending rather than the reverse (
Lupu & Pontusson, 2011;
Kristov et al., 1992;
Lindert, 1996;
Perotti, 1996).
Brooks and Manza (
2006) suggest that fiscal pacts are reflective of long-term mass–elite political policy preferences.
The complexity of changing states of inequality and low growth furthermore belie the growth recipes related to market liberalism or the effects of individual elections while ignoring longer-term factors. For example,
Engerman et al. (
2000) suggest that inequality within the New World between North and South was shaped by natural factors, such as sugar requiring greater numbers of slaves and the persistence of substantial numbers of native populations, which cemented inequality and thus retarded efficient and democratic institutions.
Collier and Gunning’s (
1999) article on challenges for growth in Africa mentions at least 20 wide-ranging factors that represent vicious circles, from geographic factors, such as susceptibility to tropical disease and a poor soil quality, to a higher ethno-linguistic density, few of which are apparently subject to short-term policy shifts, though their recommendation centers on improving the delivery of public goods. It could be that inequality causes “underdevelopment,” including low growth, rather than vice versa (
Easterly, 2007). Inequality leads to macroeconomic volatility, which reflects rather than causes weak institutions (
Acemoglu et al., 2002), implying that weak tax collection will lead to inadequate public goods provision, thus reflecting a vicious cycle trap for many states in the South. To reduce inequality globally, regulatory and information coordination across countries and the development of a wealth tax would be good first steps that also speak to the massive amounts of global tax evasion occurring (
Hira et al., 2019;
Zucman, 2023;
Aalbers, 2018).
The econometric orientation of much of the fiscal policy literature also misses the potential of singular spending decisions, that is, the target and efficiency of the spending matter as much as the amount. No statistical analysis can properly capture the implications of the Eisenhower decisions to build interstate highways; the decision to invest in NASA, pushing forward wireless and GPS technologies; or the decision by DARPA to invent the internet as a long-distance military communications system. The initial investment in the 1990s in the human genome project enabled the emerging technologies around COVID vaccines, an equally unforeseeable impact. Singular investments, in short, can have profound qualitative effects and create path dependencies for many decades well beyond the amount spent.
The fiscal response to such unpredictable factors is by nature blunted. As
Bird (
2013) describes, tax reform is a painfully slow, evolutionary process. He observes (24),
Few countries that are currently considered ‘developed’ (US, Germany, Japan) or ‘successful’ (China, Korea) followed anything like ‘best practice’ benchmarking as a guide to policy change. Instead, one way or another- and the way was very different in each of the countries mentioned- they gradually altered their tax structures and administrations over time in response to (almost never in advance of) changes in the underlying political, economic, and social environment that requires (and is needed to support and sustain) such improvements.
It is time to shatter the illusions around the basic assumptions of fiscal policy, growth, and equity and take a new approach that embraces the interaction of politics and economics, such as examining economic and technological structural change and how long-term fiscal pacts and the underlying quality of institutions modulate social responses.