Causal Relationships between Oil Prices and Key Macroeconomic Variables in India




Abstract
1. Introduction
2. Prior Literature: A Review
3. Methodology and Data
4. Estimation and Empirical Findings
4.1. Data Series Stationarity
4.2. Johansen’s Cointegration Test
4.3. Vector Error Correction Model
4.4. Variance Decompositions
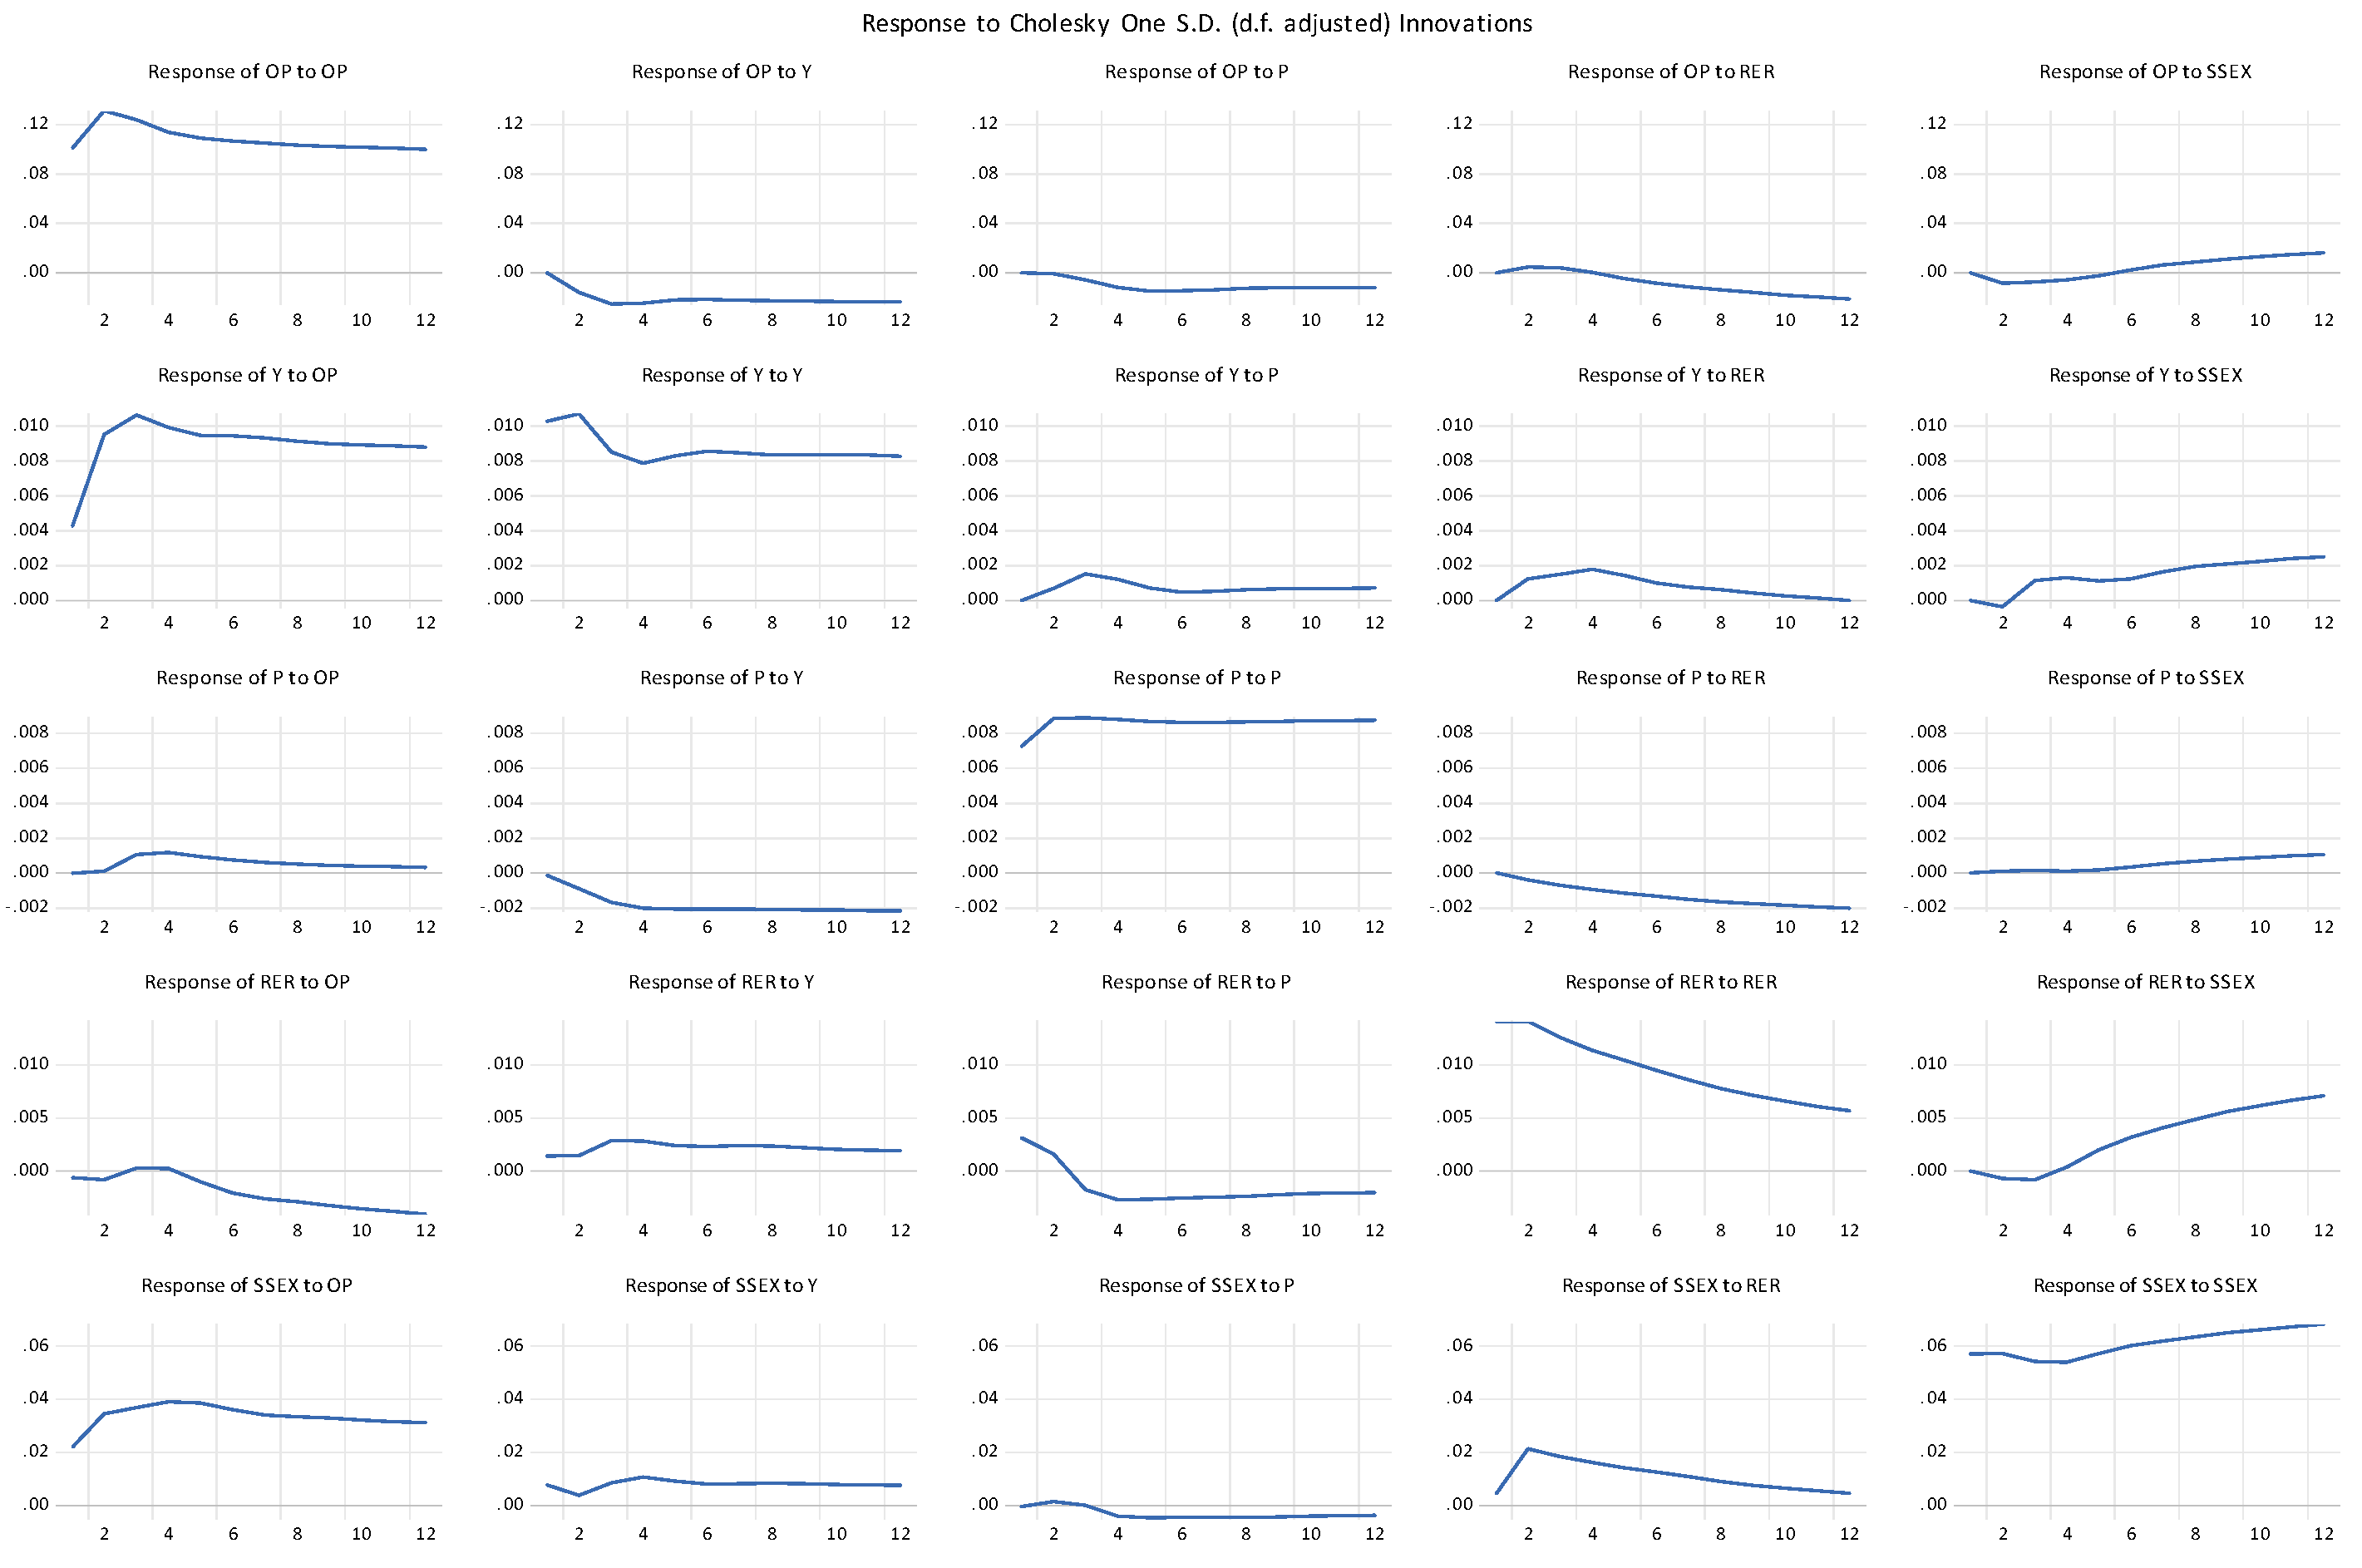
4.5. Impulse Response Functions
5. Summary and Conclusions
Author Contributions
Funding
Informed Consent Statement
Data Availability Statement
Acknowledgments
Conflicts of Interest
Financial Support
| 1 | The countries constituting the ASEAN-5 are Thailand, Malaysia, Singapore, the Philippines, and Indonesia. |
| 2 | A more recent study by Basher et al. (2012) does report, however, that positive shocks to oil prices tend to depress emerging market stock prices and U.S. dollar exchange rates in the short run. |
| 3 | The countries included in the analysis are Tunisia, Morocco, Algeria, Bahrain, Saudi Arabia and Iran (Brini et al. 2016). |
| 4 | This result is taken as evidence that the efficient market hypothesis (EMH) is inapplicable to south Asian countries. |
| 5 | In the absence of monthly data on real GDP for India, the industrial production index (IPI) is used measure India’s aggregate output. |
| 6 | This result is consistent with that in Naik and Padhi (2012), which uses 1994–2011 data on industrial production and SENSEX stock prices from India. |
| 7 | Using 1994–2011 data for India, Naik and Padhi (2012) report bidirectional causality between industrial production and SENSEX stock prices. |
| 8 | The first of these results is supported by those in a recent study by Przekota and Szczepańska-Przekota (2022). |
| 9 | According to the results in Table 3, the real exchange rate neither Granger causes, nor is Granger caused by, the price of oil. The latter of these results supports the finding reported in a recent study by Marquez (2022) while both results support some of the findings reported in a recent study by Orzeszko (2021). Neither of these results is supported by those in a recent study by Przekota and Szczepańska-Przekota (2022). |
References
- Ahmed, Huson Joher Ali, and I. K. M. Mokhtarul Wadud. 2011. Role of oil price shocks on macroeconomic activities: An SVAR approach to the Malaysian economy and monetary responses. Energy Policy 39: 8062–69. [Google Scholar] [CrossRef] [Scilit]
- Alamgir, Farzana, and Sakid Bin Amin. 2021. The nexus between oil price and stock market: Evidence from South Asia. Energy Reports 7: 693–703. [Google Scholar] [CrossRef] [Scilit]
- Basher, Syed Abul, Alfred A. Haug, and Perry Sadorsky. 2012. Oil prices, exchange rates and emerging stock markets. Energy Economics 34: 227–40. [Google Scholar] [CrossRef] [Scilit]
- Basnet, Hem C., and Kamal P. Upadhyaya. 2015. Impact of oil price shocks on output, inflation and the real exchange rate: Evidence from selected ASEAN countries. Applied Economics 47: 3078–91. [Google Scholar] [CrossRef] [Scilit]
- Bernanke, Ben S. 1983. Irreversibility, uncertainty, and cyclical investment. Quarterly Journal of Economics 98: 85–106. [Google Scholar] [CrossRef] [Scilit]
- Brini, Riadh, Hatem Jemmali, and Arafet Farroukh. 2016. Macroeconomic impacts of oil price shocks on inflation and real exchange rate: Evidence from selected MENA countries. Topics in Middle Eastern and North African Economies 18: 170–84. [Google Scholar]
- Cebula, Richard J., Yassaman Saadatmand, and Yvonne Piccone. 2002. An empirical note on the inflation impact of the price of imported crude oil: The case of Germany. International Review of Economics 49: 531–37. [Google Scholar]
- Cologni, Alessandro, and Matteo Manera. 2008. Oil prices, inflation and interest rates in a structural cointegrated VAR model for the G-7 countries. Energy Economics 30: 856–88. [Google Scholar] [CrossRef] [Scilit]
- Cunado, Juncal, and F. Perez de Gracia. 2005. Oil prices, economic activity and inflation: Evidence for some Asian countries. Quarterly Review of Economics and Finance 45: 65–83. [Google Scholar] [CrossRef] [Scilit]
- Engle, Robert F., and Clive W. J. Granger. 1987. Cointegration and error correction: Representation, estimation, and testing. Econometrica 55: 251–76. [Google Scholar] [CrossRef] [Scilit]
- Farzanega, Mohammad R., and Gunther Markwardt. 2009. The effects of oil price shocks on the Iranian economy. Energy Economics 31: 134–51. [Google Scholar] [CrossRef] [Scilit]
- Fernald, John G., and Bharat Trehan. 2005. Why hasn’t the jump in oil prices led to a recession? Federal Reserve Bank of San Francisco Economic Letter, November 18.
- Hamilton, James D. 1983. Oil and the macroeconomy since World War II. Journal of Political Economy 91: 228–48. [Google Scholar] [CrossRef] [Scilit]
- Hamilton, James D. 1996. This is what happened to the oil price-macroeconomy relationship. Journal of Monetary Economics 38: 215–20. [Google Scholar] [CrossRef] [Scilit]
- Hamilton, James D. 2003. What is an oil shock? Journal of Econometrics 113: 363–98. [Google Scholar] [CrossRef] [Scilit]
- Hooker, Mark A. 1996. What happened to the oil price–macroeconomy relationship? Journal of Monetary Economics 38: 195–213. [Google Scholar] [CrossRef] [Scilit]
- Hooker, Mark A. 1999. Oil and the Macroeconomy Revisited. Board of Governors of the U.S. Federal Reserve System, Finance and Economics Discussion Series Paper 1999-43. Available online: https://www.federalreserve.gov/econres/feds/oil-and-the-macroeconomy-revisited.htm (accessed on 1 December 2023).
- Huntington, Hillard G. 1998. Crude oil prices and U.S. economic performance: Where does the asymmetry reside? The Energy Journal 19: 107–32. [Google Scholar] [CrossRef] [Scilit]
- Jiménez-Rodríguez, Rebeca, and Marcelo Sánchez. 2005. Oil price shocks and real GDP growth: Empirical evidence for some OECD countries. Applied Economics 37: 201–28. [Google Scholar] [CrossRef] [Scilit]
- Johansen, Søren. 1988. Statistical analysis of cointegration vectors. Journal of Economic Dynamics and Control 12: 231–54. [Google Scholar]
- Johansen, Søren. 1991. Estimation and hypothesis testing of cointegration vectors in Gaussian vector autoregressive models. Econometrica 59: 1551–80. [Google Scholar] [CrossRef] [Scilit]
- Johansen, Søren, and Katarina Juselius. 1990. Maximum likelihood estimation and inference on cointegration—with applications to the demand for money. Oxford Bulletin of Economics and Statistics 52: 169–210. [Google Scholar] [CrossRef] [Scilit]
- Kilian, Lutz. 2008. Exogenous oil supply shocks: How big are they and how much do they matter for the U.S. economy? Review of Economics and Statistics 90: 216–40. [Google Scholar] [CrossRef] [Scilit]
- Kilian, Lutz, and Cheolbeom Park. 2009. The impact of oil price shocks on the U.S. stock market. International Economic Review 50: 1267–87. [Google Scholar] [CrossRef] [Scilit]
- Mahaddes, Kamiar, and Mehdi Raissi. 2014. Does Inflation Slow Long-Run Growth in India? IMF Working Paper, WP/14/222. Washington, DC: International Monetary Fund. [Google Scholar]
- Marín-Rodriguez, Nini-Johana, Juan David González-Ruiz, and Sergio Botero Botero. 2022. Dynamic co-movements among oil prices and financial assets: A scientometric analysis. Sustainability 14: 12796. [Google Scholar] [CrossRef] [Scilit]
- Marquez, Jaime. 2022. Oil prices and exchange rates: Measurement matters. Commodities 1: 50–64. [Google Scholar]
- Naik, Pramod Kumar, and Puja Padhi. 2012. The impact of macroeconomic fundamentals on stock prices revisited: Evidence from Indian data. Eurasian Journal of Business and Economics 5: 25–44. [Google Scholar]
- Orzeszko, Witold. 2021. Nonlinear causality between crude oil prices and exchange rates: Evidence and forecasting. Energies 14: 6043. [Google Scholar] [CrossRef] [Scilit]
- Phillips, Peter C. B., and Pierre Perron. 1988. Testing for unit roots in time series regression. Biometrika 75: 599–607. [Google Scholar] [CrossRef]
- Przekota, Grzegorz, and Anna Szczepańska-Przekota. 2022. Pro-inflationary impact of the oil market—A study for Poland. Energies 15: 3045. [Google Scholar] [CrossRef] [Scilit]
- Sadorsky, Perry. 1999. Oil price shocks and stock market activity. Energy Economics 21: 449–69. [Google Scholar]
- Said, Said E., and David A. Dickey. 1984. Testing for unit roots in autoregressive-moving average models of unknown order. Biometrika 71: 599–607. [Google Scholar] [CrossRef]
- Shahabad, Rasool Dehghanzadeh, and Mehmet Balcilar. 2022. Modelling the dynamic interaction between economic policy uncertainty and commodity prices in India: The dynamic autoregressive distributed lag approach. Mathematics 10: 1638. [Google Scholar] [CrossRef] [Scilit]
- Sill, Keith. 2007. The macroeconomics of oil shocks. Federal Reserve Bank of Philadelphia Business Review 1: 21–31. [Google Scholar]
- Upadhyaya, Kamal P., and Mukti P. Upadhyay. 1999. Output effects of devaluation: Evidence from Asia. Journal of Development Studies 35: 89–103. [Google Scholar] [CrossRef] [Scilit]
- Upadhyaya, Kamal P., Dharmendra Dhakal, and Franklin G. Mixon, Jr. 2017. Housing prices, stock prices and the U.S. economy. Applied Economics 49: 5916–22. [Google Scholar] [CrossRef] [Scilit]
- Upadhyaya, Kamal P., Raja Nag, and Franklin G. Mixon, Jr. 2018. Stock market prices and the macroeconomics of emerging economies: The case of India. Dynamic Econometric Models 18: 35–47. [Google Scholar] [CrossRef] [Scilit]
- Wei, Yanfeng, and Xiaoying Guo. 2017. Oil price shocks and China’s stock market. Energy 140: 185–97. [Google Scholar] [CrossRef] [Scilit]
- Wei, Yu, Songkun Qin, Xiafei Li, Sha Zhu, and Guiwu Wei. 2019. Oil price fluctuation, stock market and macroeconomic fundamentals: Evidence from China before and after the financial crisis. Finance Research Letters 30: 23–29. [Google Scholar] [CrossRef] [Scilit]


| Augmented Dickey- Fuller Test | Phillips-Perron Test | |||
|---|---|---|---|---|
| Variable | Level | First-Diff | Level | First-Diff |
| Y | −1.89 | −12.14 *** | −1.78 | −12.74 *** |
| SENSEX | −0.67 | −14.55 *** | −0.74 | −14.61 *** |
| OP | −2.33 | −9.67 *** | −2.16 | −11.89 *** |
| RER | −0.28 | −7.74 *** | −0.01 | −12.61 *** |
| H0 | Trace Statistics | 5% Critical Value |
|---|---|---|
| r = 0 | 71.86 ** | 69.89 |
| r ≤ 1 | 38.03 | 47.86 |
| r ≤ 2 | 21.06 | 29.80 |
| r ≤ 3 | 7.60 | 15.50 |
| r ≤ 4 | 0.55 | 3.84 |
| Dependent Variable | ΔY | ΔSENSEX | ΔOP | ΔCPI | ΔRER | All |
|---|---|---|---|---|---|---|
| ΔY | ― | 8.69 * | 40.08 *** | 2.25 | 3.05 | 52.27 *** |
| ΔSENSEX | 7.84 * | ― | 11.35 ** | 6.30 † | 27.27 *** | 43.76 *** |
| ΔOP | 10.52 ** | 4.25 | ― | 6.18 † | 4.10 | 24.67 ** |
| ΔCPI | 2.89 | 5.10 | 10.85 ** | ― | 2.97 | 19.27 |
| ΔRER | 9.41 ** | 10.80** | 3.85 | 15.54 *** | ― | 38.47 *** |
| Variance decomposition of Y explained by | |||||
| Period | Y | SENSEX | OP | CPI | RER |
| 3 | 86.58 | 1.88 | 10.66 | 0.57 | 0.31 |
| 6 | 82.33 | 5.00 | 11.49 | 0.70 | 0.48 |
| 9 | 82.77 | 6.63 | 10.05 | 0.48 | 0.39 |
| 12 | 81.37 | 8.42 | 9.46 | 0.36 | 0.38 |
| Variance decomposition of SSEX explained by | |||||
| Period | Y | SENSEX | OP | CPI | RER |
| 3 | 6.07 | 85.81 | 2.74 | 0.05 | 5.32 |
| 6 | 7.16 | 86.14 | 2.46 | 0.15 | 4.09 |
| 9 | 6.81 | 87.42 | 1.75 | 0.32 | 3.69 |
| 12 | 6.35 | 88.31 | 1.40 | 0.34 | 3.60 |
| Variance decomposition of OP explained by | |||||
| Period | Y | SENSEX | OP | CPI | RER |
| 3 | 9.20 | 7.32 | 82.71 | 0.04 | 0.72 |
| 6 | 10.72 | 10.81 | 74.23 | 1.74 | 2.49 |
| 9 | 10.24 | 15.56 | 68.81 | 2.85 | 2.70 |
| 12 | 9.88 | 16.89 | 67.76 | 2.88 | 2.68 |
| Variance decomposition of CPI explained by | |||||
| Period | Y | SENSEX | OP | CPI | RER |
| 3 | 0.97 | 0.18 | 0.46 | 97.60 | 0.79 |
| 6 | 1.52 | 0.13 | 2.12 | 92.58 | 3.65 |
| 9 | 2.97 | 0.29 | 1.61 | 87.92 | 7.20 |
| 12 | 4.75 | 0.82 | 1.20 | 84.32 | 8.90 |
| Variance decomposition of RER explained by | |||||
| Period | Y | SENSEX | OP | CPI | RER |
| 3 | 2.18 | 0.18 | 0.04 | 2.47 | 95.12 |
| 6 | 6.61 | 1.07 | 0.54 | 2.79 | 88.99 |
| 9 | 5.53 | 6.20 | 2.95 | 2.54 | 82.76 |
| 12 | 4.37 | 12.20 | 5.41 | 2.36 | 75.66 |
Disclaimer/Publisher’s Note: The statements, opinions and data contained in all publications are solely those of the individual author(s) and contributor(s) and not of MDPI and/or the editor(s). MDPI and/or the editor(s) disclaim responsibility for any injury to people or property resulting from any ideas, methods, instructions or products referred to in the content. |
© 2023 by the authors. Licensee MDPI, Basel, Switzerland. This article is an open access article distributed under the terms and conditions of the Creative Commons Attribution (CC BY) license (https://creativecommons.org/licenses/by/4.0/).
Share and Cite
Upadhyaya, K.P.; Nag, R.; Mixon, F.G., Jr. Causal Relationships between Oil Prices and Key Macroeconomic Variables in India. Int. J. Financ. Stud. 2023, 11, 143. https://doi.org/10.3390/ijfs11040143
Upadhyaya KP, Nag R, Mixon FG Jr. Causal Relationships between Oil Prices and Key Macroeconomic Variables in India. International Journal of Financial Studies. 2023; 11(4):143. https://doi.org/10.3390/ijfs11040143
Chicago/Turabian StyleUpadhyaya, Kamal P., Raja Nag, and Franklin G. Mixon, Jr. 2023. "Causal Relationships between Oil Prices and Key Macroeconomic Variables in India" International Journal of Financial Studies 11, no. 4: 143. https://doi.org/10.3390/ijfs11040143
APA StyleUpadhyaya, K. P., Nag, R., & Mixon, F. G., Jr. (2023). Causal Relationships between Oil Prices and Key Macroeconomic Variables in India. International Journal of Financial Studies, 11(4), 143. https://doi.org/10.3390/ijfs11040143