Article

The Sound Pattern of Heritage Spanish: An Exploratory Study on the Effects of a Classroom Experience

1
Department of Spanish and Portuguese, University of Wisconsin-Madison, Madison, WI 53706, USA
2
Department of Linguistics, University of Iowa, Iowa, IA 52242-1323, USA
3
Department of Linguistics, University of Maryland, College Park, MD 20742-7505, USA
4
Department of Romance Languages and Literatures, Harvard University, Cambridge, MA 02138, USA
*
Author to whom correspondence should be addressed.
Languages 2020, 5(4), 72; https://doi.org/10.3390/languages5040072
Submission received: 8 September 2020 / Revised: 9 December 2020 / Accepted: 15 December 2020 / Published: 18 December 2020
(This article belongs to the Special Issue Contemporary Advances in Linguistic Research on Heritage Spanish)

Abstract

:
While heritage Spanish phonetics and phonology and classroom experiences have received increased attention in recent years, these areas have yet to converge. Furthermore, most research in these realms is cross-sectional, ignoring individual or group changes across time. We aim to connect research strands and fill gaps associated with the aforementioned areas by conducting an individual-level empirical analysis of narrative data produced by five female heritage speakers of Spanish at the beginning and end of a semester-long heritage language instruction class. We focus on voiced and voiceless stop consonants, vowel quality, mean pitch, pitch range, and speech rate. Our acoustic and statistical outputs of beginning versus end data reveal that each informant exhibits a change in between three and five of the six dependent variables, showing that exposure to a more formal register through a classroom experience over the course of a semester constitutes enough input to influence the heritage language sound system, even if the sound system is not an object of explicit instruction. We interpret the significant changes through the lenses of the development of formal speech and discursive strategies, phonological retuning, and speech style and pragmatic effects, while also acknowledging limitations to address in future related work.

1. Introduction

Initial work on heritage languages (HLs) focused on domains where heritage speakers (HSs) are notably different from the baseline, primarily morphology and aspects of syntax. That left HSs’ sound production—an area where they typically excel (Au et al. 2008; Knightly et al. 2003)—underexplored. More recently, HSs’ sound systems have been brought to the fore in HL research. Despite many HSs maintaining more aspects of their heritage language (HL) sound systems into adulthood, they still exhibit differences compared to the baseline of individuals who are dominant in the language in question (see Chang forthcoming; Polinsky 2018, pp. 114–62 and references therein).
With respect to Spanish, we have seen recent growth of work on heritage vowels, consonants, and suprasegmental features (for overviews, see Rao 2019; Rao and Amengual in press; Rao and Kuder 2016; Rao and Ronquest 2015; Ronquest and Rao 2018); however, the vast majority of studies to date have been carried out using a cross-sectional approach, which, while informative, may blur any changes to HSs’ sound systems over time.
Also of note is a growing interest in the positive effects of participating in an HL classroom on the HL linguistic system and cultural self-awareness, with an emphasis on Spanish, since many American universities across the country offer this experience (Bowles and Montrul 2014; Carreira and Kagan 2018; Montrul 2016; Oh and Au 2005; Parra et al. 2018; Potowski et al. 2009; Torres et al. 2018). Within the realm of educational experience with heritage Spanish (and HLs at large), one area that has received little to no attention is how the heritage Spanish sound system, shaped in large part by childhood input (see Pascual y Cabo and Rothman 2012) from adult Spanish-dominant parents, relatives, and community members, can be affected by increased exposure to and use of Spanish through in-class time, assignments, and activities associated with taking a heritage Spanish class. We want to be very clear from the outset that we are not discussing the heritage Spanish sound system through a prescriptive lens; that is, we do not assume that any sort of correction to HSs’ Spanish is needed, but rather are interested in what evidence of change (in the most neutral sense of the word) to heritage sound system we observed during a semester-long heritage Spanish class and the possible reasons behind this change.
Kupisch and Rothman (2018) considered the role that formal education in the HL across a range of ages plays in influencing HSs’ linguistic system. Of particular relevance to the current paper are the following claims they make. First, they contended that using the HL as a vehicle for communication between the instructor and HS students (rather than strictly a topic about which students learn) supports the HL in terms of learning to navigate it in more formal contexts and registers. Next, and perhaps most importantly, they claimed that features of the HL that are not the objects of explicit instruction (e.g., sound system) are influenced by broader experience with the HL in a classroom setting. Additionally, Kupisch and Rothman noted that the spoken variety used by instructors in an educational setting most likely more closely approximates the standard than does the home variety of HSs. Lastly, a classroom experience is unique for HSs in that it affords increased chances to produce and perceive the HL in a broad range of authentic forms and with a group of individuals who are roughly the same age. While much of Kupisch and Rothman’s discussion revolves around K-12 education, their insights can be extrapolated to the university level.
The present study extends upon the insights mentioned to this point by examining sound-system features longitudinally, across two points in time by five informants enrolled in a class specifically designed for HSs of Spanish. Given our sample size and the novelty of our research agenda, this study is exploratory in nature and will involve a focus on sound system outputs at the individual rather than the group level (see Bullock 2009; George and Hoffman-González 2019 for “case study” approaches to HS). Upon analyzing the data for each informant (Section 4), our goal is to uncover what types of changes related to the sound system may occur due to the unique opportunities linked to input and use afforded by the HL classroom. To this end, we conducted acoustic and statistical analyses of vowels, stop consonants, pitch range, mean pitch, and speech rate coming from unscripted narrative data produced by each of our HS informants as part of the class in question. The segmental features targeted demonstrate clear phonetic differences in the literature on our informants’ HL (Spanish) versus dominant language (English), while the three remaining variables are particularly important to, for example, pragmatic meaning, discourse structure, and fluency. Finally, narrations were elicited because research in language development has revealed that they require a combination of linguistic skills and experience (Berman 2004; Pavlenko 2006; Polinsky 2008), and as such, they serve as an effective test bed for exploring a range of linguistic aspects of L1, L2, and HSs’ discourse development (Labov 1972; Silva-Corvalán 1994). The fact that narratives are a less controlled speech style and that they do not rely on HL literacy skills are also reasons why they function well with HSs in particular (Colantoni et al. 2016). A noteworthy example of the use of narratives to study HSs of Spanish is the study by Parra et al. (2018), whose pre- and post-semester data from an HS class uncover progress in the domains of organization, complexity of linguistic structures, lexical proficiency, and navigating different genres and styles (sounds were not part of the analysis).
In order to motivate the sound features of interest and set the stage for the remainder of this paper, we will first provide an overview of relevant previous literature on the sound system of Spanish with a special emphasis on heritage Spanish. With that in mind, the rest of the paper is structured as follows: Section 2 presents and analyzes relevant previous literature on Spanish vowels and stop consonants in a bilingual context, and discusses the role of suprasegmental features in conveying discourse structure; Section 3 lays out our research questions and describes the methods we used to carry out the current study; Section 4 details the acoustic and statistical findings at both the segmental and suprasegmental levels; and Section 5 delves into the implications of the results from Section 4 by connecting them to insights in previous work as well as provides final remarks on the contributions of our study (including limitations and ways in which they can encourage future work on similar topics).

2. Background

Let us start with a disclaimer: this discussion is not intended as a comprehensive overview of the Spanish sound system in general or of the heritage Spanish system in particular. We concentrate on those aspects of the sound system that have played a prominent role in discussions of bilingual sound systems in general and will be relevant for our analysis in the subsequent sections. For a recent overview of heritage Spanish phonology in the USA, see Rao (2019) and references therein.1

2.1. Basics of Spanish Sound System

The Spanish vocalic system contains five phonemes /i, e, a, o, u/. Measures of vowel quality based on the first two formants (F1 and F2) show that these five vowels are arranged in the vowel space as follows: /i, u/ (high), /e, o/ (mid), /a/ (low); /i, e/ (front), /a/ (central), /o, u/ (back). Spanish vowels produced by monolingual speakers are generally regarded to be stable, showing relatively similar quality in both stressed and unstressed contexts (Delattre 1969; for a recent, thorough overview of the issues presented in this subsection, see Ronquest 2018); however, it should be noted that stressed vowels have been found to be intrinsically longer than unstressed vowels (Marín Gálvez 1994–95), that stressed vowels are oriented slightly further toward the edges of the vowel space than are unstressed vowels (e.g., Martínez Celdrán 1984), and that the female vowel space has been found to be higher and more posterior than that of males (Martínez Celdrán 1995). In comparison to Spanish, English has a very large vocalic inventory (11 phonemes is most common in American English) and a vowel space that is more fronted (Boomershine 2013; Bradlow 1995; Hualde 2005). The main differences between the two languages are the diphthongization of /e/ and /o/ to [eɪ] and [oʊ] in English, higher and tenser mid vowels in Spanish, more fronted Spanish /a/, and more lip-rounding in the production of Spanish /o/ and /u/ (Bradlow 1995). In addition, unlike Spanish, English unstressed vowels undergo reduction, a process in which such vowels centralize to a mid-central vowel, [ə], or schwa. Delattre (1969) points out that, beyond stress, languages’ rhythmic properties (Abercrombie 1967; Pike 1945) and general level of articulatory tension are the fundamental drivers of vowel reduction, with duration having more of a secondary connection to the process.
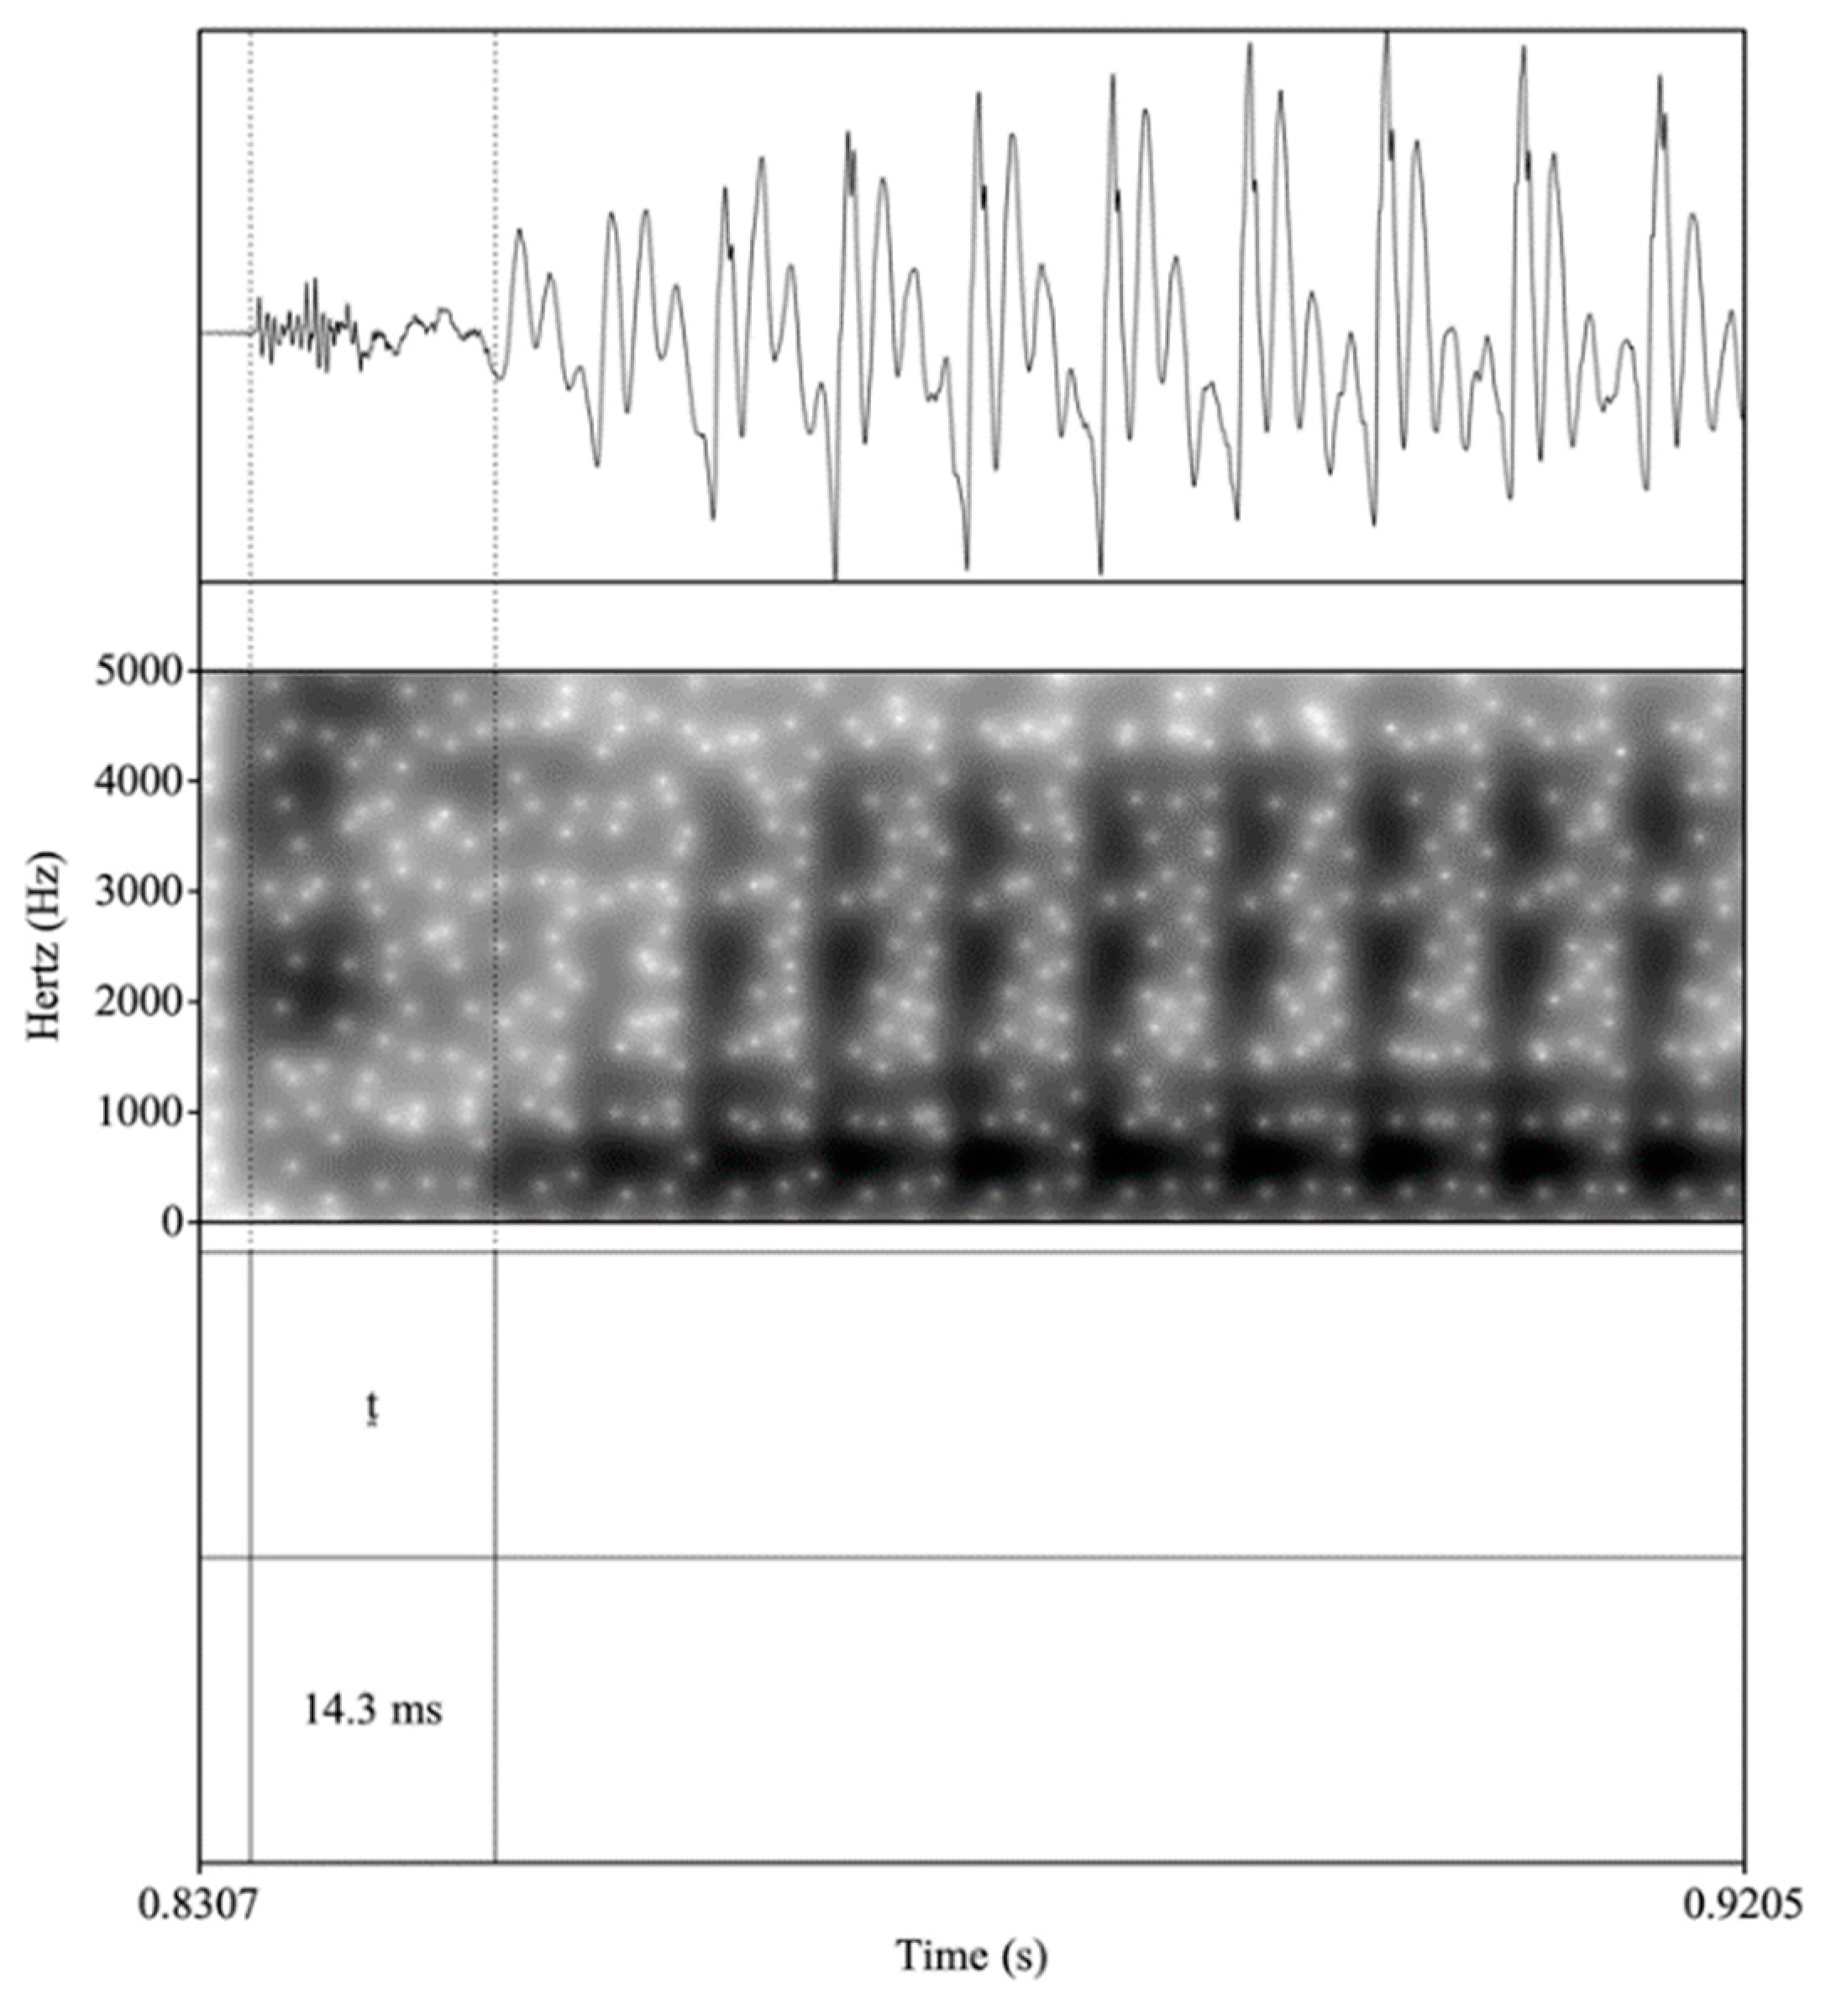
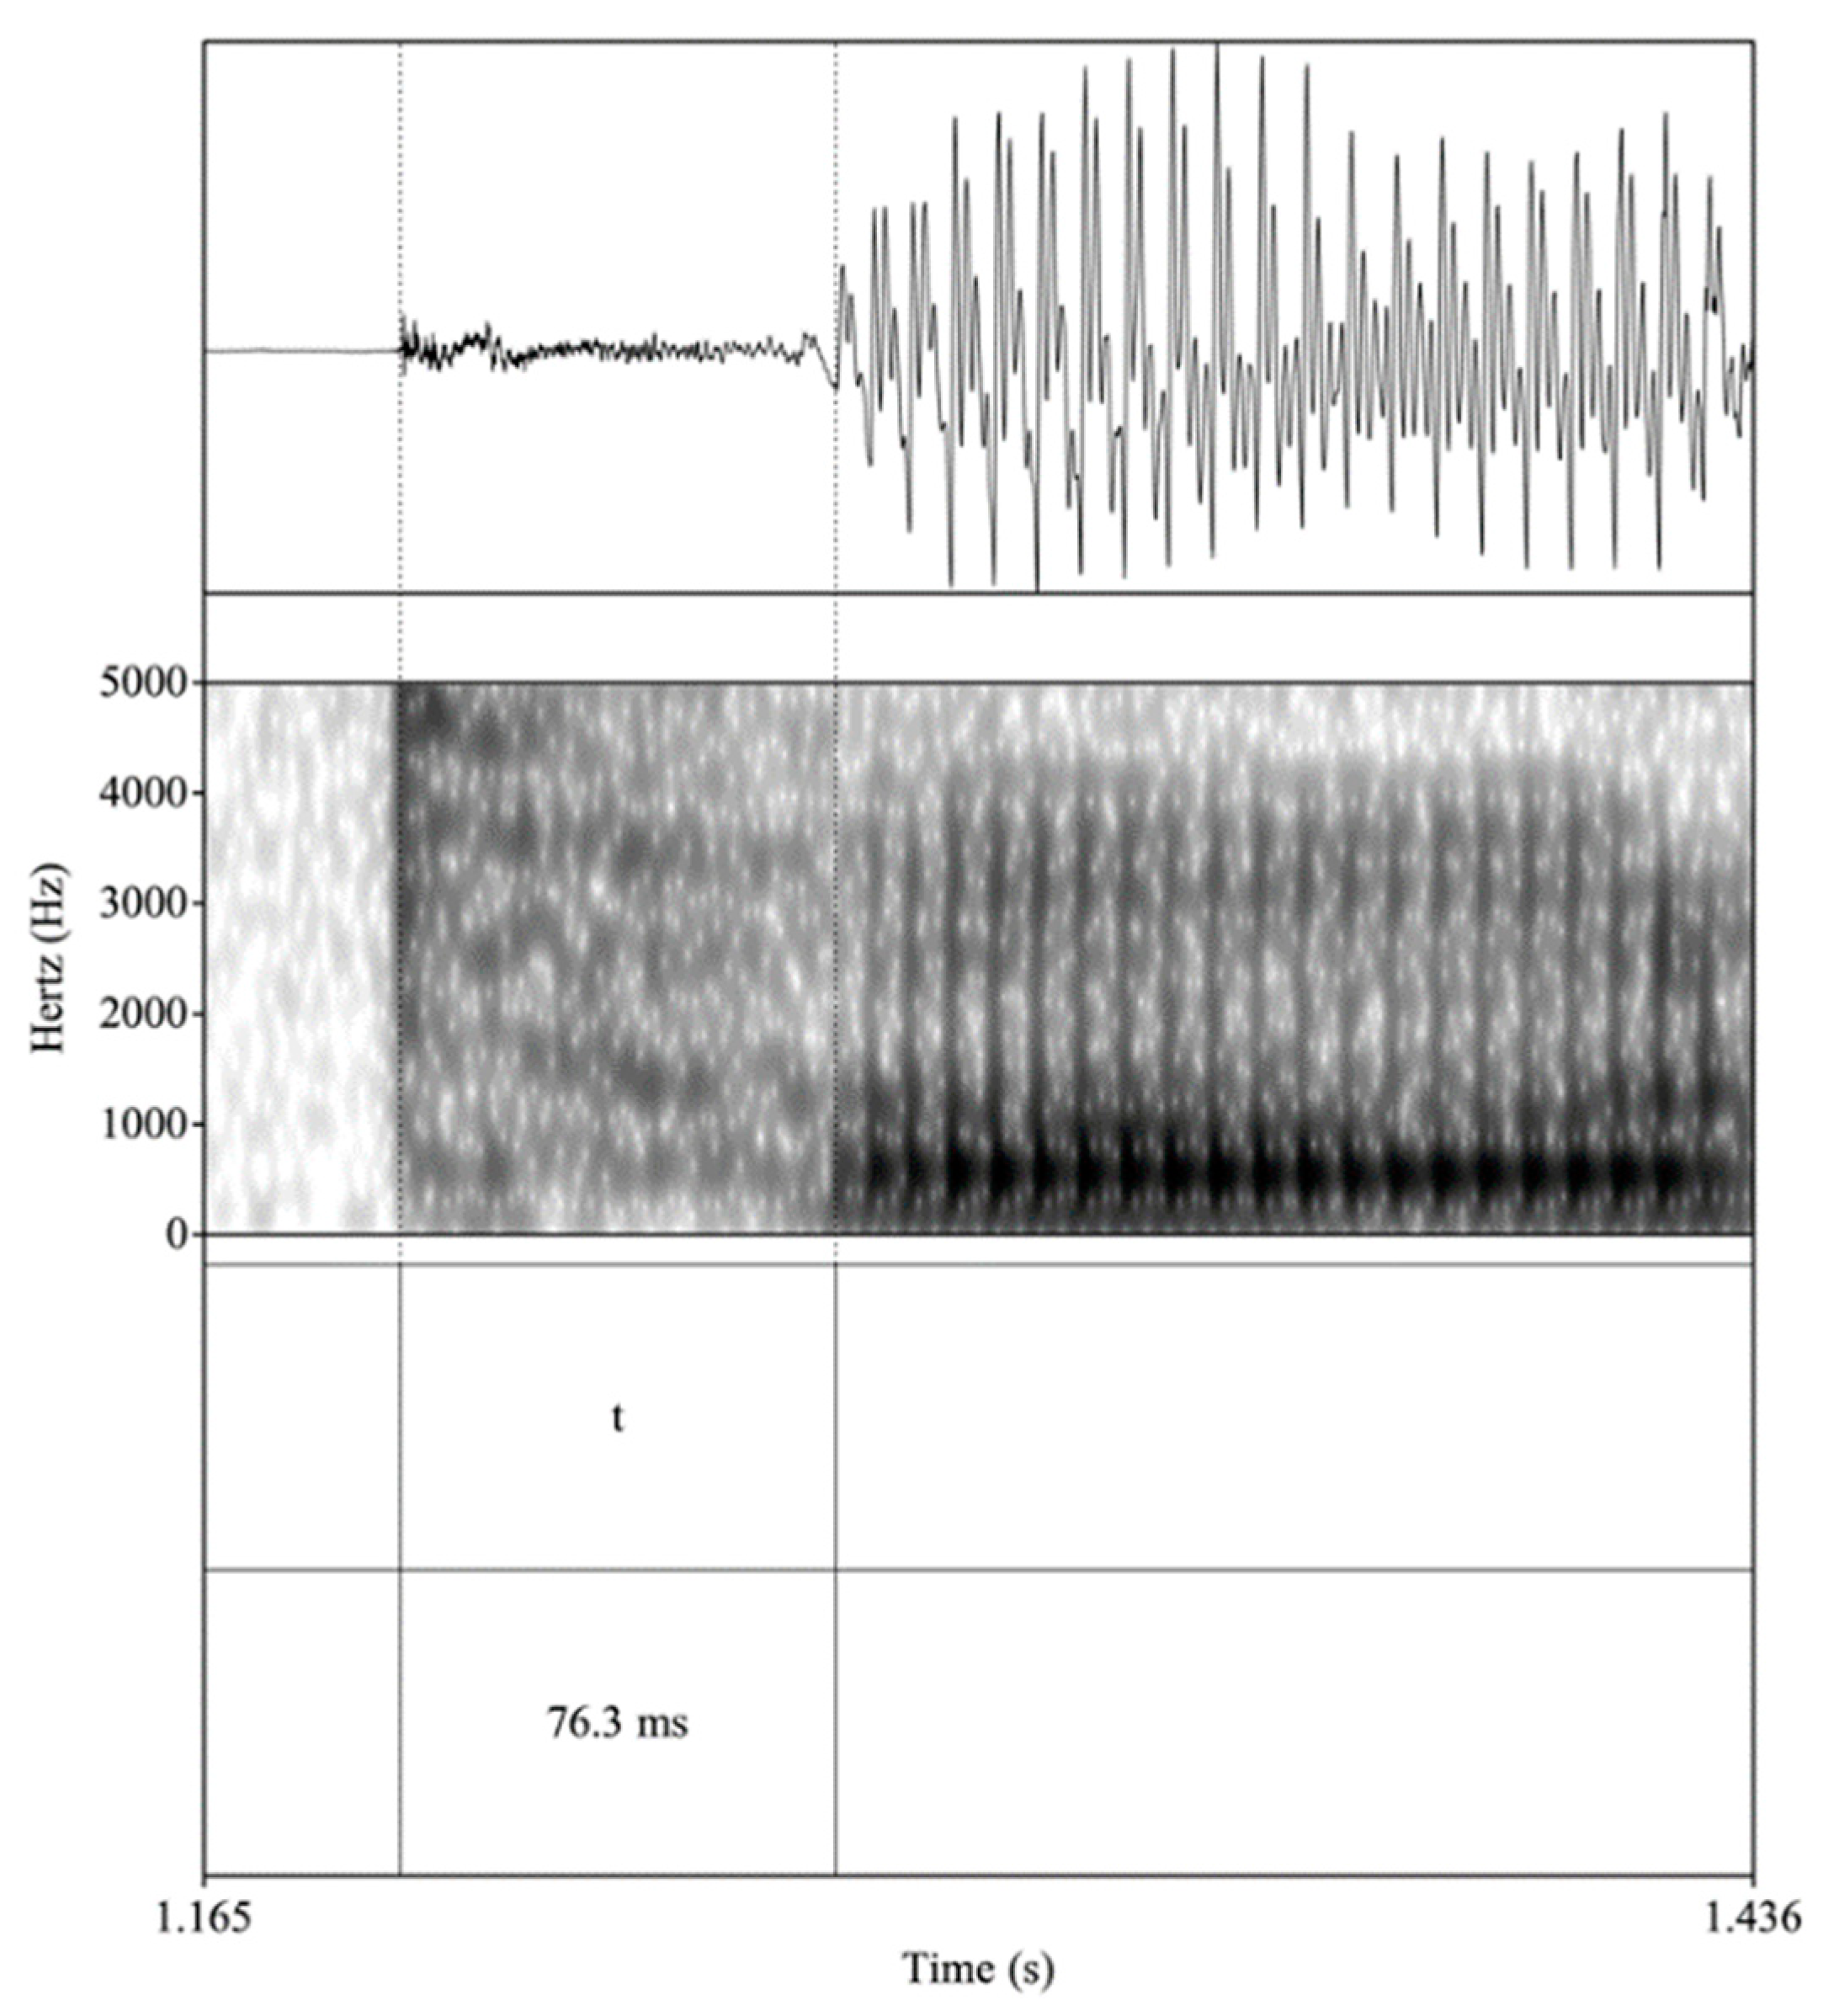
This study also examines the voice onset time (VOT) of voiceless stops /p, t, k/. This acoustic parameter refers to an interval between the stop burst and the onset of vocal fold vibration and is utilized to distinguish unaspirated and aspirated stops (Lisker and Abramson 1964). Spanish /p, t, k/ are classified as “short-lag,” meaning they are produced with an average VOT of less than 30–35 milliseconds (ms), resulting in an unaspirated production. Figure 1 provides an example of a waveform and spectrogram of an unaspirated production in Spanish of an initial /t/. The left-hand vertical boundary aligns with the release burst and the right-hand boundary points out the beginning of the first periodic cycle of the vowel [o]. The 14.3 ms VOT is a clear example of short-lag, or an unaspirated realization. English /p, t, k/, on the other hand, are categorized as ‘long-lag,’ with VOTs that are usually greater than 50 ms, resulting in productions with audible aspiration (Lisker and Abramson 1964). Figure 2 presents an example of an aspirated production in English of an initial /t/. As in Figure 1, the left and right vertical boundaries highlight the release burst and the onset of the following vowel, respectively, but in Figure 2, the VOT measure is a much longer 76.3 ms, indicative of a long-lag, or aspirated production. Lastly, on a general level, it should be noted that place of articulation affects VOT in voiceless stops (Cho and Ladefoged 1999), with the duration hierarchy /p/ < /t/ < /k/ applying to both Spanish and English (Lisker and Abramson 1964).
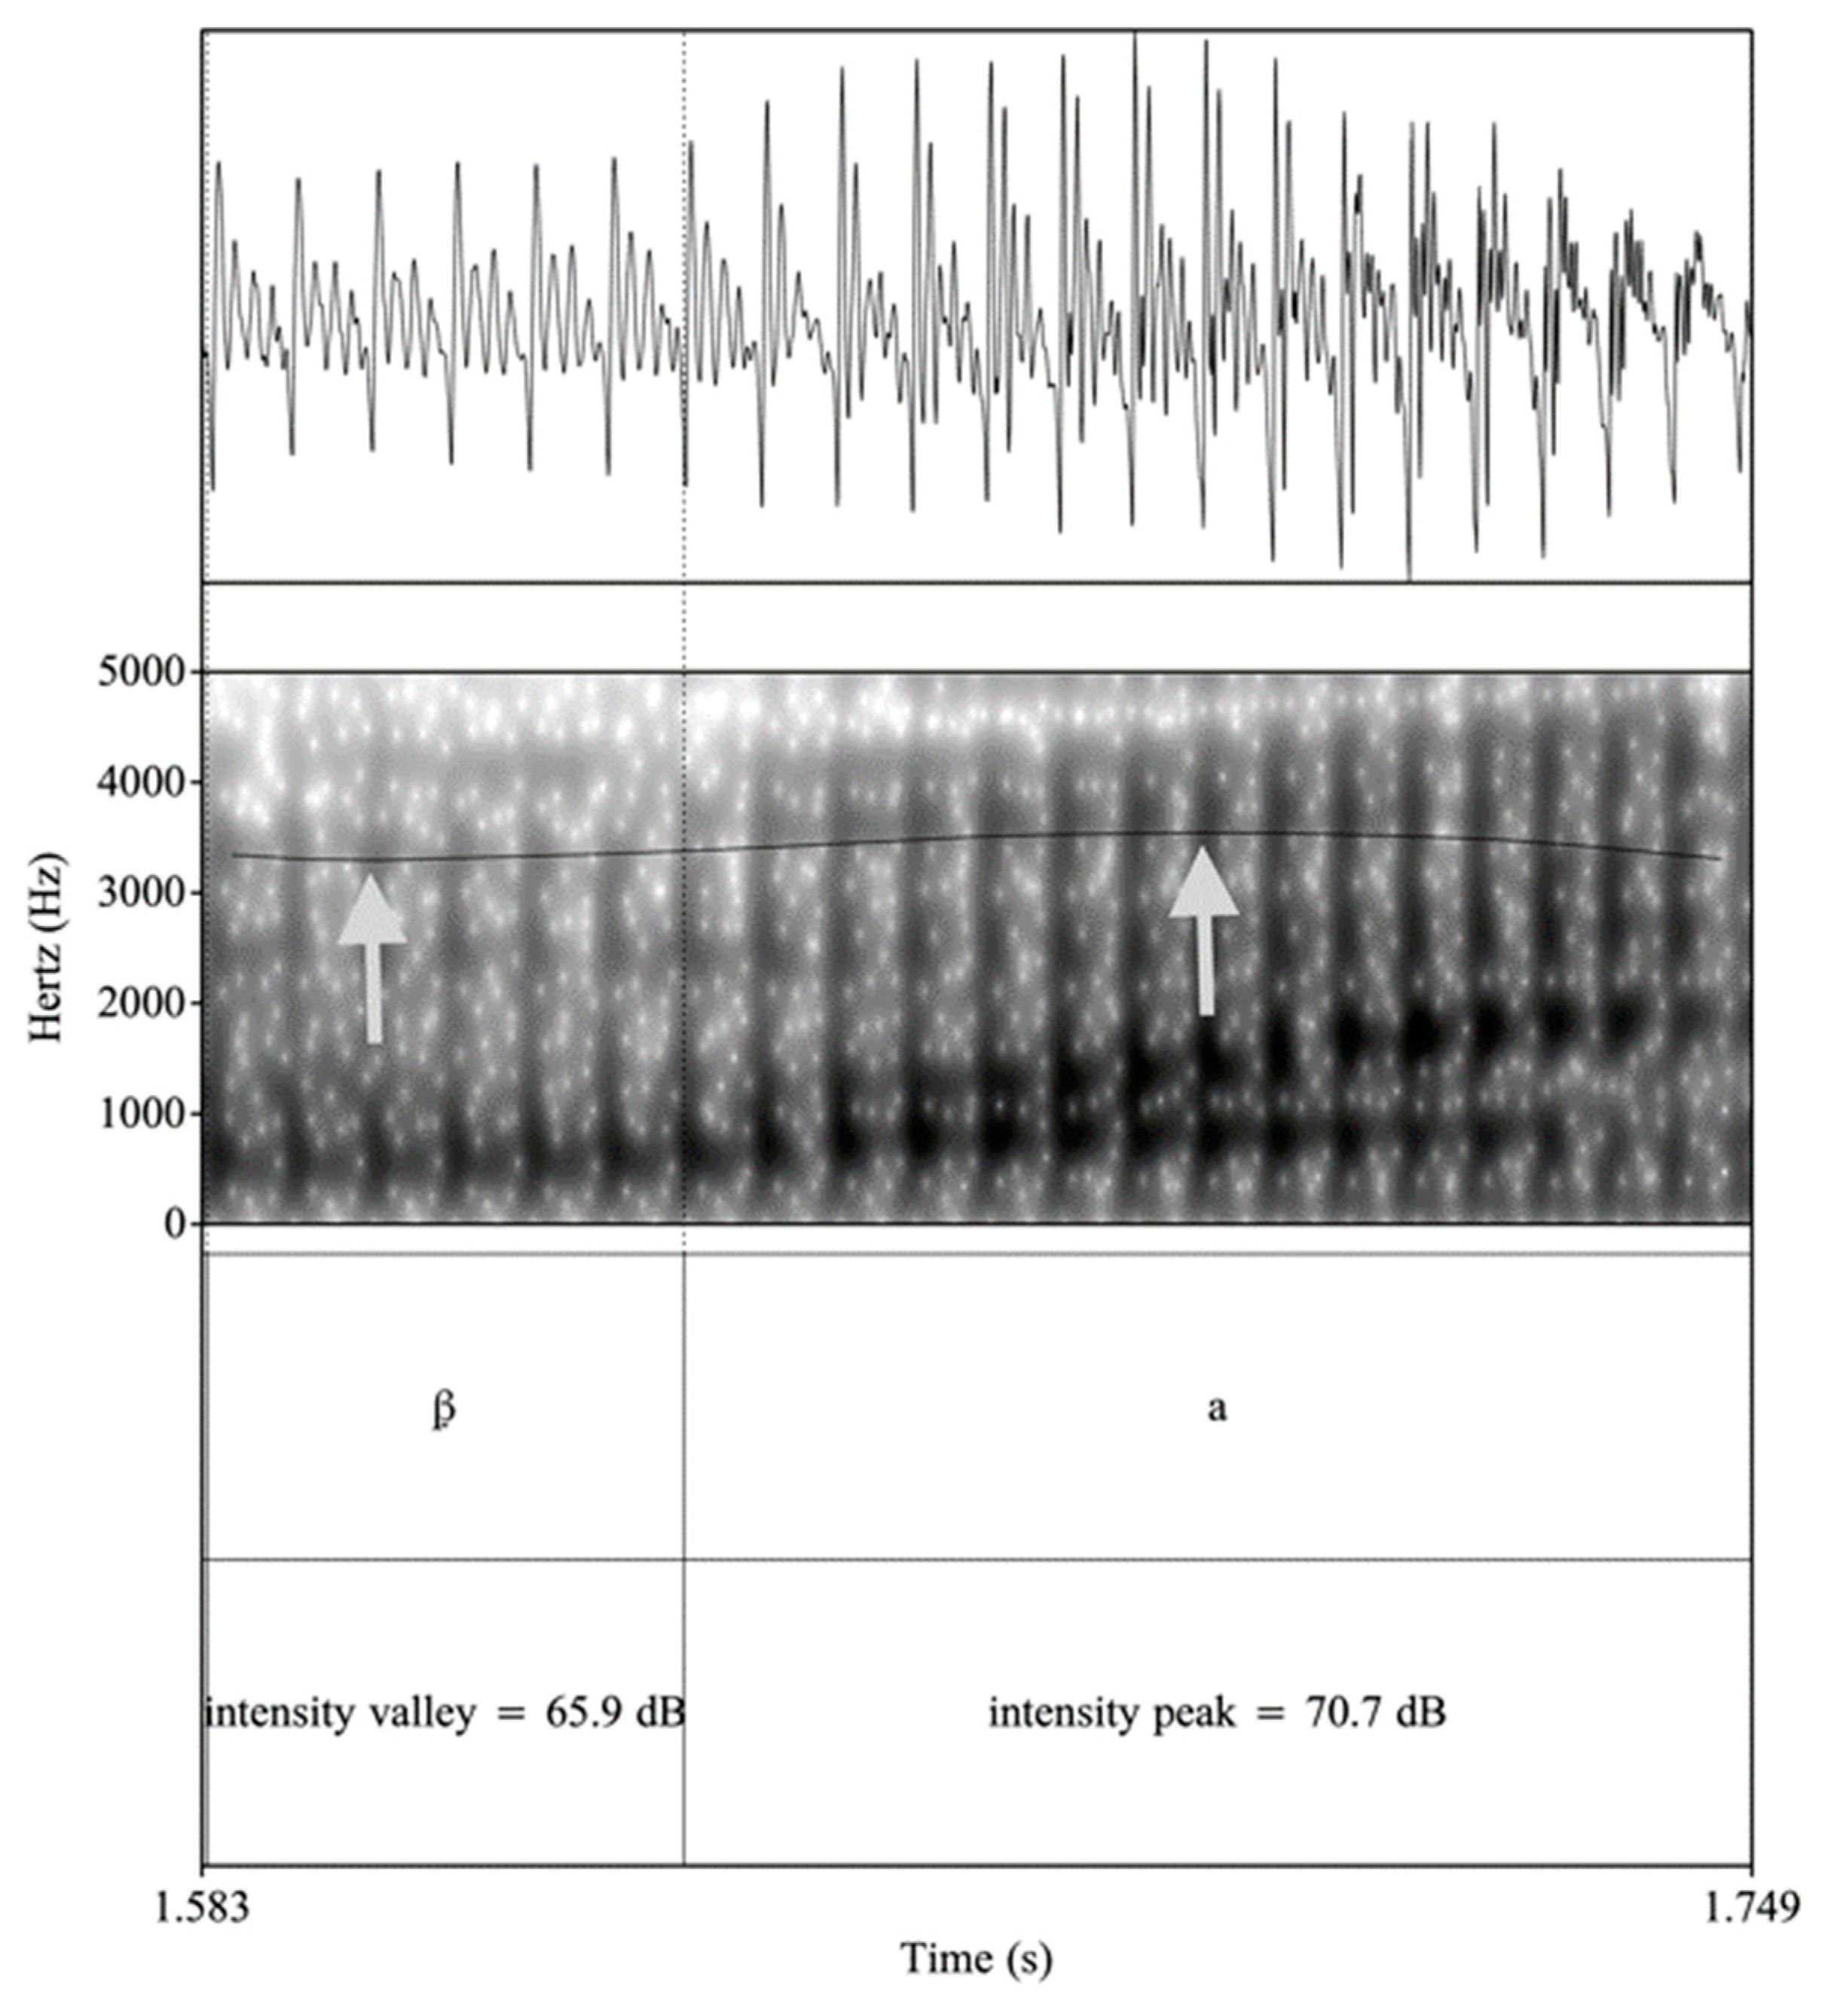
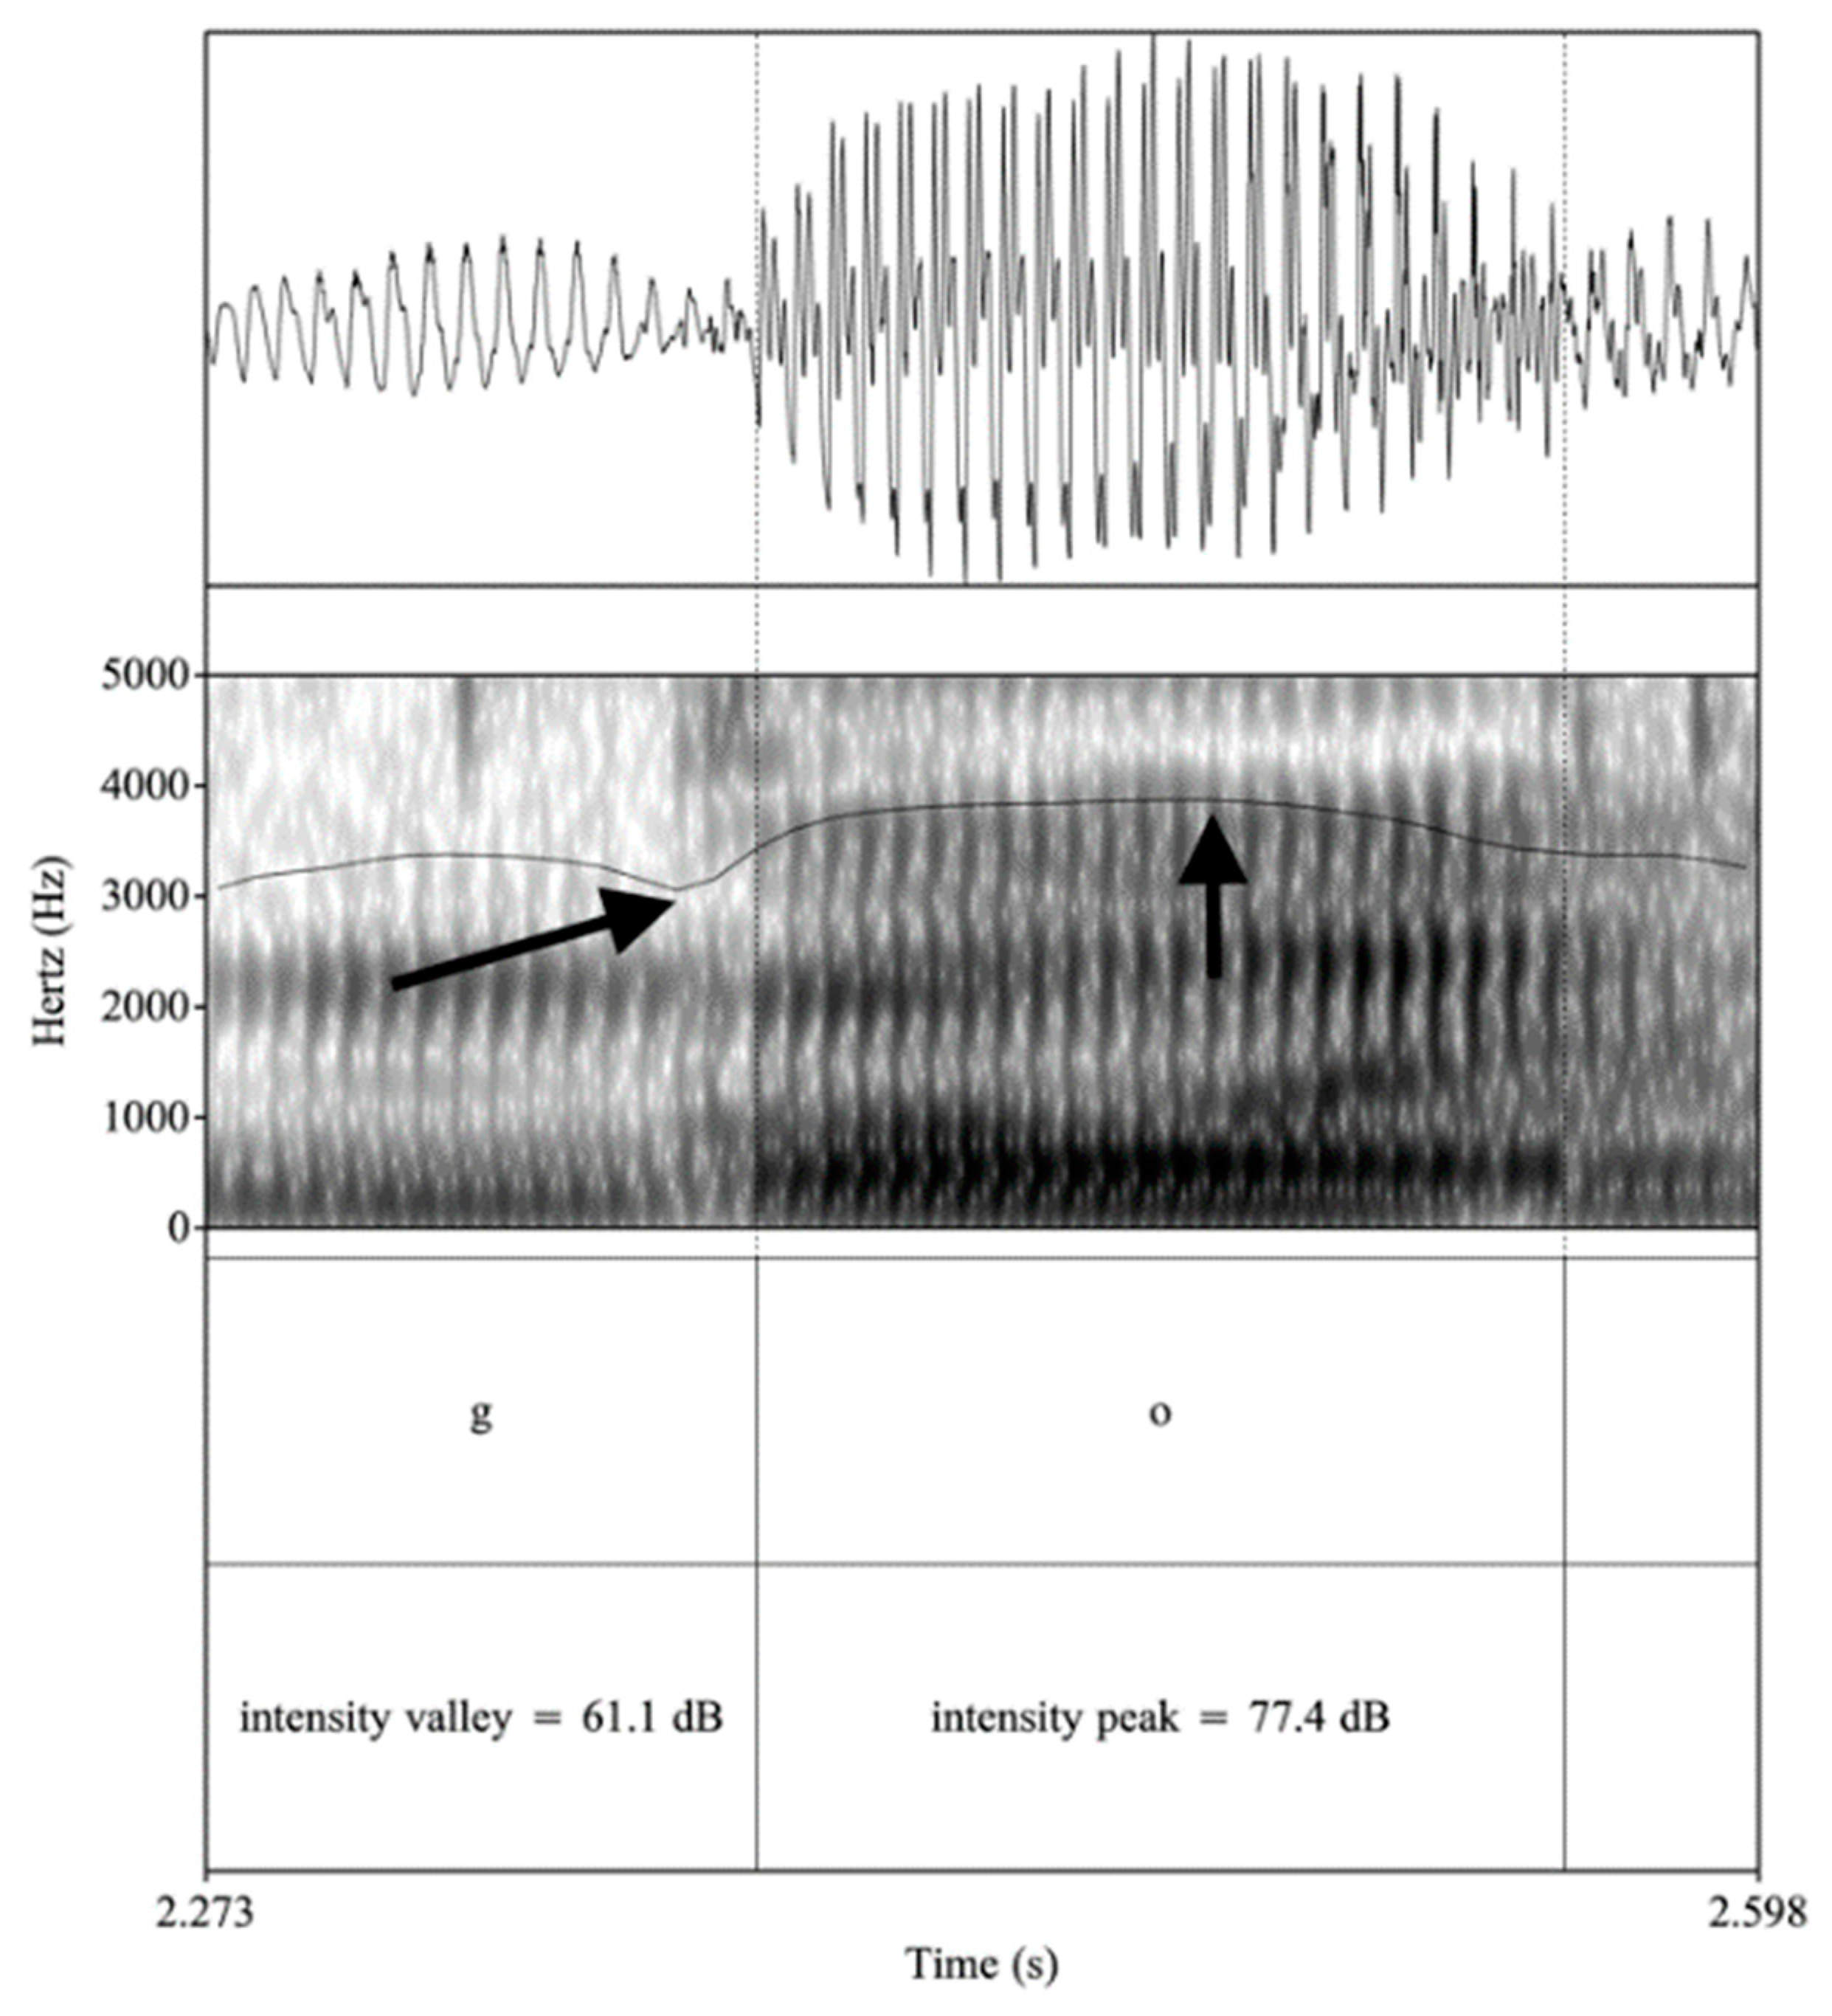
Turning to the distribution of Spanish voiced stops /b, d, ɡ/, one main point of distinction from English is a weakening (i.e., lenition, spirantization) rule through which this series is produced with less obstruction, resulting in a more sonorous and vowel-like production (Hualde 2005). Such weakening is uncommon in English, where voiced stop phonemes are most frequently realized as faithful allophones. Acoustic cues to such weakening are found in the waveform, formant structure, and through a measure of relative intensity (i.e., intensity difference between a voiced stop and the following vowel), all of which provide evidence of degree of aperture or stricture. Spanish /b, d, ɡ/ are typically weakened to their approximant allophones [β̞, ð̞, ɣ̞] in several contexts, but the process is most consistent intervocalically, both word internally and across word boundaries (e.g., /lobo/ [ˈlo.β̞o] lobo ‘wolf’; /lado/ [ˈla.ð̞o] lado ‘side’; /laɡo/ [ˈla.ɣ̞o] lago ‘lake’; /laboda/ [la.ˈβ̞o.ð̞a] la boda ‘the wedding’; /ladaɡa/ [la.ˈð̞a.ɣ̞a] la daga ‘the dagger’; /laɡama/ [la.ˈɣ̞a.ma] la gama ‘the range/spectrum’) (Carrasco et al. 2012; Colantoni and Marinescu 2010; Eddington 2011). Exceptions to the weakening rule occur after a pause, a nasal consonant or, in the case of /d/, after /l/, where /b, d, ɡ/ are most frequently produced as stops that are typically accompanied by prevoicing (i.e., vocal fold vibration before the release burst with a negative VOT value; Hualde 2005). Figure 3 shows an example of an approximant realization of an intervocalic /b/ in Spanish, where the left-hand arrow indicates the intensity valley of the stop segment and the right-hand arrow points to the intensity peak of the following vowel. A periodic waveform, a low relative intensity value (4.8 dB; 70.7 dB–65.9 dB) with respect to the following vowel, and a continuous formant structure are evidence of a vowel-like (i.e., open), approximant realization with minimal obstruction. Figure 4 shows evidence of a stop production of a word-initial Spanish /ɡ/ after a pause. We note cues of prevoicing in the waveform and spectrum, and a larger relative intensity measure (16.3 dB; 77.4 dB–61.1 dB), both of which signal increased obstruction of airflow.

2.2. Key Studies of Segmental Material in Heritage Spanish in the US

Studies on the phonetics and phonology of HSs of Spanish have shown that, compared to adult L2 learners, childhood experience with the HL allows HSs to more closely approximate the perception and production abilities of monolinguals and late-immigrant Spanish–English bilinguals; however, their heritage sound system distinguishes itself from those of the latter two groups due to a variety of linguistic (e.g., syllable stress, word position) and extralinguistic (e.g., proficiency, dominance, cultural connection) variables (e.g., Amengual 2019; Au et al. 2008; Knightly et al. 2003; Rao 2014, 2015; Ronquest 2013, 2016; Shea 2019). This is completely logical because each of these speaker profiles has distinct linguistic experiences, and as such, one would not expect them to perfectly reflect one another.2
Concerning stop consonants, Knightly et al. (2003) examined the production of /p, t, k, b, d, ɡ/ of late learner overhearers of Spanish during childhood, and compared their production to that of early bilingual Spanish speakers (“native,” in their estimation) and late L2 learners. The results of VOT and weakening analyses revealed that the overhearers’ productions were more native-like than those of late L2 learners on the segmental level, thus demonstrating production effects later in life caused merely by exposure to a language in one’s early years. Inspired by Knightly et al. (2003), Au et al.’s (2008) study of Spanish stop consonants looked at Spanish–English bilinguals with different language experiences: those who only overheard Spanish during childhood, those who also spoke Spanish for at least three years in early life and then began relearning it in adolescence, early bilinguals (“native”), and late L2 learners. The productions of voiced and voiceless stops were analyzed, with the first two groups displaying more native-like productions than those of traditional, late L2 learners, and with childhood speakers who spoke the language performing in a more native-like manner than the overhearer group. Therefore, experience in both perceiving and producing a language during childhood has more benefits during adulthood than perception alone.
Kim (2011) acoustically analyzed the voiced and voiceless stops in the English and Spanish of HSs of Spanish and compared their productions to those of controls for each language. The comparison uncovered that HS results in English resembled those of English controls, but their Spanish results differed from those of Spanish controls due to evidence of English patterns. Amengual (2012) investigated the production of /t/ in cognates by early sequential bilingual Spanish HSs, simultaneous bilingual English HSs who grew up in Spain with a British mother and a Spanish father, advanced L1 English–L2 Spanish learners (through schooling), and advanced L1 Spanish–L2 English learners (through schooling), and Spanish–Catalan bilinguals, revealing a significant effect of lengthened VOT in cognates. The Spanish HSs demonstrated slightly lower VOT values in cognate items than the English HSs, but no significant difference in VOT values between Spanish HSs and late learners of Spanish was discovered.
In a series of studies, Rao (2014, 2015) analyzed the production of intervocalic /b, d, ɡ/ in four different groups of Spanish HSs in the US who varied in past and present exposure to Spanish. The results revealed that target-like productions were higher in speakers with increased levels of overall experience with Spanish. In terms of task effects, the reading task produced a higher number of nonnative-like segments in comparison to the spontaneous task, possibly due to a greater focus on form as well as HSs’ difficulty with literacy-based tasks.
Amengual (2019) was the first to analyze heritage Spanish voiced stops through a comparison of bilingual type: simultaneous versus sequential. In the data collected in California, he found that sequential HSs produced the most intervocalic weakening of these phonemes. As such, in the US context, he posited that the exclusive use of Spanish during one’s early years of life has lasting effects on adult phonology.
Research on Spanish HSs’ phonology also includes studies of the vowel system, primarily with speakers in the US. Ronquest (2013) claimed that HSs’ vowel system is significantly different from that of monolingual speakers. The author found evidence of unstressed vowel reduction in the Spanish vocalic space of HSs, who tended to centralize unstressed vowels (especially /e/, /a/ and /o/), producing them with shorter durations than their stressed counterparts. However, none of the vowels were fully reduced to a schwa. A later study by Ronquest (2016) demonstrated that HSs behave similarly to monolingual speakers when it comes to speech style and vowel space expansion, as well as vowel duration. By examining vowel production in different speech styles, the author revealed that in a semi-controlled picture identification and a highly controlled carrier phrase task, vowels were longer in comparison to those of a retelling task. The most controlled task also produced the greatest vowel dispersion.
Shea (2019) studied Spanish HSs’ Spanish and English vowel realizations through the lens of both dominance and proficiency, with statistical analyses of the latter resulting in a higher degree of explanatory power with regard to variation. She interpreted the sets of variability effects for each language as a byproduct of the distinct linguistic realities HSs face when navigating interactions in majority-language versus minority-language situations. Furthermore, a study by Solon et al. (2019) compared the Spanish vowel quality and quantity of HSs to those of late Spanish–English bilinguals, finding no significant differences between the two groups. Both HSs and late bilinguals showed evidence of unstressed vowel reduction, suggesting that vowel production characteristics typically attributed to HSs may actually be features of bilingual vowel system development. Finally, a recent study by Ready (2020) compared the vowel production of cognates versus non-cognates in HSs of Spanish and late bilinguals, both of Mexican background. Focusing on vowel space differences, she found a tight back and wide front vowel space, as well as more evidence of reduction in cognates, across both speaker profiles.
In Table 1, we summarize the main points arising from the studies on vowels and stop consonants reviewed in this section with the emphasis on Spanish–English bilinguals, whose production is the focus of our own analysis.

2.3. Discourse Measures

On a general scale, variables such as pitch and speech rate play an important role in the interpretation of various types of discourse; for example, fluctuations in pitch range can correlate with the hierarchical segmentation of discourse, and pitch increases in particular can signal the beginning of units carrying new thoughts or topic shifts (e.g., Hirschberg and Grosz 1992; Lehiste 1982; Pierrehumbert and Hirschberg 1990; Swerts 1997). With regard to pitch, its range has been cited as being higher in English than in Spanish (e.g., Cole et al. 2019; Estebas-Vilaplana 2009, 2014). Overall, the idea of expanding pitch range, which is linked to more excursions, relates to Gussenhoven’s (2002) Effort Code, which is one of his universal biological codes through which speakers alter pragmatic meaning (e.g., informational meaning, such as highlighting elements in discourse) through pitch modifications requiring a high level of articulatory energy expenditure. Furthermore, Gussenhoven’s (2002) Frequency Code associates with affect by stating that a high pitch is linked to being perceived as submissive, feminine, friendly, polite, and vulnerable, among others, while a lower pitch is tied to the opposite of these adjectives. Another difference between high and low pitch levels deals with certainty; the former can cue less certainty (e.g., in questions), while the latter can increase it (e.g., in statements).
Some studies have shown that speech style is an important variable to consider when studying suprasegmental features and that spontaneous narratives in particular can unveil intriguing prosodic patterns (Face 2003 and references therein). By examining short stories embedded in conversations, Selting (1994) revealed that intonation and prosody are utilized as contextualization cues, which allow speakers to understand structural connections between utterances and help derive specific interpretations based on narratives’ intentions. Oliveira (2000), who studied the speech of Brazilian Portuguese speakers, discovered that spontaneous narrative tasks have an underlying structure, where prosodic variables such as pauses, speech rate, pitch range, pitch reset, and boundary tones are systematically employed by speakers, particularly storytellers, to distinguish highly relevant material from that of lower relevance.
Spontaneous narratives also reveal noteworthy patterns in the speech of bilinguals (Polinsky 2008), including prosodic patterns. Wennerstrom (2001) studied intonational patterns in narratives of L1 American English speakers and L1 Japanese–L2 English learners. The author found that pitch maxima are utilized to express emotional evaluations and attitudes, revealing few differences between the two groups of speakers. Based on this finding, the author argued that pitch associated with emotional expression is different from other intonation systems and is not language-specific. By working with preadolescent Turkish/English bilingual girls, Queen (2006) uncovered that instead of exclusively relying on intonational patterns of one language or practicing code-switching, they created a mix of intonational patterns from both languages that they used to communicate structural and aspectual features of narratives, as well as demonstrate their social situation.
Regarding intonational differences between HSs and other profiles of Spanish speakers in the US, a number of researchers have examined phonological targets, focus conditions and other pragmatic variables, and task types, all primarily across questions and statements, and have suggested effects such as the influence of English, source input varieties of Spanish, reading versus non-reading tasks, and social networks on the unique outcomes tied to HSs (cf. Alvord 2009, 2010; Colantoni et al. 2016; Kim 2019; Rao 2016; Robles-Puente 2014; Zárate-Sández 2015). Finally, a recent study by Ruiz Moreno (2020) that includes a group of German-dominant HSs of Spanish found that even though these HSs’ segmental production is quite similar to that of Spanish monolinguals, only 50% of their accents were judged as reflecting those of monolinguals. The author contended that intonational differences in the HSs’ speech most likely account for this perceptual finding.

3. Materials and Methods

3.1. Informants

The elective class from which informants were selected was offered at a private university in the Northeastern US; the instructor of the course was a female speaker of Standard Mexican Spanish from Mexico City (and a Spanish-dominant Spanish–English bilingual) who had resided in the US for 17 years at the time of the course and whose home language continues to be primarily Spanish. To enroll in the class, which met three times a week for an hour per session, all prospective students had to complete an online questionnaire that asked about their linguistic background, reasons to enroll, and expectations for the course. In the end, seven students enrolled during the semester in question. After an initial inspection of both recording quality of narratives and student profiles, we selected data from five female speakers. The one female speaker from the class who was excluded was closer to a traditional L2 learner, and the only male in the class was excluded because his recordings contained significant background noise that prevented the acoustic analysis of most potential tokens. The profiles of each informant are provided in Table 2. Despite the diverse backgrounds of these five individuals, the instructor determined that their Spanish was at the “high-intermediate” or “advanced” level with regard to both oral and written skills, using the guidelines from the American Council on the Teaching of Foreign Languages (ACTFL). The students classified themselves as English-dominant, based on self-assessed proficiency in their languages. The class did not include phonetic or phonological instruction, which better allowed us to isolate consistent exposure to Spanish input throughout the semester as a reason for any changes we observed in our acoustic and empirical analysis.
All subjects gave their informed consent for inclusion before they participated in the study. The study was conducted in accordance with the Declaration of Helsinki, and the protocol was approved by the Ethics Committee of Harvard University, project identification code 98-213763.

3.2. Data Elicitation Procedure

Informants were asked to watch a video during the second week of the semester and a similar video during the final week of the semester. As such, our two data collection points were separated by 12 weeks (the semester at the institution in question contains 14 weeks), or 36 class hours (12 weeks × 3 hours/week). The two clips were taken from the Russian silent cartoon Nu, pogodi! ‘You just wait!,’ which includes a variety of actions, none of which require complex vocabulary to describe, but no conversations between characters (see Parra et al. 2018 for a discussion of this methodology and further references). The two clips were of comparable length: 91 and 98 seconds. Each has the same two main characters: a mean wolf and a clever bunny who always outsmarts the wolf. We used different clips for the pre- and post-task to avoid the informants’ rote memorization of the first clip. Informants were instructed to watch each video just one time, and afterwards, to produce their narration naturally, as if they were speaking to a friend. Viewings and recordings were carried out outside of class time, so the physical presence of a researcher did not influence the recording at either point in time.

3.3. Acoustic Analysis

The acoustic analysis of all of our features of interest in the pre- and post-data of each informant was done using Praat Boersma and Weenink (2020).5 For vowels, we focused on quality rather than quantity because we were interested in observing changes to the dispersion of the vowel space. To measure quality, we segmented tokens manually, which was guided by the acoustic features of increases in waveform amplitude compared to adjacent sounds, the presence of a periodic waveform, and clearly visible formants, then took midpoint F1 and F2 measurements in Hz, and finally normalized these raw measurements using the Lobanov method (Lobanov 1971; see Adank et al. 2004, as well). We restricted our analysis to vowels serving as nuclei of open syllables with only one preceding consonant in onset position (i.e., CV syllables) to avoid the potential complexities of variation induced by closed syllables (Martínez Celdrán 1984; Navarro Tomás 1918).6 Finally, in order to search for ev6idence of vowel reduction, we also coded each token for stress. When looking at the voiceless stops /p, t, k/, we focused on simple onset tokens in word-initial position only, measuring each production by taking the time in ms between waveform evidence of a stop burst and the beginning of the first periodic cycle of the following vowel (see Figure 1 and Figure 2). We also coded each voiceless stop token for place of articulation (i.e., bilabial, dental, velar). Finally, in terms of the voiced stops /b, d, ɡ/, our analysis centered on degree of stricture in intervocalic context (word-internal or across a word boundary). We examined each voiced stop token’s intensity valley (in dB) relative to the following vowel’s intensity peak (see Figure 3 and Figure 4); a smaller difference in the value of these two points was evidence of less stricture, or a more open, approximant articulation, while a larger difference was interpreted as more stricture, or a more closed, stop-like production.
Regarding the acoustic analysis of our remaining variables, the first step was to parse all data from both points in time into prosodic phrases, or informational chunks, which have a long history of contributing to the encoding of various types of discourse (Ladd 2008). Work on Spanish typically refers to two levels of phrasing: intermediate phrases (ips; minor phrases), whose right edges occur at non-terminal discourse junctures and are cued by continued pitch rises or plateaus followed by pitch reset, lengthening effects or short pauses, and intonational phrases (IPs; major phrases), whose right boundaries coincide with terminal points of discourse signaled by pitch suppression and lengthening (Rao 2010). Given that pitch reset and short pauses often occur at ip boundaries, we deemed the ip rather than the larger intonational phrase as the relevant unit within which we would analyze our three suprasegmental variables. Within each ip, we measured mean pitch by selecting the entire content of the ip and then choosing “get pitch” from Praat’s analysis window. For pitch range within each ip, while keeping the content of the entire ip highlighted, we obtained the maximum and minimum F0 points by selecting “get maximum pitch” and “get minimum pitch,” respectively, in the Praat analysis window, and then subtracted the latter from the former. Finally, we measured speech rate in each ip by counting the number of syllables across the words of the ip and dividing this total by the selected portion’s duration in seconds.

4. Results

The data for each feature of interest were analyzed and will be discussed separately. For each informant, we used the acoustic results as inputs for inferential statistics about the following variables, as produced at the beginning and end of the semester: VOT of voiceless stops, relative intensity of voiced stops, the first two vowel formants (allowing for commentary on vowel spaces), pitch range, mean pitch, and speech rate. Section 5 synthesizes our results and elaborates on their implications.

4.1. Consonants

4.1.1. Voiceless Consonants

Consonants for which there were fewer than five total tokens were excluded from the analysis. For each informant, we fit a linear model that predicted VOT, with the following predictors: TASK (a binary variable indicating whether the VOT measurement corresponded to an utterance produced at the beginning or the end of the semester) and PHONEME (a categorical variable coded using deviation coding that indicated which phoneme the measurement corresponded to). We also fit a model with an INTERACTION of TASK and PHONEME and reported the results where the interaction effect was significant.
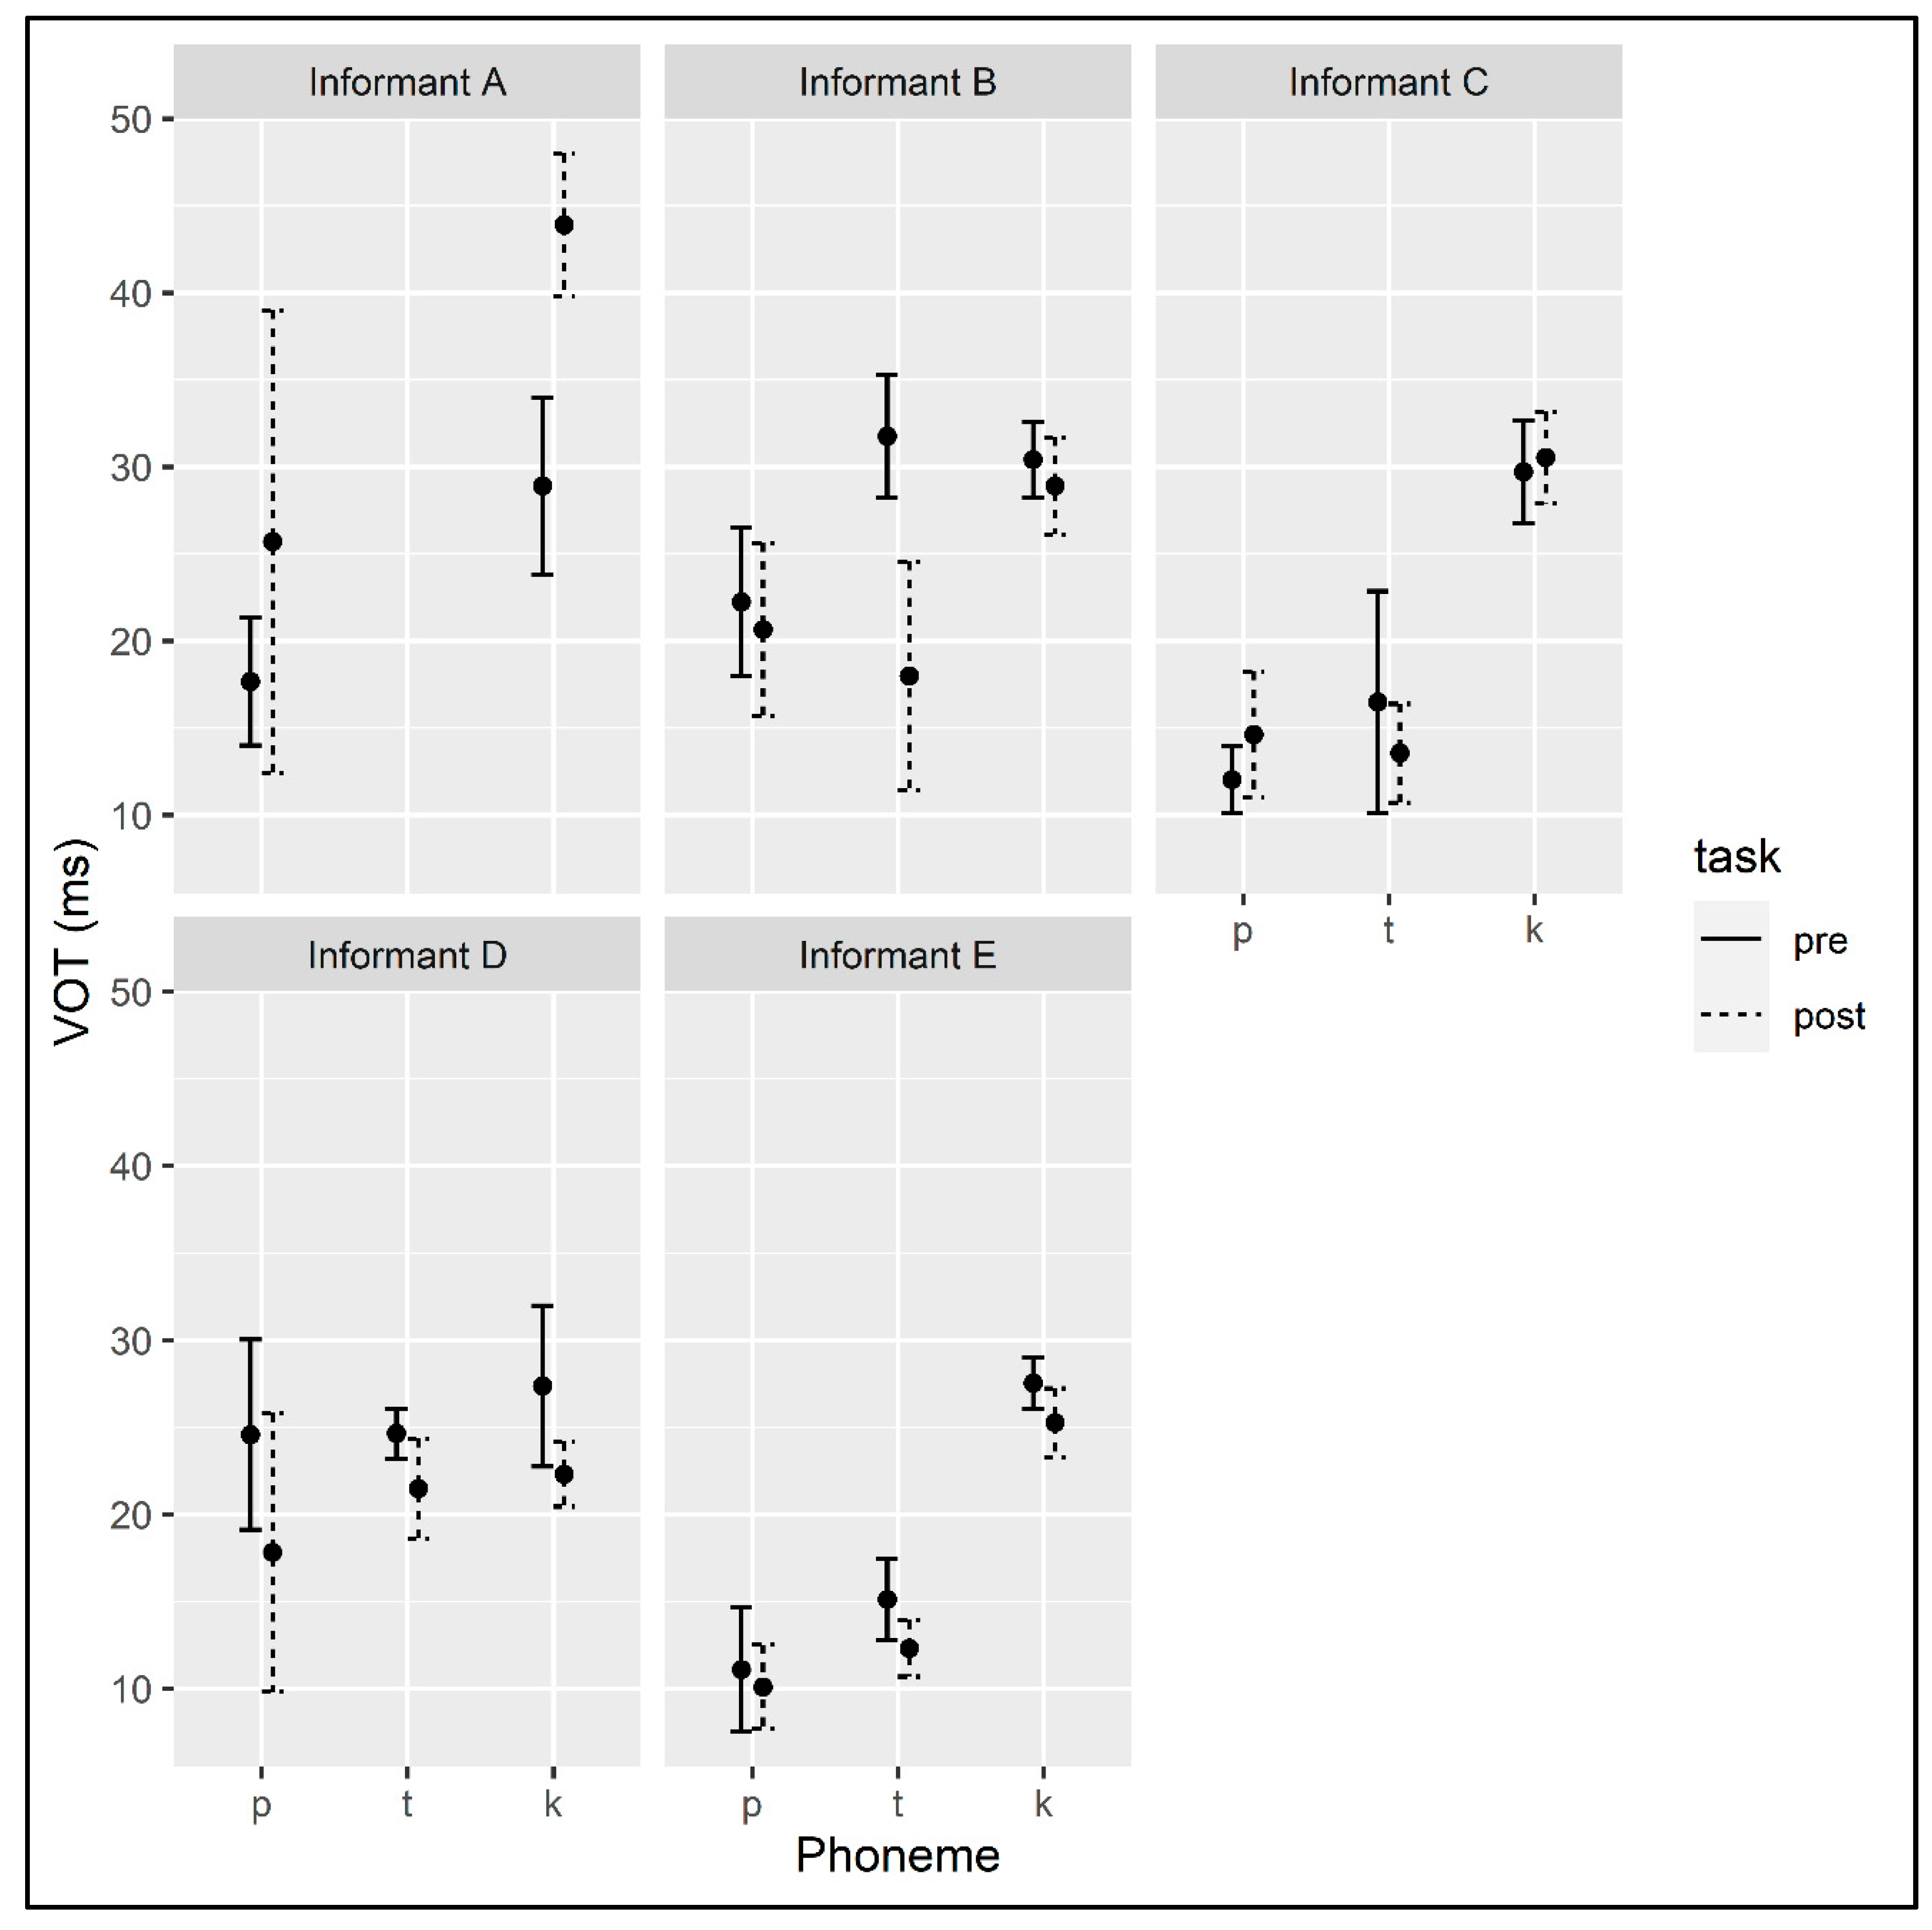
For Informant A, in the narrative at the beginning of the semester the mean VOT for /p/ was 17.6 ms (sd = 5.78), and for /k/ it was 28.90 ms (sd = 11.15) (see Table A1 in Appendix A for token counts). At the end of the semester, the mean VOT for /p/ was 25.71 ms (sd = 14.36) and for /k/ it was 43.89 ms (sd = 10.58) (see Figure 5). VOT measurements for /t/ were excluded from the analysis because Informant A produced fewer than five tokens of this phoneme. The linear model found a significant effect of TASK (β = 13.12, SE = 2.61, p < 0.001), suggesting that the informant produced longer VOTs at the end of the semester. The model also found a significant effect of PHONEME (β = 14.17, SE = 2.91, p < 0.001), indicating that the informant produced longer VOTs on average for /k/ than for /p/. A model that included the interaction of TASK and PHONEME as a predictor did not find a significant effect of the interaction.
The mean VOTs for Informant B at the beginning of the semester were 22.23 ms (sd = 8.30) for /p/, 31.75 (sd = 2.21) for /t/, and 30.41 (sd = 4.88) for /k/ (see Table A4 in Appendix B for token counts). At the end of the semester, Informant B produced VOTs with a mean of 20.67 ms (sd = 8.97) for /p/, 18.00 ms (sd = 2.65) for /t/, and 28.9 ms (sd = 7.62) for /k/ (see Figure 5). A linear model predicting VOT by TASK and PHONEME and their interaction found a significant effect of TASK and PHONEME as well as their interaction. To follow up on the interaction effect, we fit individual models for each consonant predicting VOT by TASK. The effect of TASK was only significant for /t/ (β = −13.75, SE = 1.83, p < 0.001). Informant B produced shorter VOTs for /t/ at the end of the semester.
At the beginning of the semester, Informant C produced voiceless consonants with the following mean VOTs: 12.05 ms (sd = 4.07) for /p/, 16.5 ms (sd = 0.71) for /t/, and 29.7 ms (sd = 8.42) for /k/ (see Table A7 in Appendix C for token counts). At the end of the semester, the mean VOTs for these voiceless consonants were 14.63 ms (sd = 5.39) for /p/, 13.56 ms (sd = 3.67) for /t/, and 30.53 ms (sd = 9.36) for /k/ (see Figure 5). A linear model predicting VOT by TASK and PHONEME found only a significant effect of PHONEME, indicating that the VOTs that Informant C produced for /p/ were on average shorter than the mean of all VOTs the informant produced (β = −7.37, SE = 2.23, p = 0.001).
At the beginning of the semester, Informant D produced tokens of /p/ with a mean VOT of 24.6 ms (sd = 7.63), tokens of /t/ with a mean VOT of 24.67 ms (sd = 0.58), and tokens of /k/ with a mean VOT of 27.39 ms (sd = 9.29) (see Table A10 in Appendix D for token counts). At the end of the semester, Informant D produced tokens of /p/ with a mean VOT of 17.83 ms (sd = 7.62), tokens of /t/ with a mean VOT of 21.50 ms (sd = 2.74), and tokens of /k/ with a mean VOT of 22.33 ms (sd = 3.74) (see Figure 5). A linear model predicting VOT by TASK and PHONEME found a significant effect of TASK (β = −5.23, SE = 1.75, p = 0.004), indicating that, overall, Informant D produced shorter VOTs at the end of the semester. A model that included an interaction between TASK and PHONEME did not find a significant effect of the interaction.
At the beginning of the semester, Informant E produced tokens of voiceless consonants with the following mean VOTs: 11.11 ms (sd = 7.18) for /p/, 15.14 ms (sd = 4.05) for /t/, and 27.55 ms (sd = 8.21) for /k/ (see Table A13 in Appendix E for token counts). At the end of the semester, the mean VOTs for these consonants were 10.11 ms (sd = 6.23) for /p/, 12.33 ms (sd = 3.27) for /t/, and 25.29 ms (sd = 8.22) for /k/ (see Figure 5). A linear model predicting VOT by TASK and PHONEME found a significant effect of TASK (β = −2.07, SE = 0.93, p = 0.028), indicating that Informant E produced significantly shorter VOTs at the end of the semester than at the beginning of the semester. The model also found a significant effect of PHONEME: the informant’s VOTs were shorter overall for /p/ (β = −6.22, SE = 0.78, p < 0.001) and /t/ (β = −3.25, SE = 0.86, p < 0.001) than for their voiceless consonants overall. A model that included the interaction of TASK and PHONEME as a predictor did not find a significant effect of the interaction.

4.1.2. Voiced Consonants

Consonants for which there were fewer than five total tokens were excluded from the analysis. For each informant, we fit a linear model that predicted RELATIVE INTENSITY, with predictors TASK and PHONEME, as before. We also fit a model with an INTERACTION of TASK and PHONEME and reported the results where the interaction effect was significant.
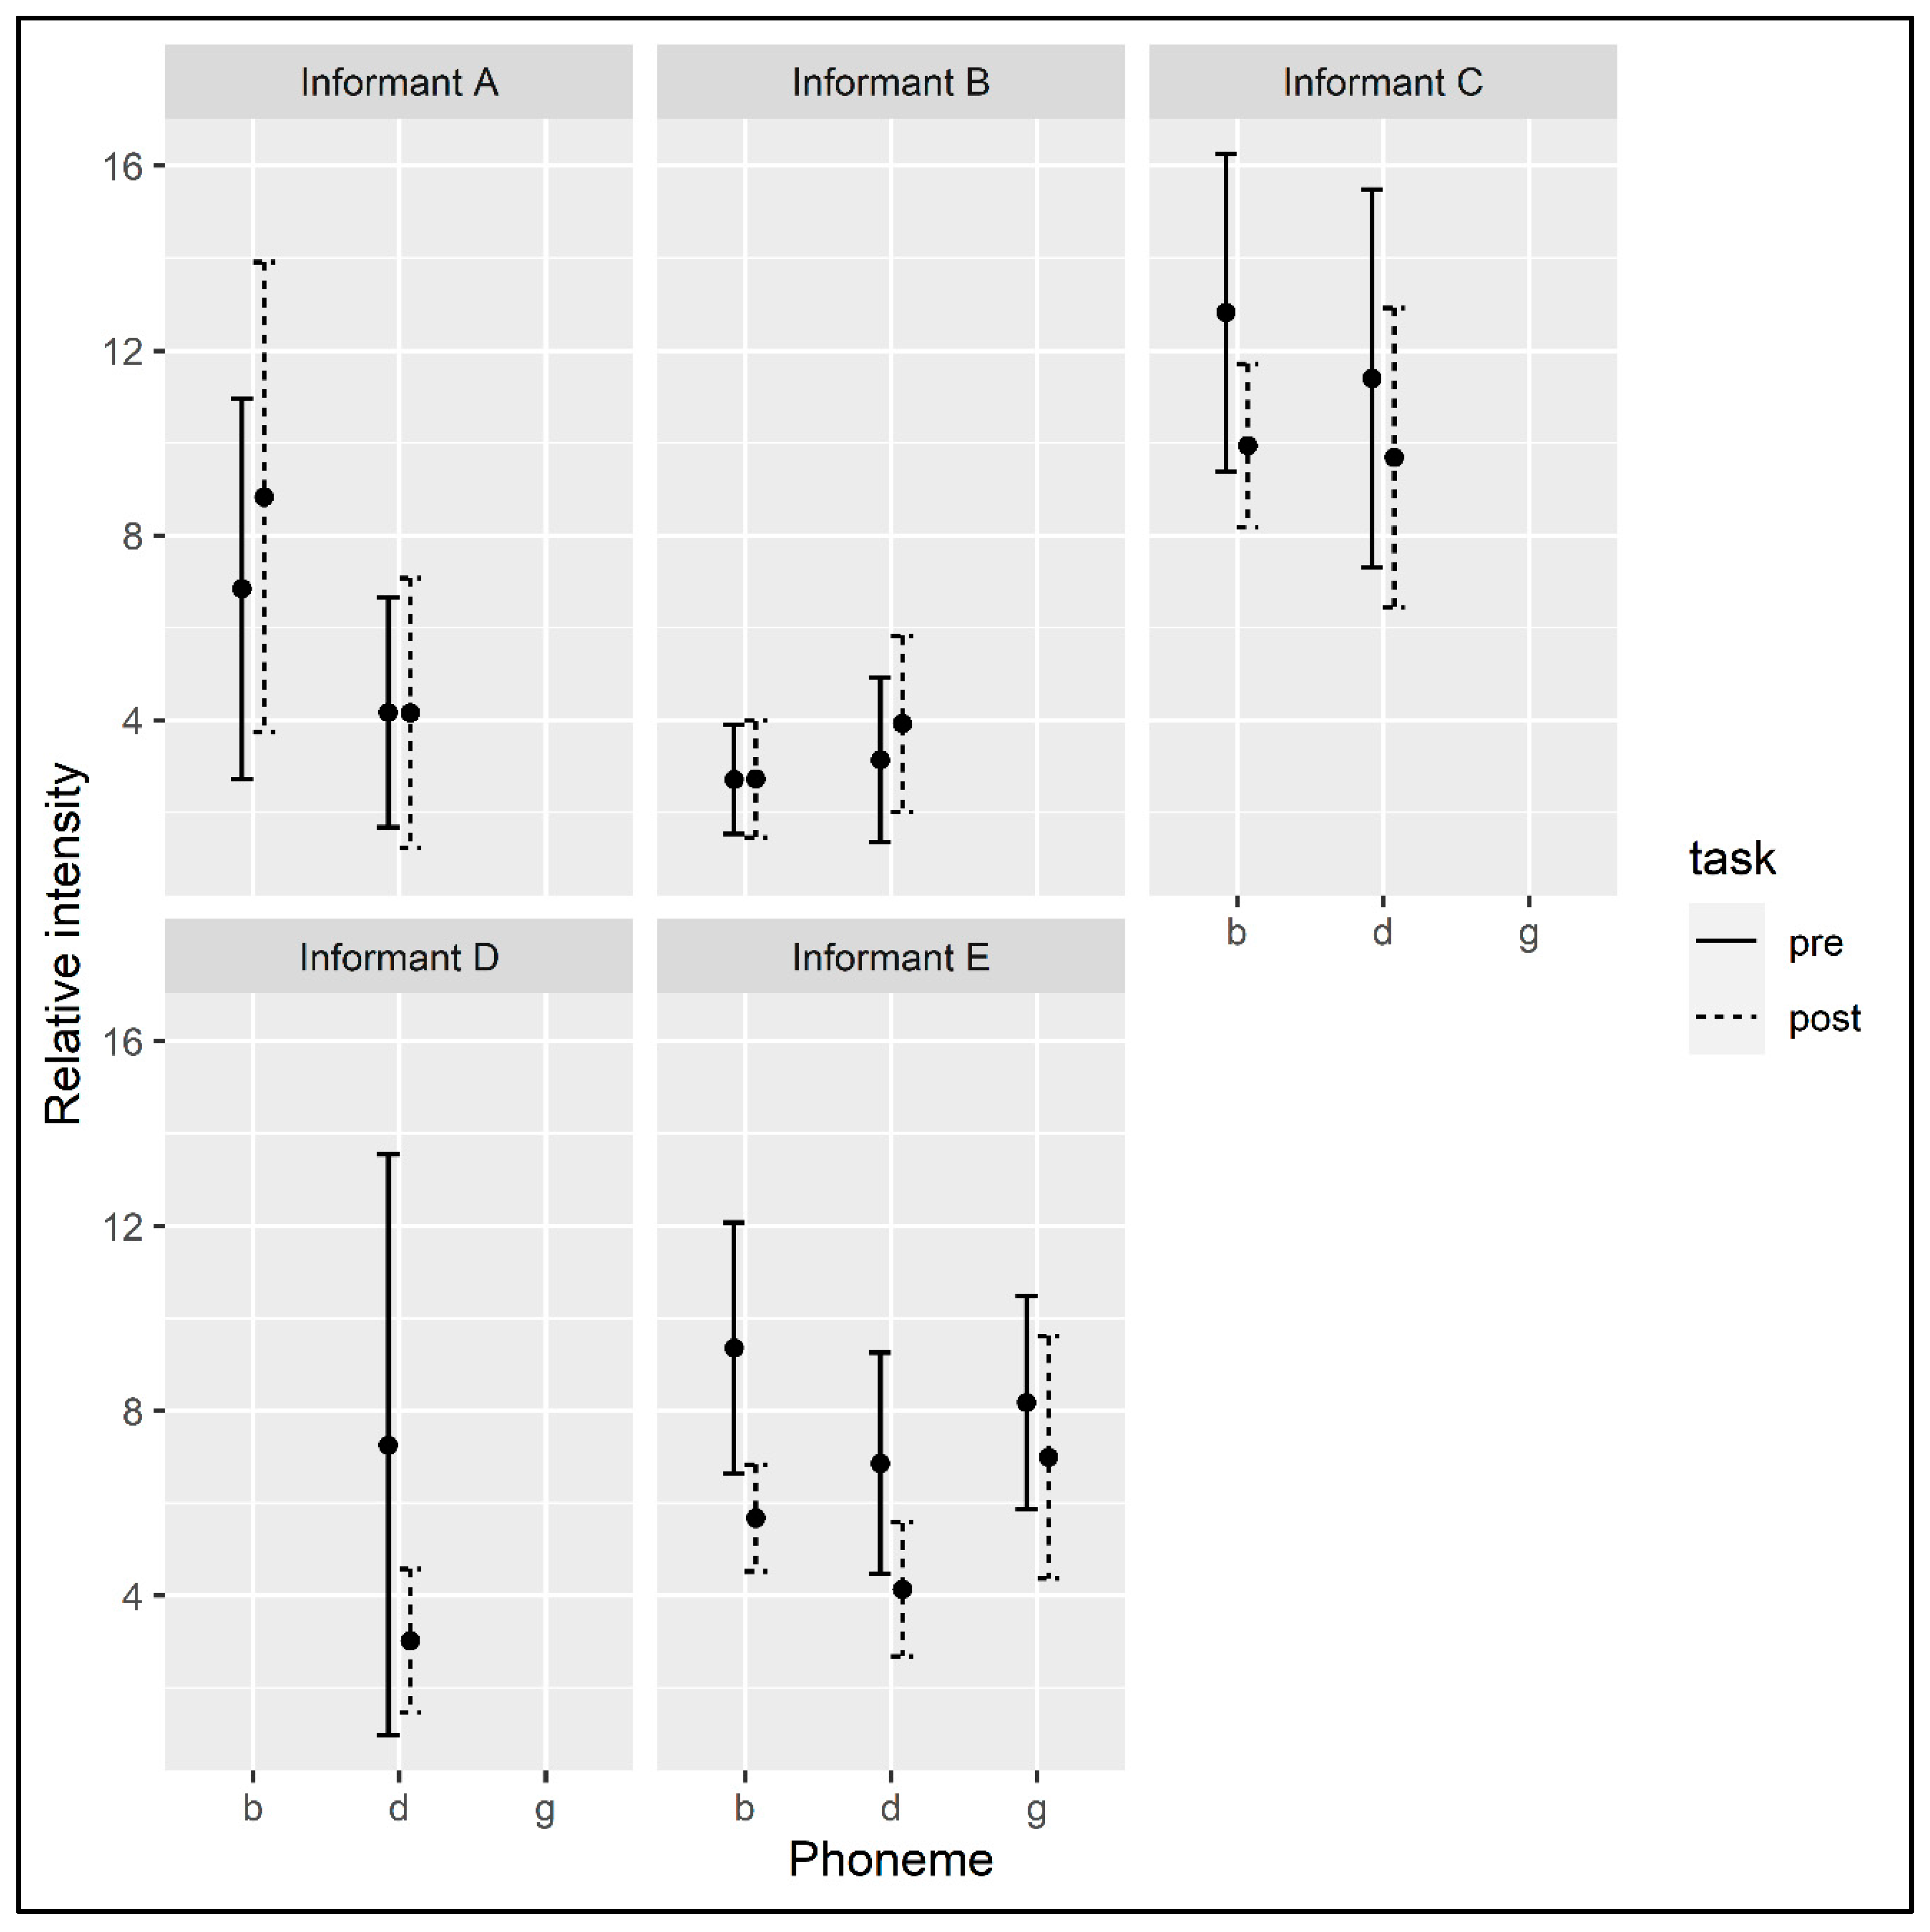
For Informant A, the relative intensity of /b/ was 6.85 dB (sd = 3.93) and of /d/ was 4.17 dB (sd = 4.83) at the beginning of the semester, and at the end of the semester it was 8.83 dB (sd = 6.09) for /b/ and 4.16 dB (sd = 5.86) for /d/ (see Figure 6; see Table A1 in Appendix A for token counts). A linear model predicting RELATIVE INTENSITY by TASK and PHONEME found no significant effects.
At the beginning of the semester, the mean relative intensity of the voiced vowels produced by Informant B was 2.71 dB (sd = 2.66) for /b/ and 3.13 dB (sd = 3.46) for /d/. At the end of the semester, mean relative intensity for these phonemes was 2.72 dB (sd = 2.28) and 3.92 dB (sd = 4.81), respectively (see Figure 6; see Table A4 in Appendix B for token counts). A linear model predicting RELATIVE INTENSITY by TASK and PHONEME found no significant effects.
The mean relative intensity of the voiced consonants produced by Informant C at the beginning of the semester was 12.82 dB (sd = 1.38) for /b/ and 11.4 dB (sd = 5.33) for /d/. The mean relative intensity of these phonemes at the end of the semester was 9.94 dB (sd = 3.2) for /b/ and 9.69dB (sd = 6.91) for /d/ (see Figure 6; see Table A7 in Appendix C for token counts). A linear model predicting RELATIVE INTENSITY by TASK and PHONEME found no significant effects.
At the beginning of the semester, the mean relative intensity of tokens of /d/ produced by Informant D was 7.26 dB (sd = 7.52), while at the end of the semester it was 3.06 dB (sd = 2.58) (see Figure 6; see Table A10 in Appendix D for token counts). A linear model predicting RELATIVE INTENSITY by TASK showed a trending effect for TASK, suggesting that the informant produced tokens of /d/ with lower relative intensity at the end of the semester, but the effect did not reach significance (β = −4.23, SE = 2.24, p = 0.075).
The mean relative intensity of Informant E’s voiced consonants at the beginning of the semester was 9.36 dB (sd = 5.80) for /b/, 6.86 dB (sd = 5.54) for /d/, and 8.18 dB (sd = 5.31) for /g/. The mean relative intensity of the tokens of voiced consonants produced by the informant at the end of the semester was 5.68 dB (sd = 2.33) for /b/, 4.14 dB (sd = 4.34) for /d/, and 6.99 dB (sd = 5.44) for /g/ (see Figure 6; see Table A13 in Appendix E for token counts). A linear model predicting RELATIVE INTENSITY by TASK and PHONEME found a significant effect of TASK (β = −2.52, SE = 0.84, p = 0.003), indicating that at the end of the semester the informant produced voiced consonants with lower relative intensity. The model also found a significant effect of PHONEME for the /d/ level (β = −1.37, SE = 0.57, p = 0.016), suggesting the relative intensity of Informant E’s tokens of /d/ was lower than the average relative intensity measured for all of the voiced consonants taken together. A model that included the interaction of TASK and PHONEME did not find a significant effect of interaction.

4.2. Vowels

4.2.1. Informant A

Vowel formant measures underwent normalization using the Lobanov method (see Adank et al. 2004; Lobanov 1971). Outlier formant values were manually removed. We also removed all tokens of /u/ from the analysis, since, overall, the informants did not produce a sufficient number of tokens to be included in the analysis.
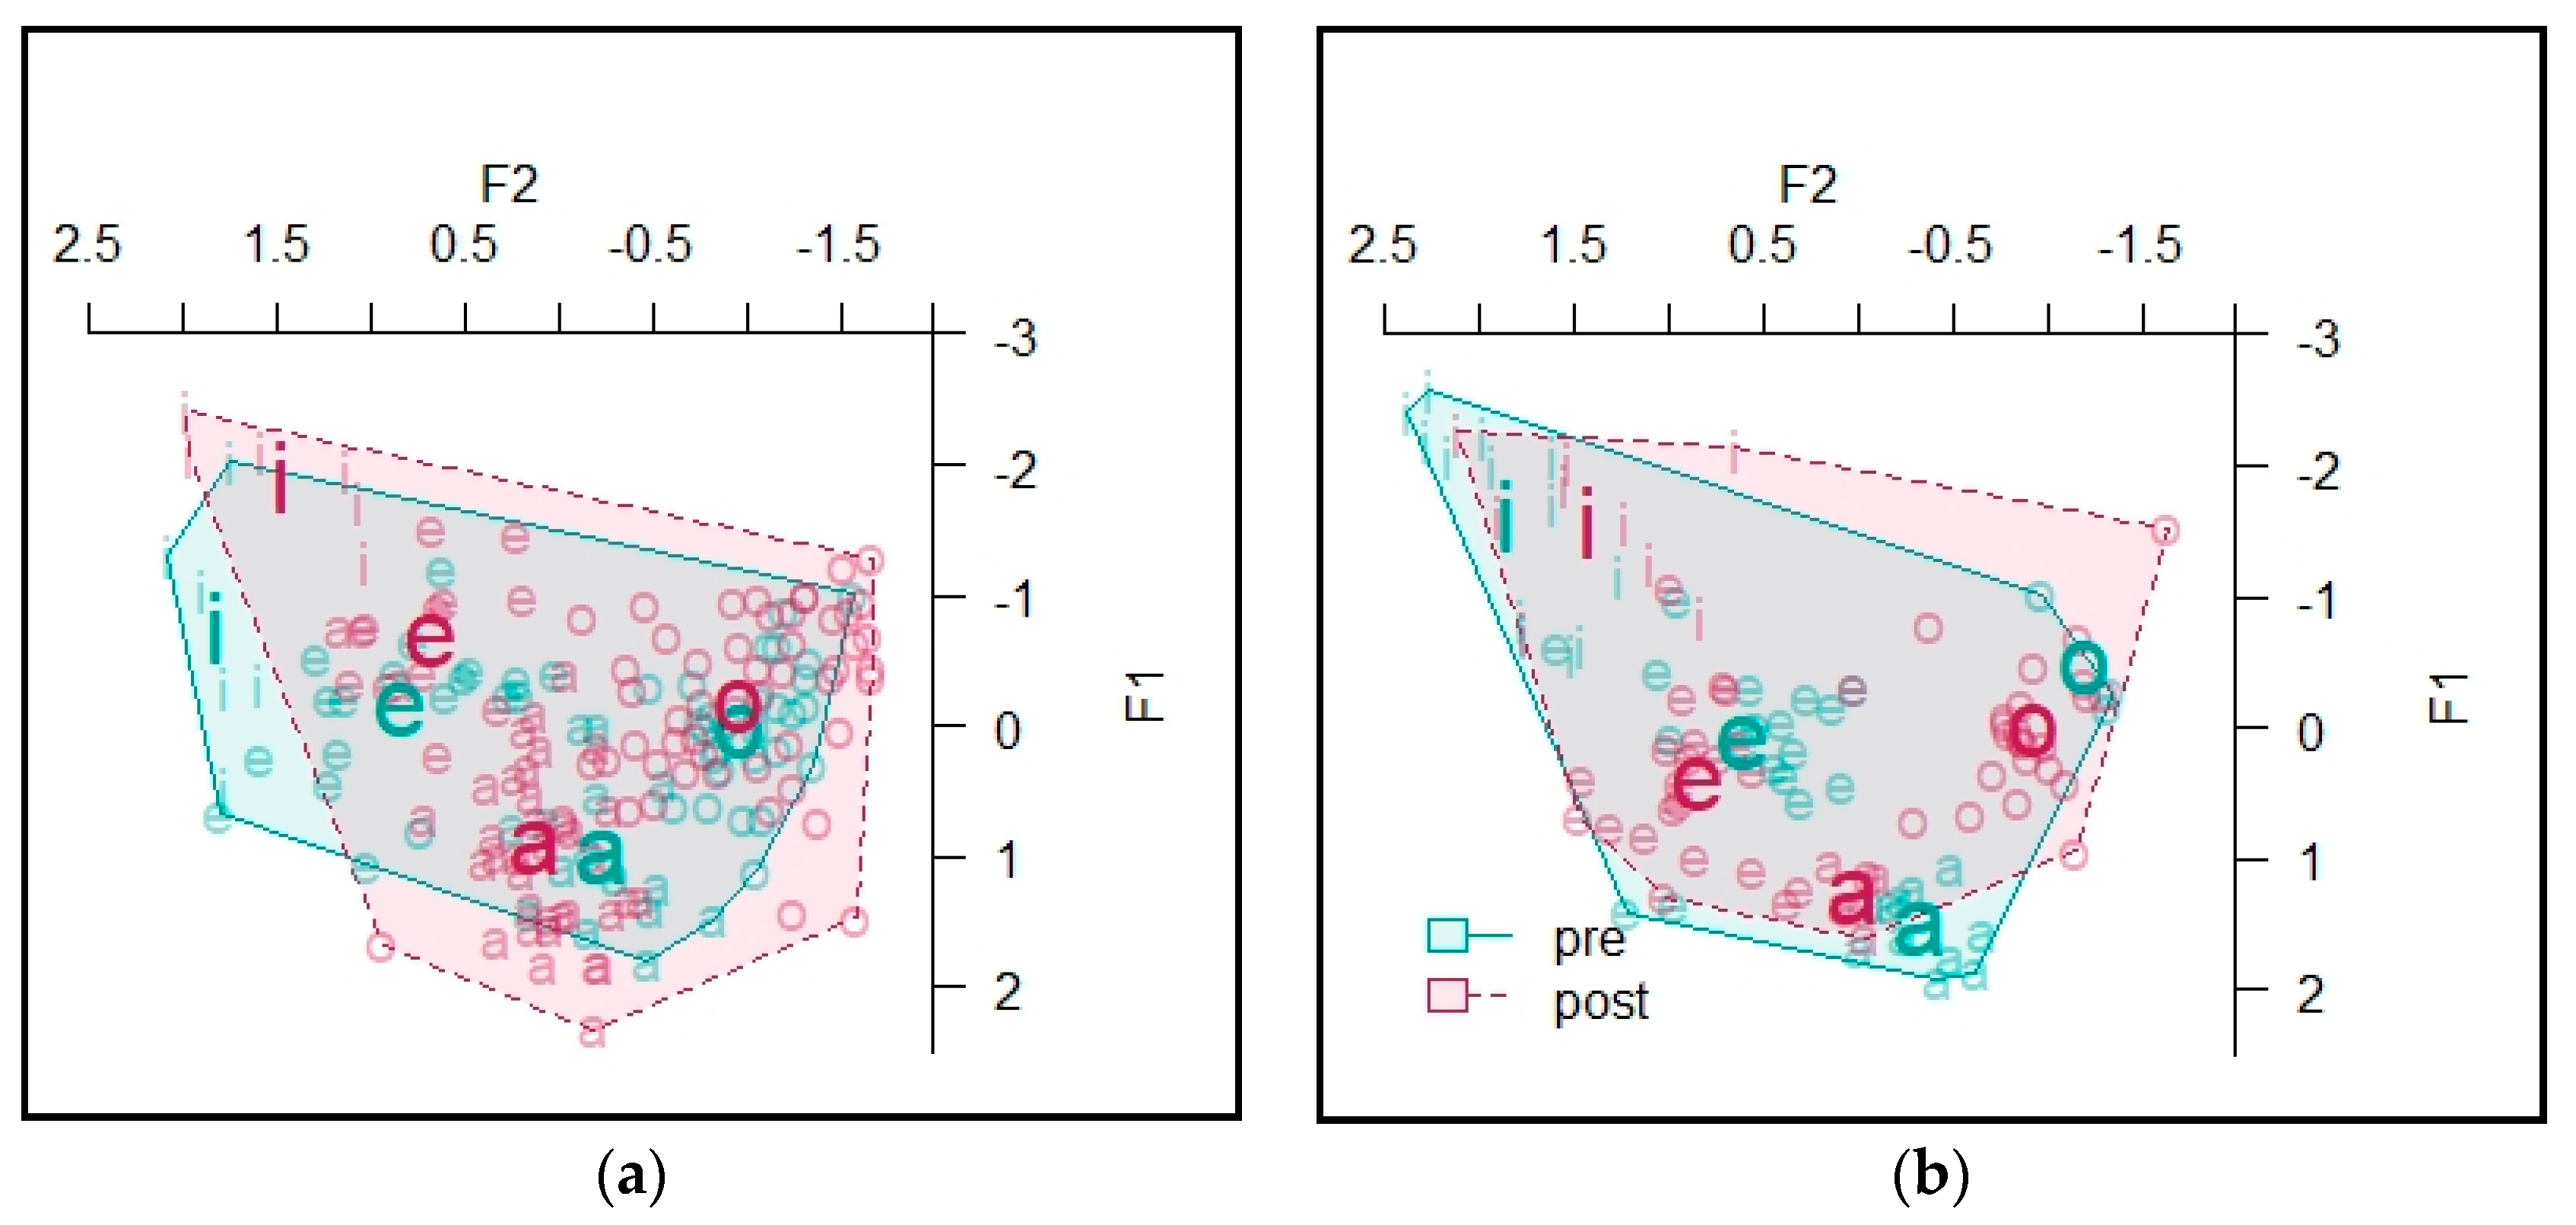
The vowel spaces for Informant A are presented in Figure 7. The area of the space—defined as the convex hull containing all vowel tokens (see Table A2 in Appendix A for token counts) and calculated from Lobanov-normalized formant values—for stressed vowels at the beginning of the semester was 2.07, and at the end of the semester it was 1.61. For unstressed vowels, at the beginning of the course it was 2.32 and at the end of the course it was 1.75. This suggests that the size of Informant A’s vowel space may have decreased.
The analysis of each informant’s vowels proceeded in two steps. First, for each informant we applied a multivariate analysis of variance (MANOVA) model to the formant values of all vowels included in the analysis. This allowed us to include two dependent variables—the normalized F1 and F2 values. The independent variables were TASK and STRESS. TASK was a binary variable coded as before. STRESS was a binary variable encoding whether the vowel was produced as part of a stressed syllable or an unstressed syllable.
For Informant A, the multivariate analysis found a significant effect of TASK (Pillai’s trace = 0.11, F = 12.08, df = 2, p < 0.001) as well as a significant effect of STRESS (Pillai’s trace = 0.075, F = 7.43, df = 2, p < 0.001) and their interaction (Pillai’s trace = 0.077, F = 7.68, df = 2, p < 0.001).
To follow up on the interaction effect, we fit individual MANOVAs to stressed vowels first, and then to unstressed vowels. For the stressed vowels, the MANOVA predicting F1 and F2 by TASK found a significant effect of TASK (Pillai’s trace = 0.27, F = 13.93, df = 2, p < 0.001). The univariate tests found a significant effect of TASK on stressed F2 values (η2 = 0.27, F = 28.19, df = 1, p < 0.001) but not on F1, indicating that Informant 1 produced significantly different F2 values for stressed vowels at the beginning and the end of the course.
For unstressed vowels, a MANOVA predicting F1 and F2 by TASK found a significant effect of TASK (Pillai’s trace = 0.12, F = 7.21, df = 2, p = 0.0011). The univariate tests showed a significant effect of TASK on unstressed F1 values (η2 = 0.094, F = 11.08, df = 1, p = 0.0012) and a trending effect on F2 that did not reach significance (η2 = 0.032, F = 3.46, df = 1, p = 0.065).
In the second step of the analysis of each informant’s vowels, we used post hoc t-tests to test for significant differences in Lobanov-normalized F1 and F2 values for each of the four vowels included in the analysis; the values are provided in Table 3 (see Table A3 in Appendix A for token counts). Assumptions were met for all t-tests reported here and throughout this section. At the vowel level, there were not consistently enough tokens to test for differences between stressed and unstressed tokens, so we did not make this distinction. For Informant A, there was a significant difference in F1 values for tokens of [a] (p = 0.002); a significant difference for F1 values of [e] (p = 0.027); a trend for differences in F2 values of [e] that did not reach significant (p = 0.064); and a significant difference in F2 values of [i] (p < 0.001).

4.2.2. Informant B

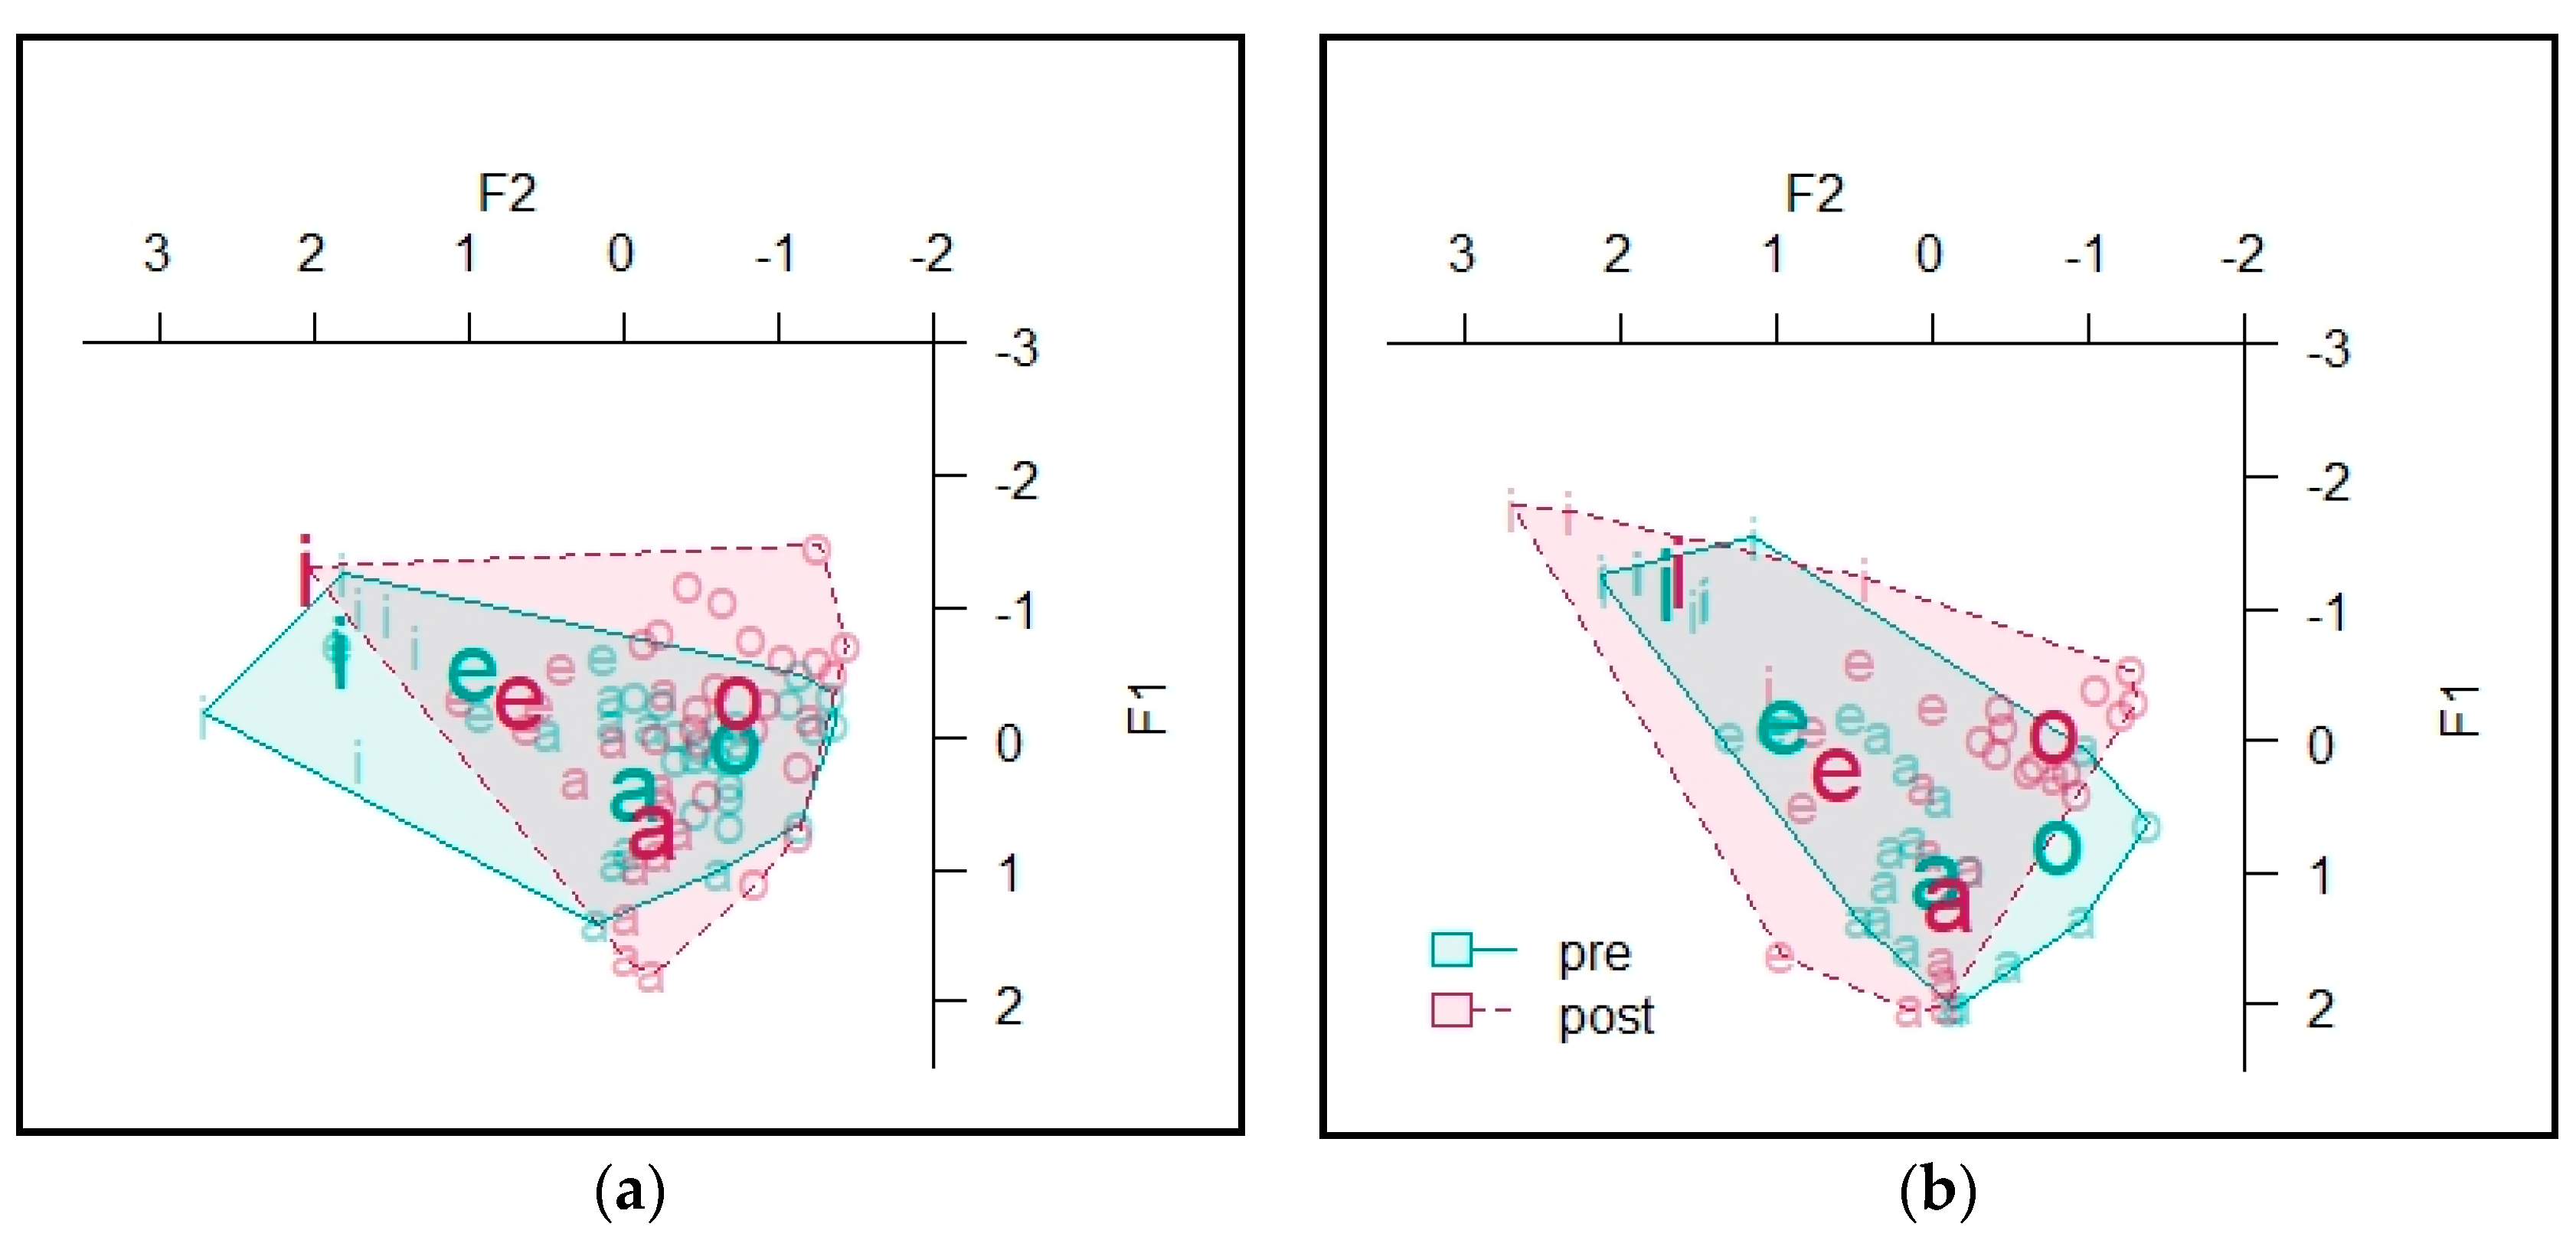
The vowel spaces for Informant B are presented in Figure 8. The area of the space for stressed vowels at the beginning of the semester was 6.70, and at the end of the semester it was 7.67. For unstressed vowels, the area of the vowel space at the beginning of the course was 7.85 and at the end of the course it was 7.33 (see Table A5 in Appendix B for token counts).
A MANOVA predicting Lobanov-normalized F1 and F2 values by TASK and STRESS as well as their interaction found a significant effect of TASK ()(Pillai’s trace = 0.064, F = 7.95, df = 2, p = 0.0005) and of the INTERACTION between TASK and STRESS (Pillai’s trace = 0.058, F = 7.09, df = 2, p = 0.001). To follow up on the interaction, we fit a separate model for the stressed vowels and a model for the unstressed vowels. The former found no effect of TASK on formant values of stressed vowels, while the latter found a significant effect of TASK on the formant values of unstressed vowels for Informant B (Piallai’s trace = 0.15, F = 12.37, df = 2, p < 0.001). Subsequent univariate tests found a significant effect of TASK for F1 (η2 =0.059, F = 8.96, df = 1, p = 0.003) and for F2 (η2 =0.043, F=6.49, df = 1, p = 0.012).
The mean and standard deviations of each individual vowel are presented in Table 4 (see Table A6 in Appendix B for token counts). T-tests found a significant difference in the F1 value of [e] (p = 0.006), and in the F1 value (p = 0.008) and F2 value (p = 0.013) of [o].

4.2.3. Informant C

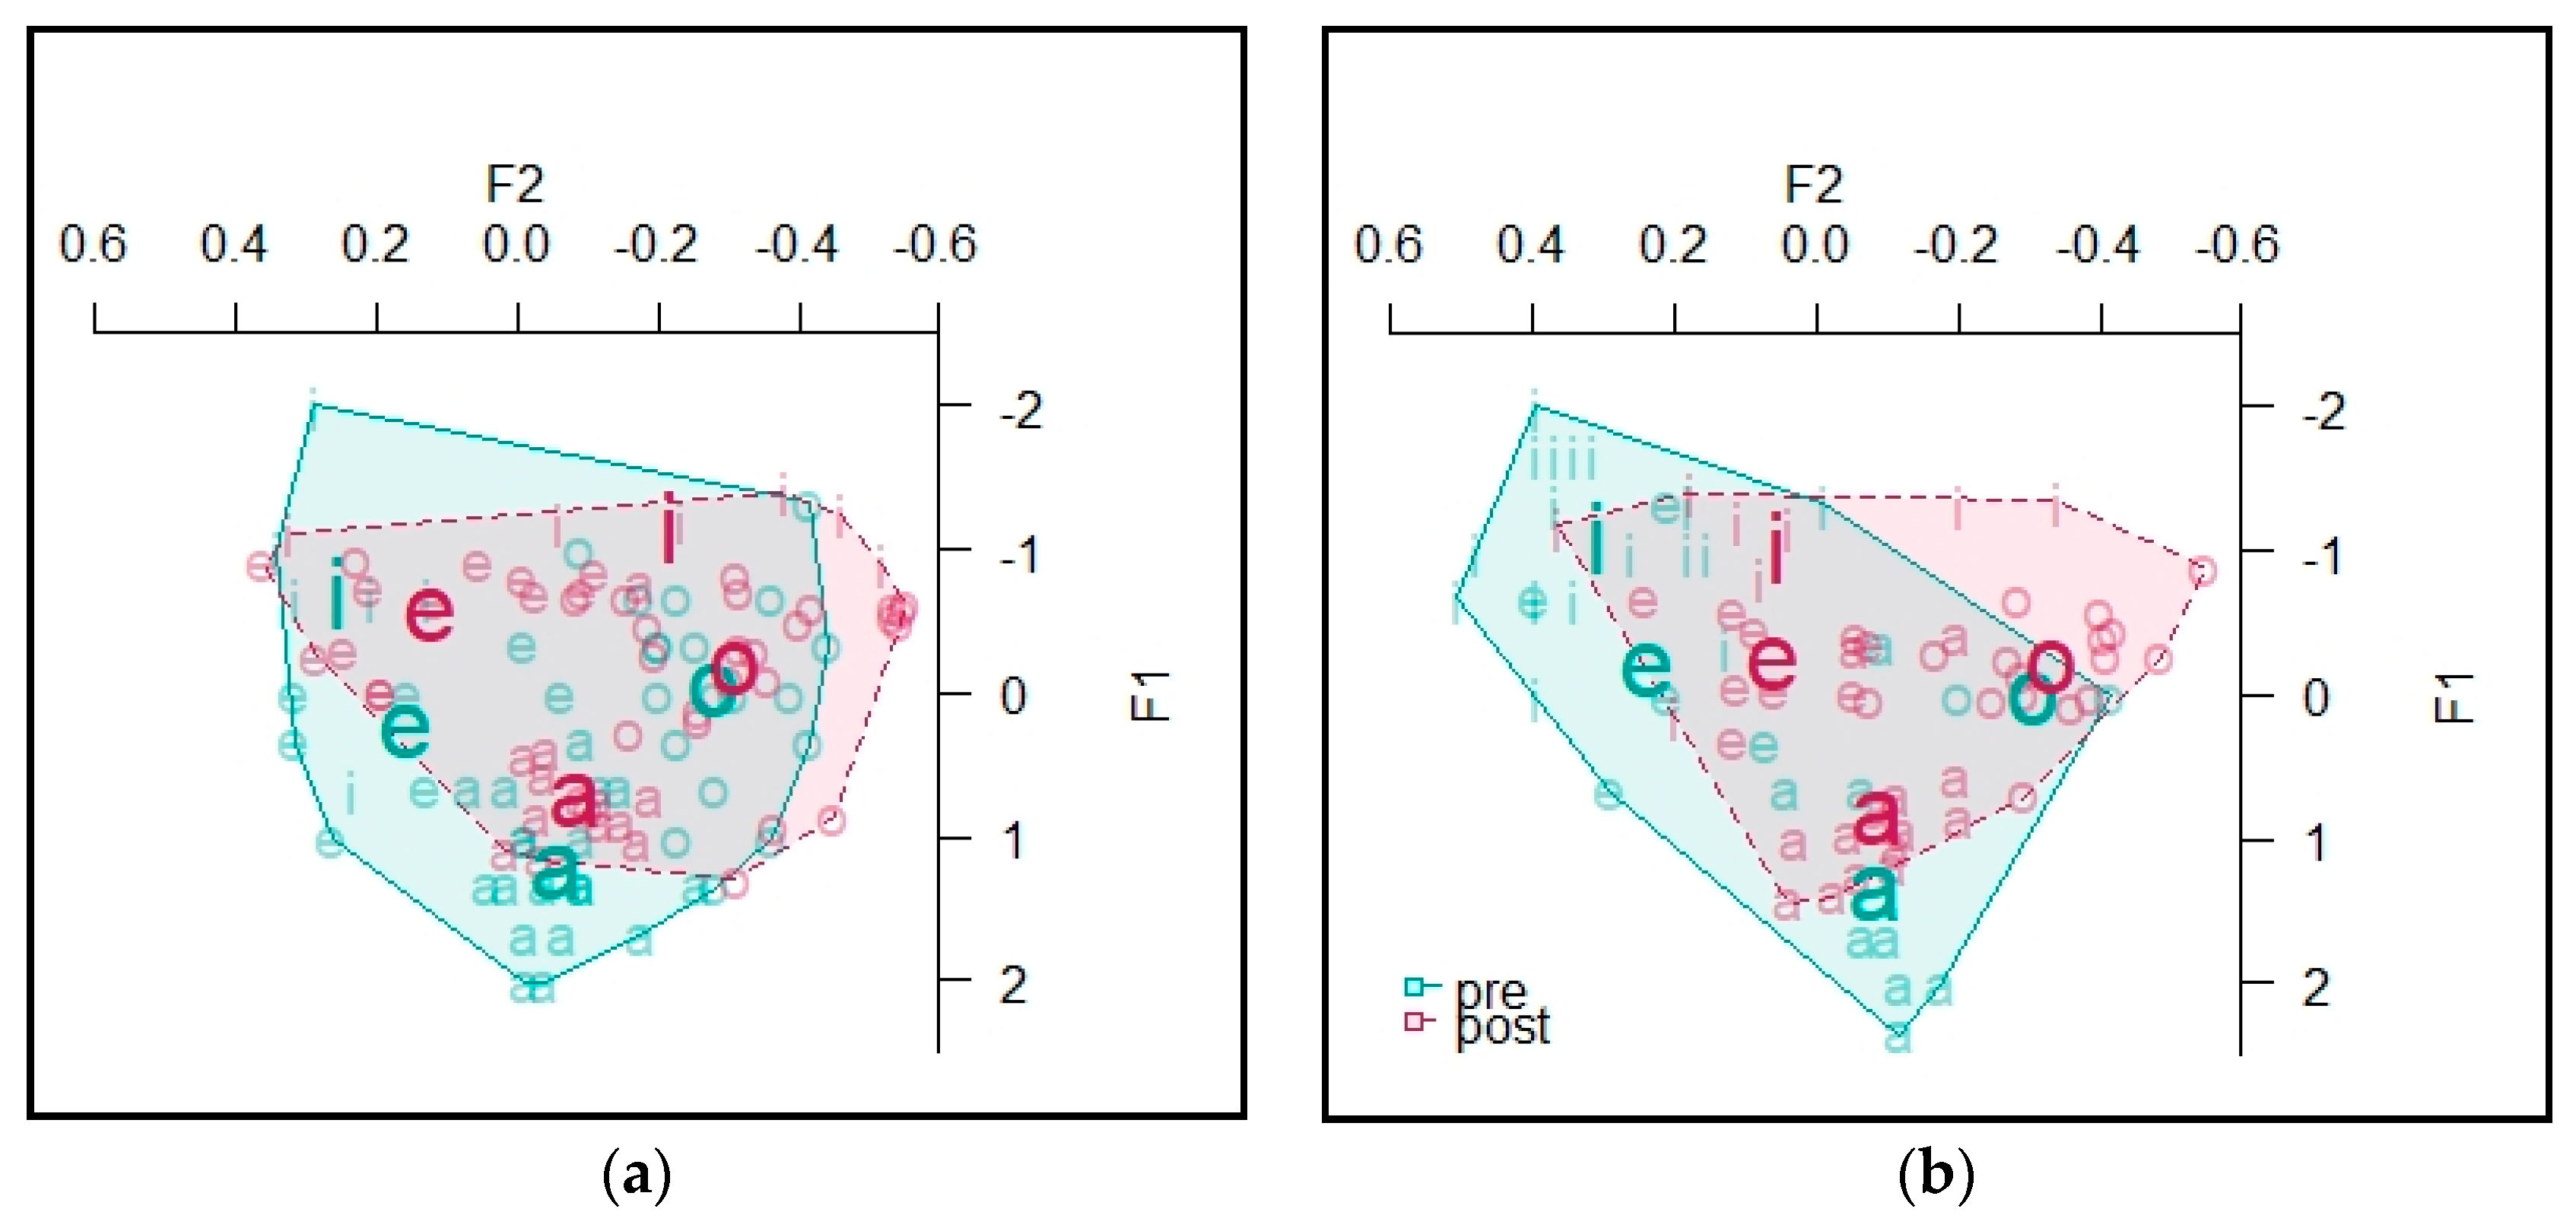
The vowel spaces for Informant C are presented in Figure 9. The area of the stressed vowel space was 9.48 at the beginning of the course and 10.13 at the end of the course. For the unstressed vowels, the area at the beginning of the course was 9.33, and at the end of the course it was 11.44 (see Table A8 in Appendix C for token counts).
A MANOVA predicting Lobanov-normalized F1 and F2 values by TASK and STRESS found a significant effect of TASK (Pillai’s trace = 0.023, F = 3.34, df = 2, p = 0.037) and STRESS (Pillai’s trace = 0.073, F = 10.99, df = 2, p < 0.001). A multivariate test that included an interaction between TASK and STRESS as a predictor did not find a significant effect of the interaction. Subsequent univariate tests found no significant effects for F1 values. There was a significant effect of TASK on F2 (η2 = 0.019, F = 6.14, df = 1, p = 0.014) and of STRESS on F2 (η2 = 0.070, F = 21.63, df = 1, p < 0.001) (see Table 5; see Table A9 in Appendix C for token counts).
T-tests for individual vowel formant values found a significant difference between measurements taken at the beginning and the end of the semester for F2 values of [a] (p < 0.001) and F2 values of [i] (p = 0.004).

4.2.4. Informant D

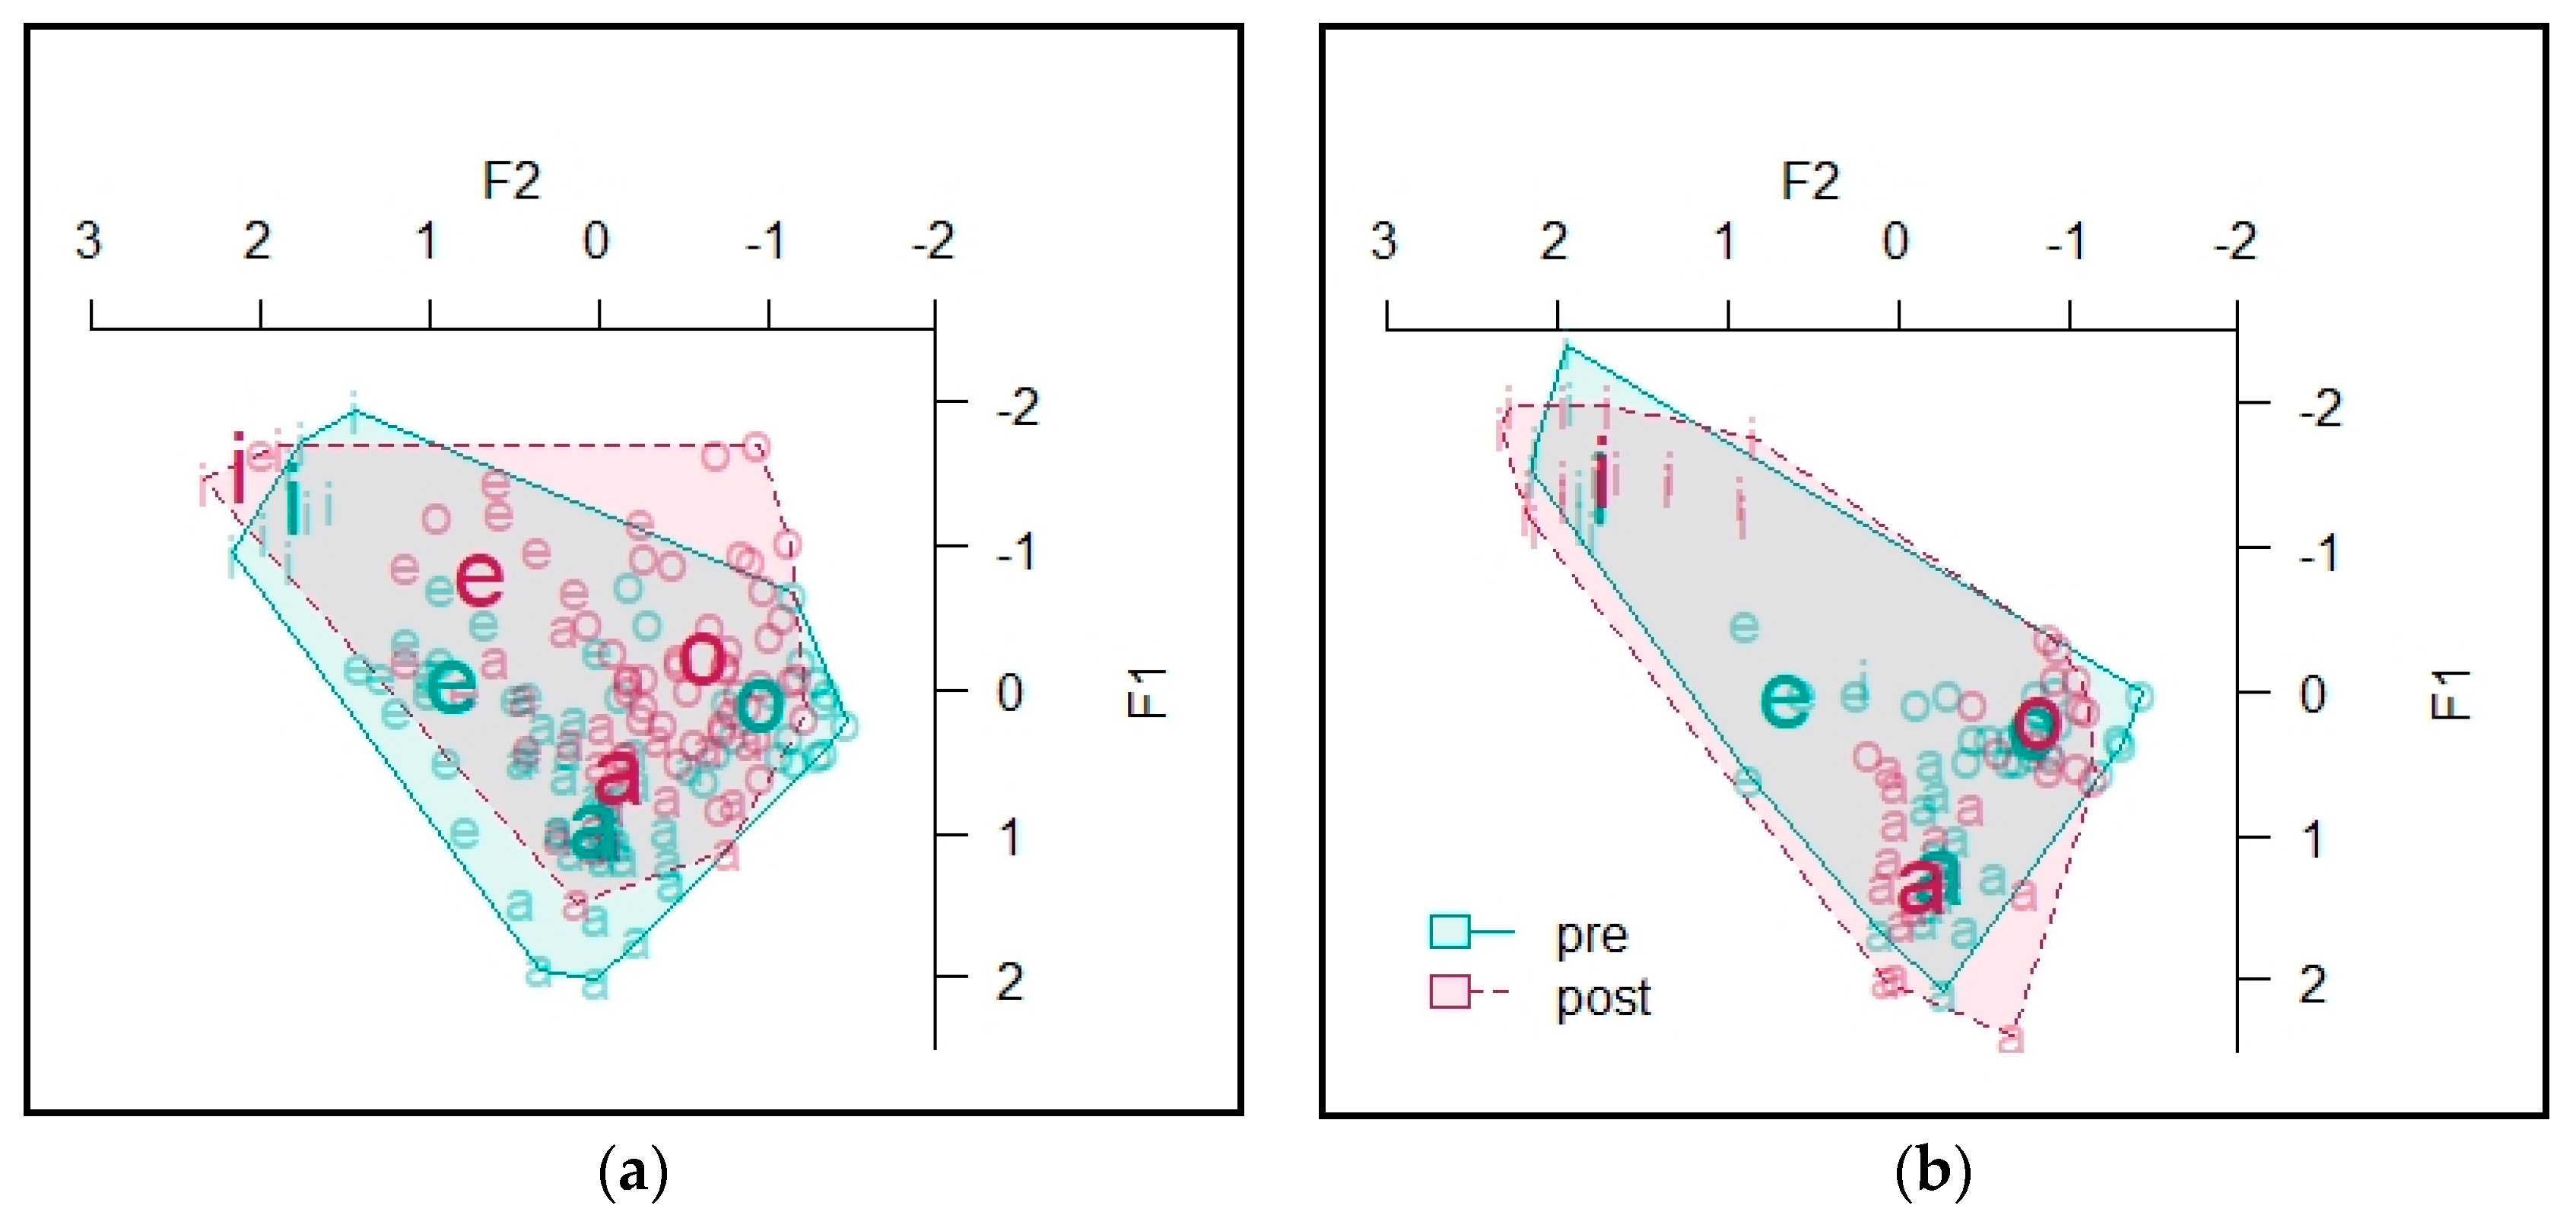
The vowel spaces for Informant D are presented in Figure 10. The area of the vowel space for vowels in unstressed syllables was 6.33 at the beginning of the semester and 6.70 at the end of the semester. The area of the vowel space for vowels in stressed syllables was 5.74 at the beginning of the semester and 7.86 at the end of the semester (see Table A11 in Appendix D for token counts).
A MANOVA predicting Lobanov-normalized F1 and F2 values by TASK and STRESS found a significant effect of TASK (Pillai’s trace = 0.082, F = 5.89, df = 2, p = 0.002) and STRESS (Pillai’s trace = 0.091, F = 6.61, df = 2, p = 0.002). A multivariate test that included the interaction of TASK and STRESS as a predictor did not find a significant effect of the interaction. Subsequent univariate tests found no effect on F1 formant values. For F2 values, the univariate tests found a significant effect of TASK (η2 = 0.067, F = 9.93, df = 1, p = 0.002) and STRESS (η2 =0.038, F = 5.62, df = 1, p = 0.019) (see Table 6; see Table A12 in Appendix D for token counts).
T-tests found no significant effects at the level of individual vowels, likely due to low statistical power when considering the tokens of each vowel separately.

4.2.5. Informant E

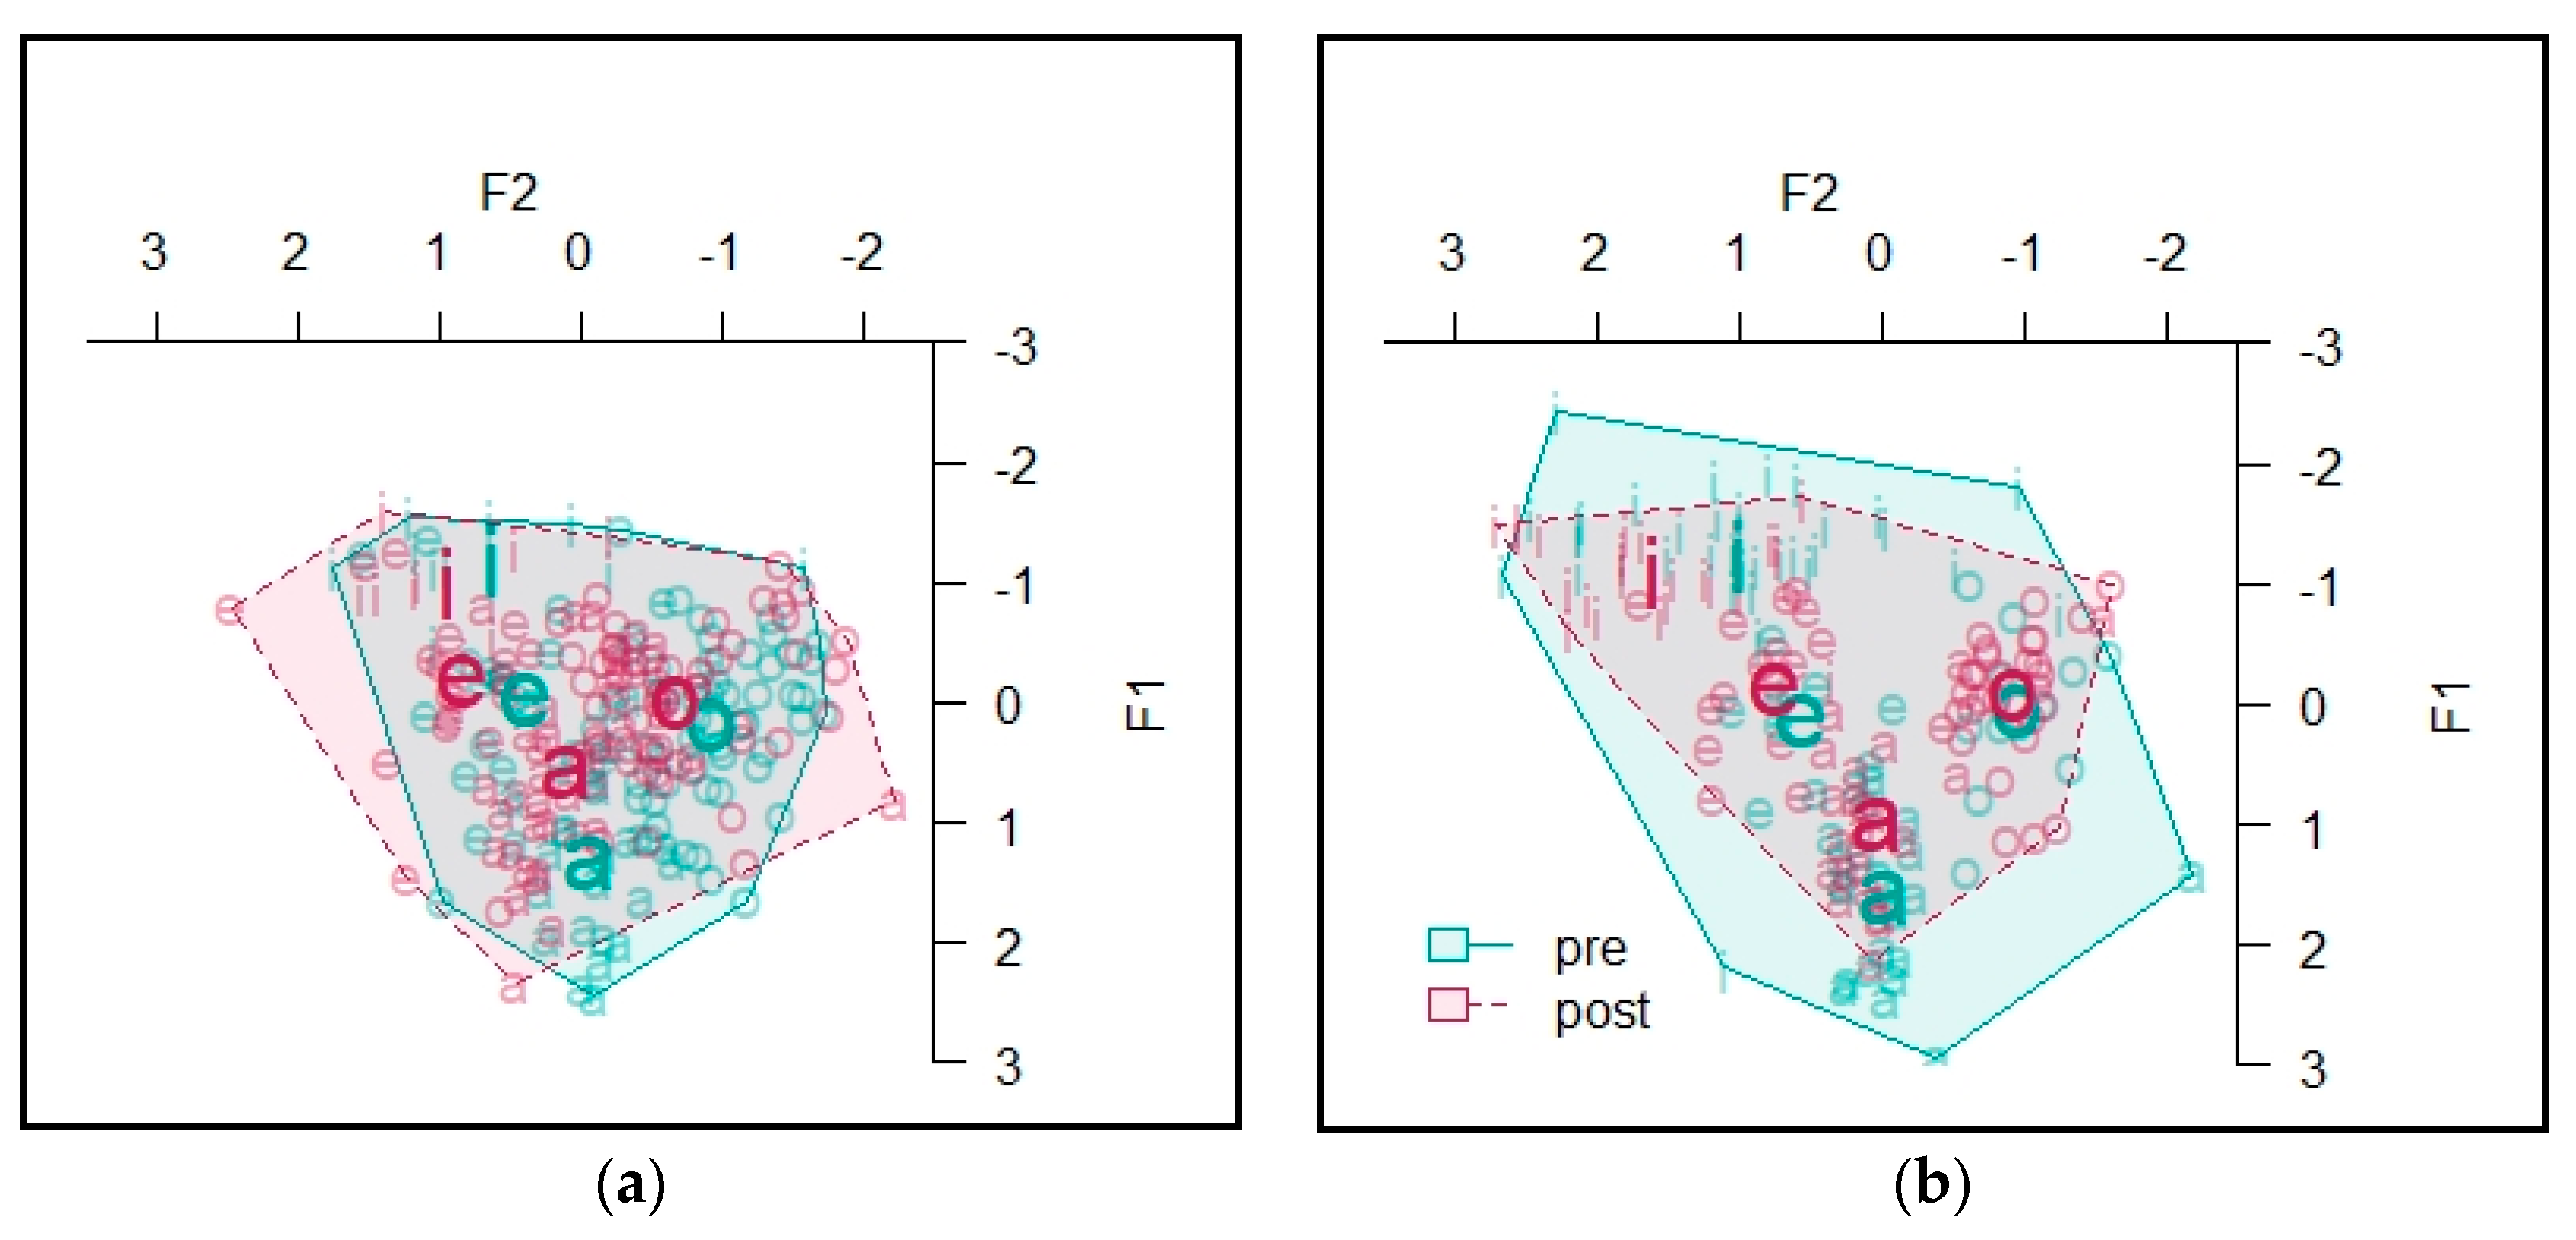
The vowel spaces for Informant E are presented in Figure 11. At the beginning of the semester, the area of the unstressed vowel space was 10.42, while at the end of the semester it was 11.69. For vowels in stressed syllables, the vowel space at the beginning had an area of 16.59, and at the end of the semester it had an area of 9.64 (see Table A14 in Appendix E for token counts).
A MANOVA predicting Lobanov-normalized F1 and F2 values by TASK and STRESS found a significant effect of STRESS (Pillai’s trace = 0.070, F = 17.16, df = 2, p < 0.001) but no significant effect of TASK. Univariate tests indicated a significant effect of STRESS on F1 (η2 = 0.018, F = 6.07, df = 1, p = 0.014) and on F2 (η2 = 0.074, F = 30.45, df = 1, p < 0.001) (see Table 7; see Table A15 in Appendix E for token counts).
For individual vowels, t-tests revealed significant differences between measures taken at the beginning and at the end of the semester for F1 values of [a] (p < 0.001), F2 values of [e] (p = 0.012), F2 values of [i] (p = 0.004) and F2 values of [o] (p = 0.017). There was also a trending effect for F1 values of [o], but it did not reach significance.

4.3. Speech Rate

We begin our coverage of discourse-level factors with an overview of the results for speech rate, measured in syllables per second within the ip domain (see Section 3.3). Recall from Section 2.3 that this variable, along with the pitch-related variables discussed in the two subsequent sections, were identified as playing roles in helping guide narrative structure.
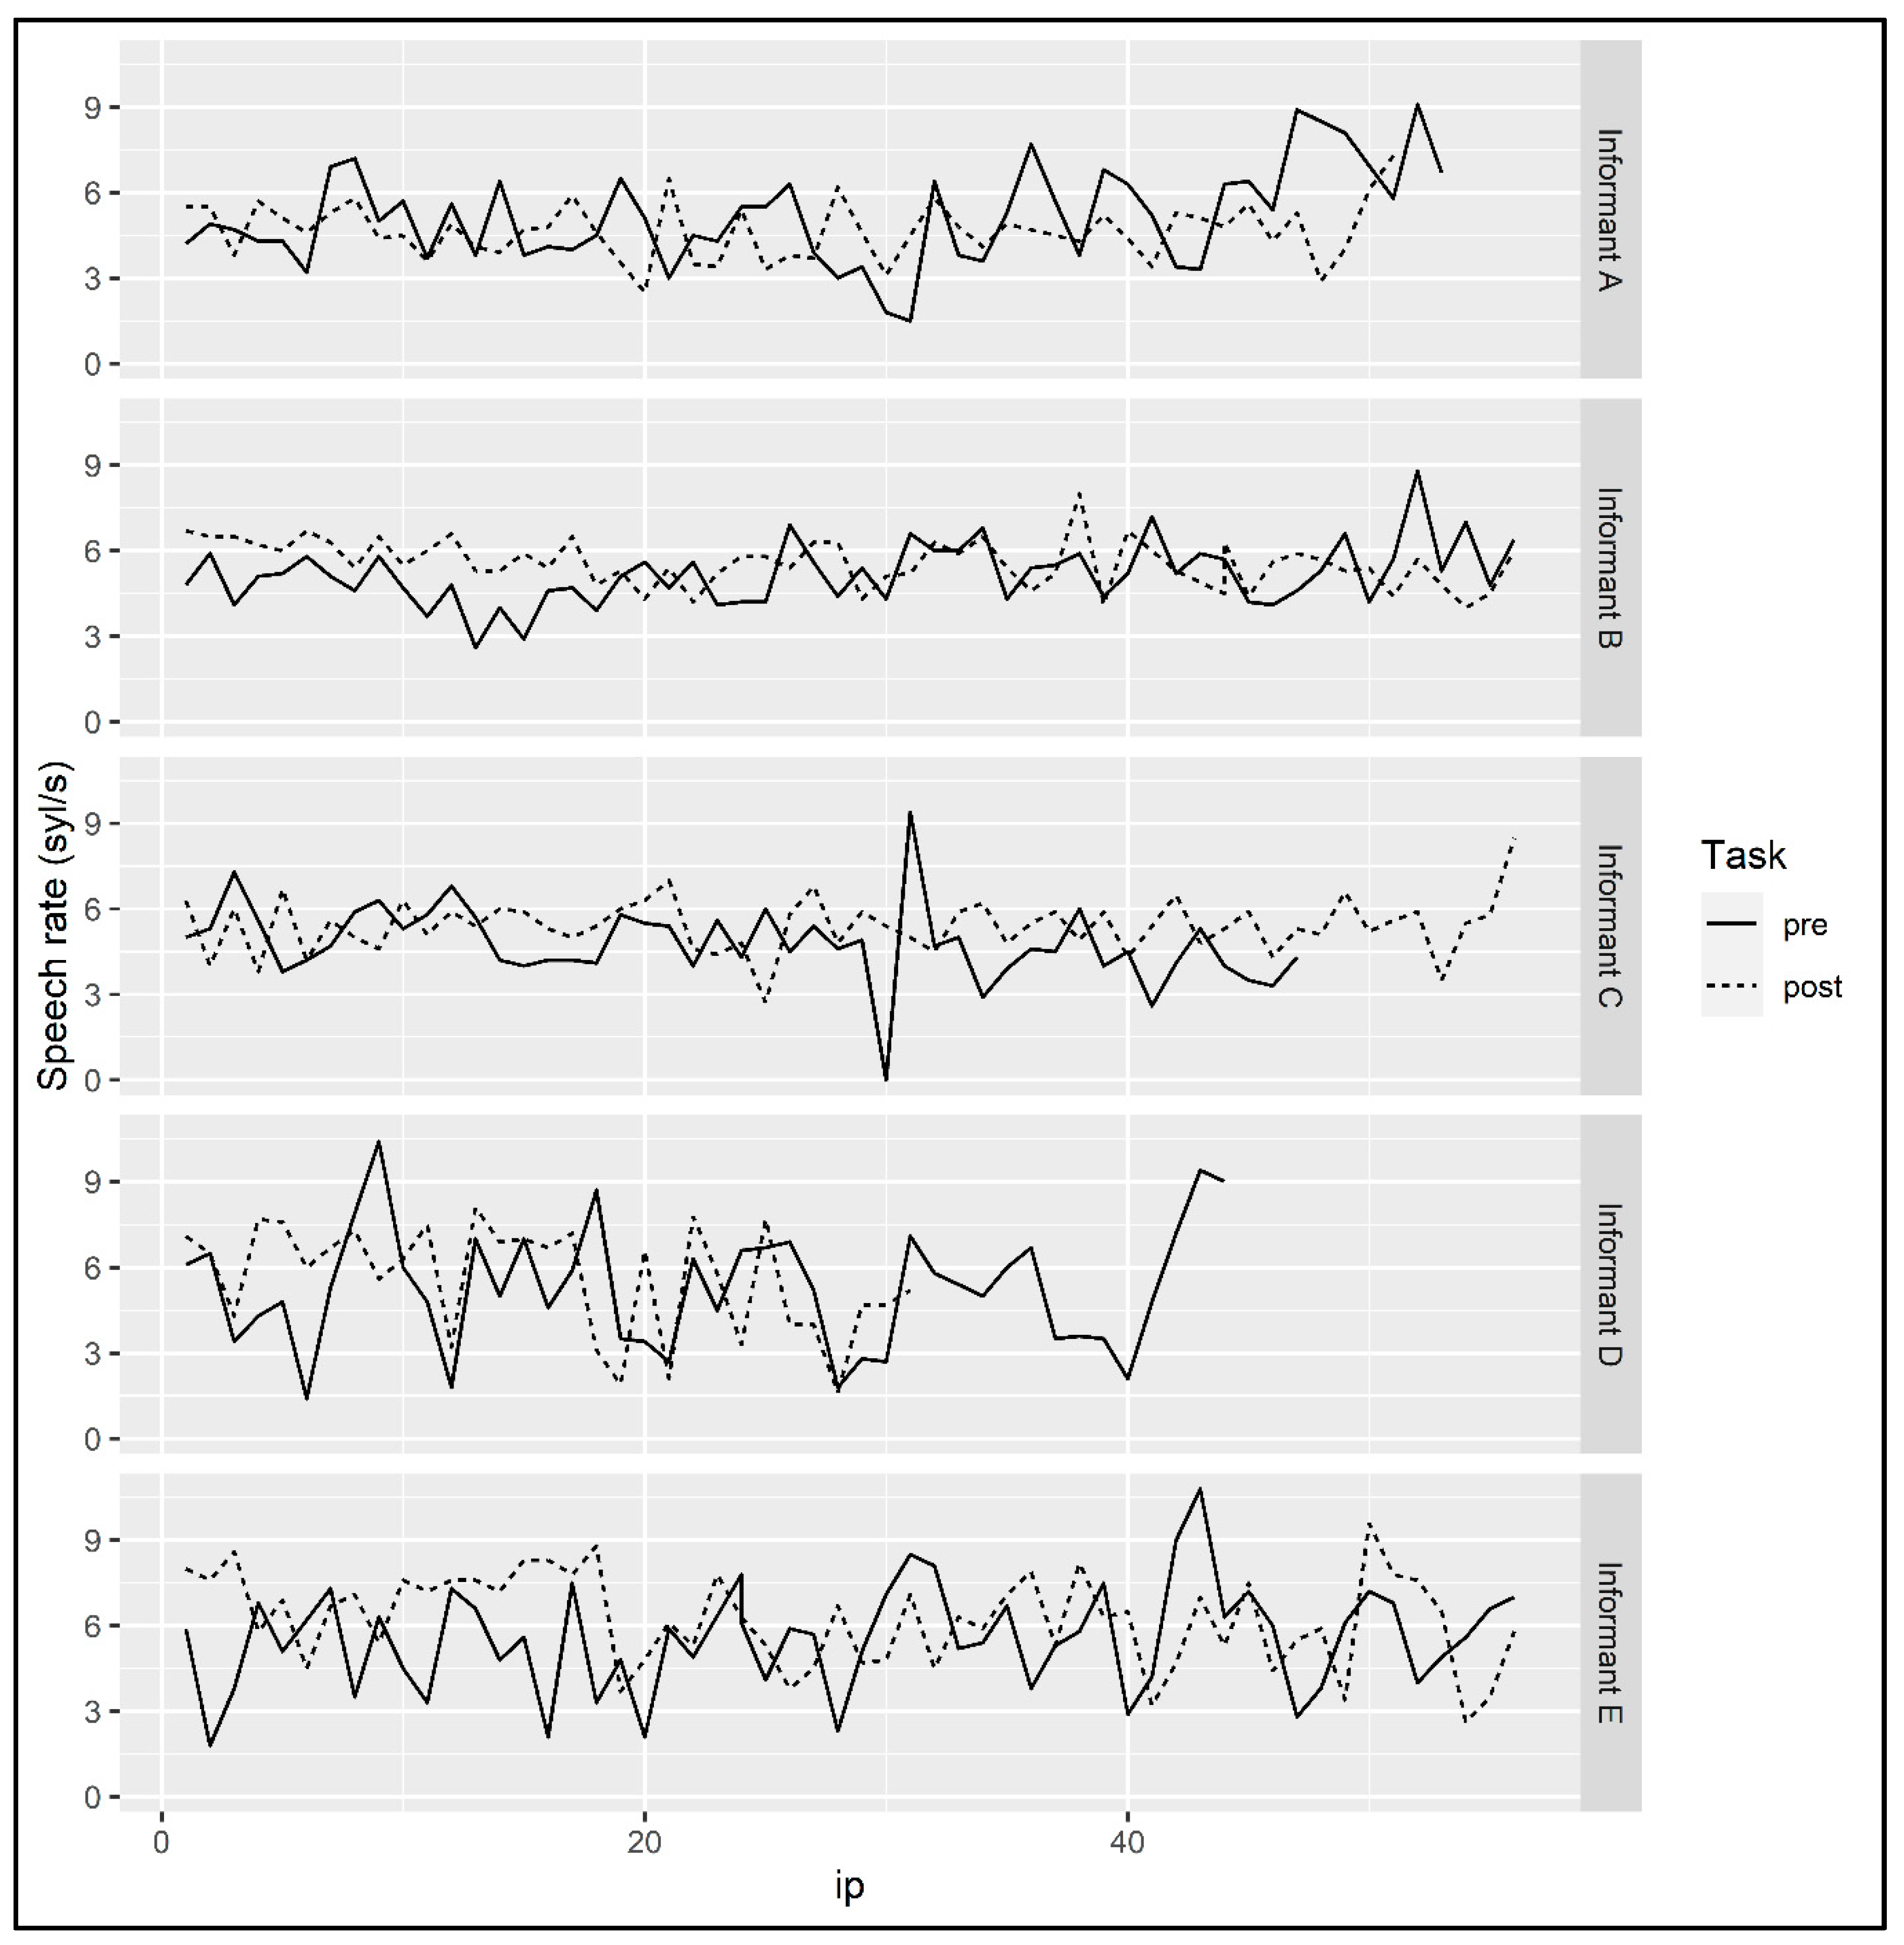
For measurements of speech rate for Informant A, a linear model predicting SPEECH RATE by TASK and PHRASE as well as their interaction was fit to the speech rate data for Informant A (see Figure 12). PHRASE was a continuous variable that encoded the sequential order of the ip within the informant’s narrative; it was included in the analysis because, per studies cited in Section 2.3, speech rate may change over the course of the narration depending on speech style. TASK was a binary variable coded as before. The model found a significant effect of PHRASE (β = 0.035, SE = 0.012, p = 0.006) that indicated that the informant’s speech rate increased over the course of the narrative. The model also found a trending effect of the interaction of TASK and PHRASE, but it did not reach significance (p = 0.069). The model did not find a significant effect of TASK.
For Informant B, a linear model predicting SPEECH RATE by TASK and PHRASE found a significant effect of TASK (β = 1.65, SE = 0.35, p < 0.001), indicating that there was a significant difference in Informant B’s speech rate at the beginning and the end of the semester. The model also found a significant effect of PHRASE (β = 0.025, SE = 0.0075, p = 0.0013), and a significant effect of the interaction of TASK and PHRASE (β = −.043, SE = 0.011, p < 0.001). To follow up on the interaction effect, a linear model was fit to the data at the beginning of the course, predicting SPEECH RATE by PHRASE. The model found a significant effect of PHRASE (β = 0.025, SE = 0.0085, p = 0.0049), indicating that at the beginning of the semester the informant’s speech rate increased over the course of the narrative. A similar model fit to the data at the end of the semester found a significant effect of PHRASE (β = −0.018, SE = 0.0064, p = 0.007), suggesting that at the end of the semester the informant’s speech rate decreased over the course of the narrative (see Figure 12).
A linear model predicting SPEECH RATE by TASK and PHRASE as well as their interaction was fit to the data for Informant C. The model did not find a significant main effect of TASK but did find a significant interaction between TASK and PHRASE (β = 0.039, SE = 0.015, p = 0.013) and a significant main effect of PHRASE (β = –0.033, SE = 0.012, p = 0.0078) (see Figure 12). To follow up on the interaction effect, we fit a model predicting SPEECH RATE by PHRASE to the data from the beginning of the semester and found a significant effect of PHRASE (β = –0.033, SE = 0.014, p = 0.023), suggesting that at the beginning of the course the informant’s speech rate decreased over the course of the narrative. A similar model fit to the data at the end of the semester did not find a significant effect of PHRASE, indicating that we had no evidence to suggest that speech rate changed over the course of the narrative recorded at the end of the semester.
A linear model predicting SPEECH RATE by TASK, PHRASE, and their interaction fit to data for Informant D found a significant main effect of TASK (β = 1.96, SE = 0.96, p = 0.44) and of the interaction of TASK and PHRASE (β = −0.099, SE = 0.47, p = 0.035) (see Figure 12). This suggests that, overall, the informant’s speech rate was faster at the end of the semester than at the beginning of the semester. To follow up on the interaction effect, we fit a model predicting SPEECH RATE by PHRASE just to the data at the beginning of the semester. This model found no significant effect of PHRASE. A similar model fit to the data at the end of the semester did find a significant effect of PHRASE (β = −0.094, SE = 0.035, p = 0.013), suggesting that at the end of the semester the informant’s speech rate decreased over the course of the narrative.
A linear model fit to the data predicting SPEECH RATE by TASK and PHRASE found a significant effect of TASK (β = 2.22, SE = 0.65, p < 0.001) and the interaction of TASK and PHRASE (β = −0.05, SE = 0.019, p = 0.008), and a trending effect of PHRASE that did not reach significance (β = 0.024, SE = 0.014, p = 0.092) (see Figure 12). This suggests that, overall, the informant’s speech rate was higher at the end of the semester than at the beginning of the semester. To follow up on the interaction effect, we fit separate models to the data at the beginning and at the end of the semester predicting SPEECH RATE by PHRASE. The models found no significant effect of PHRASE for the data at the beginning of the semester but did find an effect of PHRASE for the narrative at the end of the semester (β = −0.030, SE = 0.013, p = 0.025), suggesting that at the end of the semester the informant’s speech rate decreased over the course of the narrative.

4.4. Mean Pitch

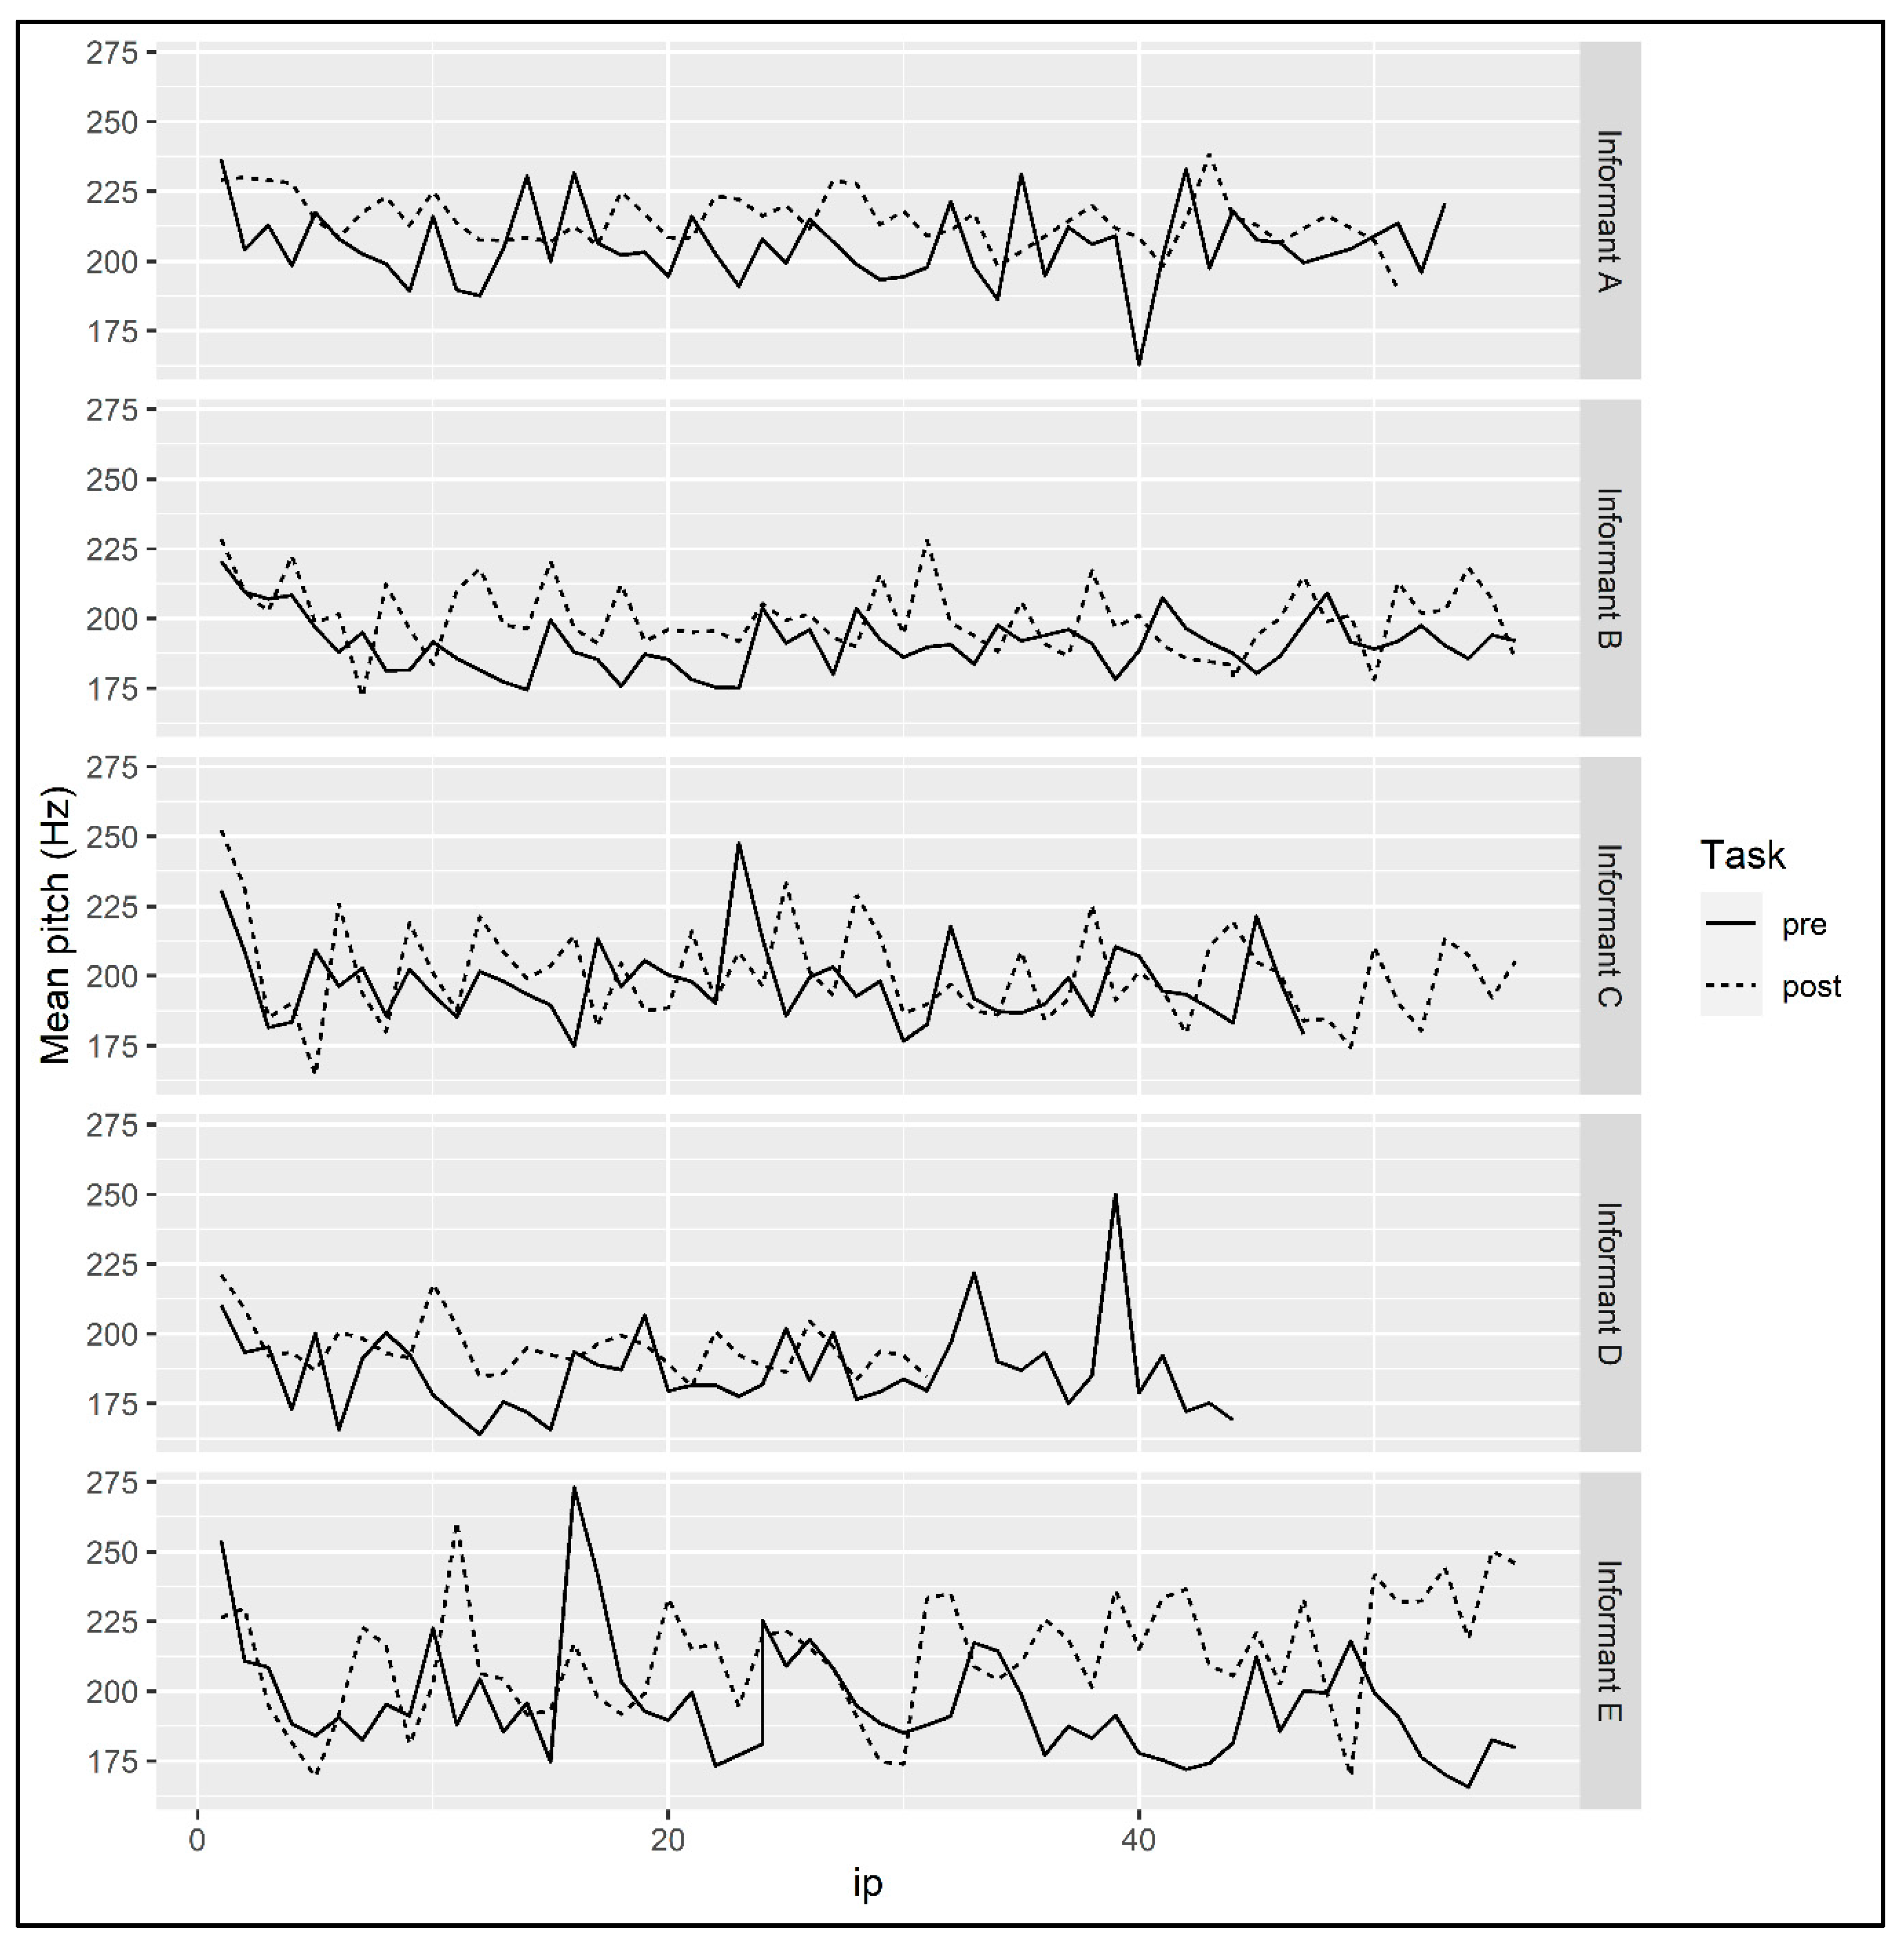
A linear model predicting MEAN PITCH by TASK and PHRASE was fit to the mean pitch data for Informant A (see Figure 13). PHRASE was included in the analysis because, per studies cited in Section 2.3, mean pitch may change over the course of the narration depending on speech style. The model found a significant effect of TASK (β = 9.21, SE = 2.34, p < 0.001), indicating that the informant’s mean pitch was higher overall at the end of the semester. A model that included the interaction of TASK and PHRASE as a predictor did not find a significant effect of the interaction.
A linear model predicting MEAN PITCH by TASK and PHRASE was fit to the mean pitch data for Informant B. The model found a significant effect of TASK (β = 9.09, SE = 2.12, p < 0.001), suggesting that the informant’s mean pitch was higher overall in the narrative recorded at the end of the semester (see Figure 13). A model that included the interaction of TASK and PHRASE did not find a significant effect of the interaction.
A linear model predicting MEAN PITCH by TASK and PHRASE was fit to the mean pitch data for Informant C (see Figure 13). The model did not find any significant effects.
A linear model predicting MEAN PITCH by TASK and PHRASE was fit to the mean pitch data for Informant D. The model found a significant effect of TASK (β = 7.65, SE = 3.33, p = 0.025), indicating that the informant’s mean pitch was higher in the narrative recorded at the end of the semester than at the beginning of the semester (see Figure 13). A model with an additional predictor for the interaction of TASK and PHRASE did not find a significant effect of the interaction.
A linear model predicting MEAN PITCH by TASK and PHRASE as well as their interaction was fit to the mean pitch data for Informant E. The model found a significant effect of PHRASE (β = −0.44, SE = 0.16, p = 0.007) and of the interaction of TASK and PHRASE (β = 0.92, SE = 0.23, p < 0.001). To follow up on the interaction effect, we fit separate models to the data from the beginning of the semester and the end of the semester predicting MEAN PITCH by PHRASE. The model fit to data from the beginning of the semester found a significant of effect of PHRASE (β = −0.44, SE = 0.16, p = 0.0076) that suggested the informant’s mean pitch decreased over the course of the narrative recorded then. The model fit to data from the end of the semester also found a significant effect of PHRASE (β = 0.47, SE = 0.16, p = 0.006) that suggested that at the end of the semester the informant’s mean pitch increased over the course of the narrative (see Figure 13).

4.5. Pitch range

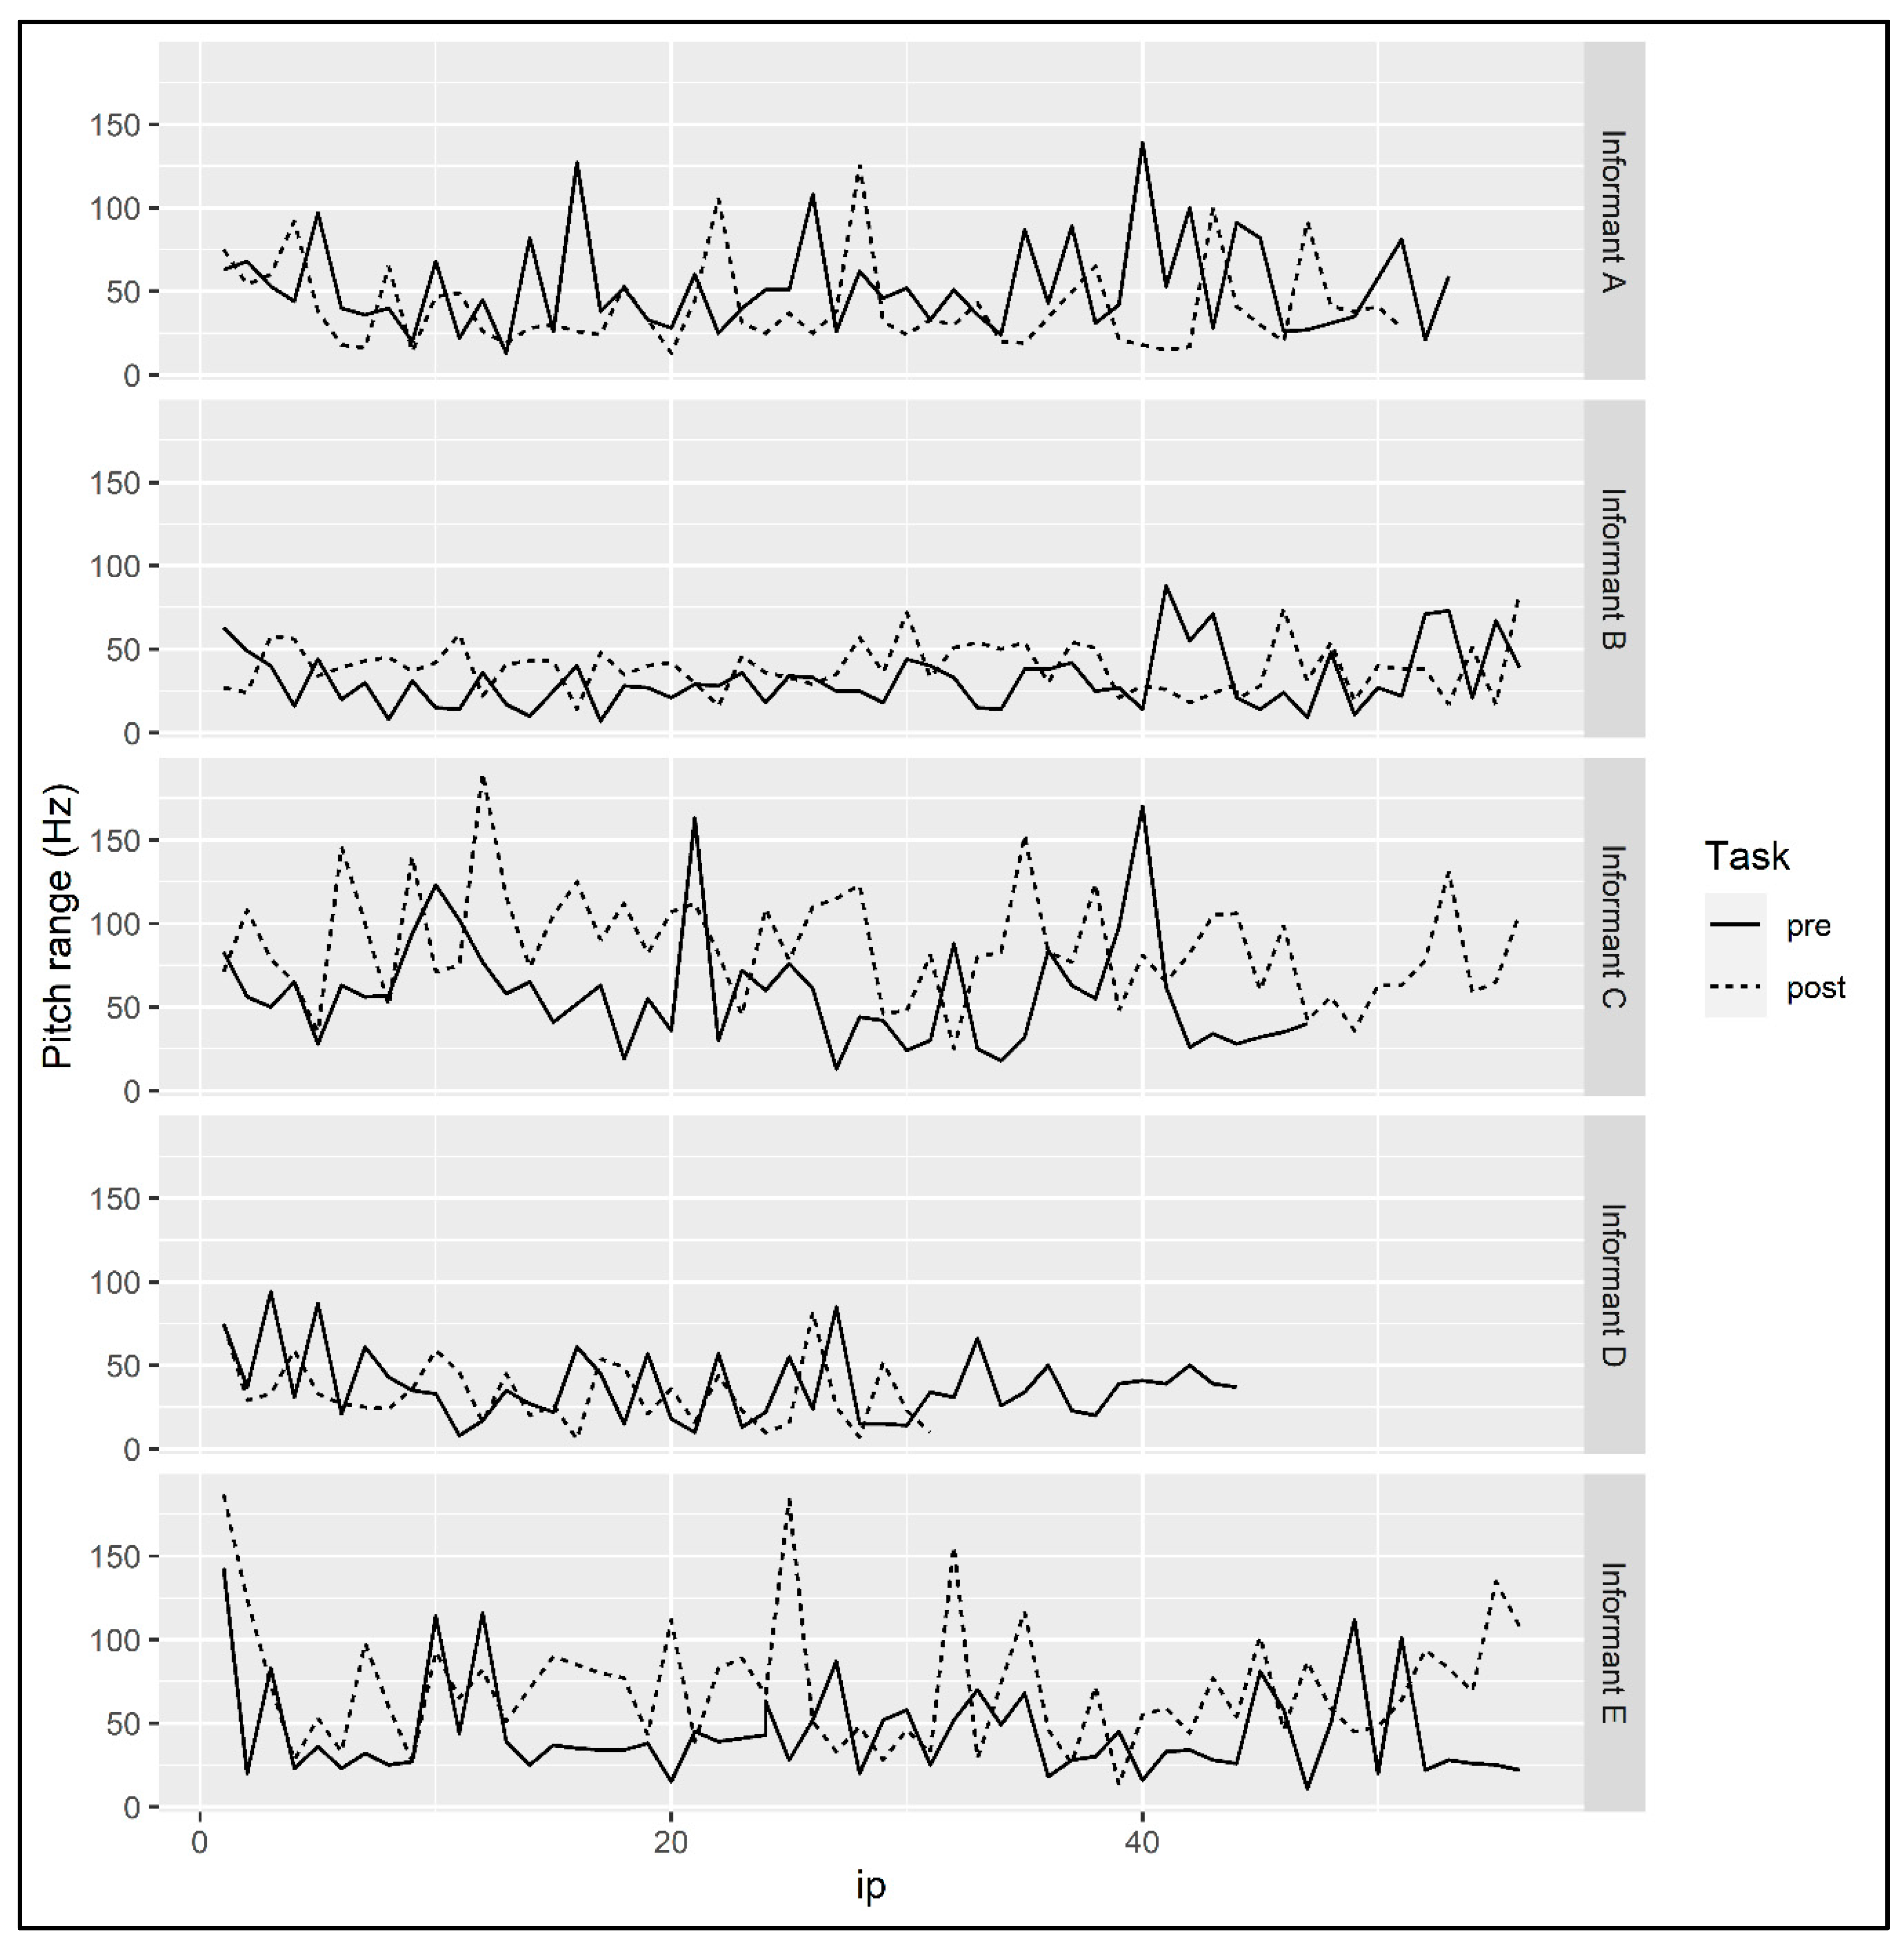
A linear model predicting PITCH RANGE by TASK and PHRASE was fit to the pitch range data for Informant A (see Figure 14). TASK and PHRASE were coded as described above. PHRASE was included in the analysis because, per studies cited in Section 2.3, pitch range may change over the course of the narration depending on speech style. The model found a significant effect of TASK (β = −12.23, SE = 5.56, p = 0.03), indicating that the informant’s pitch range was smaller overall in the narrative recorded at the end of the semester. A model with an additional predictor for the interaction of TASK and PHRASE did not find a significant interaction effect.
A linear model predicting PITCH RANGE by TASK and PHRASE was fit to the pitch range data for Informant B. The model found a significant effect of TASK (β = 7.49, SE = 3.16, p = 0.02), indicating that the informant’s pitch range was larger in the narrative recorded at the end of the semester (see Figure 14). A model with the interaction of TASK and PHRASE as an additional predictor did not find a significant effect of interaction.
A linear model predicting PITCH RANGE by TASK and PHRASE was fit to the pitch range data for Informant C. The model found a significant effect of TASK (β = 30.29, SE = 6.53, p < 0.001), indicating that the informant’s pitch range was larger overall in the narrative recorded at the end of the semester (see Figure 14). The model also found a significant effect of PHRASE (β=-0.43, SE = 0.21, p = 0.044), which suggests that the informant’s pitch range decreased over the course of the narrative. A model that included the interaction of TASK and PHRASE as a predictor did not find a significant effect of the interaction.
A linear model predicting PITCH RANGE by TASK and PHRASE was fit to the pitch range data for Informant D (see Figure 14). The model did not find any significant effects. There was a trending effect of PHRASE, but it did not reach significance (β = −0.38, SE = 0.21, p = 0.072).
A linear model predicting PITCH RANGE by TASK and PHRASE was fit to the pitch range data for Informant E. The model found a significant effect of TASK (β = 26.53, SE = 6.28, p < 0.001). This suggested that the informant’s pitch range was larger overall in the narrative recorded at the end of the semester than at the beginning of the semester (see Figure 14). A model that included an interaction between TASK and PHRASE as a predictor did not find a significant effect of the interaction.

5. Discussion and Conclusions

Recall the observation by Kupisch and Rothman (2018) that we presented at the outset: educational experiences may influence the sound system of HSs despite the lack of explicit instruction on this topic (which is probably due to the distinct type of input such experiences involve). Kupisch and Rothman drew their data from K–12 HL instruction, and our findings corroborate their claims for university-level HSs. Table 8 shows the significant effects we found when comparing pre- and post-semester data for each informant. Of the six broad categories of sound features, all informants exhibited between three and five significant effects between our two data points. Thus, just one semester of domestic exposure to different, somewhat more formal input induced a number of significant changes in the Spanish of heritage (re-)learners. A welcome conclusion is that language experience in an instructed setting has a positive effect on HSs’ production, and moreover, the resulting changes can be measured in a number of objective ways.
Across the effects summarized in Table 8, we observed considerable variation; however, given the general heterogeneity in the background and linguistic experiences of HSs, this is actually what previous literature dealing with the phonetics and phonology of HSs would predict (for comments on “accent” as it relates to HSs, see, for example, Benmamoun et al. 2013; Polinsky and Kagan 2007; Rao and Kuder 2016). We will use the remainder of this section to delve into some potential ways of accounting for the variation exhibited in our acoustic and statistical analysis.
The significant changes in the Spanish of our HSs presented a relevant point of comparison to George and Hoffman-González’s findings (2019), who considered HSs of Spanish studying abroad and coming in contact with new varieties of Spanish; they included the adoption of regional dialectal sound features in their case studies. Our data suggest that sound change in an HL can occur without full immersion for several months, but rather with just some degree of consistent increased exposure to a distinct use of language over a matter of a few months; in our case, this distinct use was a formal register associated with an academic experience and spoken by an adult-immigrant, Spanish-dominant instructor whose native dialect is Mexico City Spanish.
Concerning the segmental data, for the voiceless stop consonants /p, t, k/, our five speakers were, for the most part, already producing VOT values within the range expected for Spanish unaspirated allophones at the start of the semester; however, exposure to the instructor and other forms of authentic input presented across the weeks of class seem to have made them slightly more sensitive to the lack of aspiration in Spanish, resulting in further significant reductions to VOT in three of our informants (B, D, E). The increased VOT of Informant A in the post-semester task was curious and unexpected. Based on Amengual (2012), we looked at the increased use of cognates as a possible explanation for this finding, but to no avail. Next, following the discussion in Yao (2009), we also fleshed out frequent from infrequent words in this informant’s narratives, but this attempt also failed to yield revealing outcomes. Yao (2009) also brought up speech rate effects on VOT, but its effect on Informant A’s data was unlikely because she was the only one whose pre- versus post-speech rate comparison did not reach significance. Therefore, the answer to this puzzling result for Informant A could lie in the other variables covered in Yao’s (2009) examination of VOT in more spontaneous speech styles that were outside of the scope of the current study (e.g., word class, utterance position). Furthermore, regarding the voiced stops /b, d, ɡ/, the situation is similar in that our speakers demonstrated evidence (in the form of low relative intensity values) of approximant intervocalic realizations right from the start of the semester, with the results of one informant (E) implying heightened awareness of the weakening process in question over the course of the semester. Interestingly, the informant with the highest relative intensity values (C), indicating the most occlusion, was the only simultaneous bilingual of the five informants. This supports Amengual’s (2019) study on /b, d, ɡ/, where sequential bilinguals weakened these consonants intervocalically more than simultaneous bilinguals. As such, we provide some additional support for the importance of when languages were introduced to bilinguals during their childhood when considering adult bilingual phonology.
Taken together, our stop consonant data suggest that despite being English-dominant, our informants showed the ability to distinguish the stop phonetic categories of their two languages right from their first narrative. According to the Speech Learning Model (Flege 1992, 1995), such success in category separation could be attributed to their being early learners of Spanish; early learners typically show a lower degree of interaction between their two sound systems. Being early learners also meant that our informants had a malleable Spanish sound system as children that permitted the addition rather than assimilation of categories when L1 and L2 sounds were similar. Framed within the context of phonological rules and constraints, our data suggest that our informants did not apply an aspiration rule to voiceless stops in word-initial position and that they did apply a rule of lenition to intervocalic voiced stops, accounted for by spreading a [+cont] feature from an adjacent vowel (Mascaró 1984). With regard to voiced stops, our phonetic results imply that phonologically, our informants arranged their Spanish grammar to support the marked allophones, as is common in most Spanish varieties (see Lleó and Rakow 2005).
Despite the discussion of stop consonants we have put forth, our relatively small sample did not allow us to examine other linguistic factors with attested effects on VOT in voiceless stops, such as syllable stress, number of syllables in words, and following vowels, among others (Lisker and Abramson 1967; Rosner et al. 2000; Theodore et al. 2009; Yao 2009; Yu et al. 2015). Likewise, we could not evaluate the weakening of voiced stops through the lens of factors such as syllable stress and position relative to a word boundary (Carrasco et al. 2012; Colantoni and Marinescu 2010; Eddington 2011). Additionally, while voiced stop phones are common in both Spanish and English, their VOT values demonstrate differences; in Spanish, voicing begins before the release burst (i.e., negative VOT), while in English they are produced with a short lag, meaning there is overlap between the VOT categories of Spanish /p, t, k/ and English /b, d, ɡ/ (Hualde 2005; Lisker and Abramson 1964, 1967). We hope that future related work will address these linguistic variables.
For vowel space changes in particular, one useful variable to consider in the interpretation of our results is speech style. Previous work on both monolingual and bilingual Spanish has found that more spontaneous speech styles tend to show a contracted vowel space when compared to controlled styles (e.g., Alvord and Rogers 2014; Hermegnies and Poch-Olivé 1992; Ronquest 2016). This can help explain the status of Informant A, whose overall vowel results (i.e., stressed and unstressed) suggest that her space shrank over the course of the semester. This can be interpreted as the post-semester narration being produced in a way that more closely resembled spontaneous speech, thus reflecting her increased comfort and confidence with her HL. This explanation is further supported by A’s unique pitch range results, which will be discussed shortly. An alternative explanation we can offer, related to the post-semester compression of Informant A’s vowel space in general, as well as of Informants B and E’s unstressed spaces, is that all of their post-semester samples showed several cognates with English (e.g. carrito, cómico, condimentos, final, hipopótamo, supermercado). According to Ready (2020), cognate articulation can contribute to centralization of the vowel spaces of both Spanish HSs and late-bilinguals. Presumably, such a cognate effect could have been present in the speech of the instructor of the course, as well (see also Solon et al. 2019 for vowel similarities between heritage speakers and first-generation immigrant speakers in the USA). On the other hand, in the vowel data not discussed to this point, we observed an expansion of vowel spaces at the end of the semester. A possible explanation of this, which can be linked to the discussion of pitch to follow, is that the informants who did this associated the second iteration of the task with more formality that ended up patterning with controlled speech, given that they had completed a full semester in a classroom environment with their HL, which they distinguished from their informal, relaxed use of the language in their home and community (see Shea’s 2019 comments on the effects of context of language use on Spanish HSs’ vowels). All these explanations are viable and may in fact apply differentially in individual cases. As mentioned at the beginning of the section, individual variation in data from HS was expected, and the absence of clear patterns in our vowel data was a testament to this point.
In order to elaborate on the discussion of our segmental features of interest, future work on phonetics and phonology conducted in similar settings should strive to incorporate larger data sets from the HL, as well as comparable data sets from the dominant language. It would be useful to collect comparable data from the instructors of HL courses. For example, for vowels, is it possible that some significant F1 and F2 movements for each informant across time were in the direction of how the instructor produced her vowels?7 In order to answer this question, it would not be prudent to simply use Mexico City Spanish F1 and F2 averages and make comparisons, since the instructor of this course had lived in the US for almost two decades at the time of the course, and was a Spanish–English bilingual whose phonologies continually interacted, just like in HSs. Due to her linguistic experiences in the US, it is highly likely that her formant values and vowel space would differ from trends cited in the literature on Mexico City Spanish (see Solon et al. 2019 for relevant observations). The types of additional data sources we have mentioned would facilitate the ability to delve deeper into reasons behind individual vowel movement, as well as issues such as whether or not the commonly cited /u/-fronting is present and where or not it moves back in the vowel space across time. Our informants did not produce enough tokens of /u/ to merit its analysis. In sum, while it is attested that the malleability of HS sound systems often helps these speakers maintain an accent that resembles that of a native monolingual into adulthood, it is also the case that the two systems of these speakers can continually engage with one another, with the possibility of generating unique outputs (e.g., Stangen et al. 2015). This potential intermingling and its potential explanatory power, especially for vowels, which are so complex in English, are the primary reasons why we encourage the collection of richer data sets in future expansions of our work.
One way of interpreting our findings related to pitch is through reference to Gussenhoven’s (2002) biological codes. For mean pitch, as seen in Table 8, four of our five informants showed changes, with all four exhibiting an increase in the end-of-semester task. As per the Frequency Code, one possibility is that this increase could be a reflex of the politeness linked to the more formal register and the general heightened formality that informants associated with the environment of their academic institution, which, it is worth noting, carries a high level of prestige. They knew the “audience” of their narrations was their instructor (i.e., the person who would listen to it, even though she was not present when they recorded) and that they were being evaluated on the structure of the narrative (though not on anything related to the sound system), so manifesting a polite and formal tone would seem appropriate.
In the interpretation of the informants’ pitch range results, we account for two opposing trends by highlighting potential changes to comfort level with/attitude toward uses of Spanish such as the one required to complete the narration task, as well as potential changes in the perceptions of the type of Spanish that should be used in the setting in question due to the influence of the main source of Spanish input received (i.e., the instructor). We begin by calling upon the Effort Code. Cases of pitch range reduction in the post-semester narration (e.g., Informant A), from a pragmatic standpoint, can be attributed to increased confidence in speech and the ability to carry out the task the second time around. The interpretation of confidence can also be linked to this particular informant feeling that the narrative was a more natural, spontaneous production in its second iteration, which is further supported by her vowel space reduction across the semester, detailed earlier in this section. Finally, one might intuit, based on previous literature (Cole et al. 2019; Estebas-Vilaplana 2009, 2014), that this informant moved away from the wider pitch range of English and toward the narrower range of Spanish across the semester; however, the forthcoming discussion of the more common outcome of pitch range expansion casts doubt on this, making the explanation couched in the Effort Code more plausible. On the other hand, when pitch range was expanded, which was the more frequent tendency, based on the Effort Code, it could have been to communicate increased emotion and enthusiasm toward the task (with the instructor being the audience), or, when thinking about the task itself, it could have been to signal shifts in narrative structure and/or pivotal events within the plot of the narration (in line with studies cited in Section 2.3).
When thinking about pitch range differences between English and Spanish, at the superficial level, it may appear that expansion of pitch range actually represents movement toward English’s intonational system in the Spanish of the informants who showed this modification in the post-semester task; however, one could argue against this by considering, once again, the variety of Spanish spoken by the instructor. Mexico City Spanish has been characterized as having a wider pitch range than many other varieties of Spanish, in large part due to its commonly used circumflex (rise–fall) configurations (De-la-Mota et al. 2010; Hualde and Prieto 2015). Since the instructor spoke this variety, had been in the US and around English for several years (which, presumably, would not have the effect of narrowing her range in Spanish), we can deduce that exposure to her variety across the semester could very well have influenced the pitch range results in the post-semester narrative. The informants emulating the instructor’s speech, which could be viewed as prestige-bearing, given her origin and current academic position/institution, at least with regard to intonation, is supported by, for example, Lowry’s (2002) study on intonation in Belfast English, where 17-year-old participants exhibited evidence of converging upon the prestige norms of Southern England in more formal speech.
Based on the discussion of pitch range to this point, it has become even more clear why access to data from both of the relevant languages, as produced by both students and instructors, is crucial to elaborating upon our exploratory findings and remarks. Overall, the observed changes in mean pitch and pitch range can be associated with the perception of accent (or perhaps various types of “heritage accent”); recall that Ruiz Moreno (2020) recently claimed that, based on his HS versus monolingual segmental findings, intonation is perhaps the most crucial factor in discriminating heritage and monolingual Spanish. As such, it would be revealing to carry out perceptual judgment tasks of similar data down the line in order to gain a deeper understanding of the effects of a classroom experience on HSs’ sound systems.
Finally, in terms of speech rate, significant main effects of TASK on speech rate that pointed to faster speech in the post-semester task (e.g., Informants D and E) give us evidence that levels of fluency increased over the course of the semester. This is supported by Bosker et al. (2012), who found that speech rate was one of two variables most strongly associated with perceived fluency. There were also cases of interactions between TASK and PHRASE, revealing that at the end of the semester, speech rate decreased as the narrative progressed (Informants B, D, E). In line with some previous work on narratives cited in Section 2.3 (e.g., Oliveira 2000), this outcome suggests that informants were modulating their speech rate as a discursive strategy to highlight key events in each narrative; that is, they spoke faster at the beginning, when providing general descriptions and background, and then slowed down to emphasize complications in the plot and how they were resolved, which all occurred in the second half. This addition to the linguistic repertoire of informants complements the gains external to the sound system seen in the narratives of HL students analyzed in Parra et al. (2018).
A final note, at the individual level, concerns Informants C and D. Based on the instructor’s input, we know that Informant C’s proficiency was rated as “intermediate-high,” but that, relatively speaking, she was the least proficient of the five informants. Interestingly, as noted in the discussion of voiced stops, she was also the only simultaneous bilingual. Informant D was the only one who was born outside the US, having arrived after beginning school. When looking at Table 8, we can see that these two informants demonstrated the least number of significant effects across the semester, raising questions about whether proficiency, bilingual type, and age of arrival can play a role in similar future work (for HS discussions of these variables, see, e.g., Amengual 2019; Chang in press; Shea 2019). For example, is it possible that lower HL proficiency, being a simultaneous bilingual, and having emigrated at a later age are factors that reduce sensitivity to new sound features of HL input introduced through a classroom experience?
In sum, our exploratory study set out to acoustically and statistically analyze individual-level differences in the production of stop consonants, vowels, pitch range, mean pitch, and speech rate in speech samples coming from HSs of Spanish at the beginning and end of their experience in a university course designed for them. The novelty of our methodological approach yielded some noteworthy initial findings that expand upon relevant previous research on HSs, but also raise a series of questions that investigators will hopefully pursue in the future.

Author Contributions

Conceptualization, M.P.; Formal analysis, R.R. and Z.F.; Investigation, R.R. and M.L.P.; Methodology, M.P. and R.R.; Project administration, R.R.; Resources, M.P. and M.L.P.; Writing—original draft, R.R., Z.F., and M.P.; Writing—review & editing, R.R., Z.F., and M.P. All authors have read and agreed to the published version of the manuscript.

Funding

This research was funded by University of Iowa College of Arts & Sciences Dean’s Micro-Grant.

Acknowledgments

We would like to thank three anonymous reviewers and our editor, Bradley Hoot, for valuable comments on earlier drafts of this paper. We are also grateful to Margaryta Bondarenko and Erwin Lares for their help with the acoustic analysis, and to Marta Llorente Bravo for her assistance with the data collection process. We are solely responsible for all the errors in the final version.

Conflicts of Interest

The authors declare no conflict of interest.

Appendix A

This appendix contains the token counts for vowel and consonant measurements as reported and analyzed for Informant A in Section 4.1 and Section 4.2.
Table A1. Token counts for consonant measurements used to assess changes in production of voiceless and voiced consonants by Informant A in Section 4.1.1 and Section 4.1.2.
/p//k//b//d/
Beginning1221617
End728818
Table A2. Token counts for vowel formant measurements used to visualize vowel space and calculate vowel space area for Informant A in Section 4.2.1.
UnstressedStressed
Beginning5132
End5747
Table A3. Token counts for vowel formant measurements used to assess changes in individual vowel production by Informant A in Section 4.2.1.
[a][e][i][o]
Beginning27122321
End28211441

Appendix B

This appendix contains the token counts for vowel and consonant measurements as reported and analyzed for Informant B in Section 4.1 and Section 4.2.
Table A4. Token counts for consonant measurements used to assess changes in production of voiceless and voiced consonants by Informant B in Section 4.1.1 and Section 4.1.2.
/p//k//b//d/
Beginning17222217
End15311527
Table A5. Token counts for vowel formant measurements used to visualize vowel space and calculate vowel space area for Informant B in Section 4.2.2.
UnstressedStressed
Beginning7245
End7446
Table A6. Token counts for vowel formant measurements used to assess changes in individual vowel production by Informant B in Section 4.2.2.
[a][e][i][o]
Beginning44181639
End36101955

Appendix C

This appendix contains the token counts for vowel and consonant measurements as reported and analyzed for Informant C in Section 4.1 and Section 4.2.
Table A7. Token counts for consonant measurements used to assess changes in production of voiceless and voiced consonants by Informant C in Section 4.1.1 and Section 4.1.2.
/p//t//k//b//d/
Beginning2023439
End119511520
Table A8. Token counts for vowel formant measurements used to visualize vowel space and calculate vowel space area for Informant C in Section 4.2.3.
UnstressedStressed
Beginning6945
End10861
Table A9. Token counts for vowel formant measurements used to assess changes in individual vowel production by Informant C in Section 4.2.3.
[a][e][i][o]
Beginning26361933
End43351675

Appendix D

This appendix contains the token counts for vowel and consonant measurements as reported and analyzed for Informant D in Section 4.1 and Section 4.2.
Table A10. Token counts for consonant measurements used to assess changes in production of voiceless and voiced consonants by Informant D in Section 4.1.1 and Section 4.1.2.
/p//t//k//d/
Beginning103188
End661813
Table A11. Token counts for vowel formant measurements used to visualize vowel space and calculate vowel space area for Informant D in Section 4.2.4.
UnstressedStressed
Beginning3928
End3830
Table A12. Token counts for vowel formant measurements used to assess changes in individual vowel production by Informant D in Section 4.2.4.
[a][e][i][o]
Beginning2371621
End209534

Appendix E

This appendix contains the token counts for vowel and consonant measurements as reported and analyzed for Informant E in Section 4.1 and Section 4.2.
Table A13. Token counts for consonant measurements used to assess changes in production of voiceless and voiced consonants by Informant E in Section 4.1.1 and Section 4.1.2.
/p//t//k//b//d//g/
Beginning181454202323
End281869183719
Table A14. Token counts for vowel formant measurements used to visualize vowel space and calculate vowel space area for Informant E in Section 4.2.5.
UnstressedStressed
Beginning10978
End12094
Table A15. Token counts for vowel formant measurements used to assess changes in individual vowel production by Informant E in Section 4.2.5.
[a][e][i][o]
Beginning48314563
End59373484

References

  1. Abercrombie, David. 1967. Elements of General Phonetics. Edinburgh: Edinburgh University Press. [Google Scholar]
  2. Adank, Patti, Roel Smits, and Roeland van Hout. 2004. A comparison of vowel normalization procedures for language variation research. The Journal of the Acoustical Society of America 116: 3099–107. [Google Scholar] [CrossRef] [Green Version]
  3. Alvord, Scott. 2009. Disambiguating declarative and interrogative meaning with intonation in Miami Cuban Spanish. Southwest Journal of Linguistics 28: 21–66. [Google Scholar]
  4. Alvord, Scott. 2010. Variation in Miami Cuban Spanish interrogative intonation. Hispania 93: 235–55. [Google Scholar]
  5. Alvord, Scott, and Brandon Rogers. 2014. Miami-Cuban Spanish vowels in contact. Sociolinguistic Studies 8: 139–70. [Google Scholar] [CrossRef]
  6. Amengual, Mark. 2012. Interlingual influence in bilingual speech: Cognate status effect in a continuum of bilingualism. Bilingualism: Language and Cognition 15: 517–30. [Google Scholar] [CrossRef] [Green Version]
  7. Amengual, Mark. 2019. Type of early bilingualism and its effect on the acoustic realization of allophonic variants: Early sequential and simultaneous bilinguals. International Journal of Bilingualism 23: 954–70. [Google Scholar]
  8. Au, Terry Kit-Fong, Janet Oh, Leah Knightly, Sun-Ah Jun, and Laura Romo. 2008. Salvaging a childhood language. Journal of Memory and Language 58: 998–1011. [Google Scholar] [CrossRef] [Green Version]
  9. Avelino, Heriberto. 2018. Mexico City Spanish. Journal of the International Phonetic Association 48: 223–30. [Google Scholar] [CrossRef] [Green Version]
  10. Benmamoun, Elabbas, Silvina Montrul, and Maria Polinsky. 2013. Heritage languages and their speakers: Opportunities and challenges for linguistics. Theoretical Linguistics 39: 129–81. [Google Scholar] [CrossRef]
  11. Berman, Ruth. 2004. Between emergence and mastery: The long developmental route of language acquisition. In Language Development across Childhood and Adolescence. Edited by Ruth Berman. Amsterdam: John Benjamins, pp. 9–34. [Google Scholar]
  12. Boersma, Paul, and David Weenink. 2020. Praat: Doing phonetics by computer. Available online: www.praat.org (accessed on 6 June 2020).
  13. Boomershine, Amanda. 2013. The perception of English vowels by monolingual, bilingual, and heritage speakers of Spanish and English. In Selected Proceedings of the 15th Hispanic Linguistics Symposium. Edited by Chad Howe, Sarah E. Blackwell and Margaret Lubbers Quesada. Somerville: Cascadilla Proceedings Project, pp. 103–18. [Google Scholar]
  14. Bosker, Hans, Anne-France Pinget, Hugo Quené, Ted Sanders, and Nivja H. de Jong. 2012. What makes speech sound fluent? The contributions of pauses, speed and repairs. Language Testing 30: 159–75. [Google Scholar] [CrossRef]
  15. Bowles, Melissa, and Silvina Montrul. 2014. Heritage Spanish speakers in university language courses: A decade of difference. ADFL Bulletin 43: 112–22. [Google Scholar]
  16. Bradlow, Ann. 1995. A comparative acoustic study of English and Spanish vowels. Journal of the Acoustical Society of America 97: 1916–24. [Google Scholar] [CrossRef] [PubMed] [Green Version]
  17. Bullock, Barbara. 2009. Prosody in contact in French: A case study from a heritage variety in the USA. International Journal of Bilingualism 13: 165–94. [Google Scholar] [CrossRef]
  18. Carrasco, Patricio, José Ignacio Hualde, and Miquel Simonet. 2012. Dialect differences in Spanish voiced obstruent allophony: Costa Rican versus Iberian Spanish. Phonetica 69: 149–79. [Google Scholar] [CrossRef] [PubMed]
  19. Carreira, María, and Olga Kagan. 2018. Heritage language education: A proposal for the next 50 years. Foreign Language Annals 51: 152–68. [Google Scholar] [CrossRef]
  20. Chang, Charles B. forthcoming. Phonetics and phonology. In The Cambridge Handbook of Heritage Languages and Linguistics. Edited by Silvina Montrul and Maria Polinsky. Cambridge: Cambridge University Press.
  21. Chládková, Katerina, Paola Escudero, and Paul Boersma. 2011. Context-Specific Acoustic Differences between Peruvian and Iberian Spanish Vowels. Journal of the Acoustical Society of America 130: 416–28. [Google Scholar] [CrossRef] [Green Version]
  22. Cho, Taehong, and Peter Ladefoged. 1999. Variation and universals in VOT: Evidence from 18 languages. Journal of Phonetics 27: 207–29. [Google Scholar] [CrossRef]
  23. Colantoni, Laura, and Irina Marinescu. 2010. The scope of stop weakening in Argentine Spanish. In Selected Proceedings of the 4th Conference on Laboratory Approaches to Spanish Phonology. Edited by Marta Ortega-Llebaria. Somerville, MA: Cascadilla Proceedings Project, pp. 100–14. [Google Scholar]
  24. Colantoni, Laura, Alejandro Cuza, and Natalia Mazzaro. 2016. Task related effects in the prosody of Spanish heritage speakers. In Intonational Grammar in Ibero-Romance: Approaches across Linguistic Subfields. Edited by Meghan Armstrong, Nicholas Henriksen and Maria del Mar Vanrell. Amsterdam: John Benjamin, pp. 3–24. [Google Scholar]
  25. Cole, Jennifer, José Ignacio Hualde, Caroline L. Smith, Christopher Eager, Timothy Mahrt, and Ricardo Napoleão de Souza. 2019. Sound, structure and meaning: The bases of prominence ratings in English, French and Spanish. Journal of Phonetics 75: 113–47. [Google Scholar] [CrossRef]
  26. De-la-Mota, Carme, Pedro Martín Butragueño, and Pilar Prieto. 2010. Mexican Spanish intonation. In Transcription of Intonation of the Spanish Language. Edited by Pilar Prieto and Paolo Roseano. Munich: Lincom, pp. 319–50. [Google Scholar]
  27. Delattre, Pierre. 1969. An acoustic and articulatory study of vowel reduction in four languages. IRAL 7: 294–325. [Google Scholar] [CrossRef]
  28. Eddington, David. 2011. What are the contextual variations of /b d g/ in colloquial Spanish? Probus 23: 1–19. [Google Scholar] [CrossRef]
  29. Estebas-Vilaplana, Eva. 2009. Teach Yourself English Pronunciation. A Coruña: Netbiblio. [Google Scholar]
  30. Estebas-Vilaplana, Eva. 2014. The evaluation of intonation: Pitch range differences in Spanish and English. In Evaluation in Context. Edited by Geoff Thompson and Laura Alba Juez. Amsterdam: John Benjamins, pp. 179–94. [Google Scholar]
  31. Elias, Vanessa, Sean McKinnon, and Ángel Milla-Muñoz. 2017. The effects of code-switching and lexical stress on vowel quality and duration of heritage speakers of Spanish. Language 4: 29. [Google Scholar]
  32. Face, Timothy. 2003. Intonation in Spanish declaratives: Differences between lab and spontaneous speech. Catalan Journal of Linguistics 2: 115–31. [Google Scholar] [CrossRef]
  33. Flege, James Emil. 1992. Speech learning in a second language. In Phonological Development: Models, Research, Implications. Edited by Charles A. Ferguson, Lise Menn and Carol Stoel-Gammon. Timonium: York Press, pp. 565–604. [Google Scholar]
  34. Flege, James Emil. 1995. Second-language speech learning: Theory, findings, and problems. In Speech Perception and Linguistic Experience: Issues in Cross-Language Research. Edited by William Strange. Timonium: York Press, pp. 229–73. [Google Scholar]
  35. George, Angela, and Anne Hoffman-González. 2019. Dialect and identity: US heritage language learners of Spanish abroad. Study Abroad Research in Second Language Acquisition and International Education 4: 252–79. [Google Scholar] [CrossRef]
  36. Gil Fernández, Juana. 2007. Fonética para Profesores de Español: de la Teoría a la Práctica. Madrid: Arco/Libros. [Google Scholar]
  37. Gussenhoven, Carlos. 2002. Intonation and interpretation: Phonetics and phonology. In Proceedings of Speech Prosody 2002. Edited by Bernard Bel and Isabelle Marlien. Aix-en-Provence: Aix-en-Provence Laboratoire Parole et Langage, pp. 47–57. [Google Scholar]
  38. Hermegnies, Bernard, and Dolors Poch-Olivé. 1992. A study of style-induced vowel variability: Laboratory versus spontaneous speech in Spanish. Speech Communication 11: 429–37. [Google Scholar] [CrossRef]
  39. Hirschberg, Julia, and Barbara Grosz. 1992. Intonational features of local and global discourse structure. In Proceedings of the Workshop on Speech and Natural Language. Edited by the ACM International Conference on Human Language Technology Research. Morristown: Association for Computational Linguistics, pp. 441–46. [Google Scholar]
  40. Hualde, José Ignacio. 2005. The Sounds of Spanish. Cambridge: Cambridge University Press. [Google Scholar]
  41. Hualde, José Ignacio, and Pilar Prieto. 2015. Intonational variation in Spanish: European and American varieties. In Intonation in Romance. Edited by Sónia Frota and Pilar Prieto. Oxford: Oxford University Press, pp. 350–91. [Google Scholar]
  42. Kehoe, Margaret, and Conxita Lleó. 2017. Vowel reduction in German-Spanish bilinguals. In Romance-Germanic Bilingual Phonology. Edited by Mehmet Yavas, Margaret Kehoe and Walcir Cardoso. Sheffield: Equinox, pp. 14–37. [Google Scholar]
  43. Kim, Ji-Young. 2011. L1-L2 phonetic interference in the production of Spanish heritage speakers in the US. The Korean Journal of Hispanic Studies 4: 1–28. [Google Scholar]
  44. Kim, Ji-Young. 2019. Heritage speakers’ use of prosodic strategies in focus marking in Spanish. International Journal of Bilingualism 23: 986–1004. [Google Scholar] [CrossRef]
  45. Knightly, Leah, Sun-Ah Jun, Janet Oh, and Terry Kit-fong Au. 2003. Production benefits of childhood overhearing. Journal of the Acoustical Society of America 114: 465–74. [Google Scholar] [CrossRef] [PubMed] [Green Version]
  46. Kupisch, Tanja, and Jason Rothman. 2018. Terminology matters! Why difference is not incompleteness and how early child bilinguals are heritage speakers. International Journal of Bilingualism 22: 564–82. [Google Scholar] [CrossRef] [Green Version]
  47. Labov, William. 1972. Language in the Inner City: Studies in the Black English Vernacular. Philadelphia: University of Pennsylvania Press. [Google Scholar]
  48. Ladd, D. Robert. 2008. Intonational Phonology, 2nd ed. Cambridge: Cambridge University Press. [Google Scholar]
  49. Lehiste, Ilse. 1982. Some phonetic characteristics of discourse. Studia Linguistica 36: 117–30. [Google Scholar] [CrossRef]
  50. Lipski, John. 1994. Latin American Spanish. London: Longman. [Google Scholar]
  51. Lisker, Leigh, and Arthur Abramson. 1964. A Cross-language study of voicing in initial stops: Acoustical measurements. Word 20: 384–422. [Google Scholar] [CrossRef] [Green Version]
  52. Lisker, Leigh, and Arthur Abramson. 1967. Some effects of context on voice onset time in English stops. Language and Speech 10: 1–28. [Google Scholar] [CrossRef]
  53. Lleó, Conxita. 2018. Bilingual children’s prosodic development. The Development of Prosody in First Language Acquisition 23: 317. [Google Scholar]
  54. Lleó, Conxita, and Martin Rakow. 2005. Markedness effects in the acquisition of voiced stop spirantization by Spanish-German bilinguals. In Proceedings of the 4th International Symposium on Bilingualism. Edited by James Cohen, Kara T. McAlister, Kellie Rolstad and Jeff MacSwan. Cascadilla: Cascadilla Press, pp. 1353–71. [Google Scholar]
  55. Lobanov, Boris. 1971. Classification of Russian vowels spoken by different speakers. Journal of the Acoustical Society of America 49: 606–8. [Google Scholar] [CrossRef]
  56. Lowry, Orla. 2002. The stylistic variation of nuclear patterns in Belfast English. Journal of the International Phonetic Association 32: 33–42. [Google Scholar] [CrossRef]
  57. Marín Gálvez, Rafael. 1994–95. La duración vocálica en español. ELUA Estudios de Lingüística 10: 213–26. [Google Scholar]
  58. Martínez Celdrán, Eugenio. 1984. Fonética: con Especial Referencia a la Lengua Castellana. Barcelona: Teide. [Google Scholar]
  59. Martínez Celdrán, Eugenio. 1995. En torno a las vocales del español: análisis y reconocimiento. Estudios de Fonética Experimental 7: 195–218. [Google Scholar]
  60. Mascaró, Joan. 1984. Continuant spreading in Basque, Catalan, and Spanish. In Language Sound Structure. Edited by Mark Aronoff and Richard T. Oehrle. Cambridge: MIT Press, pp. 287–98. [Google Scholar]
  61. Montrul, Silvina. 2016. The Acquisition of Heritage Languages. Cambridge: Cambridge University Press. [Google Scholar]
  62. Navarro, Tomás. 1918. Manual de Pronunciación Española. Madrid: CSIC. [Google Scholar]
  63. Oh, Janet, and Terry Kit-fong Au. 2005. Learning Spanish as a heritage language: The role of sociocultural background variables. Language, Culture and Curriculum 18: 229–41. [Google Scholar] [CrossRef]
  64. Oliveira, Miguel. 2000. Prosodic Features in Spontaneous Narratives. Ph.D. dissertation, Simon Fraser University, Vancouver, BC, Canada. [Google Scholar]
  65. Parra, Maria-Luisa, Marta Llorente Bravo, and Maria Polinsky. 2018. De bueno a muy bueno: How Pedagogical Intervention Boosts Language Proficiency in Advanced Heritage Learners. Heritage Language Journal 15: 203–241. [Google Scholar] [CrossRef]
  66. Pascual y Cabo, Diego, and Jason Rothman. 2012. The (il)logical problem of heritage speaker bilingualism and incomplete acquisition. Applied Linguistics 33: 1–7. [Google Scholar]
  67. Pavlenko, Aneta. 2006. Narrative competence in a second language. In Educating for Advanced Foreign Language Capacities. Edited by Heidi Byrnes, Heather Weger and Katherine Sprang. Washington: Georgetown University Press, pp. 105–17. [Google Scholar]
  68. Pierrehumbert, Janet, and Julia Hirschberg. 1990. The meaning of intonational contours in the interpretation of discourse. In Intentions in Communication. Edited by Philip R. Cohen, Jerry Morgan and Martha E. Pollack. Cambridge, MA: MIT Press, pp. 271–311. [Google Scholar]
  69. Pike, Kenneth. 1945. The Intonation of American English. Ann Arbor: University of Michigan Press. [Google Scholar]
  70. Polinsky, Maria. 2008. Heritage language narratives. In Heritage Language Education: A New Field Emerging. Edited by Donna Brinton, Olga Kagan and Susan Bauckus. New York: Routledge, pp. 149–64. [Google Scholar]
  71. Polinsky, Maria. 2018. Heritage Languages and Their Speakers. Cambridge: Cambridge University Press. [Google Scholar]
  72. Polinsky, Maria, and Olga Kagan. 2007. Heritage languages: In the ‘wild’ and in the classroom. Linguistics and Language Compass 1: 368–95. [Google Scholar] [CrossRef]
  73. Potowski, Kim, Jill Jegerski, and Kara Morgan-Short. 2009. The effects of instruction on linguistic development in Spanish heritage language speakers. Language Learning 59: 537–79. [Google Scholar] [CrossRef]
  74. Queen, Robin. 2006. Phrase-final intonation in narratives told by Turkish-German bilinguals. International Journal of Bilingualism 10: 153–78. [Google Scholar] [CrossRef]
  75. Rao, Rajiv. 2010. Final lengthening and pause duration in three dialects of Spanish. In Selected Proceedings of the 4th Conference on Laboratory Approaches to Spanish Phonology. Edited by Marta Ortega-Llebaria. Somerville, MA: Cascadilla Proceedings Project, pp. 69–82. [Google Scholar]
  76. Rao, Rajiv. 2014. On the status of the phoneme /b/ in heritage speakers of Spanish. Sintagma 26: 37–54. [Google Scholar]
  77. Rao, Rajiv. 2015. Manifestations of /bdg/ in heritage speakers of Spanish. Heritage Language Journal 12: 48–74. [Google Scholar]
  78. Rao, Rajiv. 2016. On the nuclear intonational phonology of heritage speakers of Spanish. In Advances in Spanish as a Heritage Language. Edited by Diego Pascual y Cabo. Amsterdam: John Benjamins, pp. 51–80. [Google Scholar]
  79. Rao, Rajiv. 2019. The phonological system of adult heritage speakers of Spanish in the United States. In The Routledge Handbook of Spanish Phonology. Edited by Sonia Colina and Fernando Martínez-Gil. New York/London: Routledge, pp. 439–52. [Google Scholar]
  80. Rao, Rajiv, ed. 2020. Spanish Phonetics and Phonology in Contact: Studies from Africa, the Americas, and Spain. Amsterdam: John Benjamins. [Google Scholar]
  81. Rao, Rajiv, and Mark Amengual. In press. La fonética y fonología del español como lengua de herencia. In Aproximaciones al Español como Lengua de Herencia. Edited by Diego Pascual y Cabo and Julio Torres. New York and London: Routledge.
  82. Rao, Rajiv, and Emily Kuder. 2016. Research on heritage Spanish phonetics and phonology: Pedagogical and curricular implications. Journal of New Approaches in Educational Research 5: 99–106. [Google Scholar] [CrossRef] [Green Version]
  83. Rao, Rajiv, and Rebecca Ronquest. 2015. The heritage Spanish phonetic/phonological system: Looking back and moving forward. Studies in Hispanic and Lusophone Linguistics 8: 403–14. [Google Scholar] [CrossRef]
  84. Ready, Carol. 2020. Mexican heritage Spanish speakers’ vowel production in cognate and non-cognate words. Hispanic Studies Review 4: 155–85. [Google Scholar]
  85. Robles-Puente, Sergio. 2014. Prosody in Contact: Spanish in Los Angeles. Ph.D. dissertation, University of Southern California, Los Angeles, CA, USA. [Google Scholar]
  86. Ronquest, Rebecca. 2012. An Acoustic Analysis of Heritage Spanish Vowels. Ph.D. dissertation, Indiana University, Bloomington, IN, USA. [Google Scholar]
  87. Ronquest, Rebecca. 2013. A acoustic examination of unstressed vowel reduction in heritage Spanish. In Selected Proceedings of the 15th Hispanic Linguistics Symposium. Edited by Chad Howe, Sarah Blackwell and Margaret Lubbers Quesada. Somerville: Cascadilla Proceedings Project, pp. 151–71. [Google Scholar]
  88. Ronquest, Rebecca. 2016. Stylistic variation in heritage Spanish vowel production. Heritage Language Journal 13: 275–97. [Google Scholar] [CrossRef]
  89. Ronquest, Rebecca. 2018. Vowels. In The Cambridge Handbook of Spanish Linguistics. Edited by Kimberly L. Geeslin. Cambridge: Cambridge University Press, pp. 145–64. [Google Scholar]
  90. Ronquest, Rebecca, and Rajiv Rao. 2018. Heritage Spanish phonetics and phonology. In The Routledge Handbook on Spanish as a Heritage Language. Edited by Kim Potowski. New York and London: Routledge, pp. 164–77. [Google Scholar]
  91. Rosner, Burton, Luis E. López-Bascuas, José E. García-Albea, and Richard P. Fahey. 2000. Voice-onset Times for Castilian Spanish initial stops. Journal of Phonetics 28: 217–224. [Google Scholar] [CrossRef]
  92. Ruiz Moreno, Mario. 2020. Phonetic Production in Early and Late German-Spanish Bilinguals. Ph.D. dissertation, University of Hamburg, Hamburg, Germany. [Google Scholar]
  93. Selting, Margret. 1994. Emphatic speech style- with special focus on the prosodic signalling of heightened emotive involvement in conversation. Journal of Pragmatics 22: 375–408. [Google Scholar] [CrossRef]
  94. Shea, Christine. 2019. Dominance, proficiency, and Spanish heritage speakers’ production of English and Spanish vowels. Studies in Second Language Acquisition 41: 123–49. [Google Scholar] [CrossRef] [Green Version]
  95. Silva-Corvalán, Carmen. 1994. Language Contact and Change: Spanish in Los Angeles. Oxford: Oxford University Press. [Google Scholar]
  96. Solon, Megan, Nyssa Knarvik, and Josh DeClerck. 2019. On comparison groups in heritage phonetics/phonology research: The case of bilingual Spanish vowels. Hispanic Studies Review 4: 165–92. [Google Scholar]
  97. Stangen, Ilse, Tanja Kupisch, Anna Lia Proietti Ergün, and Marina Zielke. 2015. Foreign accent in heritage speakers of Turkish in Germany. In Transfer Effects in Multilingual Language Development. Edited by Hagen Peukert. Amsterdam: John Benjamins, pp. 87–108. [Google Scholar]
  98. Swerts, Marc. 1997. Prosodic features at discourse boundaries of different strength. Journal of the Acoustical Society of America 101: 514–21. [Google Scholar] [CrossRef] [PubMed]
  99. Theodore, Rachel, Joanne Miller, and David DeSteno. 2009. Individual talker differences in voice-onset-time: Contextual influences. Journal of the Acoustical Society of America 125: 3974–82. [Google Scholar] [CrossRef] [Green Version]
  100. Torres, Julio, Diego Pascual y Cabo, and Michael Beusterein. 2018. What’s next? Heritage language learners shape new paths in Spanish teaching. Hispania 100: 271–76. [Google Scholar] [CrossRef]
  101. Wennerstrom, Ann. 2001. Intonation and evaluation in oral narratives. Journal of Pragmatics 33: 1183–1206. [Google Scholar] [CrossRef]
  102. Willis, Erik. 2005. An initial examination of Southwest Spanish vowels. Southwest Journal of Linguistics 24: 185–99. [Google Scholar]
  103. Yao, Yao. 2009. Understanding VOT Variation in Spontaneous Speech. UC Berkeley Phonology Lab Annual Report. Available online: http://linguistics.berkeley.edu/phonlab/documents/2009/Yao_VOT_variation.pdf (accessed on 12 October 2018).
  104. Yu, Vickie Y., Luc F. De Nil, and Elizabeth W. Pang. 2015. Effects of age, sex and syllable number on voice onset time: Evidence from children’s voiceless aspirated stops. Language and Speech 58: 152–67. [Google Scholar] [CrossRef]
  105. Zárate-Sández. 2015. Perception and Production of Intonation among English-Spanish Bilingual Speakers at Different Proficiency Levels. Ph.D. dissertation, Georgetown University, Washington DC, USA. [Google Scholar]
1
We are providing generalizations about aspects of the Spanish sound system that serve as a backdrop for the segmental portion of our analysis. For cases of variation, see, for example, Gil Fernández (2007); Hualde (2005); Lipski (1994) and Rao (2020).
2
Since the current study deals with the geographic and social context of the US, we focus on studies carried out in the US in this section. Examples of studies on the segmental phonology of HSs of Spanish coming from Europe include Kehoe and Lleó (2017), Lleó (2018) and Lleó and Rakow (2005).
3
All informants other than informant D were born, raised, and went to school in the location indicated in this column. In the case of informant D, she lived in Chile until age 6, when she moved to Massachusetts, where she subsequently did all of her schooling.
4
This informant acquired Portuguese and Spanish at home before beginning school, where she began learning English. As an adult, she is trilingual, but prefers English and Spanish over Portuguese.
5
An author of this paper and two individuals trained by this author jointly conducted the acoustic analysis. The author supervised the entire process to ensure accuracy and reliability.
6
While some highly controlled studies have focused on potential effects of adjacent consonants on the acoustic measures of vowels (e.g., Chládková et al. 2011), we attempted to but ultimately decided against coding for this variable due to the more unscripted, uncontrollable nature of our data; that is, token imbalances would not have allowed for reliable statistical measures.
7
See Avelino (2018) for details on Mexico City Spanish vowels.
Figure 1. Spanish production of the word-initial /t/ in total.
Languages 05 00072 g001
Figure 2. English production of the word-initial /t/ in total.
Languages 05 00072 g002
Figure 3. Spanish production of intervocalic /b/ in cabaña ‘cabin’.
Languages 05 00072 g003
Figure 4. Spanish production of post-pausal, word-initial /ɡ/ in gol ‘goal’.
Languages 05 00072 g004
Figure 5. Voice onset time (VOT) values for pre-semester and post-semester measurements of voiceless consonants for each informant.
Languages 05 00072 g005
Figure 6. Relative intensity values for pre-semester and post-semester measurements of voiceless consonants for each informant.
Languages 05 00072 g006
Figure 7. Informant A vowel spaces from pre-semester and post-semester measurements: (a) vowels from unstressed syllables; (b) vowels from stressed syllables.
Languages 05 00072 g007
Figure 8. Informant B vowel spaces from pre-semester and post-semester measurements: (a) vowels from unstressed syllables; (b) vowels from stressed syllables.
Languages 05 00072 g008
Figure 9. Informant C vowel spaces from pre-semester and post-semester measurements: (a) vowels from unstressed syllables; (b) vowels from stressed syllables.
Languages 05 00072 g009
Figure 10. Informant D vowel spaces from pre-semester and post-semester measurements: (a) vowels from unstressed syllables; (b) vowels from stressed syllables.
Languages 05 00072 g010
Figure 11. Informant E vowel spaces from pre-semester and post-semester measurements: (a) vowels from unstressed syllables; (b) vowels from stressed syllables.
Languages 05 00072 g011
Figure 12. Speech rate measurements over the course of the narrative for each informant.
Languages 05 00072 g012
Figure 13. Mean pitch over the course of the narrative for each informant.
Languages 05 00072 g013
Figure 14. Pitch range over the course of the narrative for each informant.
Languages 05 00072 g014
Table 1. Summary of relevant studies on the vowels and stop consonants of heritage Spanish in contact with English.
Sound ClassMain Findings/EffectsKey References
VowelsVowel reduction in both HS and late immigrant bilinguals, asymmetrical vowel space; speech style, dominance, proficiency, code-switching, cognatesAlvord and Rogers (2014); Elias et al. (2017); Ready (2020); Ronquest (2012, 2013, 2016); Shea (2019); Solon et al. (2019); Willis (2005)
VOT in voiceless stopsHSs < L2 learners; type of childhood experience, cognates(Amengual (2012); Au et al. (2008); Kim (2011; VOT in voiced stops as well); Knightly et al. (2003)
Lenition in voiced stopsAcoustic evidence of weakening away from stop realization > L2 learners; use and exposure as children/adults, type of bilingual, word position, syllable stress, task typeAmengual (2019); Au et al. (2008); Knightly et al. (2003); Rao (2014, 2015)
Table 2. Informant profiles.
InformantYear at UniversityBirth Place[3]Parents’ OriginAcquisition of SpanishAcquisition of EnglishHome Language (Childhood and Current)Schooling in Spanish
A2ndLos AngelesMexicoBirthAge 5Spanish/
English
Bilingual Kinder-2nd grade
B1stLos AngelesArgentina (father)/
Brazil (mother)[4]
BirthAge 5Spanish with fatherNone
C1stLos AngelesEl SalvadorBirthBirth (older siblings)Spanish/
English
None
D3rdSantiago, ChileChileBirthAge 6 (when moved to US)SpanishNone
E3rdCathedral City, CAMexicoBirthAge 5SpanishNone
Table 3. Mean formant values for vowels produced by Informant A.
[a] UnstressedStressed
F1F2F1F2
Beginning
of course
Mean1.23−0.061.35−0.09
SD0.480.080.910.06
End of courseMean0.72−0.090.83−0.10
SD0.40.070.560.08
[e] UnstressedStressed
F1F2F1F2
Beginning
of course
Mean0.250.16−0.190.233
SD0.460.150.810.12
End of courseMean−0.560.12−0.250.06
SD0.330.160.320.10
[i] UnstressedStressed
F1F2F1F2
Beginning
of course
Mean−0.720.25−1.110.31
SD0.860.080.540.14
End of courseMean−1.18−0.22−0.440.08
SD0.170.311.840.22
[o] UnstressedStressed
F1F2F1F2
Beginning
of course
Mean−0.04−0.2820.01−0.31
SD0.710.10-0.15
End of courseMean−0.190.31−0.21−0.34
SD0.610.180.370.12
Table 4. Mean Lobanov-normalized F1 and F2 values for Informant B.
[a] UnstressedStressed
F1F2F1F2
Beginning
of course
Mean0.970.001.27−0.24
SD0.460.270.440.15
End of courseMean0.58−0.131.33−0.16
SD0.460.400.520.27
[e] UnstressedStressed
F1F2F1F2
Beginning
of course
Mean−0.050.850.040.63
SD0.410.380.440.30
End of courseMean−0.780.68n/an/a
SD0.670.62n/an/a
[i] UnstressedStressed
F1F2F1F2
Beginning
of course
Mean−1.351.78−1.441.73
SD0.370.220.680.64
End of courseMean−2.152.37−1.541.71
SD1.150.8480280.49
[o] UnstressedStressed
F1F2F1F2
Beginning
of course
Mean0.09−0.970.27−0.80
SD0.390.420.180.34
End of courseMean−0.22−0.560.19−0.85
SD0.560.650.320.35
Table 5. Mean Lobanov-normalized F1 and F2 values for Informant C.
[a] UnstressedStressed
F1F2F1F2
Beginning
of course
Mean0.97−0.241.52−0.33
SD0.550.290.280.22
End of courseMean0.900.101.270.01
SD0.700.330.220.09
[e] UnstressedStressed
F1F2F1F2
Beginning
of course
Mean−0.160.820.090.59
SD0.520.500.600.43
End of courseMean−0.690.660.390.83
SD0.520.310.600.34
[i] UnstressedStressed
F1F2F1F2
Beginning
of course
Mean−0.771.81−1.641.85
SD0.880.160.740.36
End of courseMean−1.921.46−1.601.41
SD0.360.410.550.50
[o] UnstressedStressed
F1F2F1F2
Beginning
of course
Mean0.02−0.97−0.49−1.21
SD0.500.400.470.21
End of courseMean−0.19−0.98−0.01−0.93
SD0.690.540.540.29
Table 6. Mean Lobanov-normalized F1 and F2 values for Informant D.
[a] UnstressedStressed
F1F2F1F2
Beginning
of course
Mean0.41−0.071.05−0.03
SD0.640.390.690.47
End of courseMean0.47−0.161.58−0.15
SD1.010.381.000.53
[e] UnstressedStressed
F1F2F1F2
Beginning
of course
Mean−0.651.30−0.130.95
SD0.360.960.070.33
End of courseMean−0.300.65−0.120.65
SD0.190.281.170.37
[i] UnstressedStressed
F1F2F1F2
Beginning
of course
Mean−0.691.83−1.221.71
SD0.460.410.170.35
End of courseMean−1.302.05−1.301.62
SD--0.631.07
[o] UnstressedStressed
F1F2F1F2
Beginning
of course
Mean0.05−0.720.79−0.81
SD0.350.390.250.81
End of courseMean−0.30−0.75−0.07−0.80
SD0.630.400.290.36
Table 7. Mean Lobanov-normalized F1 and F2 values for Informant E.
[a] UnstressedStressed
F1F2F1F2
Beginning
of course
Mean1.32−0.071.58−0.03
SD0.630.300.650.52
End of courseMean0.550.080.960.02
SD0.770.520.720.43
[e] UnstressedStressed
F1F2F1F2
Beginning
of course
Mean−0.040.390.100.56
SD0.700.610.430.39
End of courseMean−0.210.84−0.160.74
SD0.610.670.590.47
[i] UnstressedStressed
F1F2F1F2
Beginning
of course
Mean−1.120.27−1.251.01
SD0.401.460.730.90
End of courseMean−1.010.94−1.131.60
SD0.390.570.340.67
[o] UnstressedStressed
F1F2F1F2
Beginning
of course
Mean0.16−0.94−0.03−0.80
SD0.640.420.670.67
End of courseMean−0.06−0.59−0.10−0.84
SD0.640.790.530.62
Table 8. Summary of significant effects of TASK in our within-informant analyses. A check mark indicates significance at a p < 0.05 level, while ( ) points out a trending effect.
SuprasegmentalConsonantsVowels
Mean pitchPitch RangeSpeech RateVoicelessVoiced
Informant A( )
Informant B
Informant C
Informant D ( )
Informant E
Publisher’s Note: MDPI stays neutral with regard to jurisdictional claims in published maps and institutional affiliations.