Article

Phonological Choices Drive F0 Range Expansion and Lengthening in Bengali and English Infant-Directed Speech

by
Kristine M. Yu
1,*,
Sameer ud Dowla Khan
2 and
Megha Sundara
3
1
Department of Linguistics, University of Massachusetts Amherst, Amherst, MA 01003, USA
2
Linguistics Department, Reed College, Portland, OR 97202, USA
3
Department of Linguistics, University of California, Los Angeles, CA 90095, USA
*
Author to whom correspondence should be addressed.
Languages 2026, 11(4), 68; https://doi.org/10.3390/languages11040068
Submission received: 13 February 2025 / Revised: 9 March 2026 / Accepted: 11 March 2026 / Published: 1 April 2026
(This article belongs to the Special Issue Advances in the Acquisition of Prosody)

Abstract

This study builds on a small body of work, all on Japanese, demonstrating how intonational phonology is critical for understanding prosodic modifications in infant-directed speech (IDS) relative to adult-directed speech. We performed similar analyses on simulated infant-directed speech vs. reading of a story in English and Bengali: two languages that – unlike Japanese – both have stress and do not use fundamental frequency (F0) to signal changes in word-level meaning, but that have two very different intonational grammars. These differences allowed us to disentangle previous hypotheses about intonational exaggeration in IDS being concentrated in a particular part of the melody. We tested hypotheses that state this locus of exaggeration is either at: the final position in the melody (final in the intonational phrase), the most unpredictable part of the melody, or in pragmatically informative tones. Our results support the first hypothesis. We found that the phonological choices of speakers to chunk the story into shorter, larger prosodic constituents drive intonational exaggeration in IDS. This is because the intonational phrase-final position in both languages is the site of greatest pre-boundary lengthening and F0 range expansion. We also demonstrate: (i) quantification of predictability in intonational melodies using probabilistic finite state automaton representations of intonational grammars and (ii) F0 statistical analyses that are robust and scalable to large, naturalistic IDS corpora.

1. Introduction and Background

1.1. Introduction

Relative to adult-directed speech (ADS), infant-directed speech (IDS) has been described as exhibiting intonational and rhythmic exaggeration: higher mean fundamental frequency (F0), higher maximum F0, an expanded F0 range, greater F0 variability, shorter utterances, slower speech rate, and longer pauses across a variety of languages (Bortfeld & Morgan, 2010; Broesch & Bryant, 2015; Fernald et al., 1989; Fernald & Simon, 1984; Kitamura et al., 2002; Stern et al., 1983; Uther et al., 2007, i.a.). These prosodic modifications and other characteristic phonetic properties of IDS (e.g., vowel space expansion; see Cristia (2013) for a review) have been hypothesized to occur because IDS is an instance of hyperspeech (Fernald, 2000; Lindblom, 1990) that simplifies and facilitates the infant’s task of learning language: adults use “a hyperspeech mode, in order to reduce phonetic variability and provide clearer exemplars for the inexperienced listener” (Fernald, 2000, p. 243).
Studies testing IDS for hyperspeech characteristics relative to ADS in different phonetic domains over the last decade have found mixed results (Cristia, 2013). They have also drawn attention to the care needed in operationalizing what “clearer”/“enhanced”/“exaggerated” speech in IDS might mean. One particular issue that has been raised—and is the focus of this paper—is the importance of considering language-specific intonational phonology and prosodic structure above the word-level. Language-specific variation in how prosody is structured above the word-level has long been a focus of research in intonational phonology, especially from the perspective of autosegmental–metrical (AM) theory taken here (Frota & Prieto, 2015; Jun, 2005, 2014; Ladd, 1996; J. B. Pierrehumbert, 1980, i.a.). AM theory, as well as other theories in prosodic phonology, assumes that speech is organized into a hierarchical structure defined over prosodic constituents (also called “phrases”, for constituents above the word-level). Constituents that are “larger” or “higher” in the hierarchy are built up from smaller ones. In the intonational analyses described in this paper, the following hierarchy of intonational constituents is assumed: intonational phrase (IP) > intermediate phrase (ip) > accentual phrase (AP). The IP is the largest constituent, while the AP is the smallest. A constituent of one category is built up of units from the immediately lower category in the hierarchy; e.g., an IP is built out of ips, which is in turn built out of APs.
AM theory conceptualizes the F0 contour as a phonetic reflex of the intonational melody: a sequence of discrete tonal elements (i.e., intonational phonological categories), drawn from a finite inventory and subject to positional (“tonotactic”) restrictions. These restrictions also depend on the phonological source of the tonal elements. Some tonal elements are prosodic boundary tones associated with different types of prosodic constituents, graphically represented with special diacritics, e.g., “%”, “-”, and “a”. These are temporally sequenced at the edges of the constituents. Other tonal elements are so-called pitch accents (marked with a “*” diacritic): these are associated with syllables or moras in a word that are specially marked in the lexicon and/or that are assigned as stressed by the phonological grammar.
The importance of considering language-specific intonational phonology and prosodic structure to understand IDS has been raised most forcefully in work on Japanese IDS vs. ADS based on the RIKEN corpus (Igarashi et al., 2013; Martin et al., 2016; Mazuka et al., 2015). Igarashi et al. (2013) showed that while F0 range did not differ significantly between Japanese ADS and IDS when measured over entire utterances (defined as spans of speech delineated by pauses of at least 200 ms), localized F0 range expansion did occur in a particular region of Japanese intonational melodies determined by discrete, phrase-final tonal elements called Boundary Pitch Movements (BPMs), largely equivalent to the IP boundary tone in descriptions of other languages. Specifically, the F0 range was greater for each type of BPM in IDS compared to ADS.
Based on these results, Igarashi et al. (2013, p. 1292) suggested that “pitch-range expansions in IDS are not realized in the same way in every language, but are instead implemented within a language-specific system of intonation. When there is a desire or pressure to exaggerate the intonation, speakers seem to do so by expanding the pitch range at the location where flexibility in varying contours is most tolerated. In phonological terms, this is the location where pragmatically chosen tones are realized. In the case of Japanese, these are BPMs at the boundaries of prosodic phrases, while in the case of English, they are not only phrase accents and boundary tones at the phrasal boundaries, but pitch accents at the locations of stressed syllables.”
This paper extends and tests the idea that intonational exaggeration in IDS is restricted to the most “flexible” parts of intonational melodies in a language, where flexibility is determined by language-specific intonational phonology. We disentangle three related but distinct hypotheses about “flexibility” which are indistinguishable in Japanese, but that make different predictions in the two languages of study here: English and Bengali.
  • Pragmatic Restriction Hypothesis. Intonational exaggeration is restricted to tones that are pragmatically chosen. Prediction: Intonational exaggeration occurs in all parts of intonational melodies in both English and Bengali.
  • Phrase-finality Hypothesis. Intonational exaggeration is restricted to the IP-final region of the intonational melody, as defined in the (language-specific) intonational grammar. Prediction: Intonational exaggeration is restricted to the IP-final region of the intonational melody in both English and Bengali.
  • Predictability Hypothesis. Intonational exaggeration is restricted to where tonal choice is most unpredictable in the intonational melody. Prediction: This cannot be determined before predictability in English and Bengali intonational melodies is assessed (Section 3, using probabilistic finite automata theoretic methods).
The notion of intonational exaggeration, too, requires operationalization. We return to this after first introducing the three hypotheses in more detail.
The Pragmatic Restriction Hypothesis arises from Igarashi et al. (2013)’s point that tonal choice at BPMs in Tokyo Japanese is determined by pragmatics and thus a locus of flexibility. For example, BPM tonal choice can indicate questioning, emphasis, or continuation. In contrast, tonal choice in other parts of the intonational melody is largely fixed by the lexicon since words in Tokyo Japanese are lexically specified as being accented or unaccented, and accents in this language are marked by just one kind of tonal melody. In both Bengali and English, pragmatic factors influence tonal choice for all parts of an intonational melody. This includes not only IP-final boundary tones, but also pitch accents and boundary tones in non-final positions (Section 1.2).
The Phrase-finality Hypothesis arises from the observation that BPMs in Tokyo Japanese are not only pragmatically determined but also positionally special in being phrase-final. In fact, BPMs typically mark the end of the largest kind of prosodic constituent defined in the intonational analysis of Tokyo Japanese followed in Igarashi et al. (2013): the intonational phrase (IP) (Maekawa et al., 2002; Venditti et al., 2008).1 IP-final position has been identified as being a locus of perceptual salience for speech melodies; e.g., fundamental frequency peaks in IP-final position are perceived as higher in pitch than earlier peaks with the same f0 (Gussenhoven & Rietveld, 1988). Across many languages, IP-final position has also been identified as the site of rich inventories of tonally signaled pragmatic distinctions, i.e., in so-called nuclear contours, where “nuclear” refers to IP-final position (Frota et al., 2007; Frota & Prieto, 2015; Gussenhoven, 2004; Jun, 2005, 2014; J. Pierrehumbert & Hirschberg, 1990).
BPMs are not only pragmatically chosen, as well as phrase-final, but also the point in an intonational melody in Tokyo Japanese where speakers have the greatest number of tonal choices available. The Predictability Hypothesis isolates this aspect of “flexibility” noted by Igarashi et al. (2013)—the number of tonal choices available at a given point in the melody—but generalizes to a more elaborate definition of predictability (Section 3). Separating out tonal choice (Predictability Hypothesis) from the grammatical source of a tone (Pragmatic Restriction Hypothesis) is important because languages can have a large inventory of tonal choices available, not just due to pragmatics, e.g., due to a rich inventory of lexical and/or grammatical tones, or associated with other communicative functions that some researchers might not classify as pragmatics.
To build intuition for the Predictability Hypothesis, let us first consider Igarashi et al. (2013)’s simpler “flexibility” definition. Taking “flexibility” as our measure of predictability, the Predictability Hypothesis says that intonational exaggeration is restricted to the most “flexible” region of an intonational melody, i.e., the part where the speaker has the most tonal choices. What do we mean by a region or part of the melody? This can be formalized with a finite state automaton (FSA) diagram as a representation of the intonational grammar for a language. By the language-specific “intonational grammar”, we mean a finite device that generates exactly and only the licit intonational melodies in the language (J. B. Pierrehumbert, 1980). Choice points in the intonational melody are represented as “states”. Finite state automata and related formalisms have been used to characterize well-formed tonal sequences in intonational grammars, from the early days (J. B. Pierrehumbert, 1980, p. 29) to more recent work (Dainora, 2001, 2002, 2006; Gussenhoven, 2004, pp. 273, 313, 2016, p. 29; Igarashi et al., 2013).
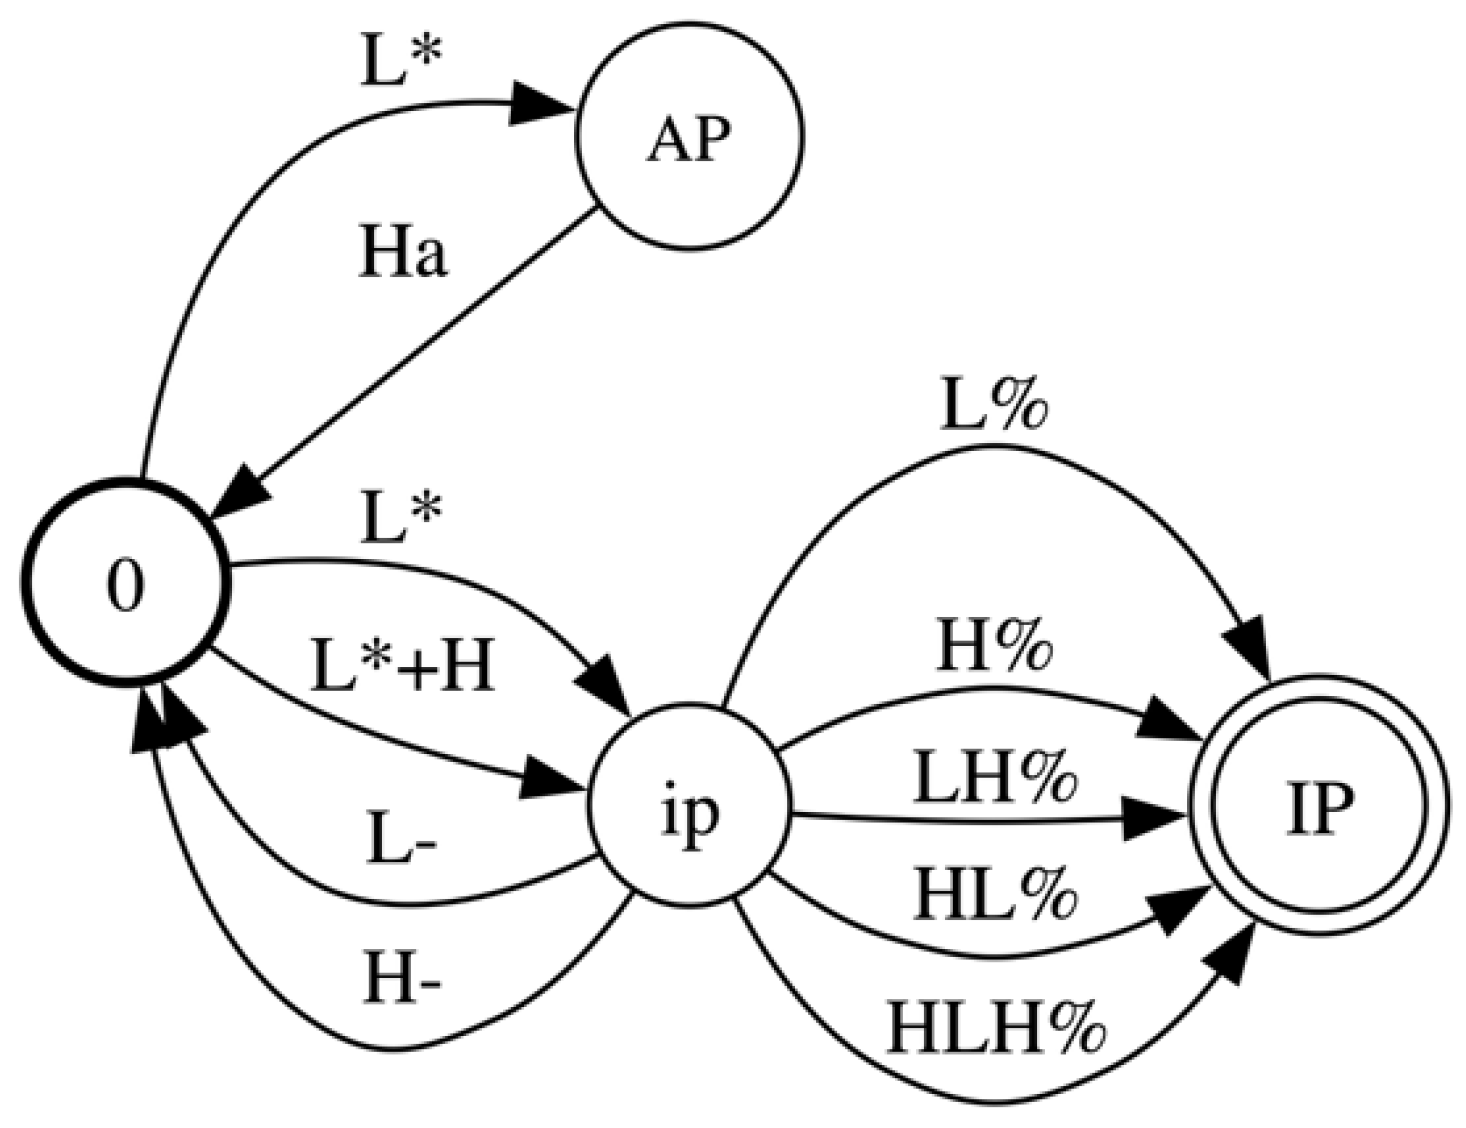
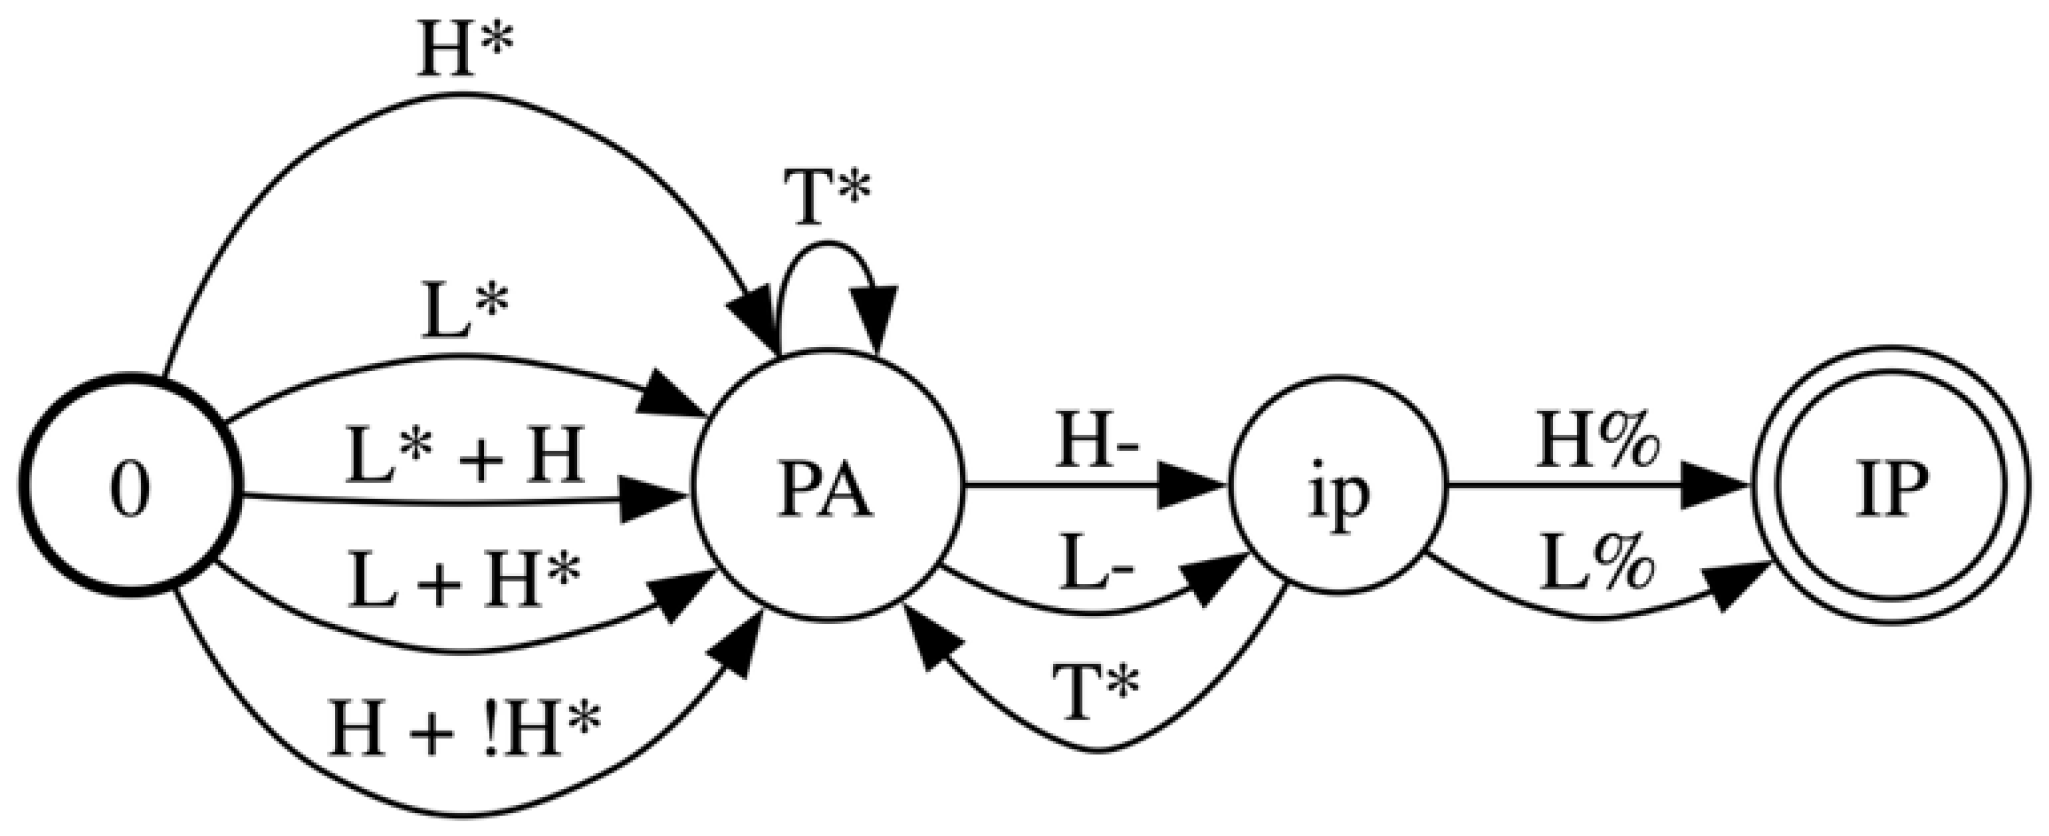
Figure 1 represents a very simplified fragment of the intonational grammar of Bangladeshi Standard Bengali (Khan, 2008, 2014)—henceforth simply “Bengali”, also known as “Bangla”—as an FSA for expository purposes. The full intonational grammar of Bengali, including its inventory of tones like “L*”, “HLH%”, etc., is explained in detail in Section 1.2.2. For now, what is important is simply the topology of the FSA in Figure 1: its states (drawn as circles) and the directed arcs representing possible transitions between them. The set of licit intonational melodies over an IP based on the intonational grammar represented in Figure 1 is the set of tonal sequences that can be generated on a path from the start state “0” (thickly outlined) to the final “IP” state (doubly outlined). For example, “L* L%” is generated on the path from State “0” to State “ip” to State “IP”. Each transition arc from one state to another represents a tonal choice the speaker can make in generating a melody. For example, at State “ip”, the speaker has seven choices. They can choose to end the intonational melody by choosing one of five different IP boundary tones (L%, H%, LH%, HL%, or HLH%) or to continue the intonational melody by choosing one of two ip boundary tones (L-, H-). But at State “AP”, there is only one choice: “Ha”. The greatest flexibility in the intonational grammar is at State “ip”.2 Thus, under the “flexibility” definition of predictability, the Predictability Hypothesis says State “ip”—the choice point for ip/IP boundary tones—is where intonational exaggeration in IDS is expected to occur according to the intonational grammar defined in Figure 1.
Having introduced the three hypotheses about the scope of intonational exaggeration in a melody, we turn to the operationalization of intonational exaggeration itself. Igarashi et al. (2013, p. 1292)’s quote about “flexibility” from above refers to intonational exaggeration specifically as pitch range (or F0) expansion. How to operationalize F0 range expansion via phonetic measures is itself an issue (Section 6), but from the perspective of intonational phonology, intonation has other acoustic reflexes besides variation in F0. The tonal choices in an intonational melody that cause F0 variation are also simultaneously choices about prosodic structure: how to phrase speech into intonational constituents. These phrasing choices are also reflected in durational patterns—most importantly, for this paper, pre-boundary lengthening concentrated at the right edge of intonational constituents. The degree of pre-boundary lengthening increases for constituents higher and higher in the hierarchy: pre-boundary lengthening is greatest at the right edge of IPs (Byrd, 2000; Byrd & Saltzman, 1998; Cambier-Langeveld, 2000; Gussenhoven & Rietveld, 1992; Khan, 2008; Klatt, 1975; Krivokapić, 2014; Wightman et al., 1992).
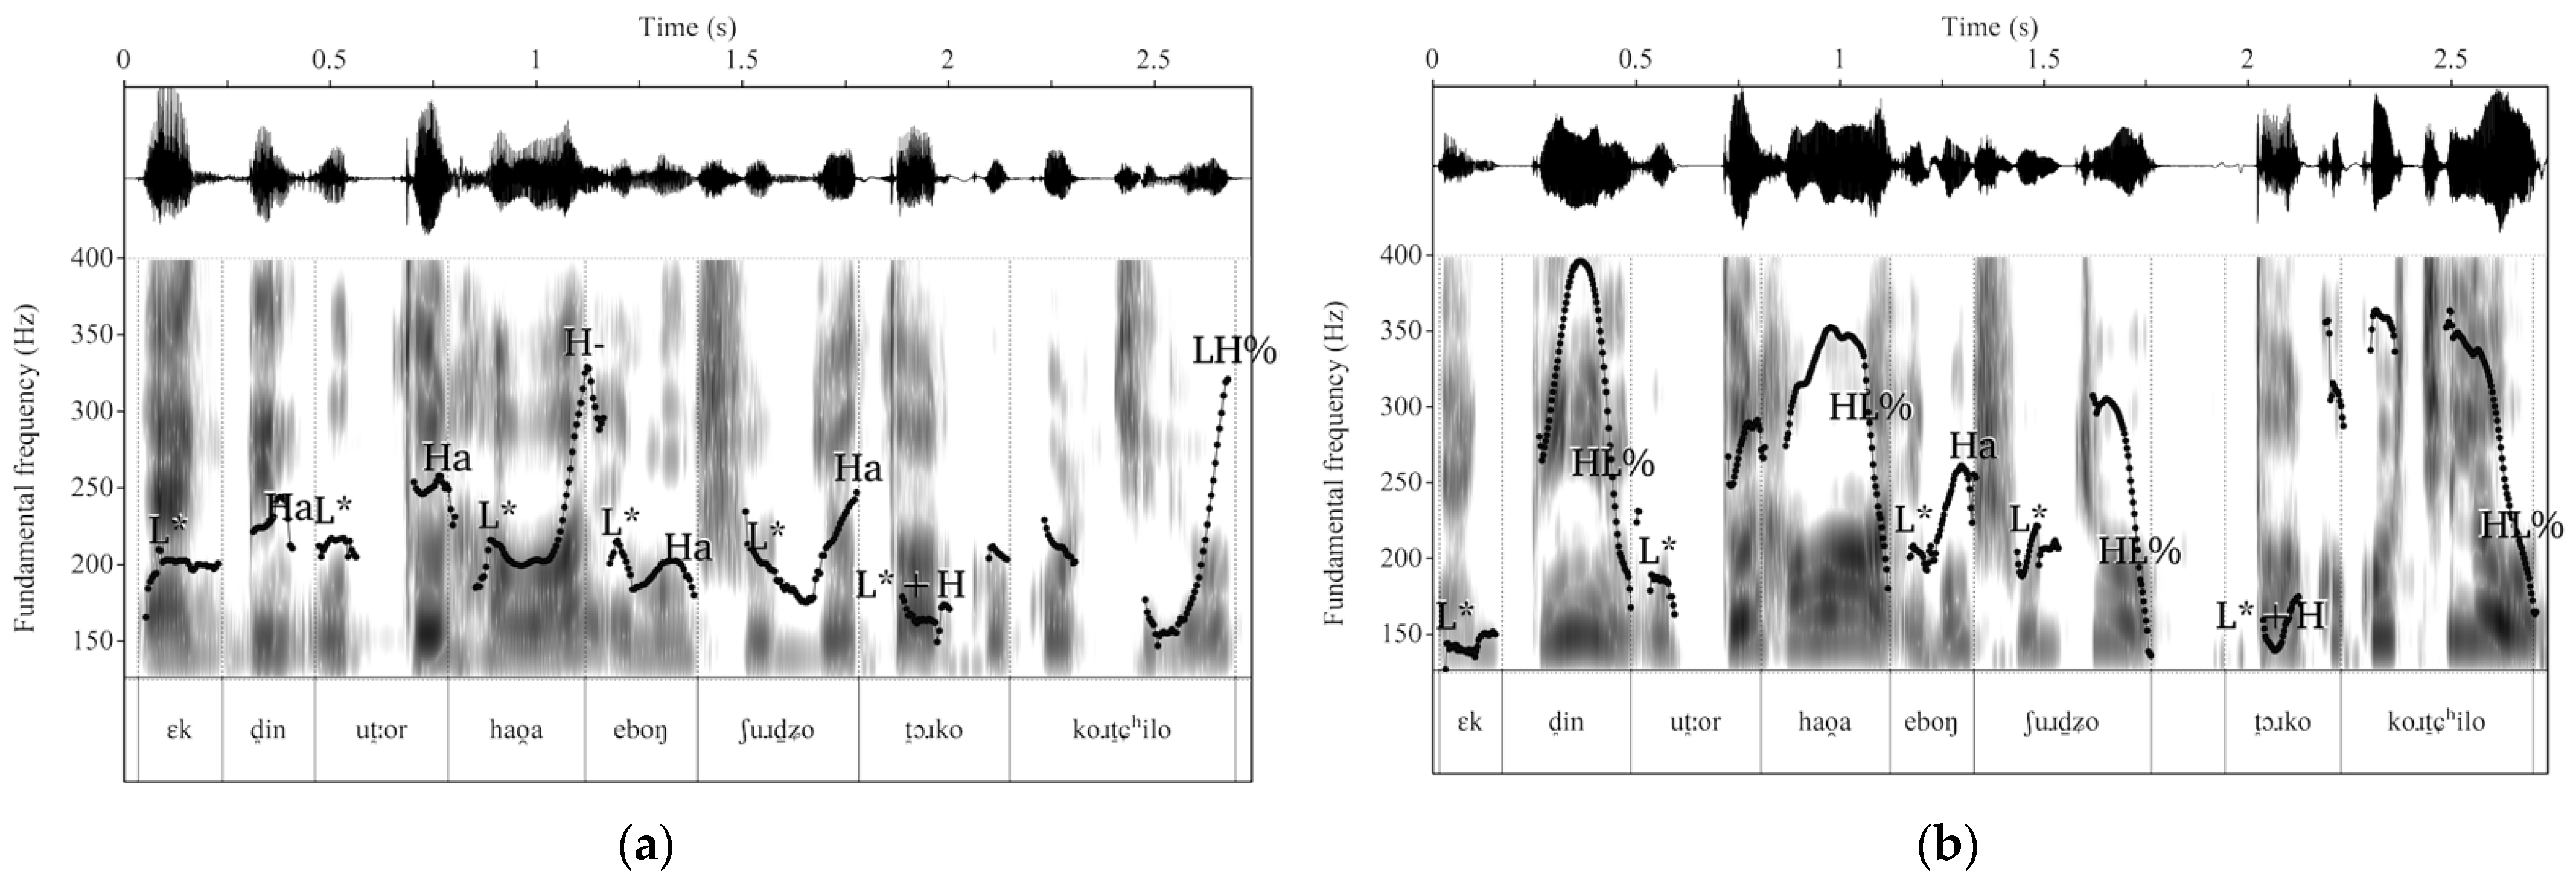
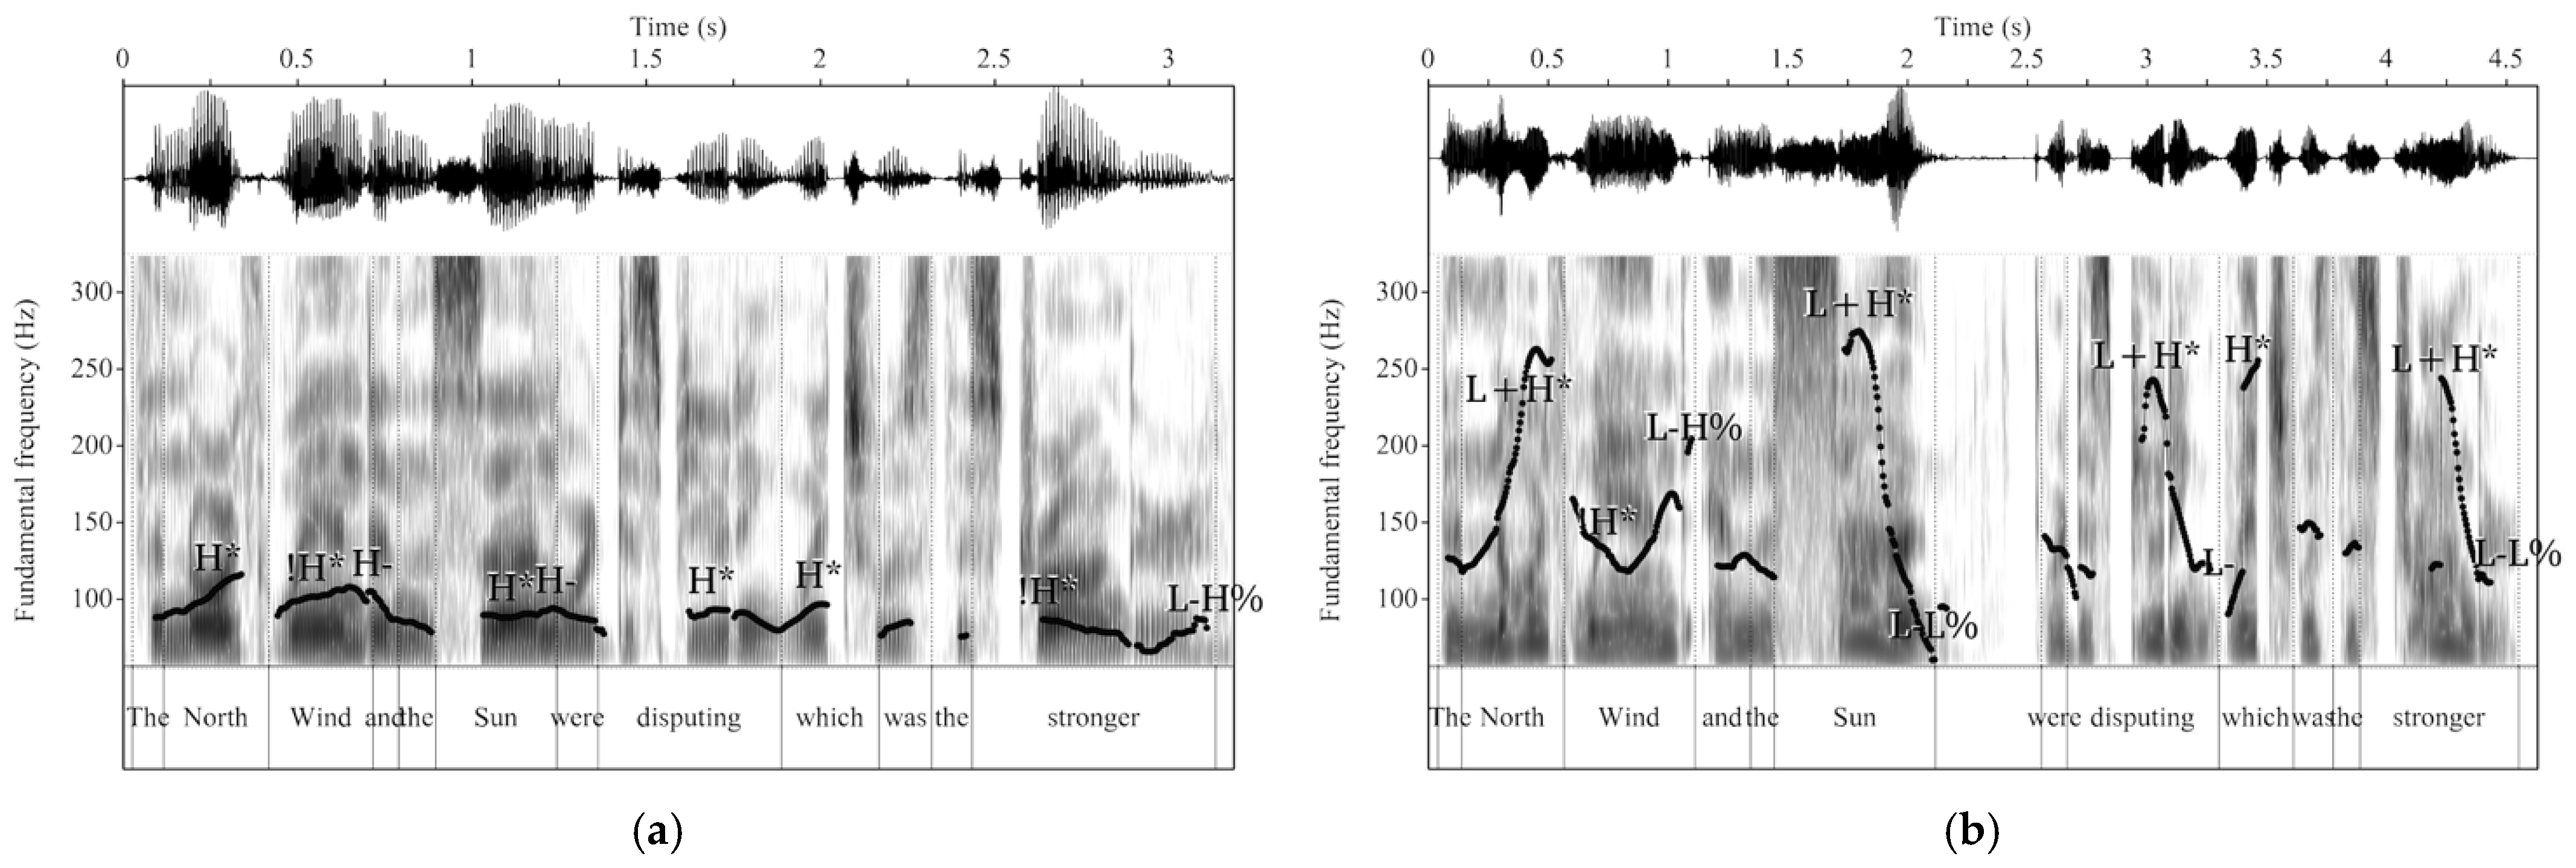
An example from our recorded speech corpus of how tonal and phrasing choices go hand-in-hand and can shift together as a function of speech style is given in Figure 2 and Figure 3. Figure 2 shows F0 contours, waveforms, spectrograms, and intonational transcriptions for the first several words in two renditions of the fable The North Wind and the Sun (Khan, 2010) produced by the same speaker first in (a) read speech and then in (b) simulated infant-directed speech. The intonational melody/melodies chosen by the speaker for each rendition can be read off as the sequence of leaves of the trees in Figure 3. Figure 3 also shows how the choice of tones implies the choice of phrasing. The choice of an AP boundary tone at the right edge of [ɛk d ̪ in] in Figure 2a and Figure 3a is also the choice to phrase [ɛk d ̪ in] as the smallest intonational constituent, an AP. The choice of an IP boundary tone at the right edge of [ɛk d ̪ in] in Figure 2b and Figure 3b is also the choice to phrase [ɛk d ̪ in] as the largest intonational constituent, an IP. F0 range expansion, as well as pre-boundary lengthening in the IP [ɛk d ̪ in], is also visible in Figure 2b, relative to the AP [ɛk d ̪ in] in Figure 2a.
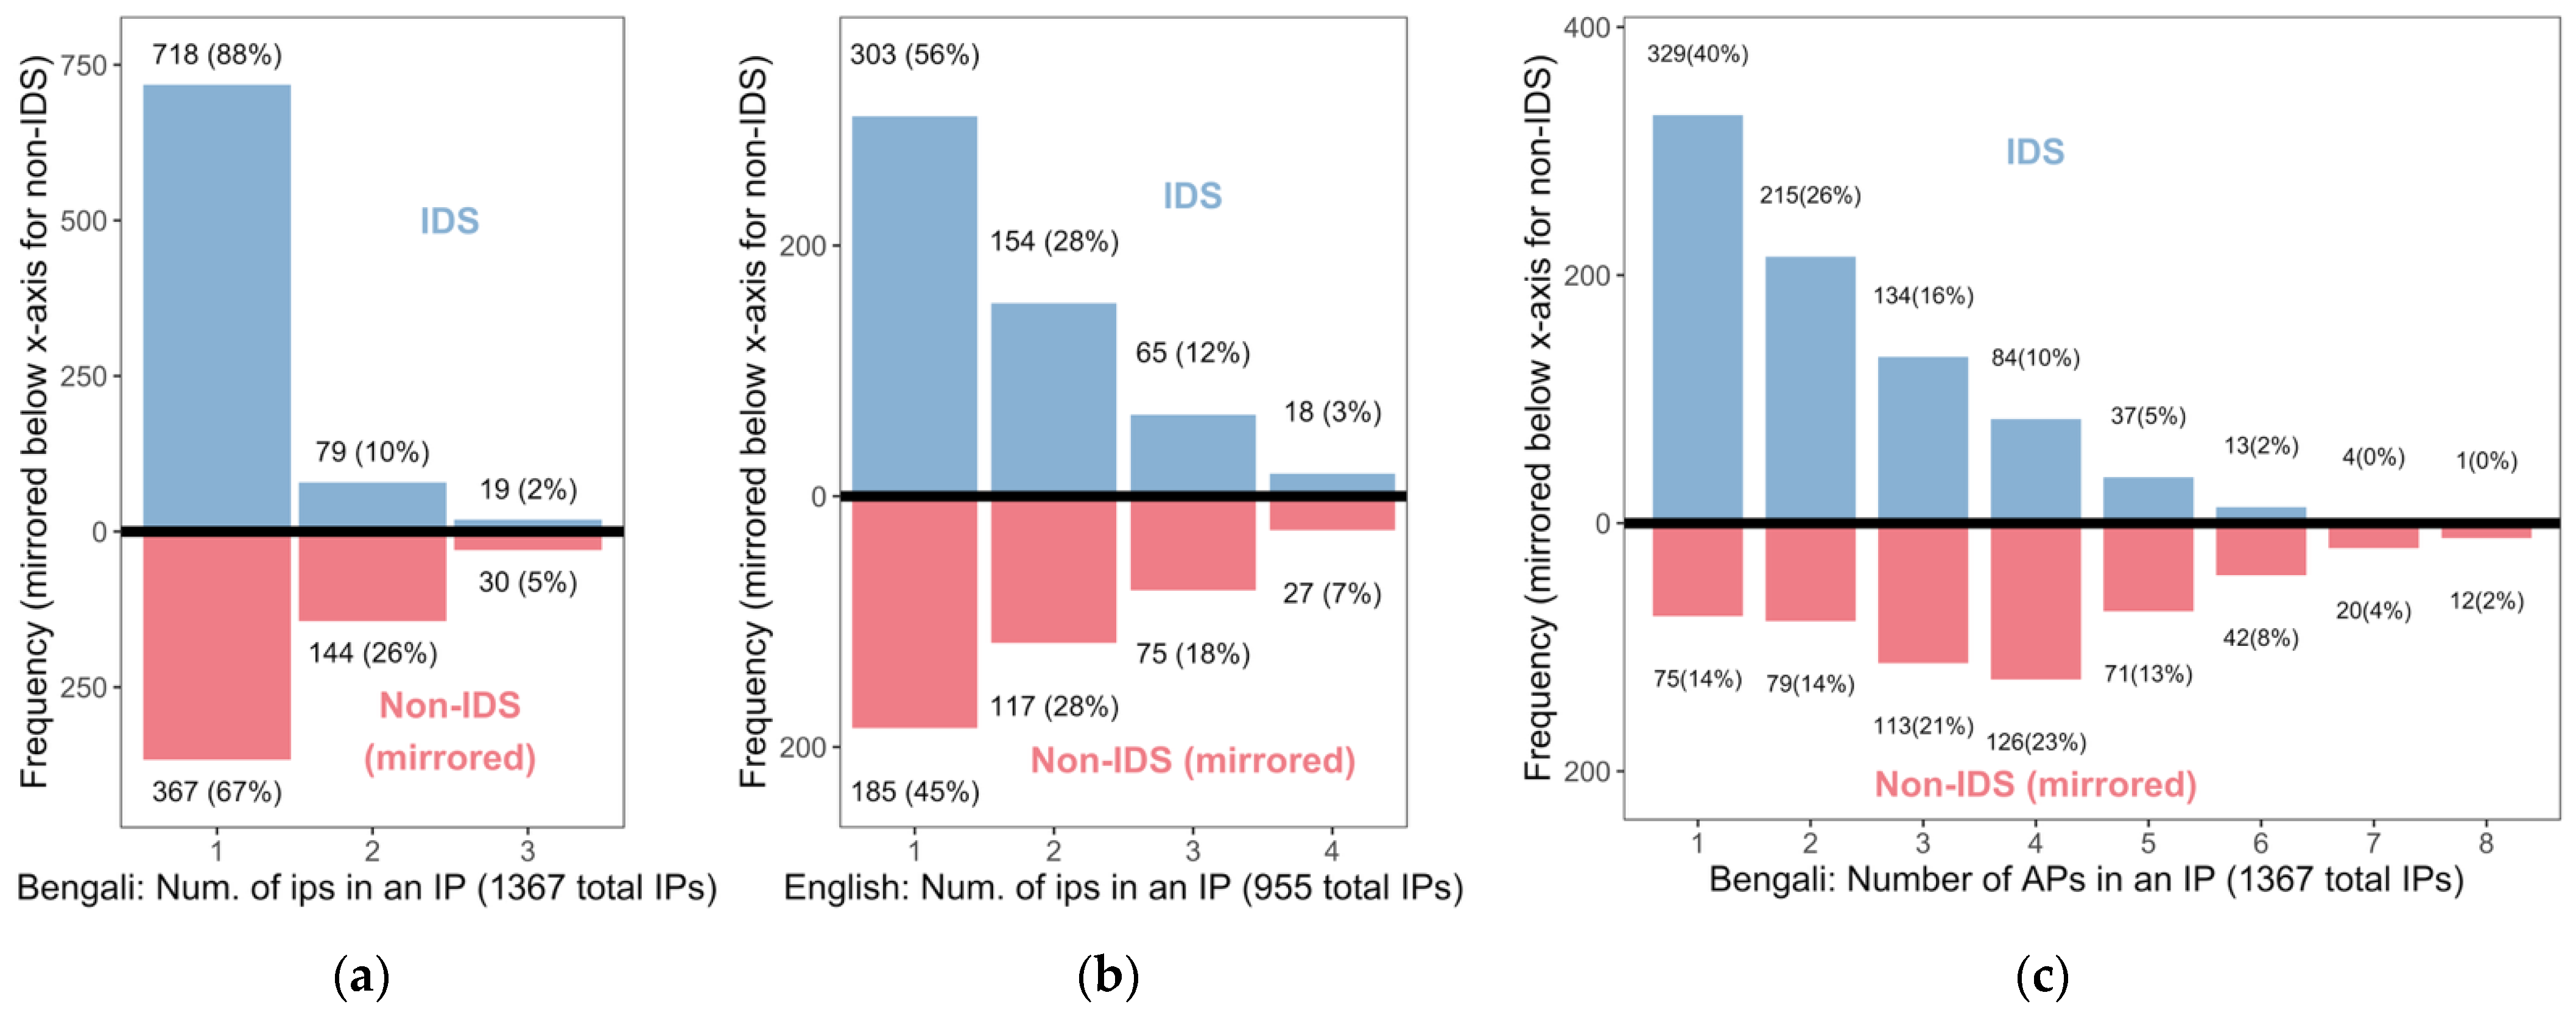
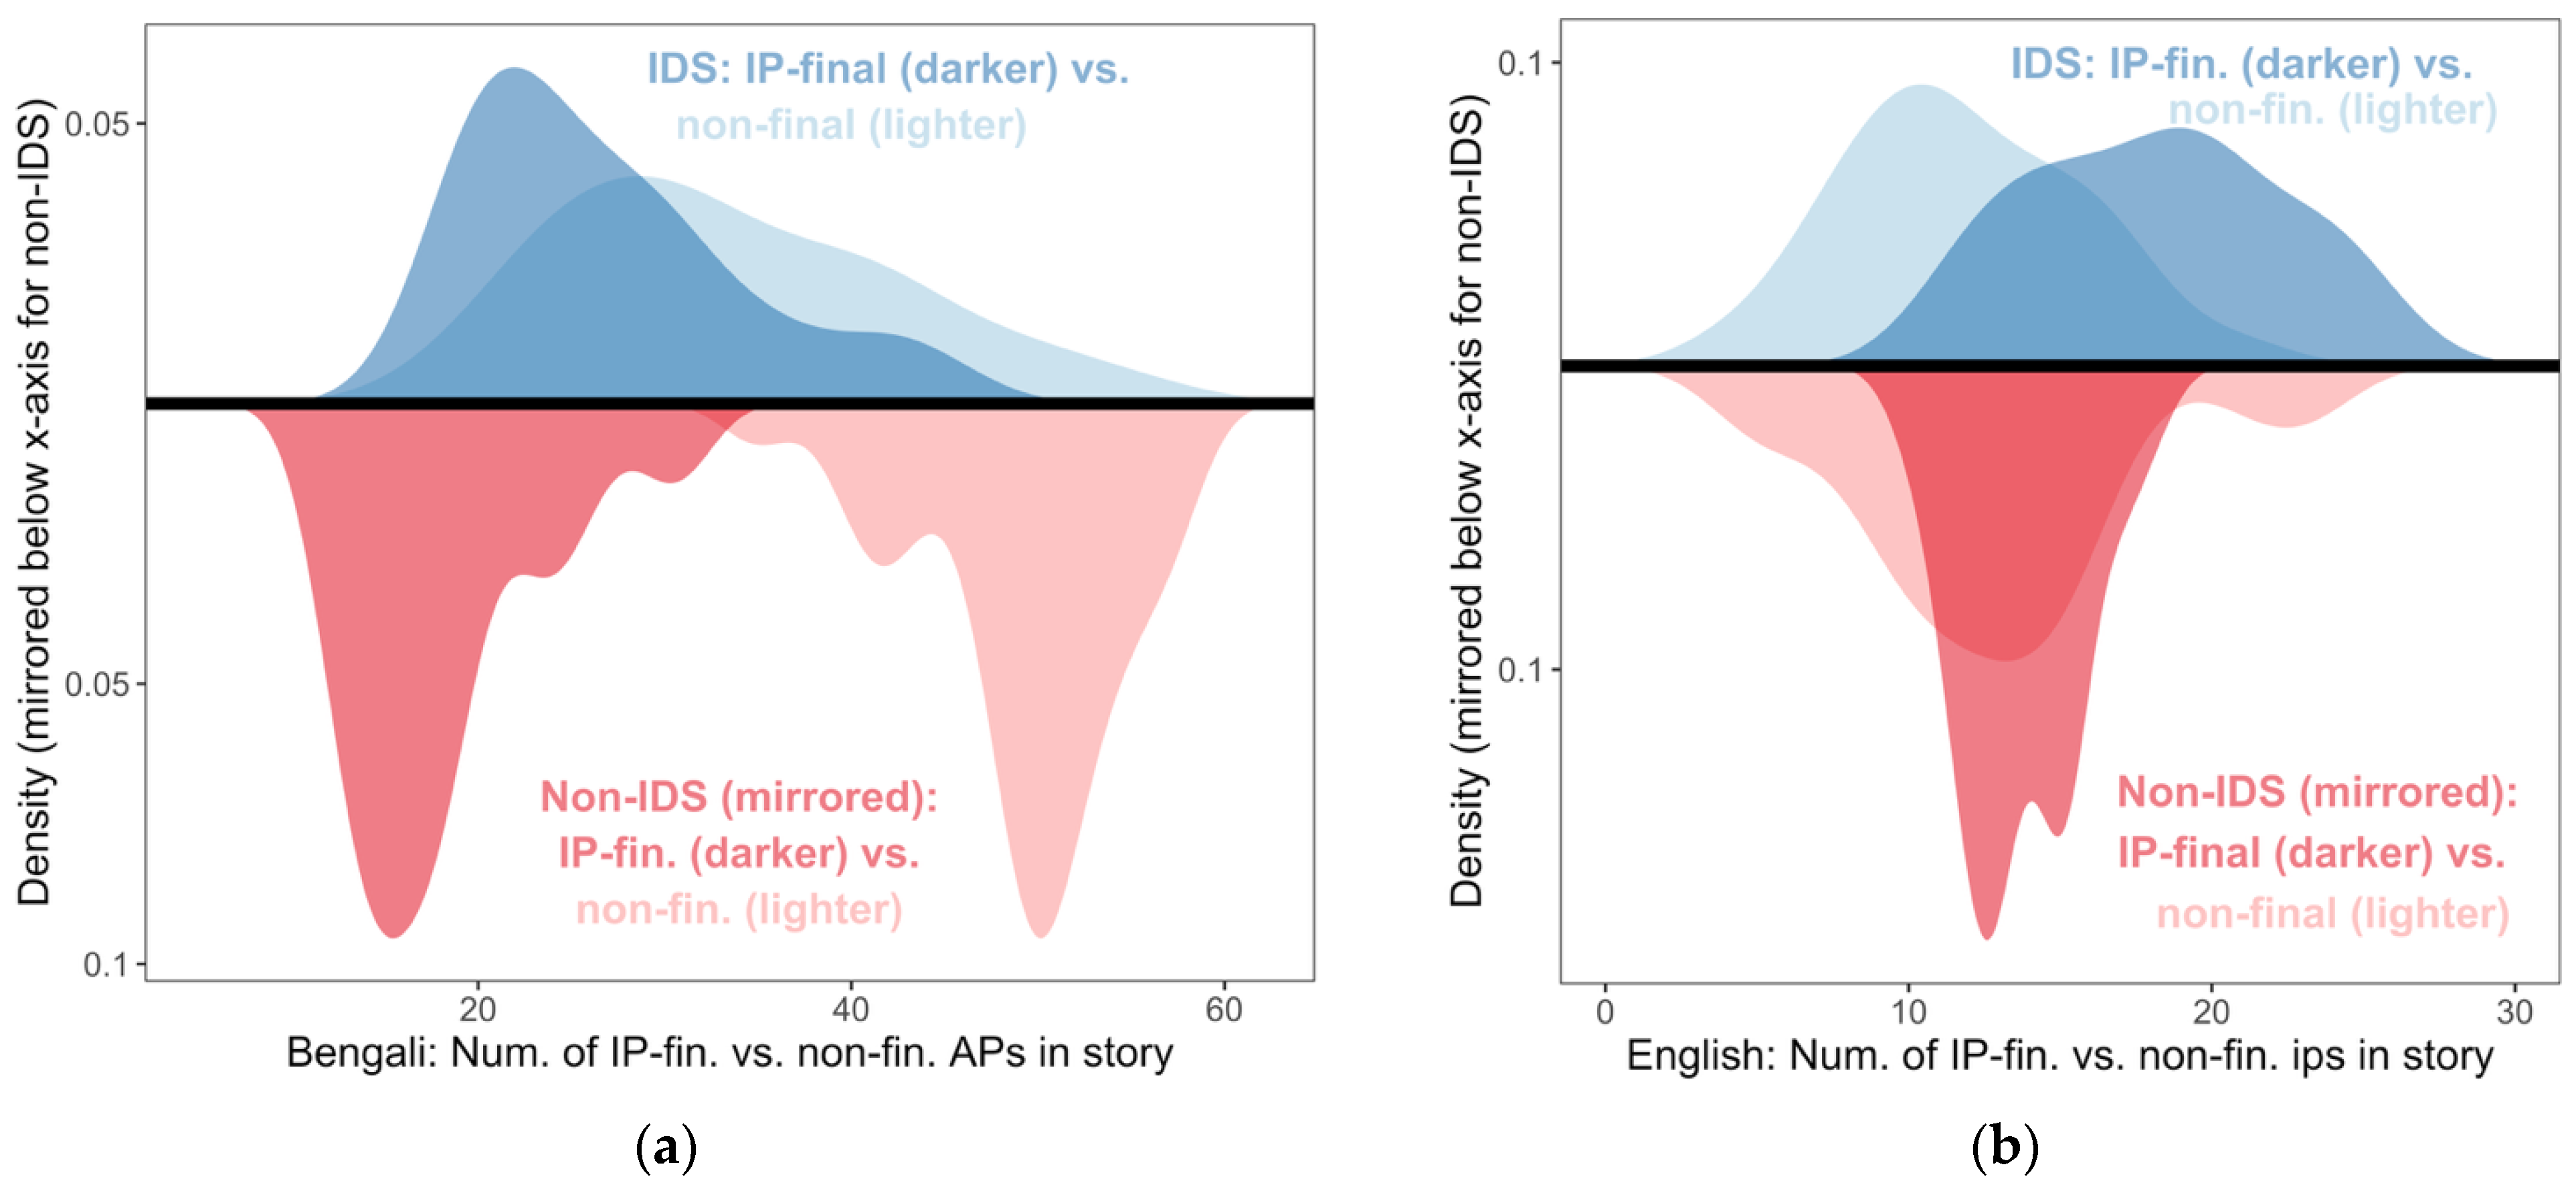
In this paper, we examine intonational exaggeration in IDS via lengthening as well as F0 range expansion. We probe the claim that, cross-linguistically, speech rate is slower in IDS (Fernald et al., 1989, i.a.). It is not only the case that F0 range expansion in IDS is restricted to IP-final BPMs in the Japanese RIKEN corpus (Igarashi et al., 2013): lengthening is also restricted to IP-final and other phrase-final positions. Martin et al. (2016) showed that an ostensibly globally lower average speech rate in IDS in the same corpus was in fact purely a consequence of the pre-boundary lengthening of phrase-final words. That is, the duration increase was solely attributable to the categorical, phonological differences in speakers’ choices in chunking speech into prosodic constituents. This is an instance of intonational exaggeration that is the consequence of phonological choices. First, moras that were AP-, IP-, or utterance-final were all significantly longer than AP-medial moras. Second, the likelihood of a word to be phrase-final was higher in IDS; i.e., speakers chose to phrase words in IDS into shorter and larger intonational constituents. There were thus more words subject to the largest degrees of pre-boundary lengthening. Put another way, from a statistical point of view, slowing down in IDS was a consequence of two main effects: (i) a main effect of speech style on the number of utterances, IPs, and APs (an increased number of these chunks, and thus phrase-final positions in these chunks, in IDS) and (ii) a main effect of phrase-finality on mora duration (increased duration in phrase-final positions).
However, the increase in average mora duration in phrase-final words was not larger in IDS relative to ADS. More specifically, the degree of pre-boundary lengthening within a particular prosodic category, i.e., an AP, IP, or utterance, was not significantly different between IDS and ADS. That is, the interaction between speech style and prosodic category was not significant in modeling mora duration. Another way to characterize this negative result in more general terms is the following: Martin et al. (2016) found no evidence of intonational exaggeration that is the consequence of a within-category change in the phonetic implementation of a particular phonological choice.
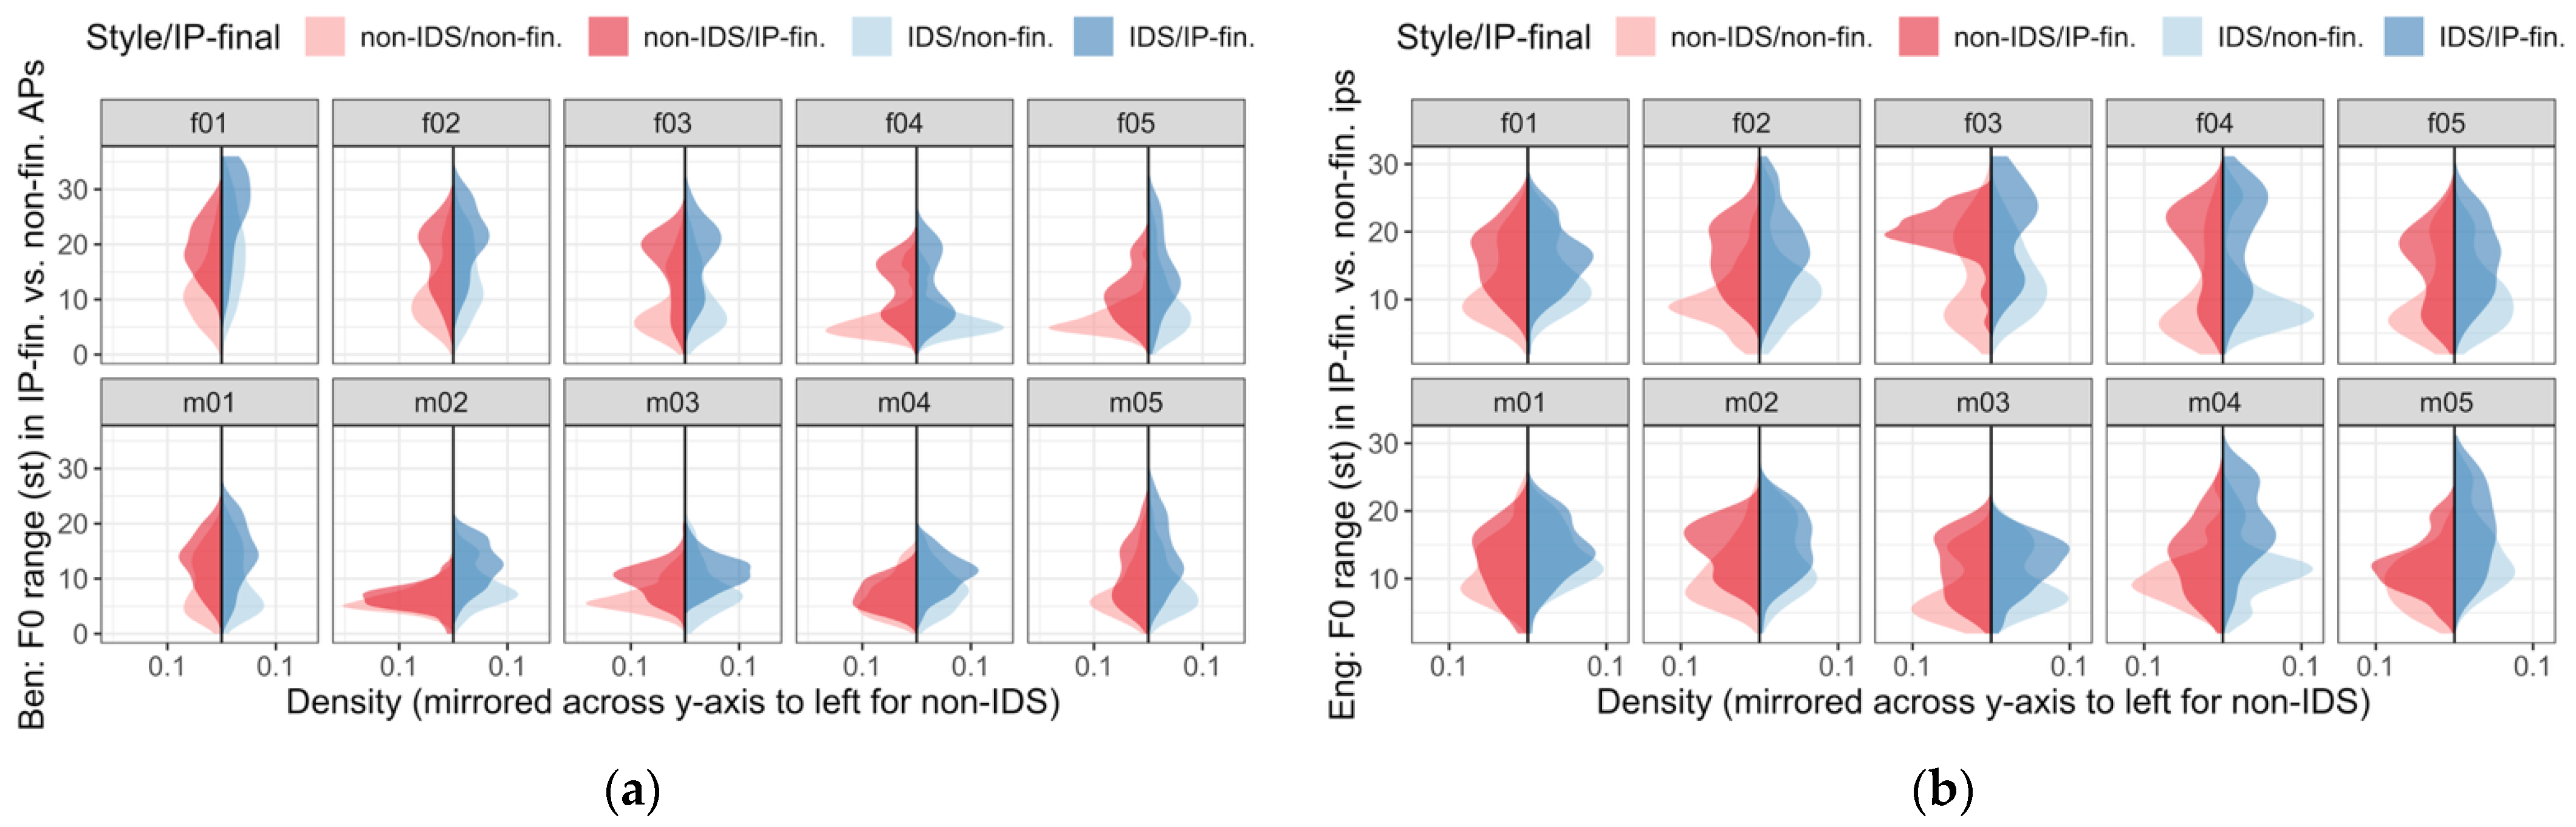
But an example of precisely this kind of within-category intonational exaggeration is Igarashi et al. (2013)’s finding of F0 range expansion in IDS within a particular BPM type; see Table I in Igarashi et al. (2013). Igarashi et al. (2013) also present evidence consistent with F0 range expansion that is the consequence of phonological choices. First, F0 range is significantly increased in IDS vs. ADS in BPMs (but seemingly3 not in non-BPM regions). Second, Martin et al. (2016)’s results on the same corpus imply that speakers chose to increase the number of BPMs in IDS (since they increased the number of IPs, and a BPM occurs at the end of each IP). Therefore, choosing to increase the number of BPM sites in IDS increased the number of F0 range expansion sites.
Conceptualizing intonational exaggeration as arising from potentially distinct sources—(i) phonological choices vs. (ii) within-category changes in phonetic implementation—is only possible when data is phonologically transcribed. Both kinds of intonational exaggeration are conditioned on intonational phonological categories. There has been a growing body of work on how the prosodic profile of a language (i.e., if the language has lexical tonal contrasts, lexical accents, or stress) might affect phonetic manipulations in IDS (Wang et al., 2016). But to our knowledge, Igarashi et al. (2013) and Martin et al. (2016)’s studies of the Japanese RIKEN corpus are the only analyses of F0 variation and duration in IDS that are informed in detail by intonational phonology in the literature. Even for English,4 to our knowledge, any work on IDS referring to intonational phonology is scant. Thorson and Morgan (2014b) and Thorson et al. (2023) considered pitch accent categories, H* and L+H* (see Section 1.2.1), that have been proposed in American English. They showed that 18-month-olds had longer looking times for referents when words were uttered with F0 contours that were H*-like (F0 peak) and L+H*-like (F0 peak with a clear preceding valley), relative to those uttered with flat, low F0. Besides this work, work on English IDS that has considered intonational categories has defined those categories in terms of F0 contour shapes (e.g., bell shapes, sinusoidal shapes, hills, valleys, and waves). This work has also focused on highlighting words for word learning and the expression of socioaffective intent and emotional categories like surprise, anger, comfort, prohibition, and bids for attention (Fernald, 1989; Fernald & Kuhl, 1987; Fernald & Mazzie, 1991; Katz et al., 1996; Nencheva et al., 2021; Papoušek et al., 1990; Stern et al., 1982, 1983; Trainor et al., 2000; Werker & McLeod, 1989).
Systematic properties of F0 contours can certainly correlate with socioaffective intent and emotions, even perhaps universally across languages, e.g., Gussenhoven (2002). However, reducing the role of intonation in IDS to the utility of particular F0 movement shapes for word learning and communicating socioaffective intent misses two important issues. First, phonological structure above the word-level—including language-specific intonational grammar—is itself a target of language acquisition. Second, the phonological prosodic choices available to a speaker constrain possible F0 movements. Those choices depend on a language’s intonational grammar, so cross-linguistic work that samples different kinds of intonational grammars is necessary to understand F0 and other prosodic manipulations in IDS.
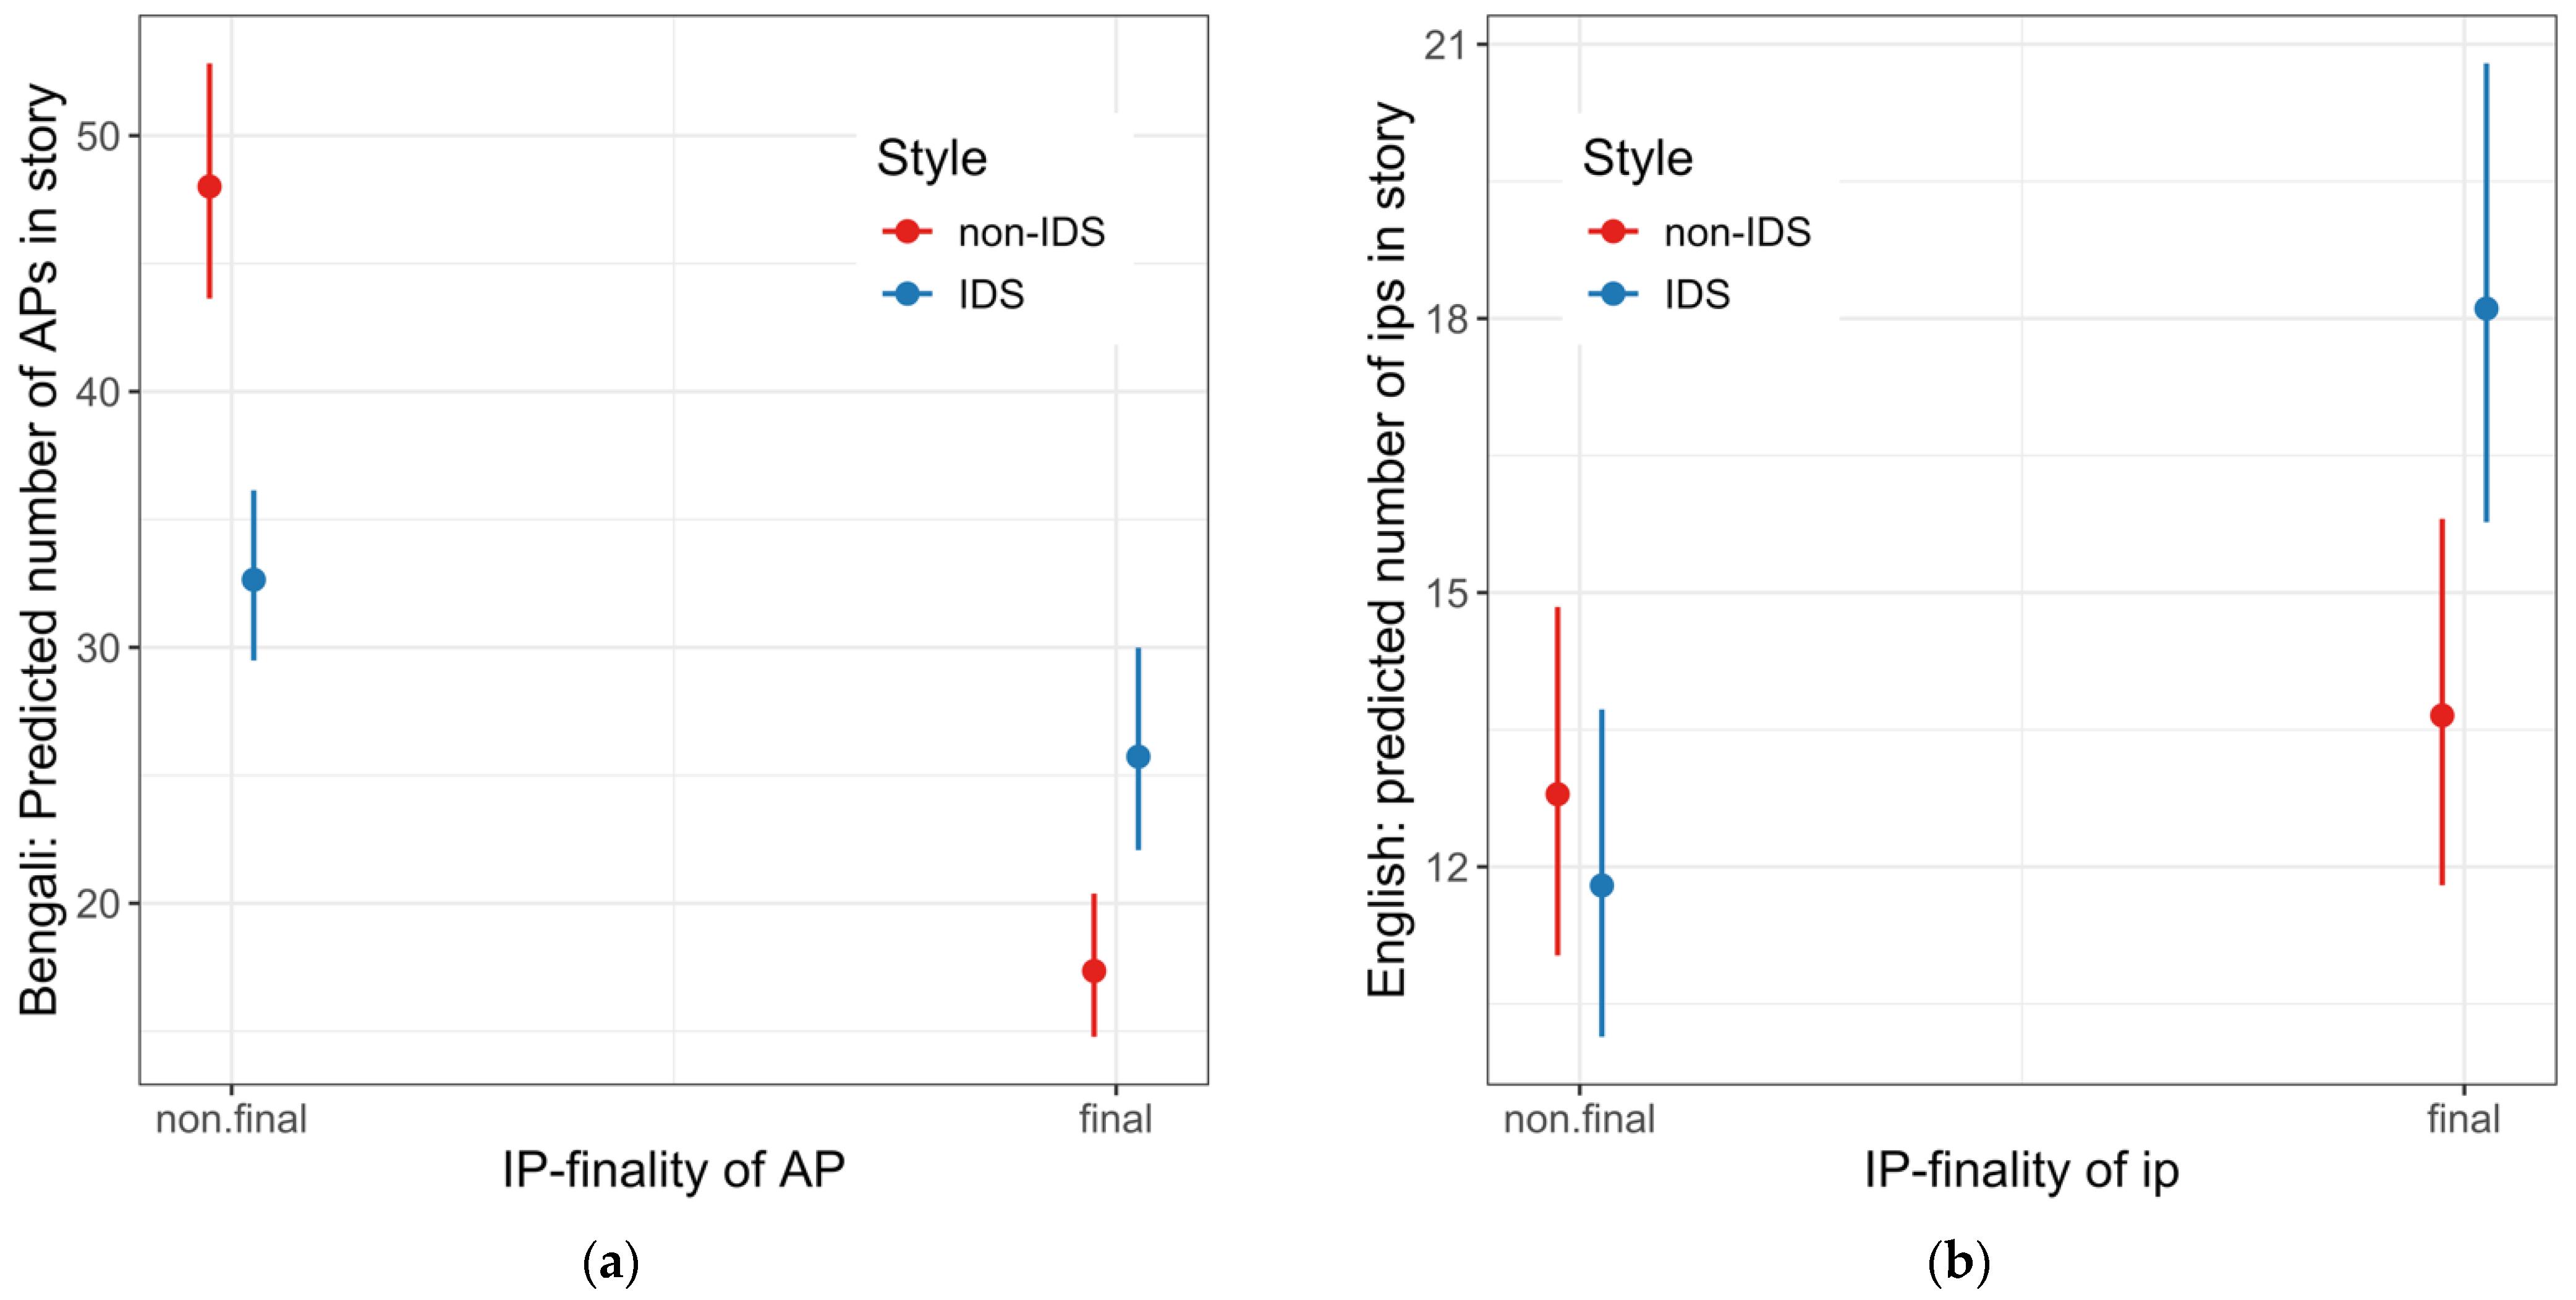
In this paper, we highlight intonational exaggeration that is the consequence of phonological choices, which yielded the clearest results in our study. For this type of intonational exaggeration, Table 1 summarizes expected predictions for each of the three hypotheses. (We also discuss intonational exaggeration that is the consequence of within-category changes in phonetic implementation in Section 7). Each prediction is divided into two types of effects: (i) the effect of speech style on phonological category choice and (ii) the effect of phonological category choice on phonetic implementation that is independent of speech style. The Phrase-finality and Predictability Hypotheses demand that both types of effects are present. In Table 1, we also further operationalize “region” in “IP-final region” for the Phrase-finality Hypothesis in terms of the smallest intonational constituent in the grammar: the atomic intonational chunk. For Bengali, this is the AP; for English, it is of a larger size: the intermediate phrase (ip, see Section 1.2.1). Choosing the atomic chunk to be IP-final in either language implies choosing an IP-boundary tone as opposed to a pitch accent or boundary tone associated with a non-final, smaller constituent.
The Pragmatic Restriction Hypothesis, at least for Bengali and English, predicts the lack of specificity in the locus of intonational exaggeration across the IP, rather than singling out a particular part of the intonational melody. It thus does not have the same kind of two-part prediction as the other hypotheses. Rather, a preference of the speaker between IP-final and non-final regions in IDS, i.e., an interaction between Style (the factor indexing speech style in our experimental design) and IP-finality in phonological category choice, is one way to be inconsistent with the hypothesis. Another way would be to have an interaction between Style and IP-finality in the phonetic implementation of intonational exaggeration.
Since the Phrase-finality Hypothesis predicts an increased likelihood of atomic chunks to be IP-final in IDS relative to non-IDS, while the Pragmatic Restriction Hypothesis predicts no such increase, their phonological category choice predictions are mutually exclusive. Whether the main effects predicted by the Phrase-finality Hypothesis and those by the Predictability Hypothesis are mutually exclusive depends on what the most unpredictable region of the intonational melody is. For example, to preview Section 3, it turns out that the most unpredictable region of the melody in Bengali is in IP-final APs. Thus, the Predictability Hypothesis for Bengali is in fact identical to the Phrase-finality Hypothesis. On the other hand, suppose that the most unpredictable region of the melody in Bengali had been instead non-final APs. In that case, the Phrase-finality and Predictability Hypotheses would have been mutually exclusive for Bengali. To preview our results, the only hypothesis supported across both languages is the Phrase-finality Hypothesis.
Besides the general empirical goal of expanding cross-linguistic coverage of work approaching IDS using perspectives from intonational phonology, the methodological goals of this paper are to provide proof-of-concept demonstrations of (i) how to approach phonological characterizations of intonational melodies in IDS using computational tools and (ii) how to extend characterizations of IDS in terms of acoustic measures of F0 to large corpora of naturalistic, long-form recordings. Overall, we seek to encourage infant speech researchers who are less familiar with intonational phonology to incorporate the concepts and structure of this approach in future work on IDS. Taking IDS as a case study of a context where intonational exaggeration occurs, the concepts and methods we introduce in this paper are also more generally applicable beyond IDS.
The rest of this introductory section concludes with a background sketch of the most relevant aspects of the intonational phonology of English and Bengali for the paper (Section 1.2). We follow with a general methods section in Section 2 that describes the construction and data processing of our corpus, as well as common choices across statistical analyses. Methodological details specific to a particular analysis are provided within the relevant section. Section 3 explicates our definition of predictability in an intonational melody and determines where the most unpredictable choice points in the melodies are in English and Bengali, based on data from our corpus. Section 4 analyzes the effect of speech style on phrasing choices. The next two sections evaluate the three hypotheses about the scope of intonational exaggeration, with intonational exaggeration operationalized in terms of lengthening (Section 5) and F0 range expansion (Section 6). Section 7 provides a general discussion and conclusion.

1.2. Intonational Phonology in English and Bengali

We explored IDS in two languages with published intonational phonological models available: Mainstream American English (Section 1.2.1) and Bangladeshi Standard Bengali (Section 1.2.2). These two languages share a lack of lexical tone or lexical pitch accent, but beyond this they diverge in inventory, hierarchy, tonotactics, and uses of intonational tones. We highlight the crucial similarities and differences in the intonation of the two languages directly in Section 1.2.3.

1.2.1. English Intonational Phonology

For English, we adopt the Mainstream American English Tones and Break Indices (MAE_ToBI) transcription system (M. E. Beckman et al., 2005; M. Beckman & Pierrehumbert, 1986; J. B. Pierrehumbert, 1980). In MAE_ToBI, pitch accents are borne by the primary stressed syllable of prominent words, whose stress is contrastive (unlike in Bengali) and thus must encode lexical information. The diverse pitch accent inventory of English includes default H* (high) and L* (low) tones as well as rising L+H* (early rise) and L*+H (late rise) tones and one falling H+!H* tone. The choice has been claimed to be related to attitude, focus status, and tonal environment (Dainora, 2002, 2006; J. Pierrehumbert & Hirschberg, 1990). The choice of pitch accent is somewhat variable, although certain tune–meaning relationships have been proposed in the literature: for example, L+H* and L*+H often convey focus (J. Pierrehumbert & Hirschberg, 1990).
Boundary tones occur at the right edge of intonational phrases (IPs), indicated with a “%” diacritic, and intermediate phrases (ips), indicated with a “-” diacritic. For non-IP-final ips, this boundary tone can be low L-, high H-, or downstepped high !H-. In IP-final position, the ip boundary tone and IP boundary tone stack together to form a complex combination of the two (unlike Bengali); this stacked ip-IP tone inventory includes L-L% (low falling), H-H% (high rising), L-H% (low rising), H-L% (high level), and !H-L% (downstepped high level), the choice of which can convey sentence type, finality, etc. (J. Pierrehumbert & Hirschberg, 1990).5 An FSA representation of the intonational grammar is given in Figure 4. To keep the figure from being too cluttered, we have represented the five possible pitch accents as “T*” in two places.6 As a reminder from Section 1.1, the set of licit sequences is that which can be generated on a path from the start state “0” (thickly outlined) to the final “IP” state (doubly outlined). Each transition from one state to another represents a choice the speaker makes in generating a melody over the IP. For instance, the sequence “H* L* L-L%” can be generated by a path from State “0”, transitioning over the arc labeled “H*” to the “PA” state (PA for “pitch accent”), then over the “T*” looping arc to stay in the “PA” state, then over the “L-” arc to the “ip” state, and then over the “L%” arc to the “IP” final state.

1.2.2. Bengali Intonational Phonology

We used the intonational phonological model of (Bangladeshi Standard) Bengali7, known as B-ToBI (Khan, 2008, 2014), part of the Intonational Transcription of South Asian Languages (InTraSAL) system (Khan, 2016, 2018, 2019, 2020). In B-ToBI, approximately each content word can bear one of seven pitch accents on its initial syllable; the inventory includes default L* (low), H* (high), L*+H (low rising), L+H* (rising high), as well as “f-marked” versions of the latter three, fH* (extra high), L*+fH (low rising to extra high), and L+fH* (rising to extra high), the choice of which is related to speaker attitude, focus status/type, and tonal environment. Weak accents (*) can also appear in narrow focus contexts, e.g., due to post-focal tone compression. The f-marked tones are named as such because they are associated with focus, although the decision to transcribe a tone as f-marked is guided by phonetic and phonological features of the pitch contour (enumerated in Khan, 2014, pp. 101–113) rather than by pragmatic context: all f-marked tones are easily distinguished by their unique tonal interactions, not seen in other pitch accents, i.e., violation of downtrend, immunity from concurrent boundary tone overriding, and triggering of post-focal tone compression. We strictly adhered to tonal criteria to determine whether a tone was f-marked or not, with the same criteria across speech styles; a focused word had to fulfill at least two of three phonetic and phonological characteristics of f-marking to be labeled as such. Since focused words in IP-initial position cannot be assessed for AP downtrend, and those in IP-final position cannot be assessed for post-focal tone compression/deletion, examples like these cannot always be confidently transcribed with f-marking. As a result, our numbers likely underreport instances of f-marked tones. While Bengali includes a seemingly large inventory of pitch accents, L* (low) is by far the most commonly used option.
Each pitch accent in Bengali serves as the domain of a small prosodic unit called the accentual phrase (AP), which is marked on the right edge by a boundary tone of the opposite target of the pitch accent: Ha (high target) follows default L*, and La (low target) follows the less common H*. (Bitonal pitch accents L*+H and L+H* are free to be followed by Ha or La in an AP.) Together, the most common sequence of L*…Ha on each word creates the characteristic repetition of rising pitch across sentences in Bengali and many other South Asian languages (Féry, 2010; Khan, 2016, 2018, 2019, 2020). These phrases group into ips, marked by one of two sharp final contours: H- (sharp final rise) and L- (sharp final fall). (Following any of the bitonal pitch accents, the H- tone has a downstepped variant, !H-, characterized by a plateau and slight final fall.) As in English, ips group into IPs, marked by boundary tones that convey sentence type, information structure, and finality (Khan, 2008, 2014). Among other uses, H% (high rising) and HL% (high falling) can serve as topicalizers, and M% (toneless—the least common tone type), LH% (low rising), and HLH% (high dipping) can serve as markers of non-finality, while L% (low falling) can be considered a default marker in most situations. Unlike in English with its tone-stacking, boundary tones in Bengali are subject to overriding by co-occurring tones of higher prosodic units, meaning that an ip-final AP will only bear the ip boundary tone T-, and the AP boundary tone Ta will be overridden. Similarly, in the IP-final position, only an IP boundary tone, T%, will be realized, while the ip boundary tone T- and the AP boundary tone Ta will be overridden.
Common melodies are summarized in the FSA diagram in Figure 1, as already discussed. Figure 1 generates some of the most typical licit tonal sequences of Bengali, ignoring the f-marked tones associated with focus and weak/toneless tonal events. An IP melody can be initiated from the “0” state with “L* Ha” by entering the “AP” state at the top and returning to the “0” state. The melody can then continue with additional “L* Ha” sequences by looping between the “0” and “AP” states. After 0 or more AP sequences, the IP melody can continue with (i) an ip-final AP by visiting the “ip” state and looping back to the “0” state on an ip boundary tone, e.g., “L-”, or (ii) with an IP-final AP by visiting the “ip” state and then ending in the “IP” state following an IP boundary tone such as “L%”. Pitch accents other than L*, such as L*+H, become more common in ip-/IP-final APs.
Figure 1 shows that each AP involves a choice of whether to make the AP non-final (via the “AP” state), ip-final (via the “ip” state), or IP-final (via the “ip” and “IP” states). Because of concurrent boundary tone overriding, the choice of an ip-medial vs. ip-final vs. IP-final AP is a choice between accessing the inventory of AP boundary tones, ip boundary tones, or IP boundary tones. An IP-final AP typically allows for the most possible melodies due to the rich inventory of IP boundary tones.

1.2.3. Comparing Bengali and English Intonational Phonology

Overall, the intonation systems of Bengali and English complement each other. Bengali has a richer inventory of boundary tones compared to English, whereas English has a richer inventory of commonly used pitch accents. Other noteworthy similarities and differences between Bengali and English intonation are in (a) pitch contour regularity, (b) focus realization, and (c) boundary tone complexity.
One of the most clearly noticeable differences between English and Bengali is the regular repeating patterns seen in the Bengali pitch contour and the general lack of such regularity in English. This is largely an effect of the systematic interactions between pitch accents and AP boundary tones in Bengali. While a content word in English is fairly free to bear any of five basic pitch accents (H*, L*, L+H*, L*+H, H+!H*) or none, Bengali content words almost always bear L* followed by an Ha, except in very specific cases: H* followed by La conveys surprise or sarcasm, the bitonal pitch accents (L+H*, L*+H) are generally restricted to ip-final position, and the three f-marked pitch accents (fH*, L*+fH, L+fH*) are only used to convey narrow focus.
In both languages, focus is realized via pitch accent choice and post-focal tone compression (i.e., deaccenting; see Ladd (1983)). In Bengali, an f-marked tone (fH*, L*+fH, L+fH*) marks the focused word. These are sharply distinct from the non-focused pitch accent, L*, and can even be distinguished from H*, L*+H, and L+H*, as the latter three obey downtrend and do not trigger post-focal compression, unlike f-marked tones. In English, the focused element is more likely to bear L+H* and L*+H rather than H* in declaratives (J. Pierrehumbert & Hirschberg, 1990). The distinction between tones associated with and without focus in Bengali is clearer than in English, where H* and L+H* appear to have overlapping allophonic variation (Bartels & Kingston, 1994, i.a.), although they are functionally distinct (Ito et al., 2014) and can be distinguished in production and perception even in children (Thorson & Morgan, 2014a, 2015).
Lastly, Bengali and English differ in the complexity of their boundary tones. While Bengali has three levels of tonally marked prosodic structure (i.e., AP, ip, and IP), English has only two (i.e., ip and IP). Bengali APs and ips end in a single underlying tone, but the ip tones L- and H- both inherently incorporate a sharp phrase-final rise or fall in pitch. English ip tones L- and H- do not have this sharp phrase-final rise or fall, and are instead realized as “phrase accents”, i.e., generally low or generally high pitch across the phrase-final stretch. The six Bengali IP tones are very complex, including zero (e.g., M%), one (e.g., L%), two (e.g., HL%), or three (e.g., HLH%) unique tonal targets, almost always involving large changes in pitch. Since Bengali IP tones are temporally aligned to the right edge of IP-final APs, IP-final APs present a particularly variable region of Bengali melodies. The five English ip-IP stacked tones, on the other hand, can have only one or two tonal targets (e.g., L-H%), and two of them involve a final stretch of flat pitch (H-L%, !H-L%), which is exceedingly rare in Bengali (M%). Still, the IP-final ip in English, where ip-IP stacked tones occur, has been reported to pattern differently from non-final ips due to differing co-occurrence probabilities of IP-final pitch accents depending on the identity of the stacked ip-IP tones (Dainora, 2002, 2006).

2. General Materials and Methods

This section contains a description of the corpus that is the subject of analysis in all other sections. Additional materials and methods specific to one particular study are included within the section describing that study. Section 2.1 describes the materials and procedures for corpus construction. Section 2.2 describes methods related to intonational transcription and how these transcriptions were processed. Section 2.3 describes how utterances were defined, based on the past literature. Section 2.4 presents general information about statistical analysis. Data and code are available in the OSF repository (see Supplementary Materials).

2.1. Materials and Procedures: Corpus Construction

The speech of ten (5 male, 5 female, 36 ± 4 years old) native speakers of English and ten (5 male, 5 female, 47 ± 8 years old) native speakers of Bengali was recorded in a quiet room in Los Angeles. All English speakers grew up in the United States speaking English as their dominant language (five were monolingual; the others also spoke French, Spanish, or Japanese). All Bengali speakers were born in and grew up in Bangladesh speaking Bengali. They had been in the US for 18 ± 9 years, and nine also spoke English as another language, but all communicated daily in Bengali. Subjects were paid US$5 for their participation, which typically took 20 min. All subjects filled out an informed consent form. To help ensure that subjects were comfortable and familiar with the simulated IDS task, only parents were recruited. The English speakers had infants of 4.1 ± 0.9 months of age at the time of recording, while there was no specific cutoff for the age of the Bengali speakers’ children due to subject pool limitations. However, all Bengali speakers lived with their children (or grandchildren, in the case of one subject)—who were all younger than 10 years of age at the time of the recording—and five of the subjects were also teachers at a Bengali-language weekend school for young children.
Subjects were recorded while reading The North Wind and the Sun fable, used in illustrations of the International Phonetic Alphabet (“Report on the 1989 Kiel Convention,” Roach, 1989). The Bengali version was from Khan (2010). Storytelling was used as a context appropriate for read speech in both IDS and non-IDS.8 Using translations of the same text across both languages ensured that the speakers’ productions would not be affected by different semantic/pragmatic features triggered by reading different stories. Furthermore, unlike studies of spontaneous IDS, the current study kept the text constant to minimize changes in semantics, morphosyntax, and the underlying segments across conditions while still allowing for analysis of relatively long stretches of continuous speech. This way, we could observe how speakers’ prosodic choices might change, given the same segmental, morphosyntactic, and discourse structure.
Recordings were made using a Shure SM10A head-mounted microphone plugged into a laptop computer via a preamplifier. The first of the two conditions was default reading (“non-IDS”), in which subjects were asked to “read at a comfortable pace”. In this paper, we always refer to this condition in our experiment as non-IDS. (We use the term ADS in discussing the literature if that term was used by the researcher.) This task direction was designed to be comparable with other studies of speech rhythm using lab speech, as part of a larger study on speech rhythm, prosody, and speech style. The second condition was simulated infant-directed reading (“IDS”), in which the subject was asked to read the same passage as if speaking to their 4- to 5-month-old infant. (Bengali speakers were asked to imagine their child or grandchild at that age.) This is an age range where IDS has fewer single-word utterances, is less dominated by soothing/comforting affect, and is intensely used for rapport and attention (Stern et al., 1982; Kitamura et al., 2002). Thus, it is an age range where paralinguistic demands play a large role in driving prosodic manipulations in IDS. Childlike illustrations were drawn on the script for the IDS task, and plush toys were displayed around the speaker to help further encourage this register. The choice to consistently record non-IDS before IDS for all participants (rather than counterbalancing the order of conditions) was intended to prevent a scenario in which speakers would be unable to “turn off” their IDS when asked to read the script again in non-IDS.
We did not record IDS in the presence of an infant because, in pilot recordings, when an infant was in the room, recordings were disfluent and interrupted by infant fussiness. Work on intonational phonology that handles disfluencies is an understudied area of research (Arbisi-Kelm, 2010; Brugos et al., 2019), and we did not want to add that complication into our analysis since intonational grammars incorporating disfluencies are not well-established. Thus, we decided to record simulated IDS instead.
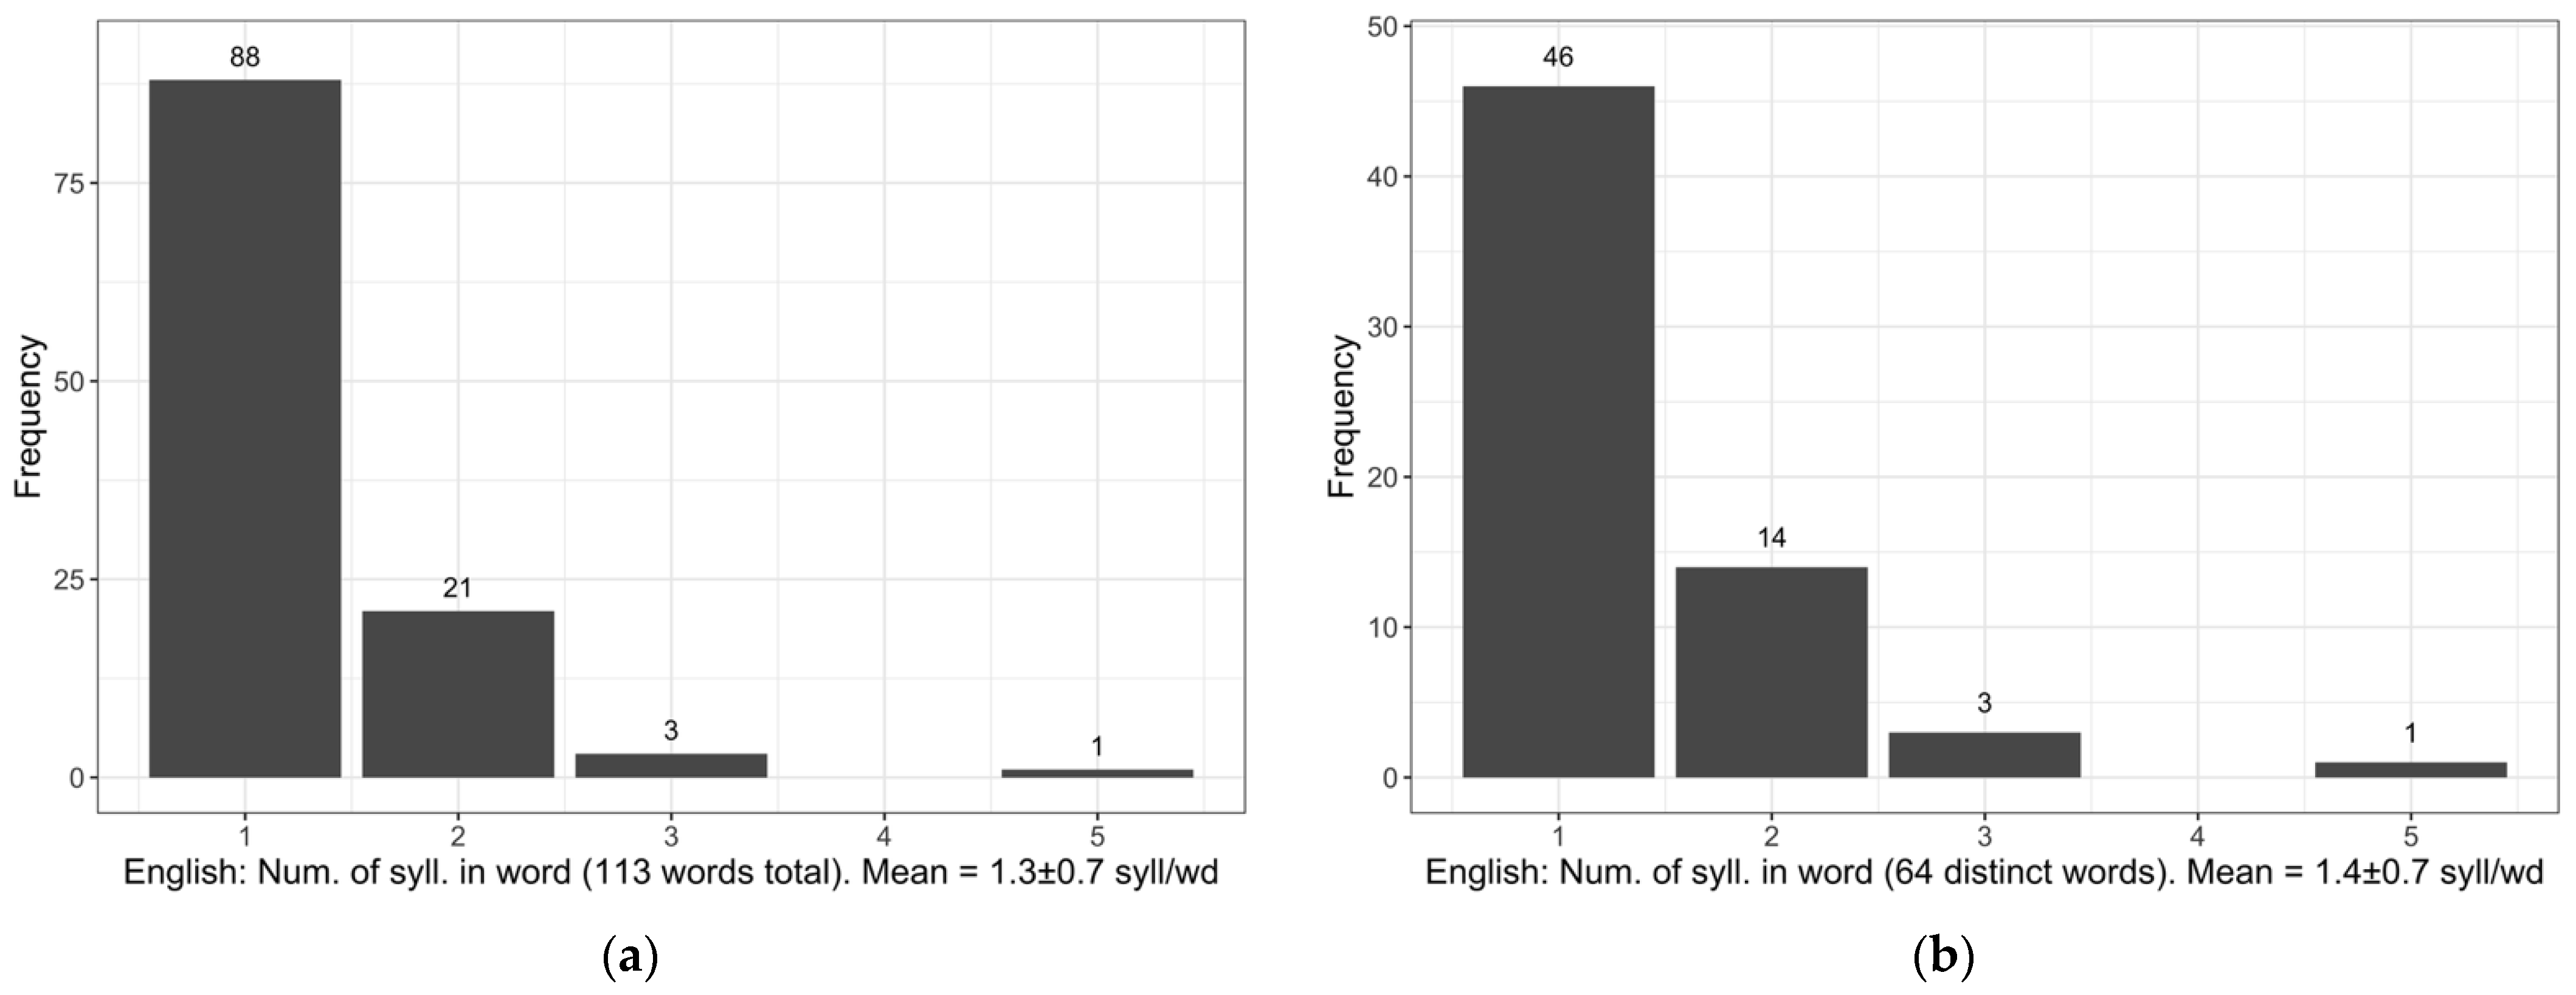
We recorded multiple repetitions of the story from each speaker in each condition to capture potential variation in a speaker’s intonational choices across renditions of the story. Within each language and speaker, for each condition (non-IDS, IDS), the three clearest repetitions with minimal or no disfluencies were chosen and transcribed, giving 2 conditions × 3 repetitions = 6 recordings per speaker. The resulting Bengali corpus was 49 min in total (an average of 4.9 min/speaker), and the Bengali version of the story contained 106 words in total. The resulting English corpus was 34.4 min in total (an average of 3.4 min/speaker). The English version of the story contained 113 words in total.

2.2. Intonational Transcription and Processing

Recordings were intonationally transcribed with text grids in Praat (Boersma & Weenink, 2024), using MAE_ToBI tone labels (M. Beckman & Elam, 1997) for English and B-ToBI tone labels (Khan, 2008, 2014) for Bengali, by transcribers trained in each system. Words and syllables were also segmented by hand by the transcribers. There were two transcribers for the English data (hired research assistants: Transcribers 1 (T1) and 2 (T2)), and one transcriber for the Bengali data (the second author). We made the choice of including only T1’s transcriptions of English for this study because the central goal here is to demonstrate proof-of-concept phonologically informed analyses of IDS. Transcriber T1’s experience with English intonation and transcription was comparable to the Bengali transcriber’s experience with Bengali intonation and transcription: both transcribers have been the key figures in developing and training for the intonational transcription of their respective languages for years. (In comparison, Transcriber T2 had just completed a quarter-long introductory course on intonation.) We recognize that having single transcribers for each language—even if they are experts—imparts fragility to our analyses based on the intonational transcriptions. However, the key conclusions we draw in this paper are not sensitive to the intonational transcriptions in full detail. The most crucial aspect of the transcriptions we rely on is the partitioning of speech into intonational constituents.
Transcribers were unaware of whether a particular recording was drawn from IDS or non-IDS and were encouraged to propose new tones or take note of new tonal interactions when approaching both the IDS and non-IDS recordings from the current study. This was done to discourage transcribers from forcing aspects of the non-IDS intonational phonological grammar onto what could hypothetically be a completely different grammar in IDS. Despite this, all tones transcribed in IDS were also found in the non-IDS recordings in this study. Transcriptional data and scripts for processing are described and linked from the wiki page “Intonational transcription and processing” in the OSF repository.

2.3. The Definition of “Utterances”

Independent of intonational transcriptions, the recorded speech was partitioned into “utterances” following two different definitions given in Fernald et al. (1989), Igarashi et al. (2013, p. 1289), and Martin et al. (2016). Fernald et al. (1989, p. 485) defined an utterance as a section of speech bounded by pauses greater than 300 ms. However, Igarashi et al. (2013, p. 1289) defined utterances using a pause threshold of 200 ms, as did Martin et al. (2016, p. 54). In this paper, we call utterances defined with a 200 ms threshold, Utt-200s, and those defined with a 300 ms threshold, Utt-300s.

2.4. Statistical Analysis

All descriptive and inferential statistics were computed and visualized using R (R Core Team, 2024), with dplyr (Wickham et al., 2019), ggplot2 (Wickham, 2009), and lme4 (Bates et al., 2014). Significance level for all analyses in the paper was determined at an alpha level of 0.05, and p-values for linear regressions were estimated using the Sattherthwaite approximation with the lmerTest package (Kuznetsova et al., 2017). Conditional and marginal pseudo-R2 values for regression models were estimated to measure goodness of fit using the MuMIn package (Bartoń, 2025).
In all regressions, we included Style (2 levels: non-IDS, IDS) as a predictor and Gender (2 levels: man, woman) and Repetition (3 levels: 1, 2, 3) as uninteracted covariates. Since Gender and Repetition were not central factors to this study, we do not discuss them. However, their results are included in the regression model result tables for interested readers and/or in the R files in the Supplementary Materials. Binary predictors like Style and Gender were transformed to an indicator variable (0 = non-IDS/1 = IDS; 0 = man/1 = woman) and centered, and repetition was coded as an ordered factor with orthogonal polynomial contrast. Continuous predictors, i.e., Word Length in syllables and phones in the analysis of duration, were centered and divided by two standard deviations to put them on the same scale as binary predictors (Gelman et al., 2021, p. 187). We included by-speaker random slopes and intercepts for critical predictors (e.g., Style) as long as models converged and were not singular. If models were singular, we preferred dropping random intercepts before dropping random slopes to avoid anti-conservativity (Sonderegger, 2023, p. 373). Post hoc tests were carried out using emmeans (Lenth, 2024), with multiple comparisons adjusted by the Tukey method. Multicollinearity for models, including both Word Length in syllables and phones, was assessed with variance inflation factors (VIFs) and found not to be problematic. The maximum VIF in all models was well below the threshold of 10. Visual inspection of Cook’s distance and DFBETA was used to identify influential speakers and words. Results were robust to influential speakers/words unless otherwise noted. All R code for statistical analysis is available in the OSF repository. Random effects variances and correlations are excluded for brevity, but are available in the R code there.

3. Predictability in the Bengali and English Intonational Melodies

For testing the Predictability Hypothesis (Section 1.1) that intonational exaggeration is restricted to where tonal choice is most unpredictable in the melody, it is necessary to quantify predictability. In this section, we assess predictability in different regions of English and Bengali intonational melodies, focusing on comparing IP-final to non-final regions. First, we generalize Igarashi et al. (2013)’s notion of “flexibility” to define predictability at a choice point in an intonational grammar in entropy-theoretic terms (Section 3.1). Then, we compute predictability at choice points in the Bengali and English intonational grammars in non-IDS and IDS, using methods specified in Section 3.2. Section 3.3 compares predictability at IP-final vs. non-final choice points in the intonational melody in both speech styles for each language.

3.1. Defining Predictability in Intonational Grammars

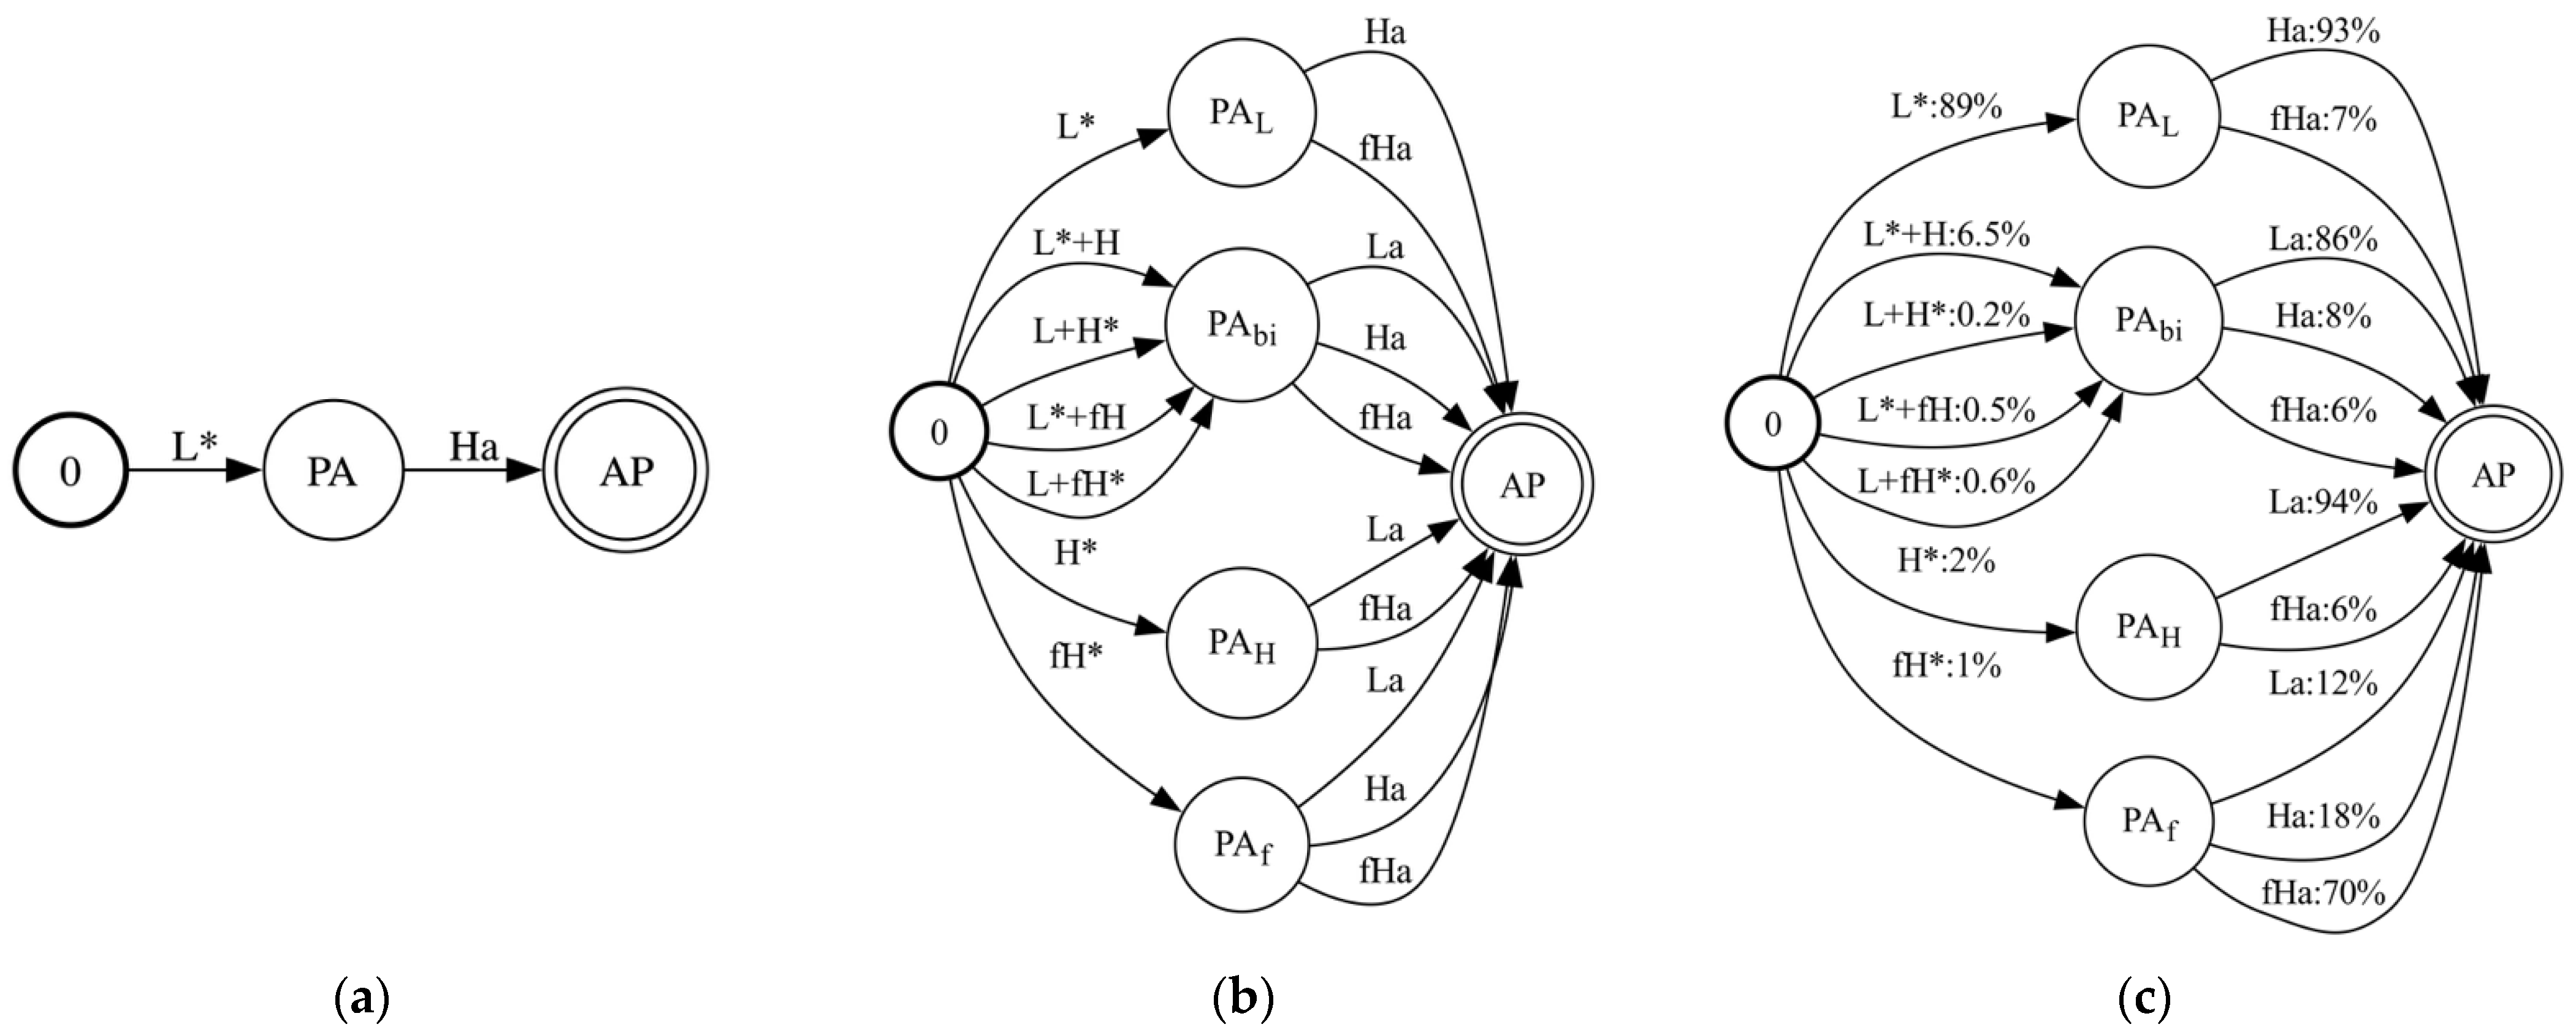
We take as a starting point Igarashi et al. (2013)’s notion of “flexibility” in an intonational grammar: the number of choices available at a point in the sequence of tonal events. For example, Figure 5 revisits the sub-part of the B-ToBI intonational grammar for licit tonal sequences in APs that are neither ip- nor IP-final and end in an AP boundary tone, i.e., AP melodies. By far the most common sequence of tonal events in such APs has been described in the past literature (Khan, 2008, 2014, 2020) as being “L* Ha”, which is what we show in Figure 1 and repeat in Figure 5a. However, there are in fact many more possible sequences in APs ending in an AP tone, as shown in the FSA drawn in Figure 5b.9 Flexibility of the intonational melody in the AP would be one choice if we considered the FSA in Figure 5a, but 19 choices10 if we considered the FSA in Figure 5b. How do we decide between these two drastically different characterizations of AP melodies: the most common vs. all possible? Given the characterization in Figure 1, which includes only the single “L* Ha” AP melody, flexibility in the intonational grammar is greatest at the choice of IP tone at State “ip”: five choices. But if we considered all possible AP melodies, then flexibility is even greater at the choice point for State “0”, the AP-initial pitch accent (Figure 5b): seven choices. How, then, to operationalize the Predictability Hypothesis?
The information-theoretic notion of entropy allows us to find a middle ground between the two extremes of a flexibility of 1 choice vs. 19 choices in non-final AP melodies by probabilistically weighting tonal choices by how likely they are. Thus, the key generalization we make to extend “flexibility” to our definition of predictability is to augment transitions in FSA representations of intonational grammars with probabilistic weights, as exemplified in Figure 5c. The probabilities in Figure 5c are estimated from the frequency of tonal choices in the Bengali non-IDS corpus (see Section 3.2.2). The label “L*:89%” on the transition arc from the start state “0” to State “PAL” in Figure 5c indicates that there is an 89% chance of choosing an L* as the first tone in an AP melody. The label “Ha:93%” on the transition arc from State “PAL” to State “AP” indicates that, conditioned on the first tone in the PA being chosen as L*, there is a 93% chance that the next tone is chosen to be Ha. By multiplying those two probabilities together, we determine that the probability of an “L* Ha” AP sequence is 83%.
In Figure 5a,b, where arcs are not labeled with probabilistic weights, we are effectively assuming a uniform distribution over all possible paths leading out of a state. For instance, consider just State “PAL” in Figure 5b,c. When the speaker has reached that state (by having chosen an AP-initial L*), there are two options for the next tonal choice, like a coin flip: an Ha or an fHa. If the coin is fair (a uniform distribution), then there is a probability of ½ that the speaker chooses either boundary tone. However, the probability of an Ha estimated from the non-IDS corpus is actually 93%, compared to just 7% for fHa, as shown in Figure 5c.
Our definition of predictability at a choice point in an intonational grammar, i.e., at a particular state in the FSA, is the entropy calculated from the probabilities over its outgoing arcs. In this paper, our use of the term “predictability” at a choice point henceforth refers to this precise definition. The entropy, H(q), in bits for a state, q, in an FSA is standardly defined by Equation (1), where p(x) is the probability of transitioning over one of the outgoing arcs, x, among the set of outgoing arcs, X, from state q:
H ( q ) =   x X p ( x )   log 2 p ( x ) .
Thus, the entropy at State “PAL” in Figure 5b for a uniform probability distribution over the choices of Ha and fHa would be
H ( P A L ) =   ( 0.5   ×   log 2 ( 0.5 )   +   0.5   ×   log 2 ( 0.5 ) ) = 1   b i t .
This is the maximally unpredictable case, where there is an equal chance of either an Ha or fHa following an L*. But following the probabilities of outgoing arcs estimated from the non-IDS corpus (Figure 5c), the entropy at State PAL is
H ( P A L ) =   ( 0.93   ×   log 2 ( 0.93 )   +   0.07   ×   log 2 ( 0.07 ) ) = 0.37   b i t s .
Since the speaker is much more likely to choose an Ha than an fHa after an AP-initial L*, the choice is more predictable, and the entropy is lower than 1 bit: lower entropy corresponds to higher predictability. If the probability of an Ha were 1, then the entropy of choosing an AP tone at State PAL would be 0 bits: total certainty that the speaker always picks Ha.
Our generalization of Igarashi et al. (2013)’s “flexibility” at a choice point in an intonational melody to an entropy-theoretic definition of predictability has two important consequences. First, the addition of tunable probabilistic weights to the FSA transitions allows an intonational grammar to be sensitive to different speech styles. For instance, non-IDS and IDS could systematically vary in the likelihood of certain tonal choices, and this can be captured by differences in the probabilistic weights of the FSA.
Second, our definition of predictability at a given choice point in a melody takes into account the history of previous choices for that melody, up to the current choice point. In Figure 5c, the probability of choosing an Ha next is 93% if the speaker just chose an L*, but 18% if they just chose an fH*, and 0% if they just chose an H* (since H* Ha is tonotactically illicit). The states can be further refined to take into account what history is of interest. In this paper, we are interested in the history of whether a speaker chose to initiate an IP-final AP/ip or not. Thus, we refine states to make a distinction between IP-final vs. non-final choice points for pitch accents and AP/ip boundary tones. For instance, to refine Figure 5b, rather than defining a single PAL state that is reached after a speaker has chosen an AP-initial L*, we split it into two PAL states: one reached after an IP-final, AP-initial L*, and one reached after a non-final AP-initial L*.

3.2. Methods

For readers unfamiliar with FSAs, what is most important to understand about FSAs for this paper is the high-level concepts explained in the introduction in Section 1.1 and Section 3.1. For readers interested in trying the methods described here, step-by-step walkthroughs/explanations are provided in the Python 3.11.9 JuPyter notebooks available at the OSF repository and referenced from the “Finite state automata” wiki page.

3.2.1. Definition of Finite State Automata for MAE-ToBI and B-ToBI

To define grammars for MAE-ToBI and B-ToBI as finite state automata, we first defined inventories of possible tonal events—intonational atoms—e.g., L*, H*, L+H*, …, L-, H-… for MAE-ToBI. Then, we stated tonotactic restrictions over these atoms as regular expressions and compiled these restrictions into automata (a list of states and transition arcs between them) using the Python 3.11.9 library pynini (Gorman, 2016). Definitions and diagrams of the automata are explained step-by-step in JuPyter notebooks in the OSF repository. The general strategy we followed for both MAE-ToBI and B-ToBI was to define possible sequences of tonal events for the smallest units and then build the set of tonal sequences for larger units over smaller units. For instance, for MAE-ToBI, we defined the set of possible pitch accents, the set of possible ip tones, and the set of possible IP tones. Then, we defined the set of licit tonal sequences in an ip as “any sequence of one or more pitch accents followed by an ip tone” and an IP melody as “any sequence of one or more ip sequences followed by an IP boundary tone”. Similarly, for B-ToBI, we specified allowed pitch accent–AP tone sequences for APs that were neither ip- nor IP-final, e.g., L* Ha, as well as allowed pitch accent sequences followed by an ip tone, e.g., L+H* H-, and then built up licit sequences for the whole IP from these. We also allowed for weak accents (“*”) at any position within an AP/ip/IP.
The automata we describe immediately above correspond to FSA like those in Figure 1, Figure 4 and Figure 5 and do not distinguish between IP-final and non-final APs/ips. To test for distinct patterns in the IP-final portion of a melody, we further defined variants of the automata that distinguished between IP-final APs/ips and non-final ones in B-ToBI for Bengali and IP-final vs. non-final pitch accents in MAE-ToBI for English. To implement the IP-finality distinction, we simply added an “n” (for nuclear) diacritic to the inventory of intonational atoms and separated out IP-final tonal events from non-final ones via the diacritic in the automata and the corpus of melodies. Unlike Dainora (2006), we also did not include states to distinguish between transitions to boundary tones from different types of IP-final pitch accents, due to the relatively small size of our corpora.
The automata compiled by pynini based on the stated tonotactic restrictions were “minimal” and “deterministic”. A “deterministic” finite state acceptor is one where, given the current state and the next symbol from the input string to be read in, there must be a unique transition out of the state. A “minimal” deterministic finite state acceptor has additionally been optimized to have the fewest number of states possible. For example, the B-ToBI automaton in Figure 1 is not deterministic because the transition from the initial “0” state over an “L*” is not uniquely determined: there are transitions to two different possible states (States “AP” and “ip”). However, there exists a simple, efficient algorithm that can convert any finite state acceptor into a minimal, deterministic one, and this converted machine is unique; see, e.g., Kozen (1997). This conversion allowed for efficient parsing of the tonal corpus with our automata, as well as a simple algorithm for estimating the probability distribution of the automaton based on the frequency of tonal events in the corpus.

3.2.2. Parsing the Tonal Corpora with Automata and Estimation of Arc Transition Probabilities

The transcription corpora were processed as described in Section 2.2 and chunked into IPs. For estimating probabilities of tonal events based on corpus frequencies, the more data, the better. Smaller data samples, according to Zipf’s Law, would be more likely to fail to include exemplars of less probable events. Thus, we collapsed across speakers and repetitions of the story to create a corpus of melodies in IDS and non-IDS. Also, due to data scarcity and to focus on the phonological aspects of intonation, we collapsed certain transcription labels that were understood to refer to allophonic variants of the same tone. These choices are described in Appendix A.1.
Each transcribed tonal sequence within an IP constituted one exemplar in the corpora. There was a total of 955 exemplars for English T1 (411 for non-IDS, 544 for IDS) and 1367 for Bengali (549 for non-IDS, 818 for IDS). The English exemplars were each parsed by the MAE-ToBI automata and the Bengali exemplars by the B-ToBI automata, and the sequence of states traversed in each parse was recorded. Parsing here was simple since the machines were deterministic, so there was only ever one path through an automaton that could accept any given exemplar.
The relative frequencies of arc traversals in the parses for each speech style in each language for each transcriber were computed and used to provide a “maximum likelihood estimate” for arc transition probabilities in the automata.11 The standard practice in natural language processing is to introduce smoothing of frequencies to alleviate the effects of data sparsity on the accuracy of maximum likelihood estimates (Jurafsky & Martin, 2009, Section 4.5). Here, we used additive smoothing with a pseudocount of 1; i.e., we added a count of 1 to every arc transition listed in the definition of the transducer to avoid zero probabilities. Relative frequencies were computed by normalizing the frequency of traversals of an arc leaving some state by the total frequency of traversals of any arc leaving that state. The relative frequency for each arc was log-transformed to avoid floating point errors from multiplying very small probabilities. The entropy of a state could then be computed using Equation (1), with the relative frequency of each arc used as the estimate for its probability. We also used these estimated probabilities to compute the probabilities of different tonal sequences and see how choices differed across speech styles (Section 3.3.2).

3.2.3. Measuring Predictability: Entropy Calculations for Probabilistic Finite State Automata

For each choice point, we made comparisons across styles (non-IDS vs. IDS) and IP-finality (IP-final vs. non-final)—four entropy calculations. We also re-normalized probabilities based on the choices under consideration. For example, if we were interested in pitch accent choices, but outgoing arcs from the relevant state also included transitions to boundary tones, we re-normalized probabilities to ignore the boundary tone arcs.
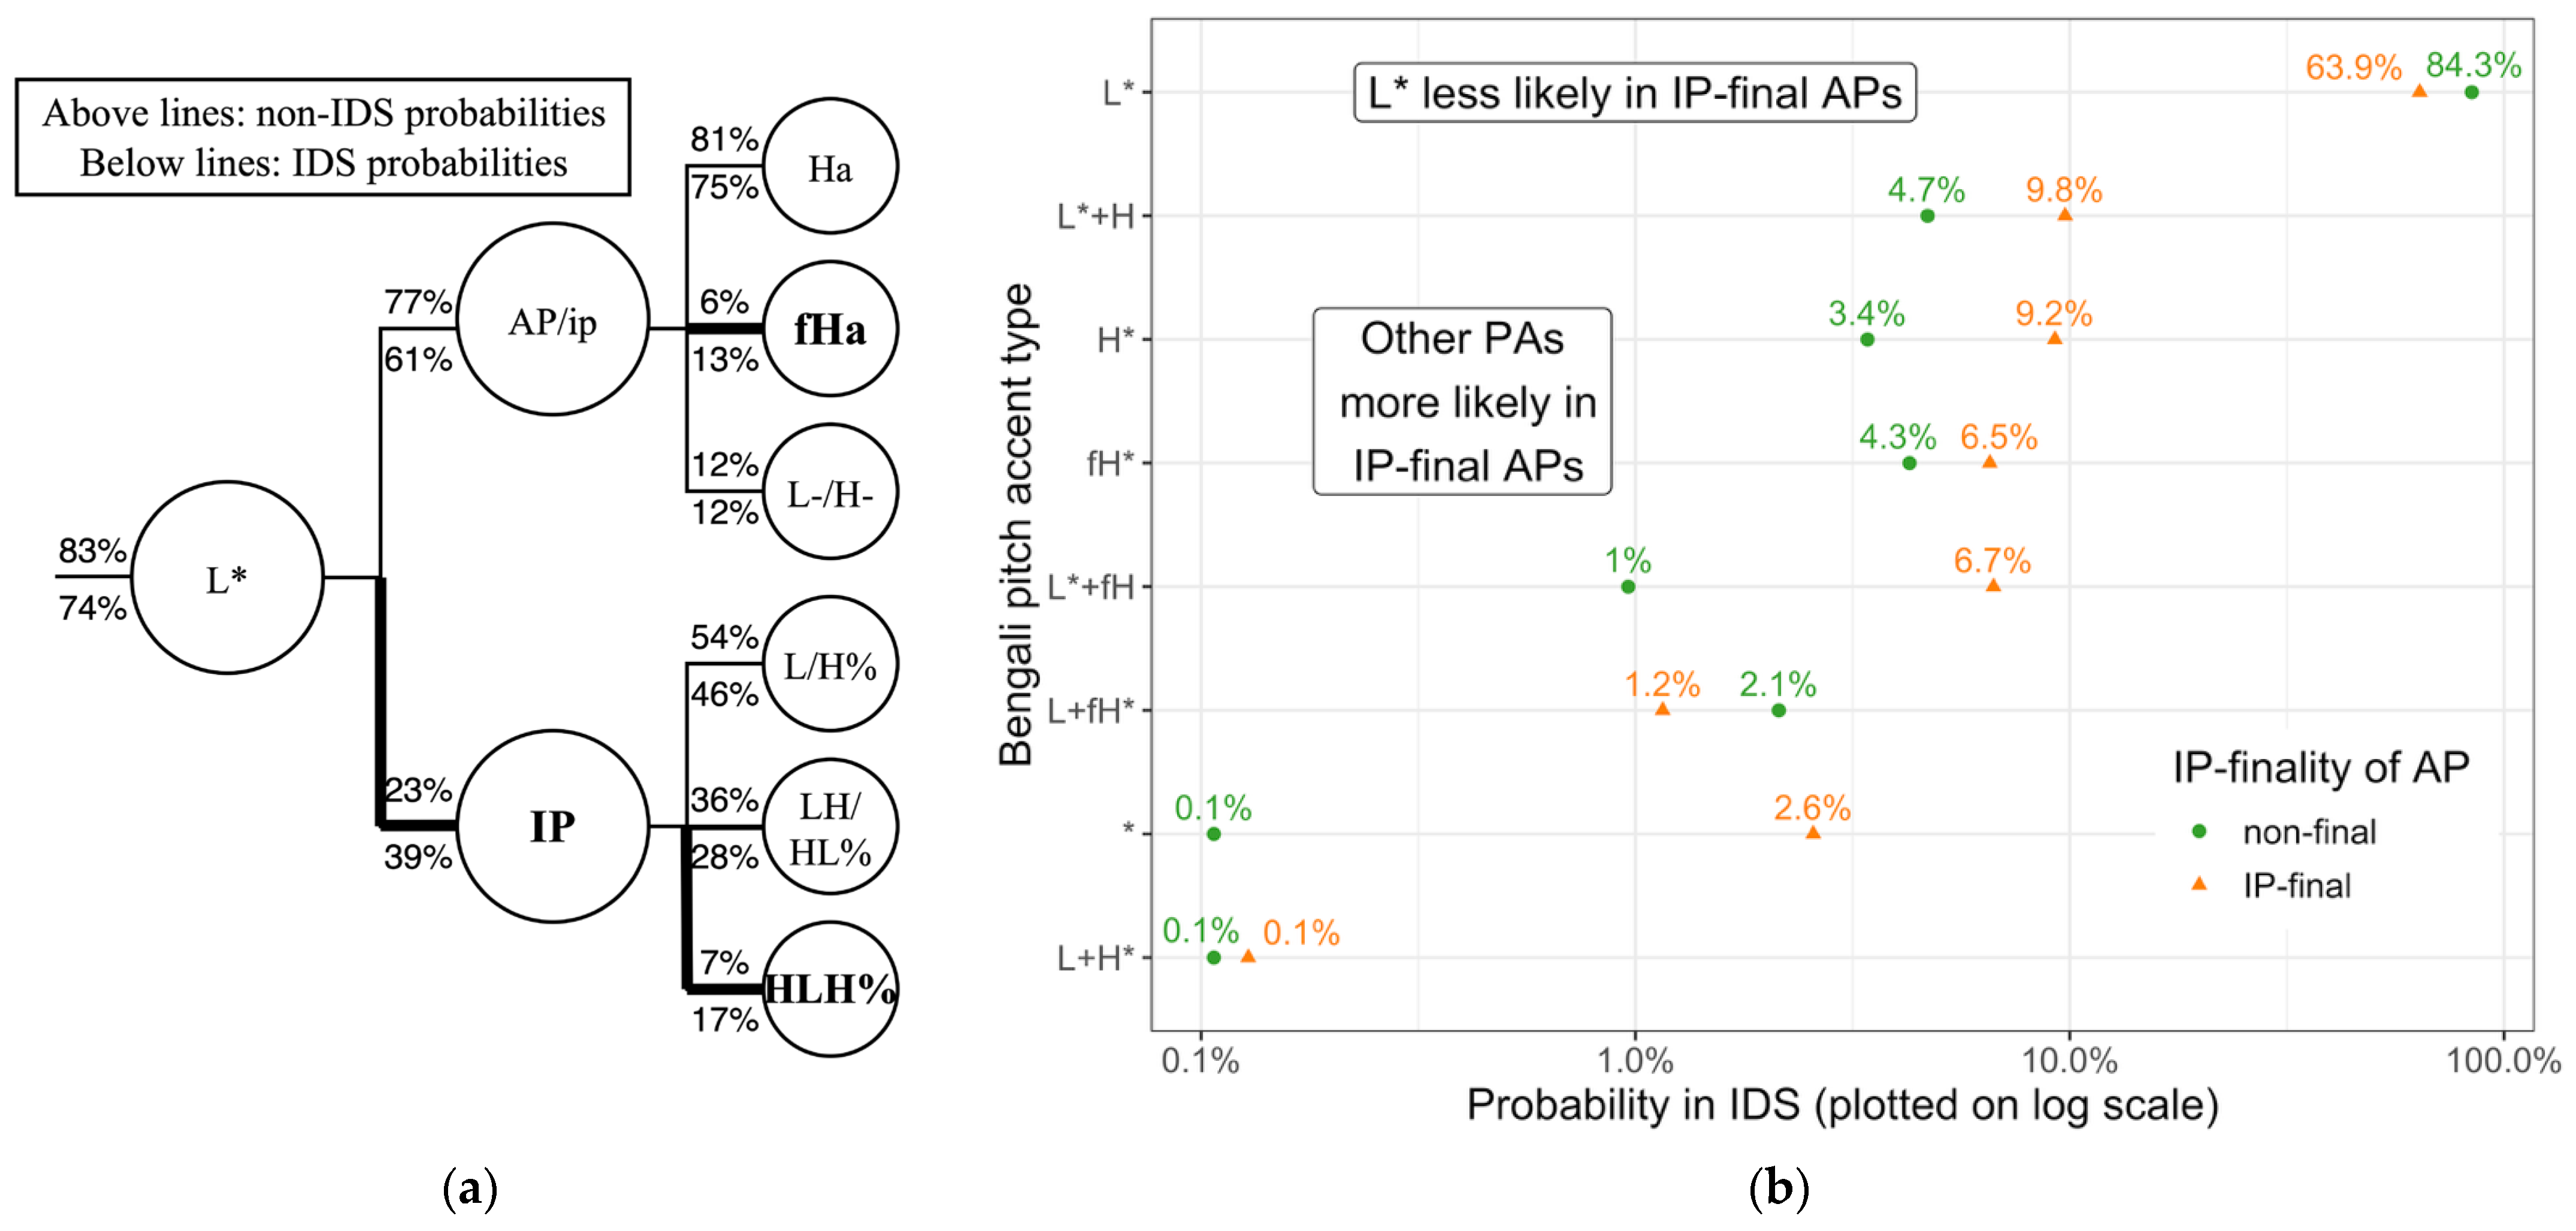
For Bengali, we looked at the choice point of an AP-initial pitch accent and the choice point of an AP/ip vs. IP boundary tone following a monotonal pitch accent (L*, H*, or fH*). These choice points capture the majority behavior for pitch accent choice points since the likelihood of single-pitch accent APs was 85–88% across speech styles. In non-final APs, three different states can be reached following an AP-initial monotonal accent, i.e., PAL after L*, PAH after H*, and PAf after fH* in Figure 5b,c in a non-final AP (transition arcs over L-, H- to end in an ip are not shown in Figure 5b,c). In an IP-final AP, though, phonotactic restrictions are looser, so a single state is reached following a monotonal accent. We thus computed the average of the entropies over the three PAL, PAH and PAf states weighted by the probability of reaching those states for comparison with the entropy of that single IP-final state. The probability of an AP-initial monotonal accent in a non-final AP is overwhelmingly likely to be an L* (96% in non-IDS and 92% in IDS), so the weighted average is dominated by the entropy for PAL state reached by choosing an L*. To get a sense of the importance of taking the weighted average, note that the probability of an Ha after an L* is 81% in non-IDS and 75% in IDS (Figure 6a). After fH*, it is only 15% in non-IDS and 9% in IDS. Failing to take into account how dominant the choice of an initial L* is via the weighting would have drastically underestimated the probability of an Ha.
In English, we examined the choice point of an ip-noninitial pitch accent and the choice point of a boundary tone (IP-final or ip-final). We restricted pitch accent analysis to just ip-noninitial pitch accents because there is over 99% probability of an ip having more than one pitch accent, based on the computed MAE-ToBI automata. That means that an ip-initial pitch accent is effectively never IP-final in English (at least based on the sample of English collected here), so the choice point for an IP-final pitch accent comes only if the accent is ip-noninitial.
The code for computation and visualization of the entropy comparisons and related results is described and linked from the “Finite state automata” OSF repository wiki page.

3.2.4. Validation of Probabilistic Automata

We checked the fit of our probabilistic automata to the corpus data in two ways. First, we checked that our automata were sufficiently expressive to generate all melodies attested in the corpus. That is, we checked if all IP melodies in the Bengali and English corpora were accepted by the relevant language-specific automata and inspected any melodies that were rejected, in consultation with the transcribers. It turned out that some of the rejected melodies involved typographical errors and other mistakes that were corrected before re-estimating the probabilities for the automata. An additional validation procedure for checking the quantitative fit of the estimated probabilities to the corpus data that yielded satisfactory results is described in Appendix A.2.

3.3. Results

3.3.1. Expressivity and Validation of Automata

The automata defined for MAE-ToBI accepted each of the 955 IP melody exemplars (411 in non-IDS; 544 in IDS) in the English corpus. Thus, the automata defined for MAE-ToBI were sufficiently expressive for IDS as well as non-IDS. The automata defined for B-ToBI accepted the majority (93.7%) of exemplars. There were 15/549 (2.7%) rejected exemplars in non-IDS and 29/819 (3.5%) rejected exemplars in IDS. An additional two sequences were excluded due to the presence of a “stacked” boundary tone fHaL% (one in non-IDS; one in IDS).12 Crucially, characteristics of the rejected exemplars were the same across speech styles. Setting aside the two instances of fHaL%, exemplars were rejected because of sequences of multiple pitch accents that were tonotactically illicit or multiple pitch accents in non-final APs, including weak accents. Thus, the B-ToBI grammar represented by the automata was insufficiently expressive in systematic, circumscribed ways—and in the same ways—for both non-IDS and IDS. In fact, studying the melodies rejected by the automaton allowed us to uncover new findings about the distribution of weak accents in Bengali intonational phonology and facilitate the continued development of our understanding of Bengali intonational phonology.

3.3.2. Computed FSAs and the Predictability of IP-Final vs. Non-Final Melodic Choice Points in IDS vs. Non-IDS

This section presents the results of the computed B-ToBI and MAE-ToBI FSAs and how entropic–theoretic predictability compares in IP-final vs. non-final choice points of intonational melodies. Full FSA diagrams and computed weights for transition arcs for non-IDS and IDS can be found in the JuPyter notebooks in the OSF repository, but they can be hard to interpret due to the large number of states and arcs in the automata. Here, we highlight insights that the FSAs provide on how melodic choices and their predictability vary by IP-finality and speech style.
Bengali
Based on the computed B-ToBI FSAs, the probability of a Bengali AP (whether IP-final or not) containing only a single pitch accent is 88% in non-IDS and 85% in IDS, and the likelihood of an AP containing a single L* as its only pitch accent is 83% in non-IDS and 74% in IDS. The conditional probability chart in Figure 6a for L*-initial, single-pitch-accent IP melodies thus captures the dominant patterns of melodic choices in Bengali intonation. It also summarizes the main changes in the likelihood of different tonal choices between speech styles. Bolded lines indicate places where the likelihood of a tonal choice increased in IDS. The conditional probability of a particular tonal choice is given above the lines for non-IDS and below the lines for IDS. For example, once an L* has been chosen to initiate a single-pitch-accent melody, there is a 77% chance to continue with an AP/ip boundary tone in non-IDS, but only a 61% chance in IDS. The likelihood of ending an AP in an fHa increases in IDS, at the expense of Ha tones. So, too, does the likelihood of an IP melody L* HLH%, at the expense of other IP boundary tone choices.
While L* dominates pitch accent choice, does pitch accent choice vary by IP-finality? Figure 6b shows that the likelihood of other pitch accent types than L* is higher in IP-final APs than in non-final APs. The non-IDS FSA yields the same pattern of results (see Supplementary Materials).
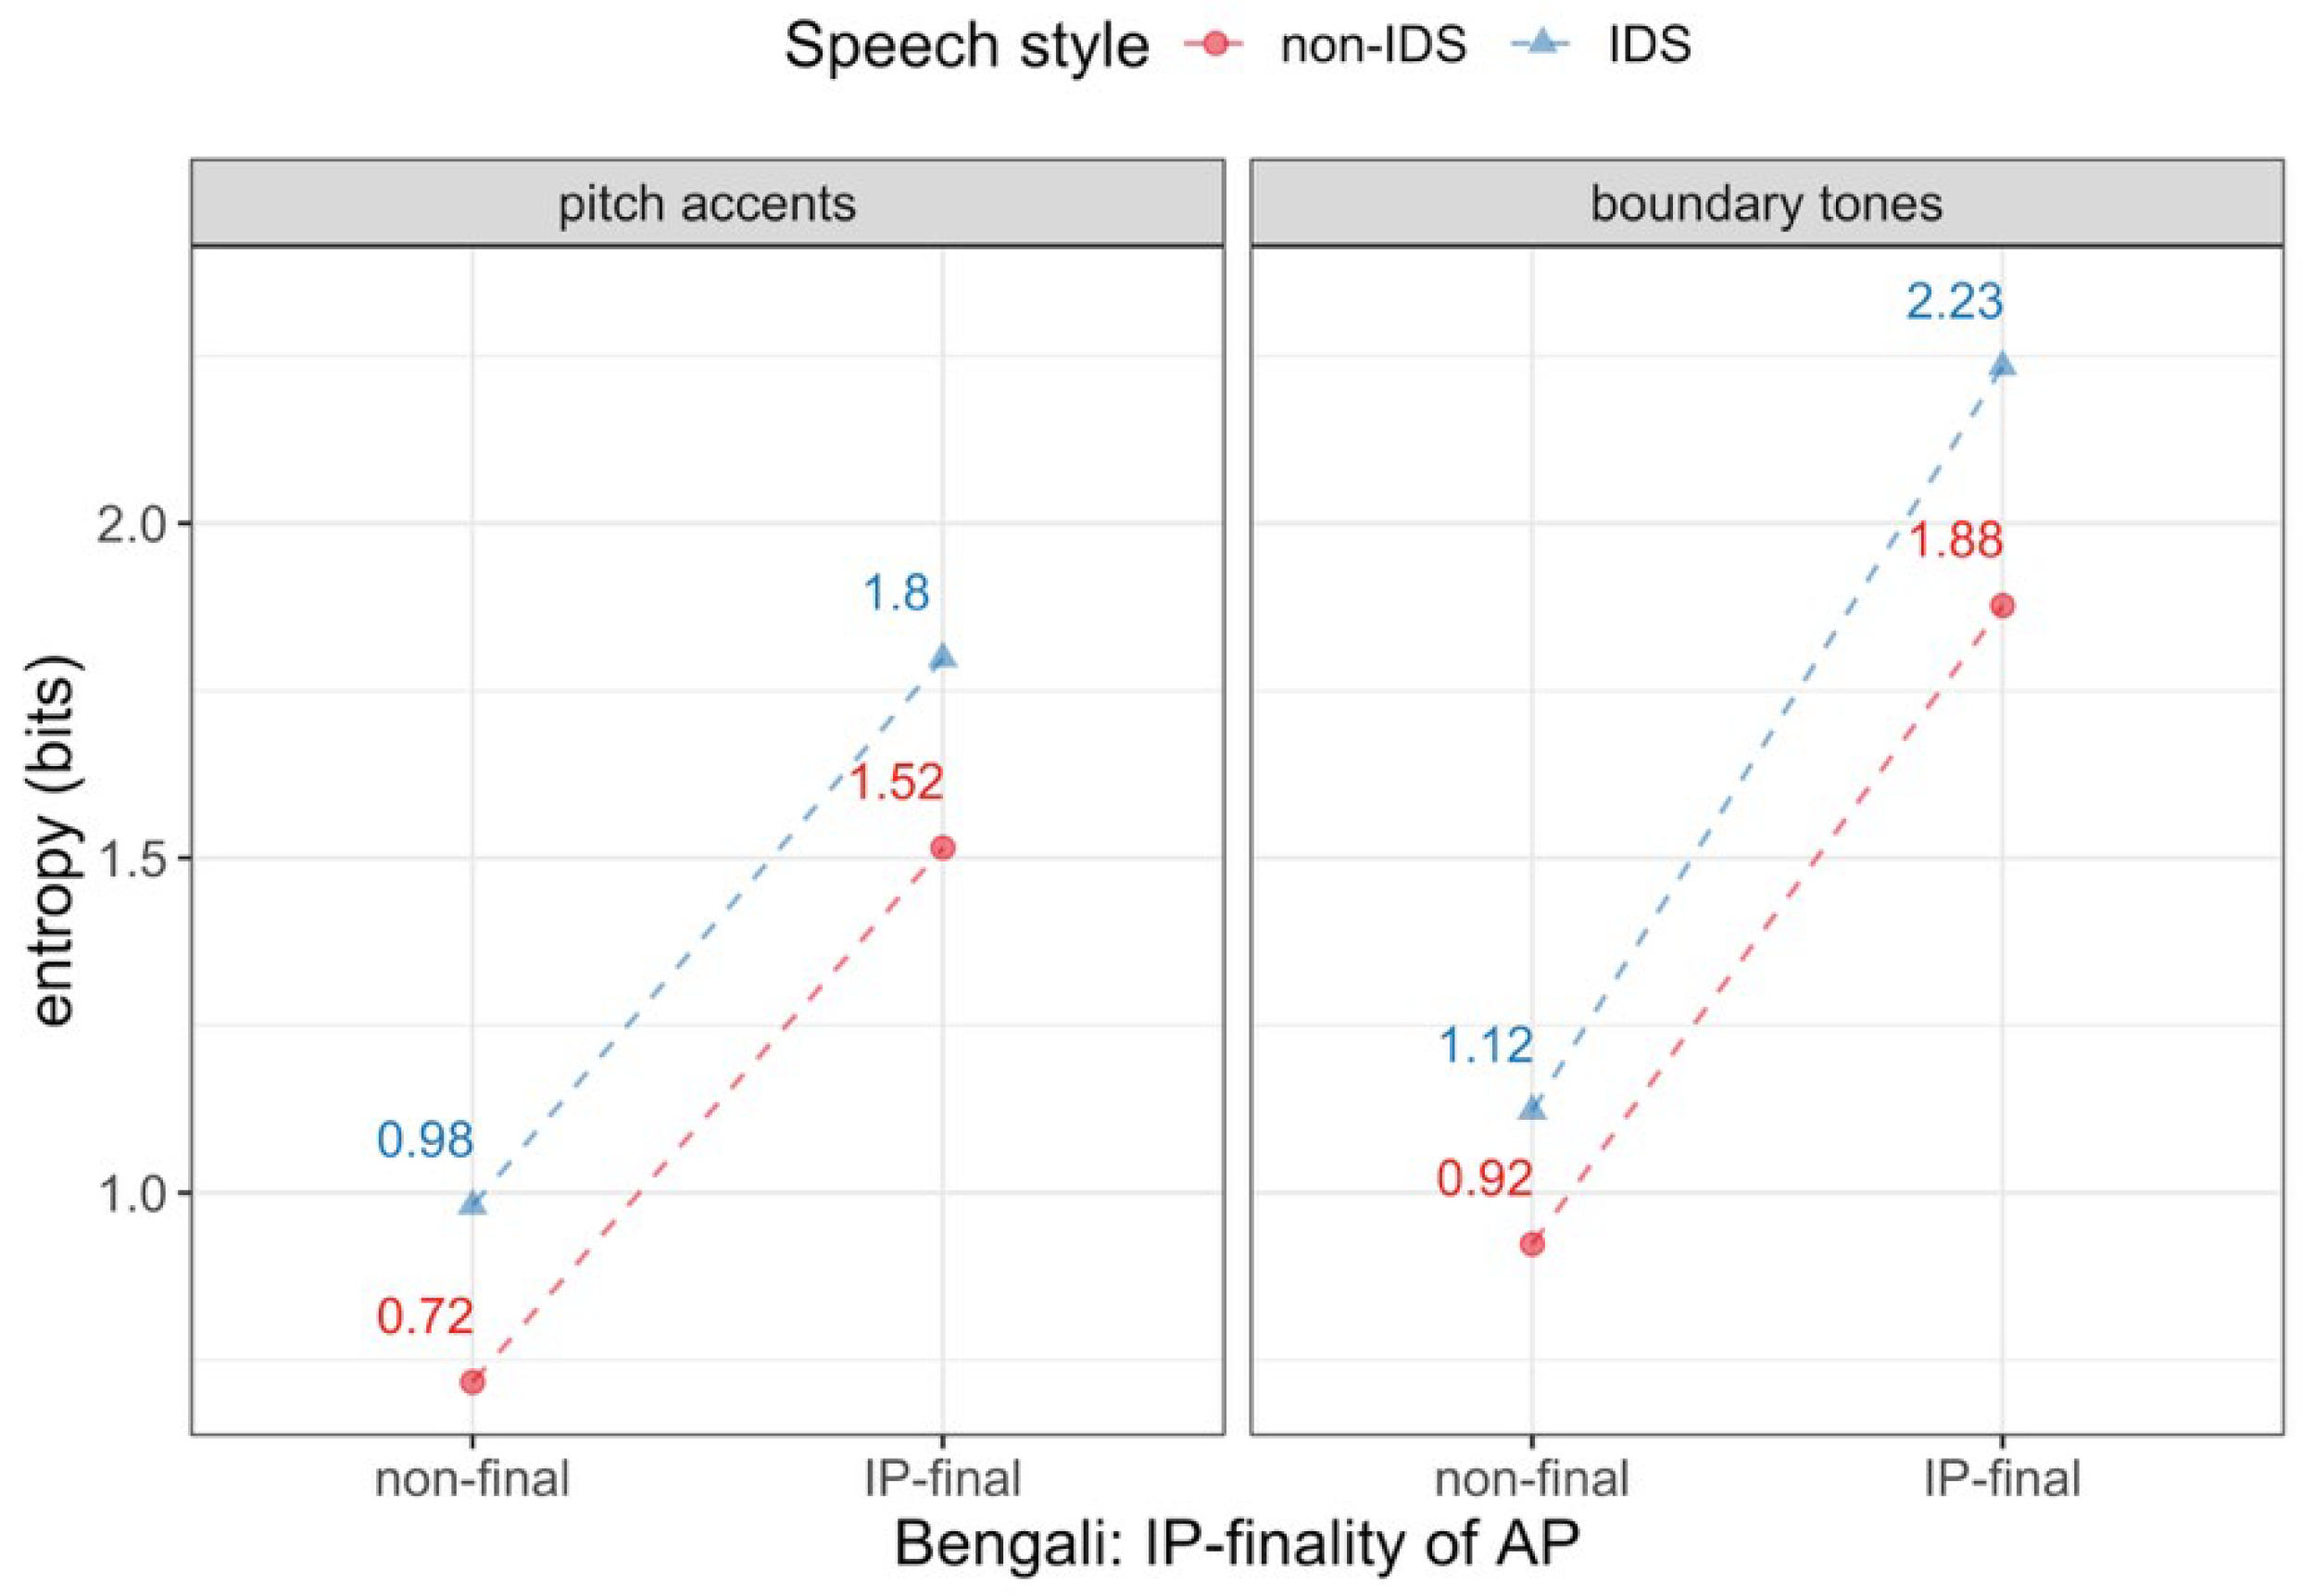
Figure 7 compares the entropy in Bengali intonational melodies at choice points for pitch accents (left panel) and boundary tones (right panel) in IP-final vs. non-final APs and across speech styles (non-IDS: red, IDS: blue). A detailed description of how to interpret the choice points is given in Section 3.2.3. There are two main findings. First, choice points for both pitch accents and boundary tones are overall less predictable in IDS (blue points above red ones). Second, IP-final position stands out as the more unpredictable (i.e., higher entropy) part of Bengali intonational melodies compared to non-final position in both speech styles, especially at the choice of IP boundary tone. The increased unpredictability for boundary tone choice in IP-final APs from non-final APs is consistent with the more uniform probability distribution over IP boundary tones than AP/ip boundary tones in Figure 6a. The concomitant increased unpredictability in pitch accent choice in IP-final APs is consistent with the shift in likelihood away from L* in IP-final position in Figure 6b.
English
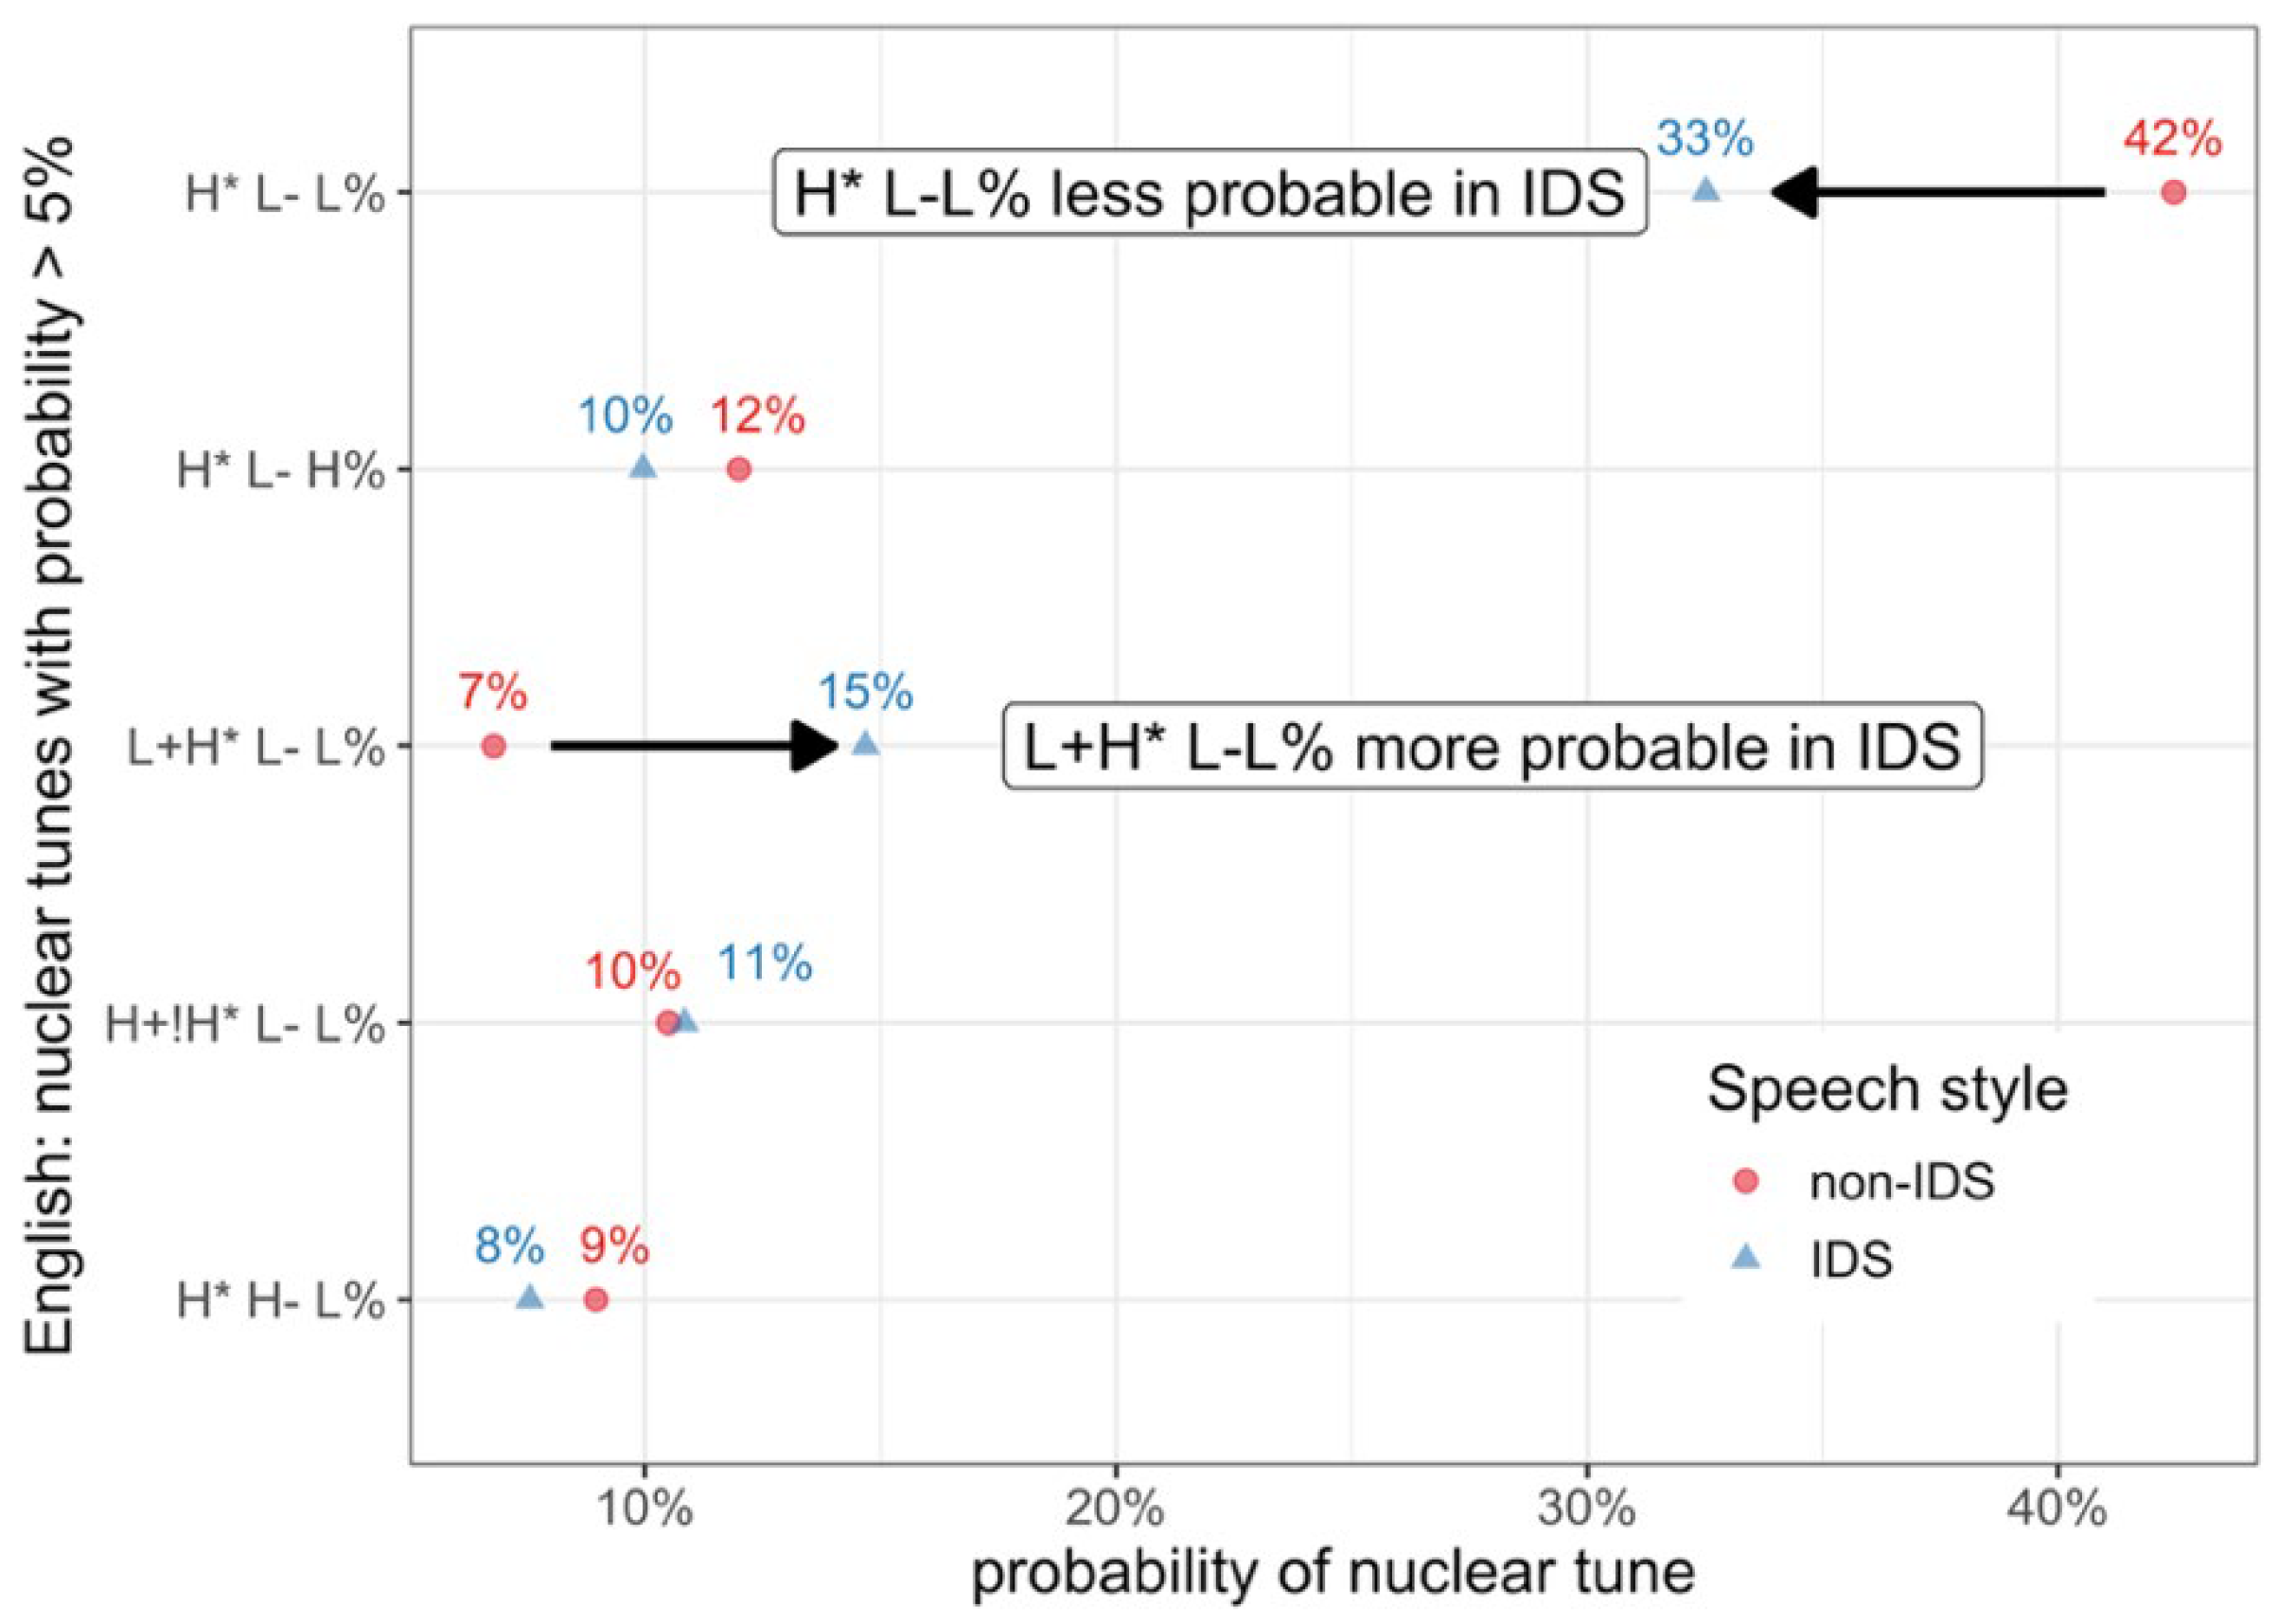
Based on the computed MAE-ToBI FSAs, English melodies are not dominated by one particular pattern, unlike Bengali, with its predominance of single pitch accent L* melodies. We can still get a sense of the distribution over possible melodies by looking at just the nuclear tune—the sequence of the IP-final pitch accent followed by the ip and IP boundary tones. Figure 8 shows the distribution of probability over nuclear tunes with greater than 5% likelihood. H* L-L% is the most likely: 42% probable in non-IDS, dropping to 33% probable in IDS. The other noticeable change between speech styles is an increase in likelihood from 7% to 15% in IDS for L+H* L-L%.
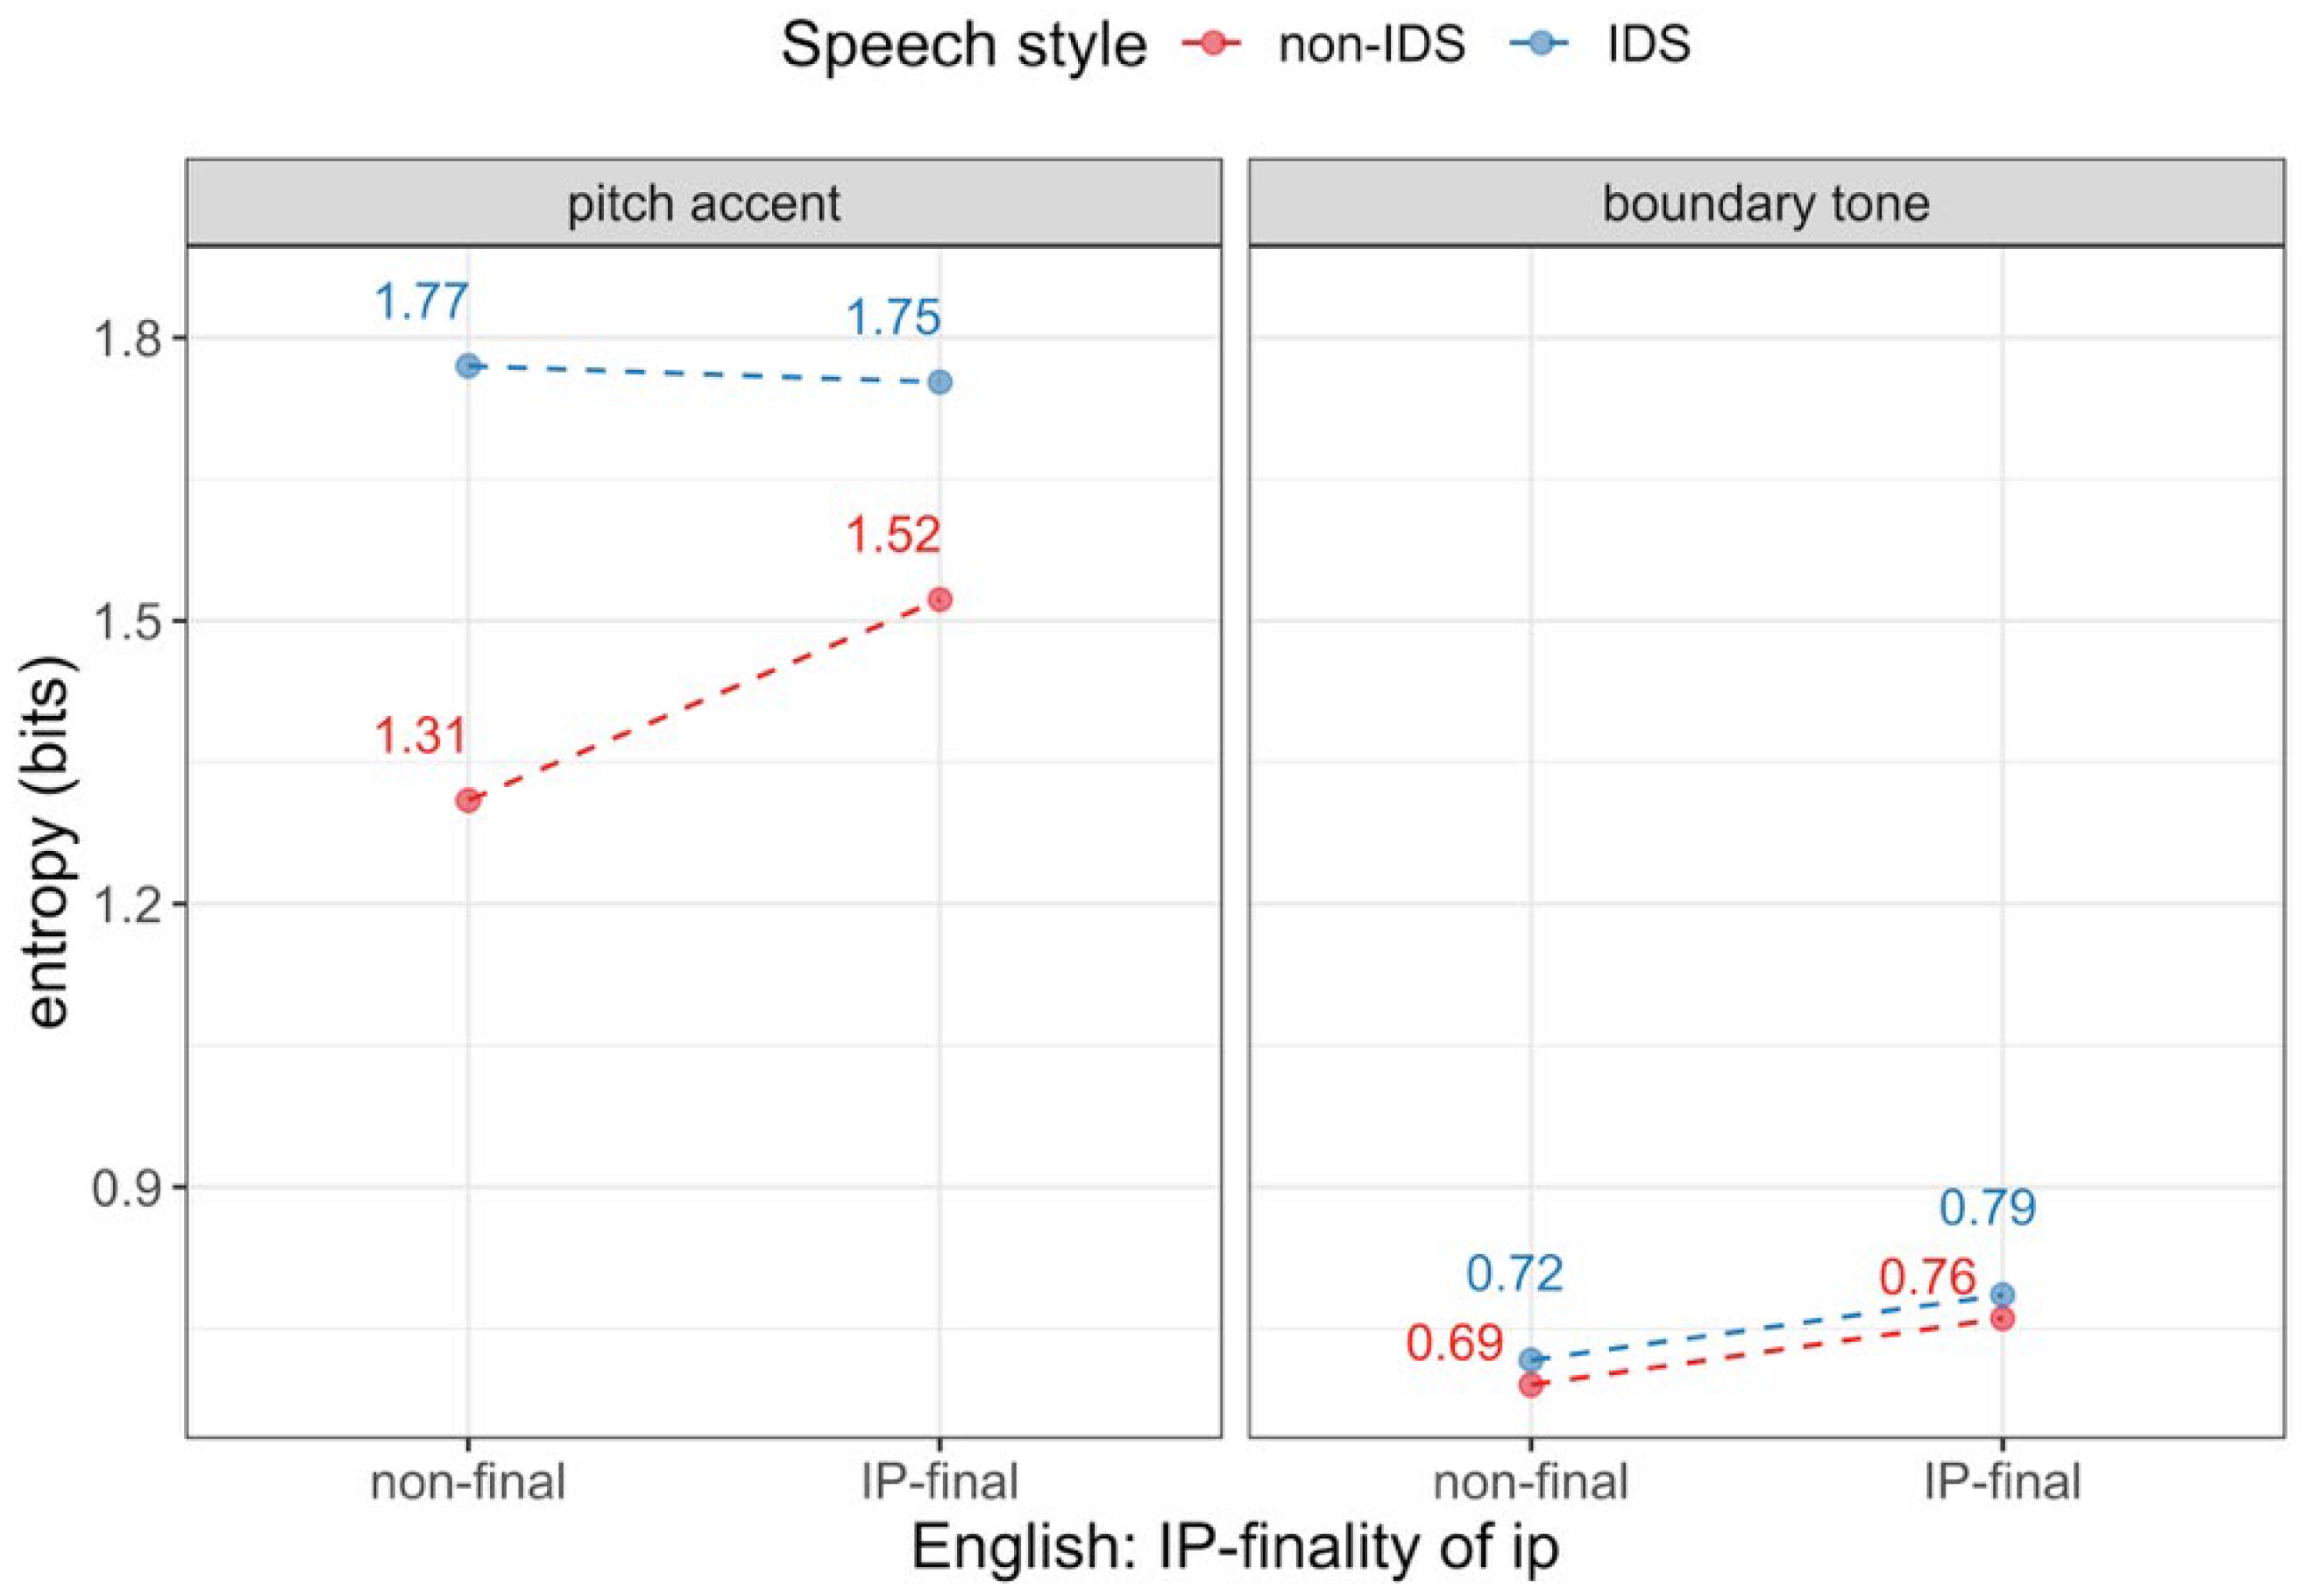
Figure 9 compares entropy in the MAE-ToBI FSAs at choice points for ip-noninitial pitch accents and ip/IP-final boundary tones, in both speech styles (non-IDS: red, IDS: blue). Most strikingly, pitch accent choice (left panel, entropies of 1.31 to 1.77 bits) is more unpredictable overall than boundary tone choice (right panel, entropies of only 0.7–0.8 bits). Pitch accent, but not boundary tone choice, is also overall less predictable in IDS than in non-IDS. Unlike in Bengali, IP-finality has a smaller and inconsistent effect on predictability. In non-IDS, IP-final pitch accents are less predictable than non-final ones (by 0.2 bits), but IP-finality has a minimal effect on pitch accent predictability in IDS. IP-final boundary tones are more predictable than non-final (i.e., ip) tones, but just by 0.07 bits (almost flat lines in the right panel). Predictability in boundary tone choice is also minimally affected by speech style (with red and blue lines almost on top of each other).
Thus, if deciding between IP-final vs. non-final ips, we could conclude that choices in IP-final ips are less predictable, but the evidence for this is much weaker for English than for the unpredictability of IP-final APs in Bengali. By far, a bigger difference in unpredictability in English comes in pitch accent choice compared to boundary tone choice, rather than in IP-final ips vs. non-final ips. The unpredictability in pitch accent choice relative to IP-final boundary tones is even more pronounced in IDS (the blue points are the highest in the pitch accent panel).

3.4. Discussion

Comparing entropy-theoretic predictability at IP-final vs. non-final choice points for pitch accents and boundary tones in non-IDS and IDS, we found that IP-final choice points were more unpredictable than non-final ones in both Bengali and English, though results in English were much weaker than in Bengali. In English, it was the higher unpredictability for pitch accent choices than boundary tone choices that stood out. This is not surprising based on the FSA intonational grammar for English in Figure 4, where there are more choices for pitch accents than ip or IP boundary tones. For English, since the probability distribution over pitch accent choices is more uniform than in Bengali, our predictability definition is much closer to the simpler “flexibility” definition, which simply counts the number of choices available at a choice point. We also found that pitch accent choices were overall less predictable in IDS than in non-IDS for English. Both pitch accent and boundary tone choices were overall less predictable in IDS for Bengali. We can now fill in the blanks in the Predictability Hypothesis first stated in Section 1.1:
  • Predictability Hypothesis (Updated). Intonational exaggeration is restricted to where tonal choice is most unpredictable in the intonational melody. Updated Prediction: Intonational exaggeration is restricted to IP-final APs in Bengali and to pitch accents in English.
We can now update the Table 1 predictions for the Predictability Hypothesis as follows, in Table 2.
For Bengali, the Predictability Hypothesis has the same predictions as the Phrase-finality Hypothesis. For English, though, the predictions of these two hypotheses diverge; they are still not mutually exclusive, though.
In addition to the empirical results from this section, we highlight some methodological contributions from bringing computational linguistics together with intonational phonology. First, we showed that even just parsing intonationally transcribed corpora with FSA representations of intonational grammars is useful for continuing the development of phonological analyses of a language’s intonational melodies. As mentioned in Section 3.2.2, doing so revealed both typographical errors in the original transcriptions, as well as needed revisions to phonological analyses of Bengali intonation. Second, we showed that augmenting traditional FSA representations of intonational grammars with probabilities (Dainora, 2001, 2002, 2006) was critical for capturing systematic differences in different speech styles.
With the probabilistic FSAs, we were also able to generalize Igarashi et al. (2013)’s “flexibility” at a choice point in an intonational melody to an entropy-theoretic definition of predictability. We showed that this more complicated definition is warranted. Just counting up the number of choices at a choice point, regardless of how likely each choice is, would have provided an incorrect characterization of where unpredictability is concentrated in Bengali melodies: in pitch accents in IP-non-final APs, rather than in IP-final APs. Moreover, we were able to take into account the history of previous choices for a given melody in understanding a choice point. For example, we would have drastically mischaracterized the predictability of ip/AP boundary tones in Bengali if we had failed to take into account the probability distribution over pitch accent choices immediately preceding the boundary tones (see Section 3.2.3 on the weighted average calculation for AP-initial monotonal accent states). Finally, we showed how to generate quantitative measures of the likelihood of different tonal choices at choice points chosen depending on the research question of interest. Here, we defined states in the FSAs to distinguish between IP-final and non-final choice points.
With the prerequisite of needing to characterize predictability at choice points in Bengali and English melodies in our corpora fulfilled, the rest of the paper tests the predictions of the three hypotheses in Table 2 in our corpus. Section 4 is devoted to the first column of the table: the effect of speech style on phonological choices in our corpus. The following two sections focus on the second column in Table 2: investigating phonetic measures of intonational exaggeration (Section 5 on lengthening and Section 6 on F0 range expansion).

4. The Effect of Speech Style on Prosodic Phonological Category Choices

Supporting the Phrase-finality or the Predictability Hypothesis as a consequence of phonological category choices requires evidence that speakers are more likely to choose particular intonational constituent categories in IDS relative to non-IDS. Thus, this section examines how phrasing choices were affected by speech style in our corpus, following Martin et al. (2016). We largely replicated Martin et al. (2016)’s findings for Japanese, showing that speakers choose to chunk speech into more and larger intonational constituents in IDS. However, we additionally assessed the likelihood of IP-final vs. non-final APs in Bengali and ips in English. This is due to the importance of IP-finality for both the Phrase-finality and Predictability Hypotheses. Since the Predictability Hypothesis for English centers on the presence of accent, we also investigated the effect of speech style on the likelihood of a word being accented for English.

4.1. Methods

The number of different phrase types (APs, ip, and IPs) that a story repetition was chunked into was computed based on the intonational transcriptions (Section 2.2). Instances of the smallest prosodic constituent for each language (atomic chunks: APs for Bengali and ips for English) were also flagged as being IP-final or not. The number of utterances in a story repetition was determined following Section 2.3.
To assess whether speakers broke the story into a larger number of a particular type of prosodic constituent in IDS relative to non-IDS, mixed effects Poisson regressions were run with the number of that type of constituent as the response variable, Style as a predictor, and Gender and Repetition as covariates. By-speaker random intercepts and slopes for Style were included in the model if it converged and was nonsingular. That was not the case for Bengali APs or ips or English IPs and utterances. These included only by-speaker random intercepts.
To assess the effect of IP-finality on AP counts in Bengali and ip counts in English across styles, mixed effects Poisson regressions were also run with the number of APs/ips as the response variable; Style, IP-finality (non-final; final), and their interaction as predictors; and Gender and Repetition as covariates. The model for Bengali APs included by-speaker random intercepts and a random slope for IP-finality. Random slopes for Style had perfect correlations and were excluded. For English, including a random slope for Style in addition to a by-speaker random intercept did not improve the model in a likelihood ratio test (LRT) (χ2(2) = 0.036, p = 0.98), but including a random slope for IP-finality did (χ2(2) = 25.08, p < 0.001). The model for English ips thus included the same random effects structure as the model for Bengali APs. We did not assess the effect of IP-finality on ip counts in Bengali since the majority of IPs contained only a single ip (Figure 10a). Additionally, our hypotheses in Table 2 are stated in terms of atomic chunks, and the atomic chunk in Bengali is the AP. Trigamma function estimates were used for all pseudo-R estimates, as recommended in the MuMIn documentation for the r.squaredGLMM function (Bartoń, 2025). All Poisson models were checked for overdispersion using the overdisp_fun function in Bolker (2025), which indicated no overdispersion for any of the models. Code for the analyses in this section is referenced in the OSF wiki page “Prosodic phrasing (Section 4)”.

4.2. Results

We first present results on how Style affected the number of phrases in the telling of the story. Like in Martin et al. (2016), these first results do not take IP-finality into account (Section 4.2.1). We then assess the effect of Style on the likelihood of IP-final vs. non-final atomic chunks (Section 4.2.2) and on the likelihood of a word being accented in English (Section 4.2.3).

4.2.1. Phrasing Without Taking IP-Finality into Account

Table 3 shows the mean number (and standard deviation) of APs, ips, IPs, and utterances (200 or 300 ms silence thresholds) in a story repetition, averaged across speakers and repetitions.
Table 4 and Table 5 summarize mixed effects Poisson regressions modeling the effect of Style on the total number of constituents a story repetition was chunked into. Speakers significantly increased the number of phrases they chunked the story into from non-IDS to IDS for each type of constituent in both languages, with one exception: the number of APs in the story in Bengali significantly decreased from non-IDS to IDS by a factor of 0.90 (Style: β = −0.11, p < 0.001).
Here, we only report results from each regression for Style, as well as marginal and conditional R2. Complete results are available in the OSF repository in analyze_number_constituents.Rmd (see OSF wiki page “Prosodic phrasing (Section 4)”). Since the dependent variable for Poisson models is log-transformed, the coefficient estimates for predictors must be exponentiated to be interpreted on the count scale. They thus are multiplicative factors. These are reported in the eβ columns in all Poisson regression tables.
Figure 10 shows how Style affected the distribution of the number of smaller units (APs and ips) in an IP in the Bengali and English corpora, over speakers and repetitions.13 There was a total of 1367 IPs in the Bengali corpus (549 for non-IDS; 818 for IDS) and 955 IPs in the English corpus (411 for non-IDS; 544 for IDS). The frequency of the number of IPs with a given number of APs or ips is shown with blue bars for IDS, above the x-axis. Frequencies for non-IDS are shown with red bars mirrored below the x-axis. The purpose of the mirroring is to make it easier to visually compare the shift in distribution between non-IDS and IDS.
Figure 10a shows that IPs containing only 1–2 ips occurred 99% of the time in Bengali IDS and 93% of the time in non-IDS. Moreover, 718 IPs (88%) had a single ip in IDS vs. only 367 (67%) in non-IDS. That is, the vast majority of ips in Bengali were IP-final (87% in IDS; 73% in non-IDS). English IPs also predominantly contained 1–2 ips, but overall tended to contain more ips than Bengali (Figure 10b). Figure 10a,b show that the shape of the distribution over the number of ips in an IP is similar across styles for both languages: a clear mode for single-ip IPs and then a fall off as the number of ips increase. But the shape of the distribution for the number of APs in an IP is strikingly different between styles for Bengali. Figure 10c shows that the distribution over the number of APs in an IP in Bengali fell roughly exponentially, while the distribution in non-IDS had a mode at four APs per IP. This exceptional pattern of behavior for the distribution of the number of APs in an IP is consistent with the exceptional decrease in the total number of APs (Table 4): 329 (40%) of IPs contained just a single AP in IDS, but only 75 (14%) in non-IDS.

4.2.2. Phrasing Taking IP-Finality into Account

The mysterious decrease in the number of APs in a story repetition from non-IDS to IDS in Bengali is elucidated once we take IP-finality into account. Table 6 and Table 7 summarize results from mixed effects Poisson regressions for the effect of Style and IP-finality on the number of APs in Bengali and the number of ips in English in a story repetition. In the eβ columns, the exponentiated coefficient estimate for the intercept gives the number of APs (Table 6) or ips (Table 7) when other predictors are at their average values. All other values in the eβ columns are multiplicative factors like in Table 4 and Table 5.
The Style:IP-finality interaction was significant for both Bengali APs (β = 0.78, p < 0.001) and English ips (β = 0.36, p < 0.001). (Interaction plots are in Appendix B.) Table 8 summarizes results from post hoc tests for the interaction. It is more easily interpretable with reference to the smoothed density plots in Figure 11, which separate out IP-final/non-final APs in Bengali and IP-final/non-final ips in English. Distributions for IDS are plotted in dark and light blue above the x-axis. Distributions for non-IDS are in red and pink, mirrored below the x-axis to make the four distributions easier to compare without getting too crowded. IP-final constituents are plotted in darker colors (dark blue and red) and non-final constituents in lighter colors (light blue and pink).
Table 8 and Figure 11a show that in Bengali IDS, relative to non-IDS, there were significantly more IP-final APs (dark blue more rightward than red) and significantly fewer non-final APs (light blue leftward of pink). In addition, in non-IDS, there were significantly more non-final APs than IP-final ones (pink to the right of red, with barely any overlap). There was no significant difference between the number of IP-final vs. non-final APs in IDS (dark blue only marginally more leftward than light blue).
Table 8 and Figure 11b show that in English IDS, relative to non-IDS, there were significantly more IP-final ips (dark blue more rightward than red)—the same pattern as for Bengali APs. However, unlike for Bengali APs, there was no significant difference in the number of non-final ips between styles (pink and light blue mirror each other). The balance of the number of IP-final vs. non-final ips within a style in English was also flipped compared to Bengali APs. There were significantly fewer non-final than IP-final ips in IDS (light blue well left of dark blue) and no difference between the number of non-final and IP-final ips in non-IDS (pink and red both centered around 12 ips).
In summary, the balance between IP-final vs. non-final APs tilted towards having significantly more IP-final APs in IDS relative to non-IDS in Bengali (post hoc test for differences of differences: β = 0.78, z = 11.31, p < 0.001). The same pattern is true for IP-final vs. non-final ips in English (post hoc test: β = 0.36, z = 3.69, p < 0.001).

4.2.3. The Effect of Style on the Likelihood of a Word to Be Accented in English

We performed mixed effects logistic regressions to assess the effect of Style on the likelihood of a word being accented in English. A model comparison between a baseline model (with just our control variables of Gender and Repetition and a by-word random intercept) and a model that additionally included Style and a by-speaker random slope for Style showed that a model for the likelihood of a word being accented was not improved by including Style (χ2(2) = 1.08, p = 0.58).

4.3. Discussion

Much like Martin et al. (2016)’s results for Japanese, Bengali and English speakers broke the story into more prosodic chunks in IDS compared to non-IDS: more pause-bounded utterances, more IPs, and more ips. An increased number of chunks for the same text across styles means that chunks of all sizes were generally shorter in IDS, in the sense of containing fewer words. We confirmed that IPs were also shorter in terms of containing fewer chunks (Figure 10). In IDS, IPs were chunked into fewer ips in both languages, and into fewer APs in Bengali. Also in IDS, the number of single-AP IPs increased in Bengali, and the number of single-ip IPs increased in both languages in IDS. As a consequence, the balance between IP-final vs. non-final APs in Bengali shifted towards more IP-final ones in IDS. This same shift in balance occurred for IP-final vs. non-final ips in English. In English, the total number of ips increased in IDS vs. non-IDS because the number of IP-final ips increased, while the number of non-final ips stayed the same. But in Bengali, the total number of APs decreased in IDS vs. non-IDS, unlike other prosodic constituent types. While the number of IP-final APs did increase in IDS, this increase was not as large as the decrease in the number of non-final APs in IDS.
In summary, this section laid the groundwork for testing the Pragmatic Restriction, Phrase-finality, and Predictability Hypotheses in Bengali and English. The presence of Style:IP-finality interactions in phrasing choices of the speakers is inconsistent with the Pragmatic Restriction Hypothesis for both languages. Furthermore, English speakers did not choose to increase unpredictable regions in intonational melodies in IDS by increasing the number of accented words. This result is already sufficient to rule out the Predictability Hypothesis for English. However, speakers in both languages did choose to shift the balance of atomic chunks to be IP-final. That means the Phrase-finality Hypothesis for both languages and the Predictability Hypothesis for Bengali are still in the running, pending results on phonetic implementation.
Since IP-final APs in Bengali and IP-final ips in English have IP boundary tones phonetically timed at their right edges, an increase in the proportion and number of these IP-final units in IDS means an increase in the frequency of instances of IP boundary tones in IDS. In Bengali, due to boundary tone overriding (Section 1.2.2), this increase in IP boundary tones is at the expense of AP/ip boundary tones. IP boundary tones in both languages are sites where large excursions in F0 can occur—larger than AP/ip boundary tones—so replacing AP boundary tones with IP boundary tones in Bengali (from overriding) and stacking IP boundary tones on top of ip boundary tones in English would be expected to result in wider F0 excursions in IDS in both languages. An increase in IP-final units also implies an increase in instances of IP-final pre-boundary lengthening, which is expected to be greater than pre-boundary lengthening in smaller prosodic constituents like APs and ips. Section 5 and Section 6 test if our corpus did indeed exhibit IP-final lengthening (Section 5) and IP-final F0 range expansion (Section 6).

5. Intonational Exaggeration via Duration: Pre-Boundary Lengthening

We first reiterate hypothesis predictions for intonational exaggeration via pre-boundary lengthening as a consequence of phonological choices (Table 2, second column). The Pragmatic Restriction Hypothesis predicts no Style:IP-finality interaction for duration—durations are longer in IDS than in non-IDS across all parts of an intonational melody for both Bengali and English in our corpus. That is, the speech rate is globally and uniformly slower to the same degree over the course of an intonational phrase in IDS. In contrast, the other hypotheses predict lengthening due to particular phonological choices for the intonational melody. The Phrase-finality Hypothesis and Predictability Hypothesis for Bengali predict a (positive) main effect of IP-finality on duration, independent of Style. Section 4 already shows that speakers are not more likely to accent words in IDS in English, which is inconsistent with the Predictability Hypothesis for English. The phonetic implementation prediction of this hypothesis is that there is a (positive) main effect of Accent on duration, which we still test here.
To test the predictions of our hypotheses, we performed regressions for word-final syllable duration (see Section 5.1), including prosodic structure—the effects of Position (e.g., AP-medial, AP-final, ip-final, IP-final for Bengali)14 and Accent (whether a word is accented or not). We included Accent since it is a factor of interest in testing the Predictability Hypothesis for English. For Bengali, Accent was included as a control factor since there have been some reports that stressed syllables in Bengali (which license pitch accent) may be lengthened (see Khan, 2008, p. 24).

5.1. Methods

Following Martin et al. (2016), we used the 200 ms threshold for pauses to partition recordings into utterances. We also initially followed Martin et al. (2016)’s operationalization of speech rate, except for syllables rather than moras: we computed mean syllable durations for each word by dividing the duration of the word by the number of syllables in the word. Plots of the distribution of the number of syllables in a word are in Appendix C.1. In Bengali, there were 105 words in the story: 68% bisyllabic and 23% monosyllabic. In English, there were 113 words: 78% monosyllabic and 19% bisyllabic. In both languages, the mean syllable duration over the word was, therefore, largely computed over just 1–2 syllables. Thus, although the scope of pre-boundary lengthening can be attenuated with distance from the right edge of a phrase-final word (Berkovits, 1993b, 1993a, 1994; Byrd, 2000; Byrd et al., 2006; Turk & Shattuck-Hufnagel, 2007; Wightman et al., 1992, i.a.), we did not expect averaging duration over syllables in a word to inhibit the detection of pre-boundary lengthening in a phrase-final word. As a precaution, though, we also ran regressions with word-final syllable duration as the dependent variable. To preview results, this change in dependent variables did result in significant Style:Position interactions in Bengali that were not otherwise detected. We present models for word-final syllables in this section. Analyses of mean syllable duration models are presented in Appendix C.2 and Appendix C.3 and yield the same general pattern of results as in Figure 12.15
While Martin et al. (2016) analyzed raw durations, we log-transformed durations. The distribution of raw durations across and within all speakers in both Bengali and English was highly skewed to the left. This skew can lead to potential violations of regression assumptions, and log-transforming durations in linguistics is commonly done to address this issue (Sonderegger, 2023, pp. 108–110; Winter, 2019, pp. 93–94). We also considered but ultimately rejected the procedure of removing outliers based on how many standard deviations they were away from the mean. Doing so systematically targeted phrase-final IDS words for exclusion, particularly in Bengali.
Like Martin et al. (2016), we performed two kinds of mixed effects linear regression analyses with log-transformed mean (or word-final) syllable duration as the dependent variable: (i) only including Style as a fixed effect without information about prosodic structure and (ii) also including a word-level Position factor, as well as a word-level Accent factor (not in Martin et al. (2016)) to take prosodic structure into account. We defined word-level over word types (Bengali: 77 distinct words; English: 64), which allowed for the comparison of the same word in different positions and with different accenting. We defined Position differently from Martin et al. (2016), with each word classified as one of four levels in Bengali: IP-final (and possibly utterance-final), ip-final (but not IP-final), AP-final (but not ip-final), and non-final (i.e., AP-medial).16 The levels of Position for English were IP-final, ip-final, and non-final (i.e., ip-medial). We excluded the utterance-final level included in Martin et al. (2016) since it was not defined on the basis of intonational tones like the other constituents. The Accent factor indicated whether a word was transcribed as having a pitch accent or not. It allowed us to test for enhanced lengthening in IDS on accented compared to unaccented words, which was expected in English by the Predictability Hypothesis.
We used simple coding (Sonderegger, 2023, pp. 200–201) for position, which consisted of centered contrasts of all higher levels against the baseline level of “non-final” (AP-medial position for Bengali; ip-medial position for English). This coding allowed us to assess whether there was pre-boundary lengthening at higher levels of the hierarchy. For example, the contrast coding for IP-final position in Bengali compared the duration of IP-final word-final syllables to the duration of AP-medial word-final syllables.
Like Martin et al. (2016), we included by-speaker and by-word random intercepts and random slopes for Style. Regressions including Position also included by-word random intercepts for Position and, for Bengali, also random slopes. Random slopes for Position in English yielded near-perfect correlations and were thus omitted. Including the by-word random effects helped control for differences between words, e.g., segmental differences between words, in assessing the effects of Style and Position on durations. Unlike Martin et al. (2016), we also included Word Length in syllables and phones as covariates (in addition to Gender and Repetition) when justified by model comparison. We also excluded by-speaker random slopes for Position and random slopes for Accent because they had extremely small variances or led to convergence and singularity issues.
In Martin et al. (2016), the effect of speech style was significant in regression models that did not include prosodic position as a factor, but nonsignificant in models that did include prosodic position. Because Style is still significant in our models even when we take prosodic position into account, the regressions not including prosodic position are not critical in the same way as a baseline for us. We include them in Appendix C.2.

5.2. Results

Final regression model outputs for log-transformed word-final syllable duration analyses conditioning on prosodic structure are given in Table 9 and Table 10. The Bengali model in Table 9 excludes Speaker f01, whose shifts from non-IDS to IDS were far more extreme than the other speakers, and could thus overwhelm the overall results; see Table A11 in Appendix C.4. for the model with all speakers. The column labeled “eβ” gives (i) the word-final syllable duration with all other predictors at average values for the Intercept row and (ii) the multiplicative factors estimated for the predictors in other rows. Like in the Poisson regressions in Section 4, because the response variable of duration was log-transformed, coefficient estimates are most easily interpreted as eβ multiplicative factors. The column labeled “Change (ms)” gives the change in duration predicted by the model for each predictor when the word-final syllable duration is at the value given in the Intercept row in the “eβ” column (e.g., 198.7 ms for Bengali). Because the word length covariates were rescaled (Section 2.4), note that the change corresponds to a 2σ increase in those predictors rather than an increase in one syllable or one phone. The rescaling allows us to directly compare the relative sizes of the coefficient estimates.
We started with base models: log.fin.syll.dur ~ style + gender + rep.order + (1 + style | speaker) + (1 + style | word). Adding Position (and for Bengali, by-word random slopes for Position) significantly improved the base models by LRTs (Bengali: χ2(15) = 2107.8, p < 0.001; English: χ2(2) = 934.93, p < 0.001). Also including Accent improved the models (Bengali: χ2(1) = 59.84, p < 0.001; English: χ2(1) = 230.95, p < 0.001). But then, adding a Style:Position interaction improved only the Bengali model (Bengali: χ2(3) = 11.92, p = 0.008; English: χ2(2) = 1.35, p = 0.51). The final model for Bengali also included Style:Accent and Position:Accent interactions. The final English model included no interactions at all. Model comparisons in full are in Appendix C.4.
Table 10. English: Fixed effects and model fit for log-transformed word-final syllable duration, with conditioning on prosodic structure.
CoefficientβSE(β)tdfpeβChange (ms)
Intercept5.510.042129.764.68<0.001247.8 msN/A
Style0.140.0177.9813.20<0.0011.1536.9
Position (ip)0.370.01623.206677.00<0.0011.45112.0
Position (IP)0.580.01734.026668.00<0.0011.78194.0
Accent0.200.01315.466656.00<0.0011.2254.4
Word Length (syll)−0.680.11−6.426249.00<0.0010.50−122.8
Word Length (phones)0.680.125.716154.00<0.0011.98243.3
Gender0.0480.0381.291.290.231.0512.3
Rep. (lin)−0.0100.004−2.336605.000.0200.99−2.5
Rep. (quad)-<0.0010.004−0.0156656.000.991.00−0.02
N: 6767; groups: word, 64; speaker, 10. Marginal R2 = 0.45, cond. = 0.83. VIFs for length: 3.5. Formula: log.fin.syll.dur ~ style + position + accent + n.syll + gender + rep.order + (1 + style |speaker) + (1 + style | word).
In both languages, there is a main effect of Style, i.e., lengthening of IP-medial words due to IDS. But this lengthening is tiny relative to lengthening due purely to IP-final position, independent of Style. Any enhanced lengthening in IDS due to phrase-finality or accent (i.e., Style:Position and Style:Accent interactions) is a still smaller effect. To visualize relative effect size, exponentiated coefficient estimates (i.e., eβ) with 95% CIs are shown in Figure 12 for the Bengali and English models in Table 9 and Table 10. These are multiplicative factors, so a value of 1 means that a predictor has no effect on duration.
Word Length and IP-finality have by far the largest effect sizes, followed by ip-finality, then Style and Accent (and AP-finality in Bengali), and then Style:Position and Style:Accent interactions for Bengali.

5.3. Discussion

This section operationalized the phonetic implementation of intonational exaggeration in terms of increasing word-final syllable durations. Both the Bengali and English corpora showed evidence of IP-final pre-boundary lengthening, independent of speech style. Together with results from Section 4 showing that speakers preferred IP-final atomic chunks in IDS, these durational results support the Phrase-finality Hypothesis for both languages and the Predictability Hypothesis for Bengali (Table 2). As visualized in Figure 12, the effect size of pre-boundary lengthening in IPs (and to a smaller extent, in ips) is much bigger than that of Style or Accent or any Style interaction. Lengthening in IP-final position is an order of magnitude larger than those other effects based on the “Change” column in the regression tables. Thus, by choosing to break up speech into more chunks and larger chunks like IPs in IDS (Section 3), speakers introduce many more sites for the large effects of IP-final lengthening. Even if speakers have a slightly slower overall speech rate in IDS (i.e., a main effect of Style—in IDS, AP-medial syllables in Bengali and ip-medial syllables in English are longer), by far the largest contribution to slower speech in IDS is pre-boundary lengthening in the many more IP-final atomic chunks in IDS.
The presence of Style:Position interactions in the Bengali duration model is inconsistent with the Pragmatic Restriction Hypothesis, which predicts uniform lengthening in IDS across the IP. However, neither Style:Position nor Style:Accent interactions were supported in the English duration model. The lack of these interactions is consistent with the Pragmatic Restriction Hypothesis.

6. Intonational Exaggeration via F0 Range Expansion

For intonational exaggeration operationalized as lengthening, the previous section already showed that our results support the Phrase-finality Hypothesis for both Bengali and English and the Predictability Hypothesis for Bengali. This section examines which of our hypotheses are consistent with the phonetic implementation of intonational exaggeration via F0 range expansion. Much like for lengthening, the Phrase-finality Hypothesis, as well as the Predictability Hypothesis for Bengali, predicts a main effect of IP-finality. That is, there is F0 range expansion in IP-final atomic chunks relative to non-final ones, independent of Style. The Pragmatic Restriction Hypothesis predicts that there is no Style:IP-finality interaction for F0 range. More specifically, it predicts that F0 range expansion in IP-final atomic chunks relative to non-final ones is not enhanced in IDS compared to non-IDS. We did not test the prediction of the Predictability Hypothesis for English, which is a (positive) main effect of accent for F0 range. Our F0 range analysis here is at the level of atomic chunks: the AP for Bengali and the ip for English. Since our analysis is at the level of the ip for English, it does not make sense to test for an effect of Accent. In the phonological analysis we follow (Section 1.2), every ip in English contains an accent.
More importantly, pitch accents and boundary tones jointly determine F0 contour shape in both Bengali and English. We cannot neatly separate them like in Japanese, like Igarashi et al. (2013) did by analyzing F0 over just the IP-final BPM boundary tone. Figure 1 exemplifies that it is not unusual for APs in Bengali to be 1–2 words, even in non-IDS. If we limited F0 range calculations to, e.g., the last word in the AP for [ɛk d ̪ in] in Figure 1b, we would miss the contribution of the L* to the F0 range.
Figure 13 shows F0 contours and waveforms for English Speaker m05 for the first sentence in the story. Even though ips in English can have more words and syllables than a Bengali AP (Section 4), it would still be misleading to compute F0 range over a smaller unit like the boundary tone. For example, in the IP-final ip and the Sun in Figure 13b, it is the L+H* and L-L% that jointly result in the large F0 range: the L+H* contributes the high target, while the L-L% contributes the following low target. Figure 13a has an example of a longer ip: disputing which was the stronger. In an ip like this, it could be possible to separate out a smaller unit of analysis, e.g., the nuclear tune “!H* L-H%”. But we do not miss potential contributions to the F0 range by also including material in the ip before the nuclear tune.
In addition to the empirical question of how speech style affects F0 range and how localized that effect is, this section also has the methodological goal of examining the operationalization of F0 range, especially in the context of the recent availability of large-scale IDS corpora of long-form recordings. One choice for operationalization that has already been mentioned is the unit of analysis over which an F0 property is computed, e.g., utterance vs. AP. Additionally, while an expanded F0 range is one of the most famous modifications in IDS, not much attention has been drawn to how to operationalize F0 range in studies of IDS: F0 range is operationalized as the difference between maximum and minimum F0. But this is a single point estimate that is very sensitive to the settings of F0 trackers and effects of voice quality and segmental perturbations, especially since it relies on extremum F0 values. These kinds of F0 tracking issues are bound to become even more prevalent in long-form recordings, which are typically much noisier than lab speech recordings (Blandon et al., 2023). Long-form recordings and, more generally, larger corpora of speech for studying IDS also introduce the challenge of a huge amount of data to process, whether by automated methods or human annotation.
F0 range scaling is a topic of research outside of IDS. Considerable work has explored how F0 range should be operationalized in a linguistically informed way based on production and perception experiments. Linguistic work commonly parameterizes a speaker’s pitch range with two independent variables: level and span (Ladd, 1996). While level refers to the height of a speaker’s range (e.g., it has been operationalized with mean or minimum or maximum F0), span refers to the range of F0s expressed by a speaker (see Patterson (2000), Ch. 2, for a review). Level and span have been operationalized in terms of linguistic tonal events such as the F0 peaks of pitch accents. Operationalization via the long-term distribution properties of F0 also remains prevalent and has the advantage of being amenable to automatic measurement.
As reviewed in Patterson (2000), some common long-term distribution measures of span have been the 90% range (the difference between the 95th and 5th percentiles), the 80% range (the difference between the 90th and 10th percentiles), and mean F0 ± 2SD (Jassem, 1971). For instance, de Leeuw (2019) compares F0 range across languages in a German bilingual using the 80% range. The lowest and highest F0 values are trimmed to guard against F0 tracking errors (De Looze & Rauzy, 2009; Jassem, 1971). Here, we test how robust typical F0 statistics measured in studying IDS are to these range cutoffs in our corpus and investigate if one cutoff might be better than another. We also use visualizations of F0 distributions to go beyond point estimates of span.

6.1. Methods

F0 values were extracted every 5 ms using the REAPER F0 algorithm (Talkin, 2014/2023), via the pyreaper Python 3.11.9 wrapper (Yamamoto et al., 2025) using default settings, except for F0 floors and ceilings. F0 ceilings were set on a speaker-by-speaker basis to be 50 Hz above the maximum F0 value observed for a given speaker in visual scans of F0 tracks in Praat, and the F0 floor was set to 40 Hz for all speakers to potentially handle regions of creaky voice (which were common, particularly for English speakers). An extracted F0 value was included in the data only if the timepoint at which the F0 value was extracted fell inside segmented word boundaries, if the speech was fluent, and if REAPER detected voicing at that timepoint.
We defined F0 range (st) as 12 log2(F0max − F0min) over the unit of analysis (i.e., the AP in Bengali and ip in English), where F0max and F0min are the highest and lowest F0-values in the unit of analysis in Hz. F0 quantities were computed using: (i) all F0 values (100% range, R100 for short) within the unit of analysis, (ii) only F0 values from the 2nd to the 98th percentile (96% range, R96), (iii) only F0 values from the 5th to the 95th percentile (90% range, R90), and (iv) only F0 values from the 10th to the 90th percentile (80% range, R80). R96 was added after examining quantile–quantile plots (Figure A6 and Figure A7).
To first probe the effects of Style and IP-finality, we performed exploratory analyses visualizing the distribution of F0 range in APs in Bengali and ips in English (Section 6.2.1). Then, we performed mixed effects linear regressions evaluating the effect of Style and IP-finality on F0 range within Bengali APs and English ips (Section 6.2.2). Random intercepts were included for the final boundary tone within the AP for Bengali and the ip for English. Final boundary tone was used as a proxy for melody type, like Igarashi et al. (2013) did for BPM types, to avoid anti-conservativity in the estimate of the effect of IP-finality. It should be noted that the final boundary tone is a crude proxy for melody type. However, there were too few instances of each melody type for statistical analysis if we also refined melody type to include preceding pitch accents. For Bengali, there were 11 melody types, ending in the following boundary tones: La, Ha, fHa, L-, !H-, H-, H%, L%, LH%, HL%, and HLH%. We excluded boundary tones fHaL% and M%, which occurred five times or fewer in each speech style. For English, there were nine melody types, ending in the following: H-, L-, !H-, H-H%, !H-H%, H-L%, !H-L%, L-H%, and L-L%. Since pitch accent choice is the locus of unpredictability in English, we also tried categorizing melody type by nuclear pitch accent, with six melody types: H*, H+!H*, L+H*, L*, !H*, and L+!H*.
Following Fernald et al. (1989) and Igarashi et al. (2013), we also analyzed the effect of Style alone on several F0 quantities within different units of analyses to probe how robust typical F0 statistics measured in studying IDS are to different choices of F0 range cutoffs and the unit of analysis (e.g., IP vs. ip). Because the key analysis for testing our hypotheses is the one including IP-finality as a factor described in the previous paragraph, these analyses are described in Appendix D.3. Overall, our results for these F0 statistics replicate cross-linguistic patterns and thus support the validity of properties of the simulated IDS recorded here as reflecting properties of IDS in general. In general, range (as well as minimum F0) was the most sensitive F0 parameter to the choice of the unit of analysis and percentile cutoffs.
Code for this section is in analyze_f0_stats.Rmd in the OSF repository (see the OSF wiki page “F0 range expansion (Section 6)”.

6.2. Results

Inspection of quantile–quantile plots (Appendix D.1) showed that above the 98th and below the 2nd percentile in both non-IDS and IDS corresponded to outlying F0 values. Increasing the percentile cutoffs would risk throwing out non-spurious data points. Therefore, we used the R96 (2–98%) threshold cutoff for analyses of IP-finality and Style.

6.2.1. Exploratory Analyses of the Distribution of F0 Range over Utterances, ips, and APs

Figure 14a,b plot F0 range distributions in Bengali and English separately for IP-final vs. non-final atomic chunks.17 F0 ranges in IP-final atomic chunks (darker colors) are uniformly higher than those in non-final atomic chunks (lighter colors) across speakers, independent of Style. The F0 distributions thus suggest results consistent with the Phrase-final Hypothesis in both languages and the Predictability Hypothesis in Bengali. In addition, the dark-colored IP-final AP distributions are clearly shifted higher in IDS (dark blue) than non-IDS (red) for Bengali in Figure 14a, but not English in Figure 14b. This result suggests a Style:IP-finality interaction inconsistent with the Pragmatic Restriction Hypothesis in Bengali, but not English.

6.2.2. Regressions for Testing the Effect of Style and IP-Finality on F0 Range

Table 11 and Table 12 report regressions for F0 range as the response variable, including IP-finality as a binary factor for Bengali APs and English ips. Consistent with Figure 14a, range in IP-final APs in Bengali was significantly higher by 3.42 st than in non-final APs (IP-finality: β = 3.42, p = 0.001). In addition, range was significantly higher in IDS than in non-IDS within both non-final and IP-final APs (Style: β = 2.37, p = 0.005). Speaker f01 was identified as influential for the Style effect. Excluding f01 attenuated the estimate of the increase in F0 range in IDS from 2.37 to 1.88 st (Style (no f01): β = 1.88, p = 0.001).
There was a significantly greater degree of F0 range expansion in IDS in IP-final APs relative to non-final APs (Style:IP-finality: β = 1.07, p = 0.003). This was driven by intonational melodies ending in L% compared to IP-nonfinal melodies ending in Ha, which constituted the majority of the melodies in the corpus (see Appendix D.2 for further details). In English, consistent with Figure 14b, range in IP-final ips was significantly higher by 3.13 st than in non-final ips (IP-finality: β = 3.13, p = 0.006). In addition, range was significantly higher in IDS than in non-IDS within both non-final and IP-final ips (Style: β = 1.65, p = 0.005). The Style:IP-finality interaction was not significant (β = 0.37, p = 0.49).

6.3. Discussion

F0 range was larger in IP-final atomic chunks than non-final ones by over 3 st in both Bengali and English. The robust increase in F0 range in IP-final regions relative to non-final ones confirms that the increase in IP-final tones/positions in IDS (see Section 4) results in F0 range expansion. This result is consistent with the Phrase-finality Hypothesis in both languages and the Predictability Hypothesis for Bengali. The lack of evidence for a Style:IP-finality interaction in English is consistent with the Pragmatic Restriction Hypothesis of uniform F0 range expansion across the melody in IDS. In Bengali, though, F0 range expansion in IP-final relative to non-final APs was further enhanced in IDS, which is inconsistent with the Pragmatic Restriction Hypothesis.
For operationalizing F0 range, we suggest that an 80% range is not appropriate for studying F0 modifications in IDS given that results for R80 consistently patterned differently from all other range cutoffs (Appendix D.3); 80% ranges are used, for instance, to compare F0 ranges between languages in bilinguals (de Leeuw, 2019; Passoni et al., 2022). But since IDS is known cross-linguistically to have the tendency to involve extremely high F0s for speakers, 80% ranges trim too much from the top. We also suggest that some trimming be considered, on the basis of exploratory visualizations like histogram/density plots and q-q plots. Here, we determined that a 96% range was appropriate for our data and F0 estimation results, based on these visualizations.

7. General Discussion and Conclusions

To review, we set out to test three hypotheses about the locus of intonational exaggeration in IDS in our study of Bengali and English simulated infant-directed storytelling. Recall that since we considered hypotheses about intonational exaggeration that is a consequence of phonological choices, each hypothesis has a two-part prediction. The phonological choice prediction is that speakers are more likely to choose a particular intonational phonological category in IDS, relative to non-IDS. The phonetic implementation prediction is that this particular intonational category exhibits phonetic characteristics of intonational exaggeration, independent of speech style. Both predictions must hold for the hypothesis to be supported. In this study, we operationalized intonational exaggeration as lengthening and F0 range expansion.
Table 13 summarizes the three hypotheses and the results from testing them in our corpora. The phonological choice prediction is in the second column, and the phonetic implementation prediction is in the fourth column. The third “Language” column summarizes results for the phonological choice predictions. The last two columns (“Bengali” and “English”) show the results for the phonetic implementation predictions (lengthening and F0 range expansion).
The Phrase-finality Hypothesis predicted that (i) speakers are more likely to choose atomic chunks (APs in Bengali; ips in English) to be IP-final in IDS than non-IDS, and (ii) IP-final atomic chunks show lengthening and F0 range expansion relative to non-final atomic chunks. These predictions were borne out in both languages.
The Predictability Hypothesis predicts that (i) speakers are more likely to utter the type of tone at the most unpredictable choice point of the intonational melody in IDS vs. non-IDS, and (ii) this choice of tone type shows lengthening and F0 range expansion relative to alternative choices. We determined the most unpredictable choice point in the melody in a language based on our non-IDS corpora, using information-theoretic methods computed with probabilistic finite state automata representing each language-specific intonational grammar (Section 3). The most unpredictable choice points in intonational melodies in our corpora occurred in IP-final APs in Bengali and at pitch accents in English. The Predictability Hypothesis for Bengali is thus identical to the Phrase-finality Hypothesis, and our results supported it. However, it was not the case that the English speakers were more likely to accent words in IDS than non-IDS, so the Predictability Hypothesis was not supported for English.
The Pragmatic Restriction Hypothesis predicts that speakers prefer to utter tone types that provide information about pragmatic intent in IDS. Based on the past literature, we assumed that pragmatically chosen tones in both English and Bengali occur throughout the intonational melody: in both IP-final and non-final atomic chunks. Thus, the Pragmatic Restriction Hypothesis for Bengali and English predicts that speakers’ preference for atomic chunks to be IP-final or non-final is not affected by speech style. This prediction for phonological choices did not hold up. Since the Pragmatic Restriction Hypothesis did not pick out a particular phonological category for Bengali and English, there is no second phonetic implementation prediction about a particular phonological category. However, in English, we did observe a lack of difference in the degree of lengthening and F0 range expansion in IDS relative to non-IDS between IP-final and non-final ips. This lack of difference is consistent with the globality of intonational exaggeration predicted by the Pragmatic Restriction Hypothesis.
In sum, while Igarashi et al. (2013) and Martin et al. (2016)’s results for the Japanese RIKEN corpus were consistent with all three hypotheses about the locus of intonational exaggeration, the Phrase-finality Hypothesis is the only hypothesis that was also supported in both Bengali and English in our study. Thus, the Phrase-finality Hypothesis is the only hypothesis supported in all three languages. The Phrase-finality Hypothesis is also the only hypothesis of the three that is not language-specific. Altogether, the results in Japanese, Bengali, and English show that speakers choose to chunk speech in IDS differently than in non-IDS. It is worth noting that the task for speakers for the RIKEN Japanese study was not a story-reading task, but a conversational task where the content of conversations differed between mother to infant (IDS) and mother to adult experimenter (ADS). The story-reading task in our study may limit how well our results reflect all kinds of infant-directed speech in general. However, the control of material uttered by speakers across speech styles does have a benefit for interpreting results. Because speakers read exactly the same text in both non-IDS and IDS in our study, the changes in phonological choices they made between speech styles must have been driven by the change in speech style and not by different words/content uttered.
In IDS, speakers chunk speech into more and shorter, higher-level intonational constituents. Put another way, speakers have a choice for each of the atomic intonational chunks—the lowest-level intonational constituents in the language (APs for Bengali, ips for English). For APs in Bengali, is the boundary tone an AP boundary tone (i.e., the AP is non-final), an ip boundary tone (i.e., the AP is ip-final), or an IP boundary tone (i.e., the AP is IP-final)? For ips in English, is the (right edge) boundary tone an ip boundary tone (the ip is not IP-final) or a stacked ip-IP boundary tone (the ip is IP-final)? By choosing to make more APs in Bengali and ips in English IP-final in IDS, speakers increase F0 range and durations. This is because F0 range is expanded, and pre-boundary lengthening is at its greatest in IP-final APs/ips, relative to non-final APs/ips. It is also worth noting that lengthening and F0 range expansion patterned together in how they were affected by speech style in our study. The changes in these different phonetic parameters going hand in hand further underscore the utility of conceptualizing phonetic changes across speech styles as a unified consequence of phonological intonational choices.
In this study, we focused on intonational exaggeration that is a consequence of phonological choices, but what about intonational exaggeration that is the consequence of within-category changes in phonetic implementation (Section 1), like Igarashi et al. (2013) showed for F0 range expansion in IDS within BPM types in Japanese? The results pertinent to this kind of intonational exaggeration come from Style:Position interactions for our models of duration in Section 5 and Style:IP-finality interactions for our models of F0 range in Section 6. As a note of caution, the small size of our corpus relative to the RIKEN corpus was a limitation for detecting evidence for within-category intonational exaggeration. A smaller corpus size means we were less likely to have sufficient sample sizes of different categories, especially all the different kinds of intonational tone categories for assessing F0 range expansion (see Section 6.2).
Nevertheless, we briefly consider the evidence for within-category intonational exaggeration in our study here. The English models showed no evidence for the presence of either kind of interaction and thus no evidence in support of within-category changes in phonetic implementation. For Bengali, the presence of Style:ip.fin, Style:IP.fin, and Style:AP.fin interactions in the model of duration (Table 9) showed that the degree of pre-boundary lengthening relative to AP-medial words in all these phrase-final positions is enhanced in IDS relative to non-IDS. This is evidence for within-category intonational exaggeration in pre-boundary lengthening. However, as we noted in Section 5, the effect sizes of these interactions are an order of magnitude smaller than the main effect of IP-final pre-boundary lengthening independent of speech style. Also, for Bengali, F0 range expansion in IDS was further enhanced in IP-final APs, at least for L%-ending melodies relative to Ha-ending melodies, but not over all melody types in general (Appendix D.2).
Another way in which the evidence for within-category exaggeration in this study is weaker than the evidence found for Japanese in Igarashi et al. (2013) is that we found a main effect for Style in all duration and F0 range expansion models. This means that we did find lengthening and F0 range expansion in non-IP-final position, unlike what was found in Japanese, where intonational exaggeration in IDS was restricted to IP-final position. In our study, intonational exaggeration in IDS was still present in IP-non-final atomic chunks, just to a lesser degree than in IP-final position. In sum, evidence for intonational exaggeration that is the consequence of within-category changes in lengthening and F0 range expansion in our study was quite limited.
We hope that our study amplifies the main point made in prosodic work on the Japanese RIKEN corpus (Igarashi et al., 2013; Martin et al., 2016; Mazuka et al., 2015): taking language-specific intonational phonology into account is important—even essential—for understanding phonetic manipulations in IDS. Our study did find lengthening and F0 range expansion in IP non-final position (main effects of Style) and without taking prosodic structure into account (Appendix C.2 and Appendix D.3). But we would have missed the strongest contribution to intonational exaggeration—speakers’ preference to make atomic chunks IP-final in IDS—if we had not taken speakers’ phonological choices for chunking into intonational constituents into account.
Additionally, we have demonstrated that cross-linguistic work on IDS that samples languages and language varieties with different kinds of intonational grammars is invaluable. Bengali and English look the same from the point of the Pragmatic Restriction Hypothesis: pragmatically chosen tones occur throughout the intonational melody. They also both have the same prosodic profile in lacking lexical tonal or accentual contrasts and having stress and stress-driven pitch accents. But their different intonational grammars allowed us to tease apart predictions for the locus of intonational exaggeration that were entangled for Japanese, due to its particular intonational grammar. Based on the Bengali and English intonational grammars we adopted in this study, our corpora revealed that Bengali and English diverge in the locus of unpredictability in intonational melodies. IP-final AP tonal choices (pitch accents and boundary tones) are the most unpredictable choice points in Bengali, while pitch accents in general are the most unpredictable choice points in English. This difference in the locus of unpredictability yielded diverging predictions for the Predictability Hypothesis for the two languages.
We predict that the phonological choice of increasing the proportion of IP-final sites in IDS—found across Japanese, Bengali, and English—is a very general strategy for intonational exaggeration across different languages. Showing that speakers increase IP-final sites to deploy intonational exaggeration (following the Phrase-finality Hypothesis) is also much more straightforward than demonstrating that speakers follow the predictions of the Pragmatic Restriction or Predictability Hypothesis. Not only are those other two hypotheses language-specific, but testing them also requires making assumptions about which parts of intonational melodies convey pragmatic intent and which parts are unpredictable. The large effect size we found for the main effect of IP-finality in this study (e.g., Figure 12) also suggests that this effect should be detectable in other smaller corpora like ours.
While intonational phonology is hardly a new tool for analysis, this study showed how standard information-theoretic methods can be fruitfully brought together in new ways with automata-theoretic representations of intonational grammars. It has long been claimed that tonal choices for Bengali AP melodies are largely fixed to “L* Ha”, leading to repetitive rising F0 contours. This is despite the many other attested AP melodies available according to the grammar (e.g., Figure 5b). By augmenting FSA representations of intonational grammars with probabilities estimated from our corpora, we were able to quantitatively show that, indeed, the most likely AP melody by far is L* Ha—based on our corpus. We were also able to compute the predictability at different choice points in the intonational melody, taking into account these probabilities. And we showed that this more nuanced notion of predictability that goes beyond counting up possible tonal choices avoids misleading conclusions about the grammar. The insight that differences in probabilities at choice points in the melody may characterize different speech styles within the same set of licit intonational melodies also extends beyond just IDS.
We were only able to compute entropy-theoretic predictability at choice points in intonational melodies because we had a corpus that we had intonationally transcribed. It is unrealistic to expect that there will be a flood of intonationally transcribed corpora of IDS in the near future, and it is important to acknowledge that intonational transcriptions themselves are not data, but are based on phonological analyses that are also subject to development. Where intonationally transcribed data are available, the same methods we used here to check transcriptions and parse them with automata can facilitate analysis. But work on the RIKEN corpus, as well as our study, suggests that we cannot afford to ignore intonational phonology in understanding IDS, whether in understanding patterns of timing and duration or F0 modifications. The same kinds of methods we have demonstrated with automata could also be applied to study prosodic acquisition, where intonationally transcribed data is also available, e.g., for children learning European Portuguese (Frota et al., 2016, 2024), or more limited phonological analyses, e.g., where only a limited subset of intonational events are transcribed. As we mentioned in Section 2.2, the key conclusions from our study relied mostly on transcriptions of how speakers chunked speech into intonational constituents. Our methods can also be applied to other kinds of phonological regularities, such as segmental phonotactics.
Insights from intonational phonology can also be brought to bear fruitfully on work in IDS in more limited ways. For example, the IDS literature typically discusses the prosodic marking of focus in English in terms of F0 peak/hill shapes, but low pitch accents appear on focused elements in yes/no questions. In another example, Ludusan et al. (2016) found that while pause and syllable nucleus duration were enhanced as cues to prosodic boundaries in IDS in the RIKEN corpus, f0 change was, in fact, diminished as a cue. But as they noted in Table S5 in their Supplementary Materials, this unexpected result for f0 change may have been due to aggregating f0 change over boundaries of two different kinds of prosodic constituents with different characteristic melodies—one rising and one falling.
For the analysis of the kind of large corpora of noisy, naturalistic speech that are becoming more and more popular in acquisition work, we have also demonstrated ways to analyze F0 that may be more robust than previous analyses. With the larger corpus sizes becoming increasingly available, we also see an opportunity for studies of individual variability of IDS. Even with our limited data here, we were able to detect different patterns of prosodic modification in IDS via exploratory visualizations by speaker and also by analysis of random effects in mixed effects regressions. Speaker f01 in Bengali was an outlier in how strong her intonational exaggeration in IDS was, both overall (Style effect) and, to a more limited extent, in within-category phonetic implementational changes. With more data, we may find that individuals even systematically differ in how they choose to employ differences in phonological choices vs. within-category changes in prosodic manipulations in IDS.
Finally, IDS is just one instance of a context where intonational exaggeration is commonly deployed. The concepts and methods introduced in this study for studying intonational grammars and stylistic variation in intonation are applicable beyond the study of IDS.

Supplementary Materials

Supplementary material can be found at the OSF repository: https://osf.io/7jhd3/, accessed on 12 March 2026.

Author Contributions

Conceptualization, K.M.Y.; methodology, S.D.K. and K.M.Y.; software, K.M.Y.; validation, S.D.K. and K.M.Y.; formal analysis, K.M.Y.; investigation, S.D.K. and K.M.Y.; resources, M.S.; data curation, S.D.K. and K.M.Y.; writing—original draft preparation, K.M.Y.; writing—review and editing, M.S., S.D.K. and K.M.Y.; visualization, K.M.Y.; project administration, M.S.; funding acquisition, M.S. All authors have read and agreed to the published version of the manuscript.

Funding

The data collection from the parents of English-learning infants was funded by National Science Foundation grant BCS-0951639 to Megha Sundara.

Institutional Review Board Statement

Ethical review and approval were waived for this study by the Office of the Human Research Protection Program at the University of California, Los Angeles, “upon the understanding that the intent of the research is not to collect or to analyze information about individuals; rather, the project involves analysis of words and sentences produced by native speakers”.

Informed Consent Statement

Informed consent was obtained from all subjects involved in the study.

Data Availability Statement

The original contributions presented in this study are included in the article/supplementary material. Further inquiries can be directed to the corresponding author(s).

Acknowledgments

Many thanks to our 20 study participants, and special thanks to J’aime Panna Roemer, Alejna Brugos, and Yeong Woo Kim for help in recording and annotating the sound files.

Conflicts of Interest

The authors declare no conflicts of interest.

Appendix A

Appendix A.1. Treatment of Tonal Transcription Labels

We collapsed certain transcription labels understood to refer to variants of the same tone. In the phonological analysis of the MAE-ToBI transcriptions used for estimating probabilities for the intonational grammar (Section 3), allophonic variations that arise from downstep were collapsed by removing the “!” diacritic marking downstep. H* and !H* labels were collapsed into a single “H*” category; L+H* and L+!H into a single “L+H*” category; L*+H and L*+!H into a single “L*+H” category; and H- and !H- into a single “H-“ category. H+!H* was left as is since it has no other tonal correspondent. Allophonic variants due to downstep were not collapsed for the analysis of F0 range (Section 6).
In the phonological analysis of transcriptions in B-ToBI, which allows for the use of numerous optional diacritics to mark phonetic variations, some conventions had to be developed for this collapsing. Undershot realizations of pitch accents and boundary tones (which are typical in fast and/or casual speech) are optionally transcribed with the “u” diacritic (e.g., “uHa” for an undershot high AP boundary tone), but they are understood to be phonetically reduced variants of the same phonological target. Similarly, the F0 minimum of low and rising pitch accents (e.g., L*, L*+H, and L+H*) is typically upstepped (produced at a slightly higher pitch) when occurring in a syllable with a voiceless or null onset (presumably related to the inherent connection between low pitch and voiced consonants; see Kingston (2011) and references therein); these are optionally transcribed with the “^” diacritic (e.g., “^L*” for an upstepped low pitch accent), but they are understood to be a variant of the non-upstepped counterpart whose distribution is largely predictable from the segmental context. Thus, Bengali tones were analyzed as though they had no diacritics, such as “u” (undershot realization), “^” (upstepped due to onset type), “e” (early realization), “?” (uncertainty marker), etc., and focusing on only the phonologically relevant diacritics “*” (pitch accent), “a” (AP boundary tone), “-” (ip boundary tone), “%” (IP boundary tone), and “f” (f-marked tone).
In cases where prominence was heard but a tonal target was not discernable or readily identifiable, a toneless “*” was entered in MAE_ToBI and B-ToBI transcriptions; this is not a very common occurrence overall, but it is occasionally seen in post-focal words where some phonetic prominence can be heard (through, e.g., duration and intensity), while the tone of that prominent syllable has been removed (cf. post-focal tone compression/deletion, conventionally called “deaccenting” in various languages).
In both Bengali and English, some labels were used to indicate uncertainty. In some cases in Bengali, the tone target (i.e., L or H) was clear, but its phrasal association (i.e., AP tone or ip tone) was ambiguous. For example, in 21 cases (six in non-IDS; 15 in IDS), tones were transcribed with the -% diacritic, representing ambiguity between the ip and IP levels. Similarly, 68 tones (41 in non-IDS; 27 in IDS) were transcribed as Ha- or La- because it was unclear whether they were AP or ip tones. For the purposes of our analyses, we treated this small number of ambiguous labels as if they were for the larger of the prosodic constituents, e.g., Ha- as H-. Uncertainty in whether or not any pitch accent or phrase accent at all was present in English ToBI labels was indicated with the labels “*?” and “-?”. The English transcriber also included an alternatives tier (Brugos et al., 2008), which indicated second choice alternative transcription labels for tonal events that the transcriber could imagine another labeler choosing: 4% (131/3389) of cases for pitch accents, 24% of ip tones (175/739), and 10% of IP tones (93/955). Labels for tones where alternatives were given were labeled with a “?” suffix in the tone tier following the first-choice tone transcription, e.g., “L+H*?”. Our analysis is based on the transcriber’s first choice for labels. We also abstracted away from uncertainty in English transcriptions and excluded “*?” or “-?” due to their infrequency.

Appendix A.2. Additional Validation of Finite State Automata

As a measure of the fit of the estimated probabilistic automata to the corpus data, we also computed the error for each accepted melody (sequence of tonal events in the IP), s, in the data, D (e.g., the corpus of IDS melodies in Bengali), for the automaton, A, given in Equation (A1), where fD(s) is the relative frequency of s in the data, and pA(s) is the probability of s computed by the automaton A. The error for s was normalized by the length of s since error accumulates over longer and longer melodic sequences, so it is the error per tonal event in the melody. The log2 transform allowed us to interpret the error in bits. We computed the average fit over all sequences in D for an automaton A by taking the mean of error(sD,A):
e r r o r ( s D , A ) =   | log 2 f D ( s )     log 2 p A ( s ) |   l e n g t h ( s ) .
For comparison, we also computed the error for the probabilistic automata estimated from one speech style with respect to data from the other speech style, e.g., the automaton for Bengali IDS and the data from Bengali non-IDS.
The mean errors per tonal event for the fit of the probabilistic automata to relative frequencies of melodies in the corpora are given in Table A1. The “Data” column indicates which speech style the relative frequencies of melodies came from, and the “FSA” column indicates which probabilistic automaton was used to estimate the probability of those melodies. The italicized lines where the data and FSA mismatch give an indication of how much worse the fit was to the data from one style if probabilities were estimated from the other style.
First, error per tonal event was on the order of 1 bit. For scale, 1 bit corresponds to a choice between two tonal events, but the mean number of choices (±1SD) for tonal events is on the order of 10 bits in the automata. In particular, the mean number of choices per state in the Bengali automata was 14 ± 3 choices in the Global automaton and 10 ± 6 for the Final AP/ip automaton. For English, there was a mean number of choices per state of 7 ± 1, 9 ± 5, and 9 ± 4 for the Global, Final PA, and Final ip automata, respectively. In all cases, the mean error for the mismatched baselines was bigger than the error when the data/FSA were for the same style, by around 0.1–0.3 bits. This is a good sanity check, indicating that our method for estimating probabilities for the automata did indeed reflect the input data from the corpus for the estimation. Moreover, the greater error from the mismatched baselines suggests that the probability distributions over melodies are distinct between non-IDS and IDS in both languages. If there were no difference in the probability distribution at all, then we would expect no difference in error between the mismatched baseline and the matched data/FSA. The error for (matched) IDS was consistently smaller than the error for (matched) non-IDS, which could be, in part, due to the greater amount of data available in IDS vs. non-IDS since there were more IPs in IDS than non-IDS in the corpus.
Table A1. Mean error (bits) per tonal event in fit of probabilistic automata to melody frequencies in the corpus.
Bengali FSAEnglish FSA
DataFSAGlobalFinal AP/ipGlobalFinal PAFinal ip
Non-IDSNon-IDS1.361.351.691.561.60
Non-IDSIDS1.611.581.821.681.77
IDSIDS1.001.011.241.201.21
IDSNon-IDS1.091.101.311.311.29

Appendix B. Phrasing Study (Section 4)

Mixed Effects Poisson Regression Models for the Number of APs, ips, IPs, and Utterances in IDS vs. Non-IDS (Table 4 and Table 5)

Figure A1. Interaction plots for the effect of Style (non-IDS vs. IDS) and IP-finality (final vs. non-final) on: (a) the number of APs uttered in a story repetition in Bengali; (b) the number of ips uttered in a story repetition in English. See Table 4 and Table 5.
Languages 11 00068 g0a1

Appendix C. Analyses for Lengthening Study (Section 5)

Appendix C.1. Distribution of Number of Syllables in Words

Figure A2. Histograms of number of syllables in a word in North Wind and the Sun story for Bengali: (a) all tokens, including repeated instances of words; (b) distinct words.
Languages 11 00068 g0a2
Figure A3. Histograms of number of syllables in a word in North Wind and the Sun story for English: (a) all tokens, including repeated instances of words; (b) distinct words.
Languages 11 00068 g0a3

Appendix C.2. Regression Models for Word-Level Mean Syllable Duration, Without Prosodic Structure

Final regression model outputs for duration analyses without any conditioning on prosodic structure are given in Table A2 and Table A3. Guidance on interpreting the columns in these tables is the same as for Table 9 and Table 10 at the beginning of Section 5.2.
Log-transformed word-level mean syllable duration was significantly longer in IDS in both Bengali and English and increased from non-IDS to IDS by 1.11 times (β = 0.11, p = 0.02) for Bengali and 1.17 times (β = 0.16, p < 0.001) for English. At the mean syllable duration when the predictors are at their average values (189 ms for Bengali and 212 ms for English), these increases from non-IDS to IDS correspond to an increase of 21 ms for Bengali and 36 ms for English. Excluding influential Speaker f01 in Bengali attenuated the effect of Style (β = 0.074, p = 0.008) to a factor of 1.08.
For Bengali, adding Word Length (syll) significantly improved a base model with only Style, Gender and Repetition according to an LRT (χ2(1) = 15.4, p < 0.001), and then word length (phones) as well (χ2(1) = 30.2, p < 0.001). Collinearity between these two covariates in the final model was not a concern: VIF scores for both were 2.86. For English, neither adding word length in terms of syllables nor phones significantly improved the base model in an LRT (syll: χ2(1) = 0.55, p = 0.46; phones: χ2(1) = 3.06, p = 0.080).
Table A2. Bengali: Fixed effects and model fit for word-level log-transformed mean syllable duration, without conditioning on prosodic position.
CoefficientβSE(β)tdfpeβChange (ms)
Intercept5.240.03160.0419.74<0.001188.9 msN/A
Style0.110.042.7310.490.0211.1121.3
Word length (syll)−0.460.06−8.127.37<0.0010.63−69.2
Word length (phones)0.350.066.147.31<0.0011.4279.0
Gender0.020.050.428.010.681.023.8
Repetition (lin)−0.020.004−4.046134.00<0.0010.98−2.9
Repetition (quad.)−0.010.004−2.006134.000.0460.99−1.5
N: 6305; groups: word, 77; speaker, 10. Marginal R2 = 0.21, cond. = 0.66. Formula: log.mean.syll.dur ~ style + n.syll + n.phones + gender + rep.order + (1 + style | speaker) + (1 + style | word).
Table A3. English: Fixed effects and model fit for word-level log-transformed mean syllable duration, without conditioning on prosodic position.
CoefficientβSE(β)tdfpeβChange (ms)
Intercept5.350.0688.7970.76<0.001212.4 msN/A
Style0.160.027.7112.04<0.0011.1735.9
Gender0.060.041.428.000.181.0714.0
Repetition (lin)−0.010.005−2.2366130.010.99−2.47
Repetition (quad.)0.0010.0050.21660130.861.000.19
N: 6770; groups: word, 64; speaker, 10. Marginal R2 = 0.02, cond. = 0.82. Formula: log.mean.syll.dur ~ style + gender + rep.order + (1 + style | speaker) + (1 + style | word).

Appendix C.3. Model Comparisons/Regressions for Word-Level Mean Syll. Duration, with Prosodic Structure

Table A4 summarizes model comparison results from LRTs for building up the final model for Bengali in Table 9. The base model in the first row of the table corresponds to the following regression formula: log.mean.syll.dur ~ style + gender + rep.order + (1 + style | speaker) + (1 + style | word). Each additional row presents results upon adding an additional predictor. Adding a predictor to a previous model is indicated with an increased level of indenting and a dividing line in the table. The final model has the formula log.mean.syll.dur ~ style * position + accent + style:accent + position:accent + n.syll + n.phones + gender + rep.order + (1 + style | speaker) + (1 + style + position | word).
Table A4. Bengali: Model comparisons for word-level mean syllable duration (Table A6).
Predictorsχ2dfp
Base model
+ Position + (Position | Word)2076.815<0.001
   + Accent217.821<0.001
      + Style:Position12.1730.007
         + Style:Accent4.7710.029
            + Position:Accent25.543<0.001
               + Word Length (syll)21.011<0.001
                  + Word Length (phones)43.691<0.001
Table A5 summarizes model comparison results from LRTs for building up the final model for English in Table A8. The base model in the first row of the table is the same model formula as for Table A4. The rows in gray indicate cases where adding a predictor did not improve the model. The final model is log.mean.syll.dur ~ style + position + accent + n.syll + n.phones + gender + rep.order + (1 + style | speaker) + (1 + style | word).
Table A5. English: Model comparisons for word-level mean syll. duration regressions (Table A8).
Predictorsχ2dfp
Base model
+ Position 934.552<0.001
   + Accent205.341<0.001
      + Style:Position1.2220.54
      + Style:Accent4.2330.24
         + Word Length (syll)4.0310.045
            + Word Length (phones)27.31<0.001
Table A6 and Table A7 summarize results for the regression model for log-transformed word-level mean syllable duration that includes prosodic structure. Table A7 excludes Speaker f01, as well as the random slope for position, which resulted in a singular model.
Table A6. Bengali: Fixed effects and model fit for log-transformed word-level mean syllable duration, conditioning on prosodic structure, all speakers.
CoefficientβSE(β)tdfpeβChange (ms)
Intercept5.290.03188.0719.84<0.001198.1 msN/A
Style0.0970.042.6910.100.0231.1020.2
Position (AP.final)0.0270.012.1669.650.0351.035.4
Position (ip.final)0.170.028.5459.45<0.0011.1937.4
Position (IP.final)0.330.0217.1058.51<0.0011.3978.0
Accent0.0870.00713.062523.00<0.0011.0918.1
Word Length (syll)−0.500.04−11.1668.07<0.0010.61−78.0
Word Length (phones)0.360.058.0268.06<0.0011.4487.2
Gender0.0310.040.808.000.451.036.2
Rep. (lin)−0.0180.003−5.786049.00<0.0010.98−3.6
Rep. (quad)−0.0040.003−1.216045.000.231.00−0.78
Style: Position (AP.fin)0.0120.011.182200.000.241.012.4
Style: Position (ip.final)0.0400.022.073157.000.0391.048.0
Style: Position (IP.final)0.0400.012.8636.670.0041.048.0
Style:Accent0.0270.012.681211.000.0071.035.3
Pos. (AP.final):Accent0.0440.013.241930.000.0011.058.9
Pos. (ip.final):Accent−0.0040.02−0.18849.500.861.00−0.7
Pos. (IP.final):Accent−0.0300.01−2.214778.000.0270.97−5.9
N: 6305; groups: word, 77; speaker, 10. Marginal R2 = 0.39, conditional = 0.76. VIFs for length: 2.9. Formula: log.mean.syll.dur ~ style * position + accent + style:accent + position:accent + gender + rep.order + n.syll + n.phones + (1+style | speaker) + (1 + style + position | word).
Table A7. Bengali: Fixed effects/model fit for log-transformed word-level mean syllable duration, conditioning on prosodic structure, refit without Speaker f01 (cf. Table A6), no Pos. random slope.
CoefficientβSE(β)tdfpeβChange (ms)
Intercept5.280.03187.317.48<0.001195.39 msN/A
Style0.070.023.3312.440.0061.0713.4
Position (AP.final)0.040.0067.065604.00<0.0011.048.4
Position (ip.final)0.210.0118.965588.00<0.0011.2345.4
Position (IP.final)0.340.00937.054933.00<0.0011.4078.8
Accent0.0940.00713.375591.00<0.0011.1019.3
Word Length (syll)−0.500.05−10.8476.85<0.0010.61−76.7
Word Length (phones)0.360.057.7876.95<0.0011.4485.5
Gender0.0220.040.507.000.501.4.4
Rep. (lin)−0.0210.003−6.035486.00<0.0010.98−4.1
Rep. (quad)−0.0020.003−0.585487.000.571.00−0.39
Style: Position (AP.fin)0.0030.010.262359.000.791.000.56
Style: Position (ip.final)0.0180.020.863655.000.391.023.5
Style: Position (IP.final)0.0240.011.6741.600.0951.024.8
Style:Accent0.0190.011.801125.000.0721.023.8
Pos. (AP.final):Accent0.0530.014.355584.00<0.0011.0510.6
Pos. (ip.final):Accent−0.0070.02−0.345566.500.730.99−1.4
Pos. (IP.final):Accent−0.0450.01−3.365620.00<0.0010.96−8.6
N: 5670 groups: word, 77; speaker, 9. Marginal R2 = 0.40, conditional = 0.73. VIFs for length: 2.9. Formula: log.mean.syll.dur ~ style * position + accent + style:accent + position:accent + gender + rep.order + n.syll + n.phones + (1 + style | speaker) + (1 + style | word).
Table A8 summarizes the regression model, including prosodic structure for English word-level mean syllable duration.
Table A8. English: Fixed effects and model fit for log-transformed word-level mean syllable duration, with conditioning on prosodic structure.
CoefficientβSE(β)tdfpeβChange (ms)
Intercept5.440.043122.6664.37<0.001230.02 msN/A
Style0.140.0178.1013.10<0.0011.1534.6
Position (ip)0.190.01516.446716.00<0.0011.2147.7
Position (IP)0.390.01331.296745.00<0.0011.48110.3
Accent0.170.01814.606678.00<0.0011.1943.1
Word Length (syll)−0.700.11−6.506265.00<0.0010.50−115.7
Word Length (phones)0.700.125.836160.00<0.0012.02234.4
Gender0.0490.0371.318.000.231.0511.5
Rep. (lin)−0.0100.004−2.276608.000.0230.99−2.3
Rep. (quad)-<0.0010.0040.056608.000.961.000.05
N: 6770; groups: word, 64; speaker, 10. Marginal R2 = 0.44, cond. = 0.82. VIFs for length: 3.5. Formula: log.mean.syll.dur ~ style + position + accent + n.syll + gender + rep.order + (1 + style | speaker) + (1 + style | word).

Appendix C.4. Model Comparisons and Results for Regressions for Word-Final Syllable Duration, with Prosodic Structure

This section contains results for word-final syllable durations. Table A11 and Table A12 show results from model comparisons. The base model in the first row of the tables in Table A9 and Table A10 is again the same model formula as for Table A4. The rows in gray indicate cases where adding a predictor did not improve the model.
Table A9. Bengali: Model comparisons for word-final syllable duration in Section 5.2 (Table 9).
Predictorsχ2dfp
Base model
+ Position + (Position | word)2107.815<0.001
   + Accent59.841<0.001
      + Style:Position11.9230.008
         + Style:Accent6.4310.011
            + Word Length (syll)21.871<0.001
               + Word Length (phones)42.491<0.001
Table A10. English: Model comparisons for word-final syllable duration in Section 5.2 (Table 10).
Predictorsχ2dfp
Base model
+ Position 934.932<0.001
   + Style: Position1.3520.51
   + Accent230.951<0.001
      + Style:Accent1.5010.22
      + Word Length (syll)4.0510.044
            + Word Length (phones)26.321<0.001
Table A11 shows results from the Bengali regression for word-final syllable durations that includes all speakers (cf. Table 9, which has been refit without influential Speaker f01).
Table A11. Bengali: Fixed effects and model fit for log-transformed word-final syllable duration conditioned on prosodic structure (all speakers); cf. Table 9, which is refit without Speaker f01.
CoefficientβSE(β)tdfpeβChange (ms)
Intercept5.300.03179.6920.50<0.001200.2 msN/A
Style0.0980.042.7110.190.0211.1020.6
Position (AP.final)0.0850.025.5384.15<0.0011.0917.7
Position (ip.final)0.240.0210.4666.54<0.0011.2753.2
Position (IP.final)0.390.0218.8765.79<0.0011.4895.8
Accent0.0730.0097.803040.00<0.0011.0815.1
Word Length (syll)−0.500.05−11.0469.17<0.0010.61−79.1
Word Length (phones)0.370.057.9468.66<0.0011.4488.4
Gender0.0290.040.718.000.501.036.0
Rep. (lin)−0.0180.003−5.695986.00<0.0010.98−3.6
Rep. (quad)−0.0040.003−1.405985.000.161.00−0.9
Style: Position (AP.fin)0.0340.012.482290.000.0131.036.9
Style: Position (ip.final)0.0720.023.433605.00<0.0011.0714.9
Style: Position (IP.final)0.0600.023.65558.10<0.0011.0612.3
Style:Accent0.0340.012.271361.000.0231.036.9
N: 6244; groups: word, 77; speaker, 10. Marginal R2 = 0.38, conditional = 0.77. VIFs for length: 2.9. Formula: log.fin.syll.dur ~ style * position + accent + style:accent + gender + rep.order + n.syll + n.phones + (1 + style |speaker) + (1 + style + position | word).

Appendix D. Analyses for F0 Range Expansion Study (Section 6)

Appendix D.1. Distribution of Raw F0 Values and Quantile–Quantile Plots

The smoothed density plots—Figure A4 (Bengali) and Figure A5 (English)—show the distribution of all measured F0 values (R100) for each speaker in Hz plotted on a logarithmically spaced scale. Separate distributions are plotted for each style, with non-IDS to the left (mirrored across the y-axis) and IDS to the right of the y-axis. Both Bengali and English speakers show long tails at low F0 values (towards the bottom of the plot), with fatter tails in some speakers, such as Bengali m01 and English f03 and m01. These are outlying low-percentile F0 values that could include F0 values measured in non-modal phonation, such as creak. Individual variability can also be seen in how much the F0 distributions for the two different speech styles overlap. For instance, Bengali f01 and m02 and English m05 are among the speakers that have the least overlap in F0 values between speech styles, with IDS F0 values shifted higher than non-IDS ones. But there are also speakers like Bengali m03 and English m02, where the distributions for IDS and non-IDS are almost perfect mirrors.
Figure A4. Bengali: Smoothed density plots of the distribution of all F0 values measured for each speaker in IDS (light blue, right of y-axis) vs. non-IDS (light red, mirrored across y-axis to left).
Languages 11 00068 g0a4
Figure A5. English: Smoothed density plots of the distribution of all F0 values measured for each speaker in IDS (light blue, right of y-axis) vs. non-IDS (light red, mirrored across y-axis to left).
Languages 11 00068 g0a5
The quantile–quantile (q-q) plots in Figure A6 and Figure A7 plot the quantiles of all F0 values (R100) in Hz from IDS (y-axis) against those from non-IDS (x-axis) on logarithmically spaced scales, in 2% increments. q-q plots may be most familiar from regression diagnostics, plotting an empirical distribution against a theoretical normal distribution to test for normality. Here, as in plots for normality, the points should fall on a straight line if the IDS distribution comes from the same distribution as the non-IDS distribution.
There are two main patterns in the q-q plots. First, despite some interspeaker variability, the IDS distributions clearly differ from the non-IDS distributions: the points generally fall above the straight line, especially at higher percentiles. That is, higher F0 values in IDS for a speaker are much higher than higher values in non-IDS for that same speaker. But lower F0 values in both styles are comparable; i.e., lower F0 values in IDS are not generally lower than lower values in non-IDS.
Second, at the bottom left and top right corners of the plots, we see points that are quite distant from the rest of the points. That means that the lowest and highest percentiles in both non-IDS and IDS do appear to correspond to outlying F0 values, which we trim away when we take range cutoffs to filter F0 values before computing various F0 statistics. Since the first and last points (0th percentile and 100th percentile) were particularly distant from the others, while the peninitial and penultimate (2nd and 98th percentiles) were generally much closer to the others, we also added a R96 96% range with cutoffs of 2% at the top and bottom and used this range for plots in Section 6.
Figure A6. Bengali: Quantile–quantile plots of all F0 values (Hz) measured for a speaker in IDS vs. all F0 values (Hz) measured for that speaker in non-IDS, quantiles plotted in 2% increments.
Languages 11 00068 g0a6
Figure A7. English: Quantile–quantile plots of all F0 values (Hz) measured for a speaker in IDS vs. all F0 values (Hz) measured for that speaker in non-IDS, quantiles plotted in 2% increments.
Languages 11 00068 g0a7
Figure A8 shows R96 smoothed density plots for the distribution of F0 range over Utt-200s for each speaker in Bengali (Figure A8a) and English (Figure A8b). The distribution of F0 range for IDS is in light blue, to the right of the y-axis. The distribution for non-IDS is light red, mirrored to the left over the y-axis.
Figure A8. Distribution of F0 range (in semitones) in utterances determined by 200 ms silence threshold criterion (Utt-200s) for each speaker in IDS (light blue) vs. non-IDS (light red). Displayed with smoothed density plots, with F0 values trimmed to R96 (2–98%): (a) Bengali, (b) English.
Languages 11 00068 g0a8

Appendix D.2. Distribution of F0 Range in IP-/ip-/Non-Final APs in Bengali and English

While there was a significantly greater degree of F0 range expansion in IDS in IP-final APs relative to non-final APs (Style:IP-finality: β = 1.07, p = 0.003), the Style:IP-finality interaction was not robust to excluding influential final tone types Ha and L% (Style:IP-finality (no Ha, L%): β = 0.78, p = 0.16); see Table A12. Thus, we cannot conclude that the increase in F0 range expansion in IDS in IP-final APs generalized across all melodies. However, melodies ending in Ha and L% accounted for the majority of melodies in both speech styles (65% in non-IDS, 52% in IDS). The failure of generalization could be due to the lack of statistical power from the much smaller sample size of other melody types.
Repeating the regression (without the random intercept for final tone) for only the subset of melodies ending in Ha and L%, the Style:IP-finality interaction remains significant, as do the effects of Style (β = 2.34, p = 0.009) and IP-finality (Table A13). As shown in the interaction plot in Figure A9a, the model prediction is that in non-IDS, F0 range in APs ending in L% is 6.50 st higher than F0 range in APs ending in Ha (IP-finality: β = 6.50, p < 0.001). This increase in F0 range from Ha-ending to L%-ending APs is larger in IDS by 1.45 st (Style:IP-finality: β = 1.45, p = 0.004).
Table A12. Bengali: Fixed effects and model fit for range in semitones over APs (R96) excluding APs ending in L% or Ha (cf. Table 11).
CoefficientβSE(β)tdfp
Intercept11.510.9611.9610.41<0.001
Style2.350.643.699.900.004
IP-finality2.490.683.676.520.009
Gender2.321.321.767.460.12
Repetition (lin)0.520.222.361506.100.018
Repetition (quad.)−0.250.22−1.101505.490.27
Style:IP-finality0.780.561.411449.670.16
N: 1533; groups: speaker, 10; final.tone, 9. Marginal R2 = 0.11, conditional = 0.37. Formula: range.st ~ style * bigip.fin + gender + rep.order + (1 + style | speaker) + (1 | final.tone).
Table A13. Bengali: Fixed effects and model fit for range in semitones over APs (R96) for only APs ending in L% or Ha (cf. Table 11).
CoefficientβSE(β)tdfp
Intercept10.300.8312.347.27<0.001
Style2.340.703.329.090.009
IP-finality6.500.2625.232244.84<0.001
Gender2.001.291.568.020.16
Repetition (lin)0.260.191.412241.650.16
Repetition (quad.)−0.160.18−0.892243.110.38
Style:IP-finality1.450.512.862247.470.004
N: 2264; groups: speaker, 10. Marginal R2 = 0.26, conditional = 0.43. Formula: range.st ~ style * bigip.fin + gender + rep.order + (1 + style | speaker).
When the model in Table A13 is refit without influential Speaker f01, estimates for Style (β = 1.81, p < 0.001) and IP-finality (β = 6.06, p < 0.001) drop by about half a semitone. The estimate for Style:IP-finality (β = 1.20, p = 0.019) drops by about a quarter-semitone.
For English (Table 12), the statistical pattern of results for Style and IP-finality was robust to the exclusions of influential Speaker m05 or influential tune L-L%. Excluding influential Speaker m05 dropped the model prediction for Style by 0.45 st (β = 1.25, p = 0.004) and increased the model prediction for IP-finality by 0.3 st (β = 3.44, p = 0.003), but it had a negligible effect on the Style:IP-finality interaction (β = 0.33, p = 0.56). Excluding the influential L-L% melody type had a negligible effect on Style (β = 1.72, p = 0.002), but it increased the model prediction for IP-finality by 0.4 st (β = 2.75, p = 0.006) and the Style:IP-finality interaction by 0.17 st (β = 0.54, p = 0.44).
The interaction plot in Figure A9b visualizes the pattern of the results. The model for English with melody type classified by nuclear pitch accent yielded the same pattern of results (Table A14), with significant effects of Style (β = 1.54, p = 0.005) and IP-finality (β = 3.87, p < 0.001), but not Style:IP-finality (β = 0.23, p = 0.68).
Figure A9. Interaction plots for the effect of Style (non-IDS vs. IDS) and IP-finality (final vs. non-final) on F0 range for: (a) APs in Bengali for melodies ending in Ha or L% (Table A13); (b) ips in English (Table 12).
Languages 11 00068 g0a9
Table A14 shows results for the regression for English when nuclear pitch accent type rather than IP boundary type is used to classify melody types (Table 12).
Table A14. English: Fixed effects and model fit for range in semitones over ips (R96), with nuclear pitch accent used for classifying melody type.
CoefficientβSE(β)tdfp
Intercept14.420.5725.407.52<0.001
Style1.540.423.659.740.005
IP-finality3.870.2813.871608.49<0.001
Gender2.190.663.338.230.010
Repetition (lin)−0.170.23−0.751604.620.45
Repetition (quad.)0.0040.230.021605.570.99
Style:IP-finality0.230.540.421606.590.68
N: 1530; groups: speaker, 10. Marginal R2 = 0.16, conditional = 0.23. Formula: range.st ~ style * bigip.fin + gender + rep.order + (1 + style | speaker) + (1|npa).

Appendix D.3. Fernald et al. (1989)/Igarashi et al. (2013)-Style Regression Analysis Summary

F0 mean, minimum, maximum, standard deviation (in addition to range), all in Hz, were computed within different units of analysis: within each utterance (for both Utt-200s and Utt-300s), following Fernald et al. (1989, pp. 486–487); each IP, as in Igarashi et al. (2013), as well as each ip; and also each AP in Bengali. These unit-level quantities were then log-transformed. We followed Fernald et al. (1989, pp. 486–487) in defining F0 variability (st) as 12 log2 (1 + F0sd/F0mean), where F0sd is the standard deviation of F0 values in Hz over the unit of analysis, and F0mean is the mean of those values. Mixed effects linear regressions with these F0 quantities as dependent variables examined the robustness of the effect of Style across units of analysis and percentile cutoffs. Regressions included by-speaker random intercepts and slopes for Style.18
Table A15 (Bengali) and Table A16 (English) provide t-values and significance levels for the mixed effects linear regressions for log-transformed mean, minimum, maximum, and standard deviation of F0, as well as range and variability in st within different units of analysis. (Full results are in the analyze_f0_stats.Rmd file.) For instance, the cell for range (st) under R100 shows that the t-values for the effect of Style in regressions for Utt-200s, IPs, ips, and APs were 2.6, 3.1, 4.0, and 5.9, respectively, and all effects were significant.19
Table A15. Bengali: Summary of regression results for log-transformed F0 measures, showing t-value and significance for Style in Utt-200s/IPs/ips/APs.
F0 StatisticR100(0–100%)R96(2–96%)R90(5–95%)R80(10–90%)
Mean (log/Hz)3.6**/3.4**/3.4**/4.0**3.0*/2.8*/2.8*/3.4**2.7*/2.5*/2.5*/3.1*2.3*/2.2/2.1/2.7*
Minimum (log/Hz)1.3/1.1/−0.5/−2.01.1/1.3/−0.5/−1.41.8/2.1/0.4/0.23.9*/3.2*/2.3*/1.8
Maximum (log/Hz)6.3/6.9/6.7/6.8(***)5.1/5.1/5.2/5.8(***)3.3**/3.1*/3.5**/4.5**2.7*/2.3/2.6*/3.5**
Std. dev (log/Hz)4.4**/5.0***/4.8***/5.9***4.6**/4.8**/4.6**/5.3***3.8**/3.5**/3.7**/4.4**3.3**/2.8*/3.2**/3.7**
Range (st)2.6*/3.1*/4.0**/5.9***2.3/2.4*/3.4**/5.0***1.7/1.0/2.3*/3.5**1.1/0.5/2.1/3.0*
Variability (st)6.7/7.7/7.0/8.0(***)6.1/6.7/6.4/7.1(***)4.8/4.7/4.9/5.7(***)4.0**/3.4**/4.0**/4.7**
* p < 0.05, ** p < 0.01, *** p < 0.001, n.s bolded. (***) used as abbreviation: *** for all values in cell. Utt-300s patterned like Utt-200s except R100; range: t = 2.0 (n.s.).
Table A16. English: Summary of regression results for log-transformed F0 measures, showing t-value and significance for Style in Utt-200s/IPs/ips/APs.
F0 StatisticR100(0–100%)R96(2–96%)R90(5–95%)R80(10–90%)
Mean (log/Hz)2.5*/2.6*/2.4*2.1/2.2/2.11.7/1.8/1.81.5/1.5/1.5
Minimum (log/Hz)3.2*/2.6*/0.93.5***/2.4*/0.93.0*/2.0/0.71.4/1.4/0.8
Maximum (log/Hz)4.2**/4.2**/4.0**3.0*/3.2*/3.3**2.3*/2.5*/2.7*1.7/1.9/2.2
Std. dev (log/Hz)2.6*/2.9*/4.6**2.6*/3.1*/4.0**2.7*/3.2*/4.0**2.7*/3.1*/4.3**
Range (st)2.7*/2.2/4.7***2.0/1.8/4.4**1.6/2.0/4.4**1.6/1.6/3.8**
Variability (st)4.3**/4.5**/5.8***3.6**/4.2**/4.9***3.1*/3.6**/4.5**2.9*/3.3**/4.7**
* p < 0.05, ** p < 0.01, *** p < 0.001, n.s bolded. Utt-300s patterned like Utt-200s.
Maximum F0, standard deviation, and variability were significantly higher in IDS robustly across analysis choices down to the R90 cutoff in both languages, as was mean F0 for Bengali. However, R80 results patterned differently from other percentile cutoffs. In English, mean F0 was significantly higher in IDS only for R100 (for all units of analysis). Otherwise, it was not significantly different between styles for any unit of analysis. Excluding R80, minimum F0 was never significantly different between styles for any unit of analysis in Bengali, but it was significantly higher in IDS for English in utterances, as well as in IPs (only in R100, R96). Range over ips and APs in Bengali was significantly higher in IDS down to R90 and down to R96 for IPs. In English, across cutoffs, range was not significantly different between styles over IPs but was higher in IDS over ips.
Igarashi et al. (2013) also suggested that the Pragmatic Restriction Hypothesis would predict F0 range expansion in IDS to be detectable at the level of the utterance (aggregating across melody types). This is not what we found for either language, unless all F0 values were included in the analysis, retaining even certain outliers. For Bengali, though, F0 range was expanded in IDS over IPs, ips, and APs with the R96 cutoff. And for both languages, F0 range expansion in IDS occurred over the smallest intonational unit (English ip, Bengali AP) robustly across percentile cutoffs.
In general, range (as well as minimum F0) was the most sensitive F0 parameter to the choice of the unit of analysis and percentile cutoffs. So, it is not clear what to make of the failure to replicate the previous result of F0 range expansion in IDS over the utterance in English in Fernald et al. (1989)—we cannot say whether it is due to differences in F0 processing choices, the nature of the materials recorded, or something else. The pattern of results for long-term F0 statistics outside of range, i.e., measures perhaps less sensitive to treatment of extreme F0 values, largely replicated findings reported in previous studies of IDS in many languages: over utterances (or IPs), IDS had a higher level, as indexed by F0 mean, as well as greater variability. More generally, we found robustly across range cutoffs and utterances/IPs/ips/APs down to 90% range (R90) that F0 mean, maximum, and standard deviation were all significantly higher in IDS than in non-IDS.
Overall, our results for these F0 statistics replicate cross-linguistic patterns and thus support the validity of properties of the simulated IDS recorded here as reflecting properties of IDS in general. The robust results for F0 maximum across range cutoffs and units of analysis are noteworthy, in contrast to the sensitivity of F0 range and minimum to these choices, since F0 is also measured from extreme F0 values. The q-q plots in Appendix D.1. display the robustness of the effect of increased F0 in the higher part of a speaker’s F0 range, even starting as low as around the 50th percentile.
Minimum F0 was the other F0 statistic besides range, where our results differed from Fernald et al. (1989) and Igarashi et al. (2013). While that work found that minimum F0 in utterances was increased in IDS, and we did also find that for English, we did not find that in Bengali in utterances or any other prosodic constituent. Notably, we also did not find that minimum F0 was significantly different between styles for smaller prosodic units in English. Again, like range, minimum F0 is highly sensitive to F0 estimation choices and processing, so differences there may have contributed to our different pattern of results. But the general consensus in studies of pitch range scaling is that: (i) the bottom of a speaker’s F0 range is quite insensitive to within-speaker range changes, and (ii) range increases are the result of raising F0 maximum (Ladd, 2008, p. 197). Our finding of a lack of change in minimum F0 when increasing span is consistent with this general consensus.

Notes

1
As pointed out in Igarashi et al. (2013, p. 1285), BPMs might also occur at the ends of a smaller kind of phrase than the IP, especially in spontaneous speech. We abstract away from that detail here, as does Figure 5b in Igarashi et al. (2013), which represents the intonational grammar they assume for Japanese.
2
Complications with how to count the number of arcs, e.g., whether the two “L*” arcs out of State “0” count as one or two different choices, are resolved with our generalized definition of predictability, explicated in Section 3.
3
We say that the evidence is “consistent with” and not that it “shows that” because Igarashi et al. (2013) did not directly test for the effect of the BPM vs. the non-BPM region on F0 range to show that there is a main effect of region (BPM vs. non-BPM) on F0 range.
4
Child language acquisition research has been heavily skewed towards Indo-European languages, especially English (Kidd & Garcia, 2022), and Kempe et al. (2024)’s review of child-directed speech research found that of about 175 articles on prosody, approximately 40% studied only English (Kempe et al., 2024, Figure 9).
5
While the MAE_ToBI model also includes an optional %H IP-initial high boundary tone, we have excluded this here, as it never occurred in our corpus.
6
An alternative to drawing the two arcs with “T*” labels that is also used in the literature is instead drawing two arcs with empty transitions from States “ip” and “PA” back to State “0”.
7
This is taken to be the standard register produced by Bengali speakers from Bangladesh (as opposed to India), a phonetic description of which is provided in Khan (2010). Speakers of Bangladeshi Standard Bengali are typically also fluent in nonstandard regional varieties, which are not commonly heard in read speech.
8
The particular text was chosen for comparison with other work on speech rhythm using the same text (as part of a related study), as well as for its compatibility with both IDS (as it is a short passage with anthropomorphized characters) and non-IDS (as it has no “baby terms” or other IDS-specific characteristics).
9
There are, in fact, even more than the 19 possible sequences shown in Figure 5b since AP-initial bitonal pitch accents can also be followed by an additional pitch accent before the AP boundary tone (Section 1.2.2), but we omit those sequences in Figure 5 to keep the FSAs small enough to be readable for expository purposes.
10
Here, we are already starting to stretch the definition of “flexibility” from Igarashi et al. (2013) to span multiple states in the whole AP melody: not just the single “0” state, the choice point for the AP-initial pitch accent, but also the immediately following choice point for the AP boundary tone.
11
Setting the weights of arcs in the deterministic FST to the relative frequencies of their traversal in a corpus provides a maximum likelihood estimate because doing so maximizes the probability of the transducer generating the data in that corpus; see (e.g., Heinz et al., 2016, p. 75, Theorem 3.3). For non-deterministic finite state machines, approximation methods must be used to maximize likelihood (Vidal et al., 2005).
12
The stacked boundary tone fHaL% is documented in Khan (2008, 2014) as the output of an interaction between an f-marked AP boundary tone and an IP boundary tone, but due to its very limited occurrence and exceptional status (i.e., no other tones in Bengali can “stack” this way), we have chosen to leave it out of our FSA. Thus, its non-acceptance in the FSA was to be expected.
13
The bar graphs show only bars for cases where greater than 1% IPs in a language and style (e.g., Bengali non-IDS) contained some number of smaller units. For instance, we omit showing bars for four ips in an IP in Bengali (1% of IPs in non-IDS, approximately 0% of IPs in IDS).
14
While our hypotheses narrowly focus on IP-final position (IP-finality), lengthening in ip-final position relative to the non-final position would also be consistent with the vast literature on pre-boundary lengthening (see Section 1.1). For Bengali, Khan (2008, pp. 198–203) reports no pre-boundary lengthening in AP-final words compared to AP-medial words, but lengthening in ip- and IP-final words relative to AP-final words. Since lengthening in ip- and AP-final positions is not the focus of this paper, we do not discuss these results in detail. But our results do show that in non-IDS, final syllables in AP-final, ip-final, and IP-final words are significantly longer than final syllables in AP-medial words. (Our finding of AP-final lengthening is inconsistent with Khan (2008, pp. 198–203), who reported no AP pre-boundary lengthening in a much more controlled but small data set.)
15
For word-level mean syllable durations, the Bengali model included a Position:Accent interaction. The general finding is that a word being both accented and phrase-final does not have additive effects of lengthening (negative estimates for the interactions). While model comparison also justified a Position:Accent interaction for English, 95% of ip-final and 90% of IP-final words were accented. The small number of unaccented examples in ip/ip-final position came almost entirely from three words: him, off (IP-final) and wind (ip-final). Since we were unable to include random slopes for position in the English models, there was a danger of confounding effects if tokens for a combination of conditions were dominated by some particular word. Thus, we omitted the Position:Accent interaction in the models presented. Model comparison for Bengali mean syllable durations justified a three-way Style:Position:Accent interaction. However, effects were not robust upon exclusion of Speaker f01. Since our hypotheses do not make predictions for this interaction, we do not present the model with it in the paper. Analyses of mean syllable duration English models with a Position:Accent interaction and Bengali models with the three-way interaction are available in the analyze_durations.Rmd file in the OSF repository. Including a Position:Accent interaction in the Bengali model for word-final syllables resulted in a rank deficiency error.
16
Martin et al. (2016) also coded final position in a prosodic constituent as the final position in all smaller prosodic constituents; e.g., a mora in the IP-final position was also considered AP-final, following the Strict Layer Hypothesis (Nespor & Vogel, 1986; E. Selkirk, 1996; E. O. Selkirk, 1984).
17
Exceptionally for Speaker f04, bimodality is still present in the distribution of the F0 range over IP-final APs in Figure 14b. Inspection of recordings/transcriptions showed that smaller F0 ranges occurred in IP-final APs with undershot boundary tones (see Section 1.2.2) or that were followed by very small rhythmic junctures.
18
Note that including random effects for the unit of analysis did not make sense. Each story repetition involved different phrasing choices, so, for instance, utterance 1 from one repetition was not necessarily comparable to utterance 1 from another.
19
The untransformed, un-normalized utterance/IP-level F0 quantities, as well as range (in semitones) and variability (in semitones) of F0, were also averaged within a style within a speaker over the unit of analysis and submitted to paired t-tests by speaker, following Fernald et al. (1989) and Igarashi et al. (2013). For instance, the grand mean across IPs of mean F0 within an IP for non-IDS for a speaker was compared to the grand mean across IPs of mean F0 within an IP for IDS of that same speaker. The t-test results are reported in the document analyze_f0_stats.Rmd in the OSF repository and were consistent with results from regressions.

References

  1. Arbisi-Kelm, T. (2010). Intonation structure and disfluency detection in stuttering. In C. Fougeron, B. Kühnert, M. D’Imperio, & N. Vallée (Eds.), Laboratory phonology 10 (pp. 405–432). De Gruyter Mouton. [Google Scholar] [CrossRef]
  2. Bartels, C., & Kingston, J. (1994). Sailent pitch cues in the perception of contrastive focus. Journal of Acoustical Society of America, 95(5), 2973. [Google Scholar] [CrossRef]
  3. Bartoń, K. (2025). MuMIn: Multi-model inference (Version R package version 1.48.11) [Computer software]. Available online: https://cran.r-project.org/web/packages/MuMIn/index.html (accessed on 2 October 2025).
  4. Bates, D., Maechler, M., Bolker, B., & Walker, S. (2014). lme4: Linear mixed-effects models using Eigen and S4 [Manual]. Available online: http://CRAN.R-project.org/package=lme4 (accessed on 2 October 2025).
  5. Beckman, M., & Elam, G. A. (1997). Guidelines for ToBI labelling. Ohio State University. Available online: https://www.ling.ohio-state.edu/research/phonetics/E_ToBI/ (accessed on 3 September 2009).
  6. Beckman, M., & Pierrehumbert, J. (1986). Intonational structure in Japanese and English. Phonology Yearbook, 3, 255–309. [Google Scholar] [CrossRef]
  7. Beckman, M. E., Hirschberg, J., & Shattuck-Hufnagel, S. (2005). The original ToBI system and the evolution of the ToBI framework. In S.-A. Jun (Ed.), Prosodic typology: The phonology of intonation and phrasing. Oxford University Press. [Google Scholar]
  8. Berkovits, R. (1993a). Progressive utterance-final lengthening in syllables with final fricatives. Language and Speech, 36(1), 89–98. [Google Scholar] [CrossRef] [PubMed]
  9. Berkovits, R. (1993b). Utterance-final lengthening and the duration of final-stop closures. Journal of Phonetics, 21(4), 479–489. [Google Scholar] [CrossRef]
  10. Berkovits, R. (1994). Durational effects in final lengthening, gapping, and contrastive stress. Language and Speech, 37(3), 237–250. [Google Scholar] [CrossRef]
  11. Blandon, M. A. C., Cristia, A., & Rasanen, O. (2023). Analysing the impact of audio quality on the use of naturalistic long-form recordings for infant-directed speech research. In M. Goldwater, F. K. Anggoro, B. K. Hayes, & D. C. Ong (Eds.), Proceedings of the 45th annual conference of the cognitive science society. Cognitive Science Society, Inc. [Google Scholar]
  12. Boersma, P., & Weenink, D. (2024). Praat: Doing phonetics by computer (Version 6.4.04) [Computer software]. Available online: http://www.praat.org/ (accessed on 1 January 2024).
  13. Bolker, B. (2025). GLMM FAQ. Available online: https://bbolker.github.io/mixedmodels-misc/glmmFAQ.html (accessed on 2 October 2025).
  14. Bortfeld, H., & Morgan, J. L. (2010). Is early word-form processing stress-full? How natural variability supports recognition. Cognitive Psychology, 60(4), 241–266. [Google Scholar] [CrossRef]
  15. Broesch, T. L., & Bryant, G. A. (2015). Prosody in infant-directed speech is similar across western and traditional cultures. Journal of Cognition and Development, 16(1), 31–43. [Google Scholar] [CrossRef]
  16. Brugos, A., Langston, A., Shattuck-Hufnagel, S., & Veilleux, N. (2019, August 5–9). A cue-based approach to prosodic disfluency annotation. Proceedings of the 19th International Congress of Phonetic Sciences, Melbourne, Australia. [Google Scholar]
  17. Brugos, A., Veilleux, N., Breen, M., & Shattuck-Hufnagel, S. (2008, May 6–9). The alternatives (Alt) tier for ToBI: Advantages of capturing prosodic ambiguity. Proceedings of the Speech Prosody 2008 Conference, Campinas, Brazil. [Google Scholar]
  18. Byrd, D. (2000). Articulatory vowel lengthening and coordination at phrasal junctures. Phonetica, 57(1), 3–16. [Google Scholar] [CrossRef] [PubMed]
  19. Byrd, D., Krivokapić, J., & Lee, S. (2006). How far, how long: On the temporal scope of prosodic boundary effects. The Journal of the Acoustical Society of America, 120(3), 1589–1599. [Google Scholar] [CrossRef] [PubMed]
  20. Byrd, D., & Saltzman, E. (1998). Intragestural dynamics of multiple prosodic boundaries. Journal of Phonetics, 26(2), 173–199. [Google Scholar] [CrossRef]
  21. Cambier-Langeveld, G. M. (2000). Temporal marking of accents and boundaries. Holland Academic Graphics. Available online: https://dare.uva.nl/search?identifier=e26b40a8-a920-453b-9fc2-589d0656c350 (accessed on 3 September 2025).
  22. Cristia, A. (2013). Input to language: The phonetics and perception of infant-directed speech. Language and Linguistics Compass, 7(3), 157–170. [Google Scholar] [CrossRef]
  23. Dainora, A. (2001). An empirically based probabilistic model of intonation in American English. University of Chicago. [Google Scholar]
  24. Dainora, A. (2002, April 11–13). Does intonational meaning come from tones or tunes? Evidence against a compositional approach. Speech Prosody 2002 (pp. 235–238), Aix-en-Provence, France. Available online: https://www.isca-archive.org/speechprosody_2002/dainora02_speechprosody.pdf (accessed on 2 September 2008).
  25. Dainora, A. (2006). Modeling intonation in English: A probabilistic approach to phonological competence. In C. T. B. Louis Goldstein, & D. H. Whalen (Eds.), Laboratory phonology 8 (pp. 107–132). Mouton de Gruyter. Available online: http://books.google.com/books?id=e86YANpgyisC (accessed on 15 August 2008).
  26. de Leeuw, E. (2019). Native speech plasticity in the German-English late bilingual Stefanie Graf: A longitudinal study over four decades. Journal of Phonetics, 73, 24–39. [Google Scholar] [CrossRef]
  27. De Looze, C., & Rauzy, S. (2009, September 6–10). Automatic detection and prediction of topic changes through automatic detection of register variations and pause duration. Interspeech-2009 (pp. 2919–2922), Brighton, UK. [Google Scholar]
  28. Fernald, A. (1989). Intonation and communicative intent in mothers’ speech to infants: Is the melody the message? Child Development, 60(6), 1497–1510. [Google Scholar] [CrossRef] [PubMed]
  29. Fernald, A. (2000). Speech to infants as hyperspeech: Knowledge-driven processes in early word recognition. Phonetica, 57(2–4), 242–254. [Google Scholar] [CrossRef] [PubMed]
  30. Fernald, A., & Kuhl, P. (1987). Acoustic determinants of infant preference for motherese speech. Infant Behavior and Development, 10(3), 279–293. [Google Scholar] [CrossRef]
  31. Fernald, A., & Mazzie, C. (1991). Prosody and focus in speech to infants and adults. Developmental Psychology, 27(2), 209–221. [Google Scholar] [CrossRef]
  32. Fernald, A., & Simon, T. (1984). Expanded intonation contours in mothers’ speech to newborns. Developmental Psychology, 20(1), 104–113. [Google Scholar] [CrossRef]
  33. Fernald, A., Taeschner, T., Dunn, J., Papousek, M., de Boysson-Bardies, B., & Fukui, I. (1989). A cross-language study of prosodic modifications in mothers’ and fathers’ speech to preverbal infants. Journal of Child Language, 16, 477–501. [Google Scholar] [CrossRef]
  34. Féry, C. (2010). Indian languages as intonational ‘phrase languages’. In Problematizing language studies: Festschrift for Rama agnihotri (pp. 288–312). Aakar Books. [Google Scholar]
  35. Frota, S., Cruz, M., Matos, N., & Vigaário, M. (2016). Early prosodic development. In M. Armstrong, N. C. Henriksen, & M. del M. Vanrell (Eds.), Intonational grammar in Ibero-Romance: Approaches across linguistic subfields. John Benjamins Publishing Company. Available online: https://www.degruyter.com/document/doi/10.1075/ihll.6.14fro/html (accessed on 3 May 2024).
  36. Frota, S., D’Imperio, M., Elordieta, G., Prieto, P., & Vigaário, M. (2007). The phonetics and phonology of intonational phrasing in Romance. In P. Prieto, J. Mascaró, & M.-J. Solé (Eds.), Segmental and prosodic issues in Romance phonology (pp. 131–153). John Benjamins Publishing Company. [Google Scholar]
  37. Frota, S., & Prieto, P. (Eds.). (2015). Intonation in Romance. Oxford University Press. [Google Scholar]
  38. Frota, S., Severino, C., & Vigário, M. (2024). Unfolding prosody guides the development of word segmentation. Languages, 9(9), 305. [Google Scholar] [CrossRef]
  39. Gelman, A., Hill, J., & Vehtari, A. (2021). Regression and other stories. Cambridge University Press. [Google Scholar]
  40. Gorman, K. (2016). Pynini: A Python library for weighted finite-state grammar compilation. In B. Jurish, A. Maletti, K.-M. Würzner, & U. Springmann (Eds.), Proceedings of the SIGFSM workshop on statistical NLP and weighted automata (pp. 75–80). Association for Computational Linguistics. [Google Scholar] [CrossRef]
  41. Gussenhoven, C. (2002). Intonation and interpretation: Phonetics and phonology. In Proceedings of the speech prosody 2002 conference (pp. 47–57). Université de Provence Aix-en-Provence. [Google Scholar]
  42. Gussenhoven, C. (2004). The phonology of tone and intonation. Cambridge University Press. [Google Scholar]
  43. Gussenhoven, C. (2016). Analysis of intonation: The case of MAE_ToBI. Laboratory Phonology, 7(1), 10. [Google Scholar] [CrossRef]
  44. Gussenhoven, C., & Rietveld, A. C. M. (1988). Fundamental frequency declination in Dutch: Testing three hypotheses. Journal of Phonetics, 16(3), 355–369. [Google Scholar] [CrossRef]
  45. Gussenhoven, C., & Rietveld, A. C. M. (1992). Intonation contours, prosodic structure and preboundary lengthening. Journal of Phonetics, 20(3), 283–303. [Google Scholar] [CrossRef]
  46. Heinz, J., de la Higuera, C., & van Zaanen, M. (2016). Grammatical inference for computational linguistics. Morgan and Claypool Publishers. [Google Scholar]
  47. Igarashi, Y., Nishikawa, K., Tanaka, K., & Mazuka, R. (2013). Phonological theory informs the analysis of intonational exaggeration in Japanese infant-directed speech. Journal of the Acoustical Society of America, 134(2), 1283–1294. [Google Scholar] [CrossRef] [PubMed]
  48. Ito, K., Bibyk, S. A., Wagner, L., & Speer, S. R. (2014). Interpretation of contrastive pitch accent in six to eleven-year-old English-speaking children (and adults). Journal of Child Language, 41(1), 84–110. [Google Scholar] [CrossRef]
  49. Jassem, W. (1971). Pitch and compass of the speaking voice. Journal of the International Phonetic Association, 1(2), 59–68. [Google Scholar] [CrossRef]
  50. Jun, S.-A. (Ed.). (2005). Prosodic typology. Oxford University Press. [Google Scholar]
  51. Jun, S.-A. (2014). Prosodic typology II: The phonology and phonetics of intonation and phrasing. Oxford University Press. [Google Scholar]
  52. Jurafsky, D., & Martin, J. H. (2009). Speech and language processing (2nd ed.). Prentice Hall. [Google Scholar]
  53. Katz, G. S., Cohn, J. F., & Moore, C. A. (1996). A combination of vocal f0 dynamic and summary features discriminates between three pragmatic categories of infant-directed speech. Child Development, 67(1), 205–217. [Google Scholar] [CrossRef]
  54. Kempe, V., Ota, M., & Schaeffler, S. (2024). Does child-directed speech facilitate language development in all domains? A study space analysis of the existing evidence. Developmental Review, 72, 101121. [Google Scholar] [CrossRef]
  55. Khan, S. D. (2008). Intonational phonology and focus prosody of Bengali. University of California Los Angeles. [Google Scholar]
  56. Khan, S. D. (2010). Bengali (Bangladeshi Standard). Journal of the International Phonetic Association, 40(2), 221–225. [Google Scholar] [CrossRef]
  57. Khan, S. D. (2014). The intonational phonology of Bangladeshi Standard Bengali. In S.-A. Jun (Ed.), Prosodic typology II: The phonology and phonetics of intonation and phrasing (pp. 81–117). Oxford University Press. [Google Scholar]
  58. Khan, S. D. (2016). The intonation of South Asian languages: Towards a comparative analysis. Proceedings of Formal Approaches to South Asian Languages, 6, 23–36. [Google Scholar]
  59. Khan, S. D. (2018, June 19). Building a unified intonational model for South Asian languages: InTraSAL. South Asian Languages Analysis Roundtable (SALA-34), Konstanz Germany. [Google Scholar]
  60. Khan, S. D. (2019, August 4). InTraSAL: An intonational model for South Asian languages. Satellite Meeting on the Intonational Phonology of Typologically Rare or Understudied Languages, Melbourne, Australia. [Google Scholar]
  61. Khan, S. D. (2020). InTraSAL: An intonational model for South Asian languages. Indophon Talk Series. Available online: https://docs.google.com/presentation/d/10uwDvhGB3Cc9iuL0dFvTB4lBEzaIxSBLJkEfQTPaUug (accessed on 2 May 2024).
  62. Kidd, E., & Garcia, R. (2022). How diverse is child language acquisition research? First Language, 42(6), 703–735. [Google Scholar] [CrossRef]
  63. Kingston, J. (2011). Tonogenesis. In M. van Oostendorp, C. Ewen, & E. Hume (Eds.), The blackwell companion to phonology, volume 4 (pp. 2304–2333). Blackwell. [Google Scholar]
  64. Kitamura, C., Thanavishuth, C., Burnham, D., & Luksaneeyanawin, S. (2002). Universality and specificity in infant-directed speech: Pitch modifications as a function of infant age and sex in a tonal and non-tonal language. Infant Behavior and Development, 24(4), 372–392. [Google Scholar] [CrossRef]
  65. Klatt, D. H. (1975). Vowel lengthening is syntactically determined in a connected discourse. Journal of Phonetics, 3(3), 129–140. [Google Scholar] [CrossRef]
  66. Kozen, D. C. (1997). Automata and computability. Springer-Science+Business Media, LLC. [Google Scholar]
  67. Krivokapić, J. (2014). Gestural coordination at prosodic boundaries and its role for prosodic structure and speech planning processes. Philosophical Transactions of the Royal Society B, 369, 20130397. [Google Scholar] [CrossRef] [PubMed]
  68. Kuznetsova, A., Brockhoff, P. B., & Christensen, R. H. B. (2017). lmerTest package: Tests in linear mixed effects models. Journal of Statistical Software, 82(13), 1–26. [Google Scholar] [CrossRef]
  69. Ladd, D. R. (1983). Even, focus, and normal stress. Journal of Semantics, 2(2), 157–170. [Google Scholar] [CrossRef]
  70. Ladd, D. R. (1996). Intonational phonology. Cambridge University Press. [Google Scholar]
  71. Ladd, D. R. (2008). Intonational phonology (2nd ed.). Cambridge University Press. [Google Scholar]
  72. Lenth, R. V. (2024). emmeans: Estimated marginal means, aka least-squares means. Available online: https://CRAN.R-project.org/package=emmeans (accessed on 3 May 2025).
  73. Lindblom, B. (1990). Explaining phonetic variation: A sketch of the H&H theory. In W. J. Hardcastle, & A. Marchal (Eds.), Speech production and speech modelling (pp. 403–439). Springer. [Google Scholar] [CrossRef]
  74. Ludusan, B., Cristia, A., Martin, A., Mazuka, R., & Dupoux, E. (2016). Learnability of prosodic boundaries: Is infant-directed speech easier? The Journal of the Acoustical Society of America, 140(2), 1239–1250. [Google Scholar] [CrossRef]
  75. Maekawa, K., Kikuchi, H., Igarashi, Y., & Venditti, J. (2002, September 16–20). X-JToBI: An extended j-toBI for spontaneous speech. 7th International Conference on Spoken Language Processing (ICSLP 2002) (pp. 1545–1548), Denver, CO, USA. [Google Scholar] [CrossRef]
  76. Martin, A., Igarashi, Y., Jincho, N., & Mazuka, R. (2016). Utterances in infant-directed speech are shorter, not slower. Cognition, 156, 52–59. [Google Scholar] [CrossRef]
  77. Mazuka, R., Igarashi, Y., Martin, A., & Utsugi, A. (2015). Infant-directed speech as a window into the dynamic nature of phonology. Laboratory Phonology, 6(3–4), 281–303. [Google Scholar] [CrossRef]
  78. Nencheva, M. L., Piazza, E. A., & Lew-Williams, C. (2021). The moment-to-moment pitch dynamics of child-directed speech shape toddlers’ attention and learning. Developmental Science, 24(1), e12997. [Google Scholar] [CrossRef]
  79. Nespor, M., & Vogel, I. (1986). Prosodic phonology. Foris Publications. [Google Scholar]
  80. Papoušek, M., Bornstein, M. H., Nuzzo, C., Papoušek, H., & Symmes, D. (1990). Infant responses to prototypical melodic contours in parental speech. Infant Behavior and Development, 13(4), 539–545. [Google Scholar] [CrossRef]
  81. Passoni, E., de Leeuw, E., & Levon, E. (2022). Bilinguals produce pitch range differently in their two languages to convey social meaning. Language and Speech, 65(4), 1071–1095. [Google Scholar] [CrossRef]
  82. Patterson, D. (2000). Linguistic approach to pitch range modelling. Available online: https://era.ed.ac.uk/handle/1842/6746 (accessed on 2 September 2024).
  83. Pierrehumbert, J., & Hirschberg, J. (1990). The meaning of intonational contours in the interpretation of discourse. In P. Cohen, J. Morgan, & M. Pollack (Eds.), Intentions in Communication (pp. 271–311). MIT Press. [Google Scholar]
  84. Pierrehumbert, J. B. (1980). The phonology and phonetics of English intonation. Massachusetts Institute of Technology. [Google Scholar]
  85. R Core Team. (2024). R: A language and environment for statistical computing. R Foundation for Statistical Computing. Available online: https://www.R-project.org/ (accessed on 2 September 2024).
  86. Roach, P. J. (1989). Report on the 1989 Kiel convention: International phonetic association. Journal of the International Phonetic Association, 19(2), 67–80. [Google Scholar] [CrossRef]
  87. Selkirk, E. (1996). The prosodic structure of function words. In J. Morgan, & K. Demuth (Eds.), Signal to syntax: Bootstrapping from speech to grammar in early acquisition (pp. 187–213). Lawrence Erlbaum Associates. [Google Scholar]
  88. Selkirk, E. O. (1984). Phonology and syntax: The relationship between sound and structure. MIT Press. [Google Scholar]
  89. Sonderegger, M. (2023). Regression modeling for linguistic data. The MIT Press. [Google Scholar]
  90. Stern, D. N., Spieker, S., Barnett, R. K., & MacKain, K. (1983). The prosody of maternal speech: Infant age and context related changes. Journal of Child Language, 10, 1–15. [Google Scholar] [CrossRef]
  91. Stern, D. N., Spieker, S., & MacKain, K. (1982). Intonation contours as signals in maternal speech. Developmental Psychology, 18(5), 727–735. [Google Scholar] [CrossRef]
  92. Talkin, D. (2023). REAPER: Robust epoch and pitch estimator [C++]. Google. Available online: https://github.com/google/REAPER (accessed on 21 January 2025). (Original work published 2014).
  93. Thorson, J. C., Franklin, L. R., & Morgan, J. L. (2023). Role of pitch in toddler looking to new and given referents in American English. Language Learning and Development, 19(4), 458–479. [Google Scholar] [CrossRef] [PubMed]
  94. Thorson, J. C., & Morgan, J. L. (2014a, November 1–3). Directing toddler attention: Intonation and information structure. Supplement to the Proceedings of the 38th Annual Boston University Conference on Language Development, Boston, MA, USA. Available online: http://www.bu.edu/bucld/files/2014/04/thorson.pdf (accessed on 1 July 2024).
  95. Thorson, J. C., & Morgan, J. L. (2014b, May 20–23). The role of intonation in early word recognition and learning. Proceedings of Speech Prosody 2014 (pp. 1159–1163), Dublin, Ireland. Available online: https://www.isca-archive.org/speechprosody_2014/thorson14_speechprosody.html (accessed on 13 June 2024). [CrossRef]
  96. Thorson, J. C., & Morgan, J. L. (2015). Acoustic correlates of information structure in child and adult speech. In Proceedings of the 39th annual Boston university conference on language development. Cascadilla Press. Available online: http://www.bu.edu/bucld/files/2015/06/Thorson.pdf (accessed on 4 July 2020).
  97. Trainor, L. J., Austin, C. M., & Desjardins, R. N. (2000). Is infant-directed speech prosody a result of the vocal expression of emotion. Psychological Science, 11(3), 188–195. [Google Scholar] [CrossRef]
  98. Turk, A. E., & Shattuck-Hufnagel, S. (2007). Multiple targets of phrase-final lengthening in American English words. Journal of Phonetics, 35(4), 445–472. [Google Scholar] [CrossRef]
  99. Uther, M., Knoll, M. A., & Burnham, D. (2007). Do you speak E-NG-L-I-SH? A comparison of foreigner- and infant-directed speech. Speech Communication, 49(1), 2–7. [Google Scholar] [CrossRef]
  100. Venditti, J. J., Maekawa, K., & Beckman, M. E. (2008). Prominence marking in the Japanese intonation system. In S. Miyagawa, & M. Saito (Eds.), The Oxford handbook of Japanese linguistics (pp. 456–512). Oxford University Press. [Google Scholar]
  101. Vidal, E., Thollard, F., de la Higuera, C., Casacuberta, F., & Carrasco, R. C. (2005). Probabilistic finite-state machines, part II. IEEE Transactions on Pattern Analysis and Machine Intelligence, 27(7), 1026–1039. [Google Scholar] [CrossRef]
  102. Wang, Y., Seidl, A., & Cristia, A. (2016). Acoustic characteristics of infant-directed speech as a function of prosodic typology. In H. van der Hulst, J. Heinz, & R. Goedemans (Eds.), Dimensions of phonological stress (pp. 311–326). Cambridge University Press. [Google Scholar] [CrossRef]
  103. Werker, J. F., & McLeod, P. J. (1989). Infant preference for both male and female infant-directed talk: A developmental study of attentional and affective responsiveness. Canadian Journal of Psychology/Revue Canadienne de Psychologie, 43(2), 230–246. [Google Scholar] [CrossRef] [PubMed]
  104. Wickham, H. (2009). ggplot2: Elegant graphics for data analysis. Springer. [Google Scholar]
  105. Wickham, H., François, R., Henry, L., & Müller, K. (2019). dplyr: A Grammar of Data Manipulation. Available online: https://CRAN.R-project.org/package=dplyr (accessed on 14 July 2020).
  106. Wightman, C. W., Shattuck-Hufnagel, S., Ostendorf, M., & Price, P. J. (1992). Segmental durations in the vicinity of prosodic phrase boundaries. The Journal of the Acoustical Society of America, 91, 1707–1717. [Google Scholar] [CrossRef] [PubMed]
  107. Winter, B. (2019). Statistics for linguists: An introduction using R. Routledge. [Google Scholar] [CrossRef]
  108. Yamamoto, R., Rodionov, A., & Michalek, J. (2025). r9y9/pyreaper: V0.0.11 (Version v0.0.11) [Computer software]. Zenodo. [CrossRef]
Figure 1. A finite state automaton representing a simplified intonational grammar for Bengali (Khan, 2008, 2014). Licit sequences must begin at the start state “0” (the thickly outlined circle) and terminate at the final state “IP” (doubly outlined circle).
Languages 11 00068 g001
Figure 2. F0 contour, waveform, spectrogram, and intonational transcription for examples from Bengali Speaker f01 of the beginning of the story: (a) read speech; (b) simulated IDS speech. International Phonetic Alphabet (IPA) transcriptions of the Bengali words are provided.
Languages 11 00068 g002
Figure 3. Prosodic structure of Bengali examples in Figure 2, based on intonational transcription: (a) read speech, Figure 2a; (b) simulated IDS speech, Figure 2b. IPA transcriptions of the Bengali words are provided, as in Figure 2.
Languages 11 00068 g003
Figure 4. Finite state automaton diagram representing the grammar of licit sequences of tonal events proposed in the MAE_ToBI model of American English intonation (collapsing over tonal labels with downsteps other than H+!H*; see Appendix A.1). Licit sequences must begin at the start state, marked with a thickly outlined circle (“0”), and terminate at the final state “IP”, marked with a doubly outlined circle. We use “T*” in two places to represent the set of five pitch accent arcs shown from State “0” to State “PA” to keep the diagram from getting too cluttered.
Languages 11 00068 g004
Figure 5. Subsection of B-ToBI FSA generating licit AP sequences for APs that are neither ip- nor IP-final: (a) only the most common sequence, “L* Ha”; (b) all possible sequences (but see Note 9), irrespective of their expected frequency; (c) all possible sequences, with estimated conditional probabilities of each tonal choice computed from the non-IDS corpus. Since we are looking at only AP melodies, we define the final state as the state reached after generating the AP boundary tone.
Languages 11 00068 g005
Figure 6. (a) Conditional probability chart of most likely Bengali intonational melody tonal sequences based on estimated B-ToBI grammars for non-IDS and IDS. It covers only sequences initiated with an L* and containing no other pitch accents (such melodies are 83% likely in non-IDS and 74% likely in IDS). Probabilities for non-IDS are shown above the horizontal lines and probabilities for IDS below. Bolded lines indicate where the likelihood of a tonal choice is higher in IDS. (b) Probability distribution over pitch accents in IP-final vs. non-final position in IDS estimated from B-ToBI FSA, plotted on a log scale. The same pattern of results occurs in non-IDS.
Languages 11 00068 g006
Figure 7. B-ToBI FSA entropy comparisons for pitch accent (left panel) and boundary tone (right panel) choice points for IP-final vs. non-final APs, in IDS (blue) vs. non-IDS (red). IP-final AP choice points stand out as being the least predictable (highest entropy) across positions and speech styles. Dotted lines are drawn to help with the visualization of changes due to IP-finality.
Languages 11 00068 g007
Figure 8. Estimated probability of IP final nuclear tunes (IP-final pitch accent followed by ip boundary tone and IP boundary tone) in English across speech styles, for nuclear tunes with probability > 5%.
Languages 11 00068 g008
Figure 9. MAE-ToBI FSA entropy comparisons for pitch accent (left panel) and boundary tone (right panel) choice points for IP-final vs. non-final ips and IDS (blue) vs. non-IDS (red). Pitch accent choice stands out as being the least predictable (highest entropy) across positions and speech styles. Dotted lines are drawn to help with the visualization of changes due to IP-finality.
Languages 11 00068 g009
Figure 10. Distribution of number of smaller units in IPs in corpus for IDS vs. non-IDS (total IPs: 1367 in Bengali, 955 in English): (a) number of ips in IPs in IDS vs. non-IDS in Bengali; (b) number of ips in IPs in IDS vs. non-IDS in English; (c) number of APs in IPs in IDS vs. non-IDS in Bengali.
Languages 11 00068 g010
Figure 11. Smoothed density plots of the number of IP-final vs. non-final: (a) APs uttered in a story repetition in Bengali; (b) ips uttered in a story repetition in English.
Languages 11 00068 g011
Figure 12. Visualization of relative effect size: exponentiated coefficient estimates (eβ) for regression models of word-final syllable durations, with 95% CIs. These are multiplicative factors, so a CI overlapping with 1 indicates a nonsignificant effect: (a) Bengali model, excluding influential Speaker f01—see Table 9; (b) English model—see Table 10.
Languages 11 00068 g012
Figure 13. Sample F0 contours, waveforms, spectrograms, and intonational transcriptions for English Speaker m05 of the first sentence in the story: (a) non-IDS, (b) IDS. (While other speakers also expanded F0 range in IDS, this speaker was an outlier for the extreme degree of expansion).
Languages 11 00068 g013
Figure 14. Distribution of F0 range (in semitones) in the smallest prosodic constituents of each language for each speaker in IDS (blue) vs. non-IDS (red), split by IP-final vs. non-final position. Smoothed density plots with F0 values trimmed to R96 (2–98%): (a) Bengali APs; (b) English ips.
Languages 11 00068 g014
Table 1. Predictions for hypotheses about intonational exaggeration as a consequence of phonological choices for Bengali and English. “Atomic chunk” in the table refers to the smallest intonational constituent in the language’s intonational grammar: APs in Bengali and ips in English.
HypothesisEffect of Speech Style on Phonological Category Choice Effect of Phonological Category Choice on Phonetic Implementation
Phrase-finalityStyle:IP-finality interaction: Increased likelihood of atomic chunks to be IP-final in IDS relative to non-IDSANDMain effect of IP-finality: Lengthening, f0 range expansion in IP-fin. atomic chunks (independent of Style)
Predictability (Updated in Section 3)Increased likelihood of most unpredictable regions in IDS relative to non-IDS ANDMain effect of Predictability: Lengthening, f0 range expansion in most unpredictable regions (independent of Style)
Pragmatic RestrictionNo Style:IP-finality interaction, i.e., no difference in likelihood of IP-final vs. non-final atomic chunks in IDS from non-IDS ORNo Style:IP-finality interaction for lengthening, f0 range expansion in atomic chunks
Table 2. Predictions for hypotheses about intonational exaggeration as a consequence of phonological choices for Bengali and English. “Atomic chunk” in the table refers to APs in Bengali and ips in English. (Predictability Hypothesis updated from Table 1).
HypothesisEffect of Speech Style on Phonological Category Choice Effect of Phonological Category Choice on Phonetic Implementation
Phrase-finalityStyle:IP-finality interaction: Increased likelihood of atomic chunks to be IP-final in IDS relative to non-IDSANDMain effect of IP-finality: Lengthening, f0 range expansion in IP-final atomic chunks (independent of Style)
Predictability
(Bengali)
same as Phrase-finality HypothesisANDsame as Phrase-finality Hypothesis
Predictability (English)Main effect of Style: Increased likelihood of pitch accent on a word in IDSANDMain effect of Accent: Lengthening and f0 range expansion in accented words
Pragmatic RestrictionNo Style:IP-finality interaction, i.e., no difference in likelihood of IP-final vs. non-final atomic chunks in IDS from non-IDS ORNo Style:IP-finality interaction for lengthening, f0 range expansion in atomic chunks
Table 3. Mean (and standard deviation of) number of phrases of different types in a story repetition, averaged across speakers and repetitions.
Total Number in Story: Mean (SD)BengaliEnglish
Non-IDSIDSNon-IDSIDS
APs67 (6)60 (9)N/A N/A
ips26 (6)32 (8)27 (4)30 (5)
IPs18 (5)27 (8)14 (2)18 (4)
Utt-200s12 (6)20 (10)12 (4)15 (5)
Utt-300s9 (6)15 (10)11 (3)13 (4)
The total number of APs in English non-IDS and IDS is marked as N/A since there is no AP level of phrasing in MAE-ToBI, the phonological analysis of American English intonation assumed here; see Section 1.2.1.
Table 4. Summary of results from mixed effects Poisson regressions for Style on the number of APs, ips, IPs, and utterances in the story for Bengali.
Constituent TypeβSE(β)zpeβ Marg. R2Cond. R2
AP−0.110.03−3.41<0.0010.900.150.34
ip0.190.053.97<0.0011.210.150.57
IP0.400.066.60<0.0011.500.390.66
Utt-2000.470.095.34<0.0011.600.460.74
Utt-3000.550.115.08<0.0011.740.440.77
Table 5. Summary of results from mixed effects Poisson regressions for Style on the number of ips, IPs, and utterances in the story for English.
Constituent TypeβSE(β)zpeβMarg. R2Cond. R2
ip0.120.052.420.0161.130.140.32
IP0.280.074.32<0.0011.330.300.34
Utt-2000.240.073.36<0.0011.270.090.53
Utt-3000.200.072.700.0071.230.090.39
Table 6. Fixed effects and model fit for number of IP-final/non-final APs across styles in Bengali.
CoefficientβSE(β)zpeβ
Intercept3.380.03106.55<0.00129.5 APs
Style0.0040.030.1160.911.00
IP-finality−0.630.10−6.49<0.0010.53
Gender0.0150.060.260.801.02
Repetition (lin)0.0090.030.310.751.01
Repetition (quad.)−0.030.03−1.170.240.97
Style:IP-finality0.780.0711.31<0.0012.18
N: 120; groups: speaker, 10. Marginal R2 = 0.71, conditional = 0.85. Formula: num.ap ~ style * bigip.fin + gender + rep.order + (1 + bigip.fin | speaker).
Table 7. Fixed effects and model fit for number of IP-final/non-final ips across styles in English.
CoefficientβSE(β)zpeβ
Intercept2.620.0459.44<0.00113.7 ips
Style0.100.0952.04<0.0411.11
IP-finality0.280.112.600.0091.32
Gender0.160.062.530.0111.17
Repetition (lin)−0.010.04−0.270.790.99
Repetition (quad.)0.0040.040.090.931.00
Style:IP-finality0.360.103.70<0.0011.44
N: 120; groups: speaker, 10. Marginal R2 = 0.26, adjusted = 0.51. Formula: num.ip ~ style * bigip.fin + gender + rep.order + (1 + bigip.fin | speaker).
Table 8. Summary of post hoc tests for interaction between Style and IP-finality from Poisson regressions on counts of IP-final vs. non-final Bengali APs and English ips in non-IDS and IDS.
(df = 9 for All Contrasts)Post Hoc Tests for Bengali APsPost Hoc Tests for English ips
StyleContrastβSE(β)zadj. pβSE(β)zadj. p
Non-IDSIP-fin–non-final−1.020.10−9.85<0.0010.070.110.570.94
IDSIP-fin–non-final−0.240.10−2.330.090.430.113.84<0.001
Non-finalIDS–non-IDS−0.390.04−9.44<0.001−0.080.07−1.100.69
IP-finalIDS–non-IDS0.390.067.10<0.0010.280.064.32<0.001
Table 9. Bengali: Fixed effects and model fit for log word-final syllable duration, conditioned on prosodic structure, refit without influential Speaker f01.
CoefficientβSE(β)tdfpeβChange (ms)
Intercept5.290.03180.0017.00<0.001198.7 msN/A
Style0.0640.023.3112.310.0061.0713.1
Position (AP.final)0.0800.025.108.85<0.0011.0816.6
Position (ip.final)0.240.0210.346.86<0.0011.2753.5
Position (IP.final)0.390.0217.846.24<0.0011.4793.5
Accent0.0660.0096.712641.00<0.0011.075.1
Word Length (syll)−0.520.04−11.5763.08<0.0010.60−80.3
Word Length (phones)0.380.058.4362.42<0.0011.4692.2
Gender0.0250.050.557.000.601.035.1
Rep. (lin)−0.0220.003−6.485362.00<0.0010.98−4.3
Rep. (quad)−0.0030.003−0.905363.000.371.00−0.6
Style: Position (AP.fin)0.0310.012.211902.000.0271.036.3
Style: Position (ip.final)0.0580.022.613152.000.0091.0611.8
Style: Position (IP.final)0.0390.022.364642.100.0191.047.9
Style:Accent0.0300.021.941075.000.0531.036.0
N: 5615; groups: word, 77; speaker, 9. VIFs for length: 2.9. Marginal R2 = 0.39, cond. = 0.76. Formula: log.fin.syll.dur ~ style * position + accent + style:accent + gender + rep.order + n.syll + n.phones + (1 + style | speaker) + (1 + style + position | word).
Table 11. Bengali: Fixed effects and model fit for range in semitones over APs (R96).
CoefficientβSE(β)tdfp
Intercept11.490.9512.1010.73<0.001
Style2.370.643.709.080.005
IP-finality3.420.764.519.200.001
Gender1.861.221.537.990.17
Repetition (lin)0.380.142.663767.530.008
Repetition (quad.)−0.190.14−1.353767.800.18
Style:IP-finality1.070.362.993780.450.003
N: 3797; groups: speaker, 10; final tone, 11. Marginal R2 = 0.14, conditional = 0.38. Formula: range.st ~ style * bigip.fin + gender + rep.order + (1 + style | speaker) + (1 | final.tone).
Table 12. Fixed effects and model fit for range in semitones over ips in English (R96).
CoefficientβSE(β)tdfp
Intercept13.730.5525.1314.00<0.001
Style1.650.453.689.590.005
IP-finality3.130.843.747.700.006
Gender2.390.753.198.140.012
Repetition (lin)−0.180.22−0.811667.530.42
Repetition (quad.)0.020.220.081666.270.83
Style:IP-finality0.370.530.691672.020.49
N: 1692; groups: speaker, 10; final tone, 9. Marginal R2 = 0.14, conditional = 0.22. Formula: range.st ~ style * bigip.fin + gender + rep.order + (1 + style | speaker) + (1 | final.tone).
Table 13. Results of testing predictions for hypotheses about intonational exaggeration as a consequence of phonological choices for Bengali and English. “Atomic chunk” in the table refers to APs in Bengali and ips in English. The hypothesis was supported where a “✓” appears; the hypothesis was not supported where “X” appears.
HypothesisPrediction: Effect of Style on Phonological Category ChoiceLanguagePrediction: Effect of Category Choice on Phonetic ImplementationBengali English
Ben.Eng.Len.F0Len.F0
Phrase-finalityStyle:IP-finality interaction: Increased likelihood of atomic chunks to be IP-final in IDS relative to non-IDSMain effect: IP-final lengthening/F0 range expansion
Predictability
(Bengali)
same as Phrase-finality HypothesisN/Asame as Phrase-finality HypothesisN/A
Predictability (English)Main effect of Style on Accent: Increased likelihood of pitch accent on a word in IDSN/AXMain effect: Accent-driven lengthening and f0 range expansionN/AN/A
Pragmatic RestrictionNo Style:IP-fin interaction: No change in likelihood of IP-final vs. non-final atomic chunks in IDS, relative to non-IDSXXNo Style:IP-finality interaction for length or F0 rangeXX
Disclaimer/Publisher’s Note: The statements, opinions and data contained in all publications are solely those of the individual author(s) and contributor(s) and not of MDPI and/or the editor(s). MDPI and/or the editor(s) disclaim responsibility for any injury to people or property resulting from any ideas, methods, instructions or products referred to in the content.